Apical constriction requires patterned apical surface remodeling to synchronize cellular deformation
- Laboratory for Morphogenetic Signaling, RIKEN Center for Biosystems Dynamics Research, Japan
- Graduate School of Arts and Sciences, The University of Tokyo, Japan
- Université Paris Cité, CNRS, MSC, France
Figures
Figure 1 with 1 supplement
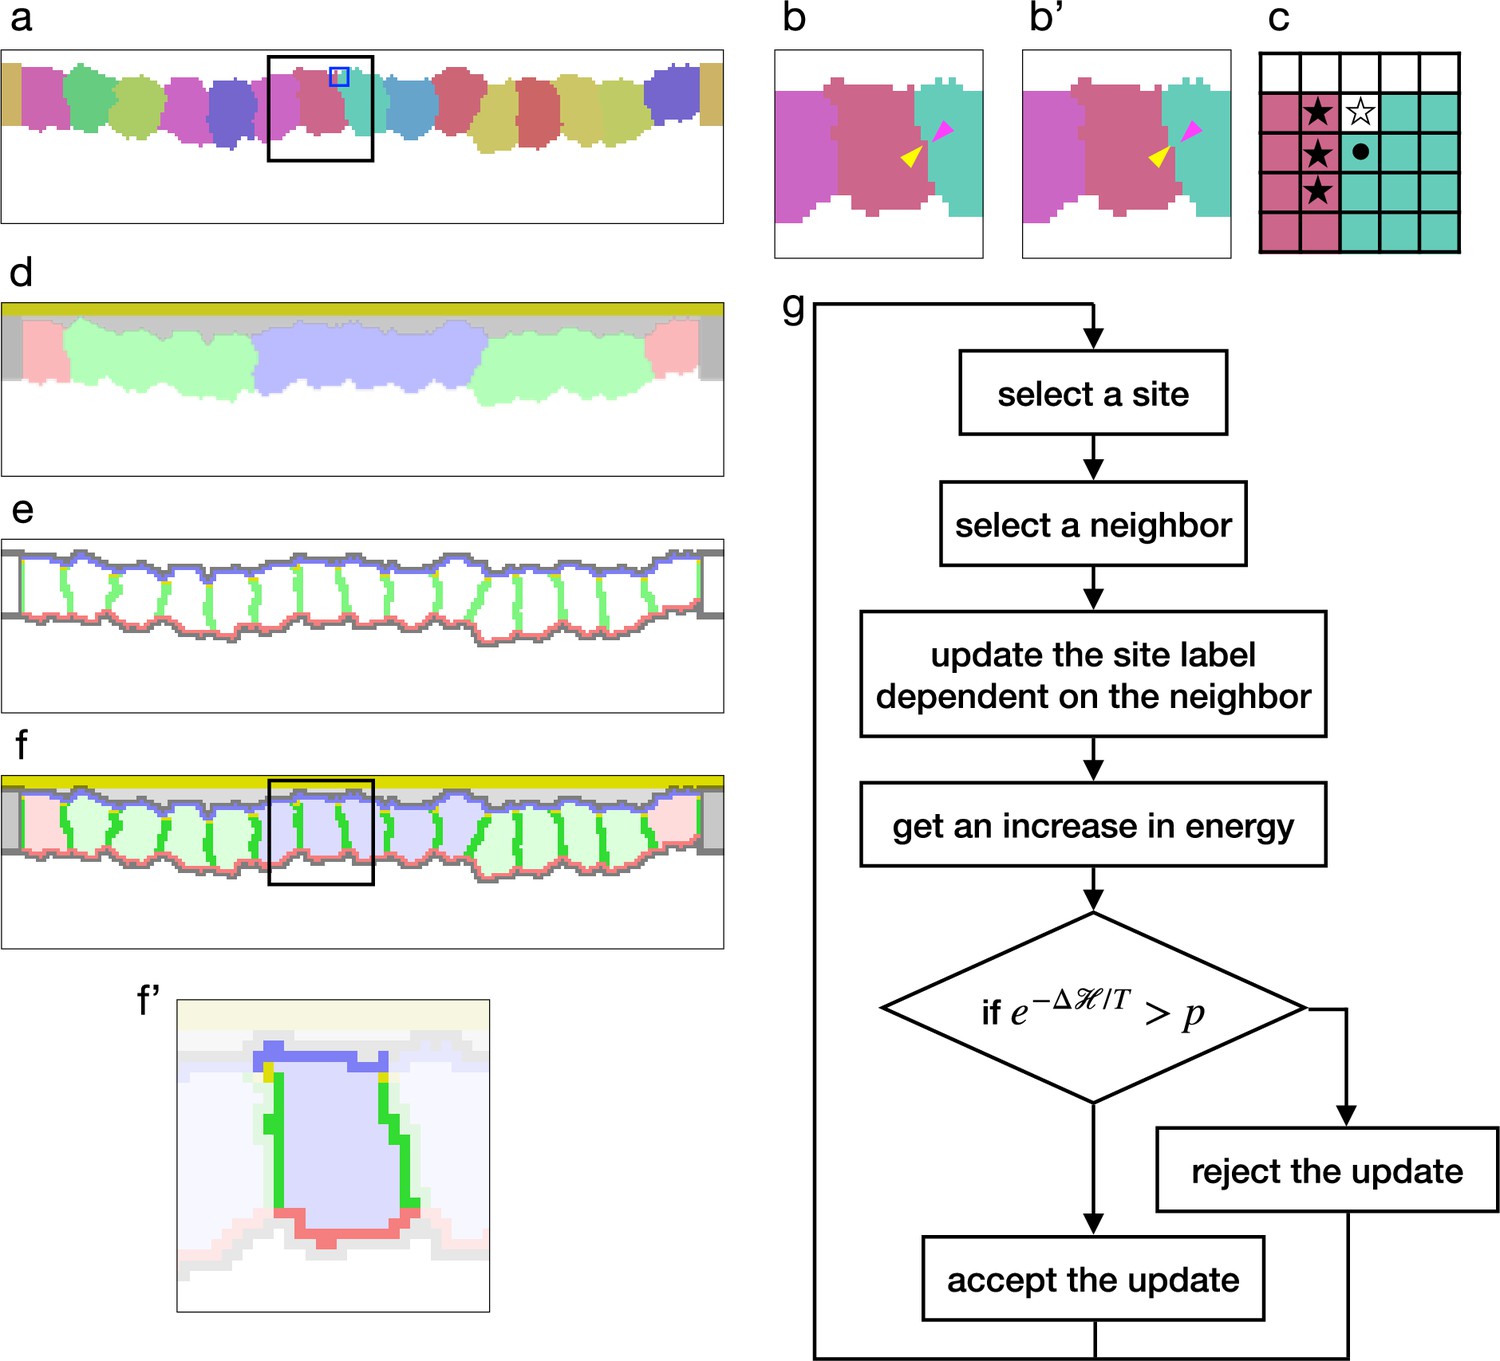
Cellular Potts model for an epithelial tissue.
(a) Cells representation in the cellular Potts model. The cells were colored differently, and a white space represents the medium. (b, b') An update of a label from (b) to (b'). The panels show an area inside a black line in (a). The label on a randomly selected site (yellow arrowhead) was replaced with one on a randomly selected neighboring site (magenta arrowhead). (c) Neighborhood of a site for the contact energy. The panel shows an area inside a blue line in (a). A site marked with a circle is adjacent to three sites in a different cell (black star) and a site in the medium (white star). (d) Material labels in the model. Four types of cytosol are colored blue, green, red, and dark gray. Inner and outer body fluid are colored white and light gray, and the apical extracellular matrix (ECM) is colored dark yellow. (e) Cell polarity markings. The apical, basal, lateral, and non-polarized surfaces are colored blue, red, green, and gray, respectively. The adherens junction is colored yellow. (f, f') Tissue and cell representations in our model. The panel (f') shows an area inside a black line in (f), and lightens an area around a cell. In (f'), the cytosol was drawn with pale blue, the cell apical, lateral, and basal surfaces were drawn with blue, green, and red, and the apical lateral sites where the adherens junction localized were colored yellow. (g) Algorithm of the cellular Potts model simulation.
Figure 1—figure supplement 1
Epithelial cell surface tension and tissue integrity.
The energy included the terms of surface contact energy and area constraint. The constant represents a target average area of cells in the simulation. The ratio indicates how much the cells are compressed, and thus how strong the surface tension is. Here the lateral surface tension was defined by the contact energy between the cytosols in different cells, the basal surface tension was defined by the contact energy between the cytosol and the inner body fluid, and the apical surface tension was defined by the contact energy between the cytosol and the apical ECM or the outer body fluid. The lateral surface tension was determined based on the compression . The vertical axis indicates a ratio between the basal and apical surface contact energy and the lateral surface contact energy .
Figure 2 with 1 supplement
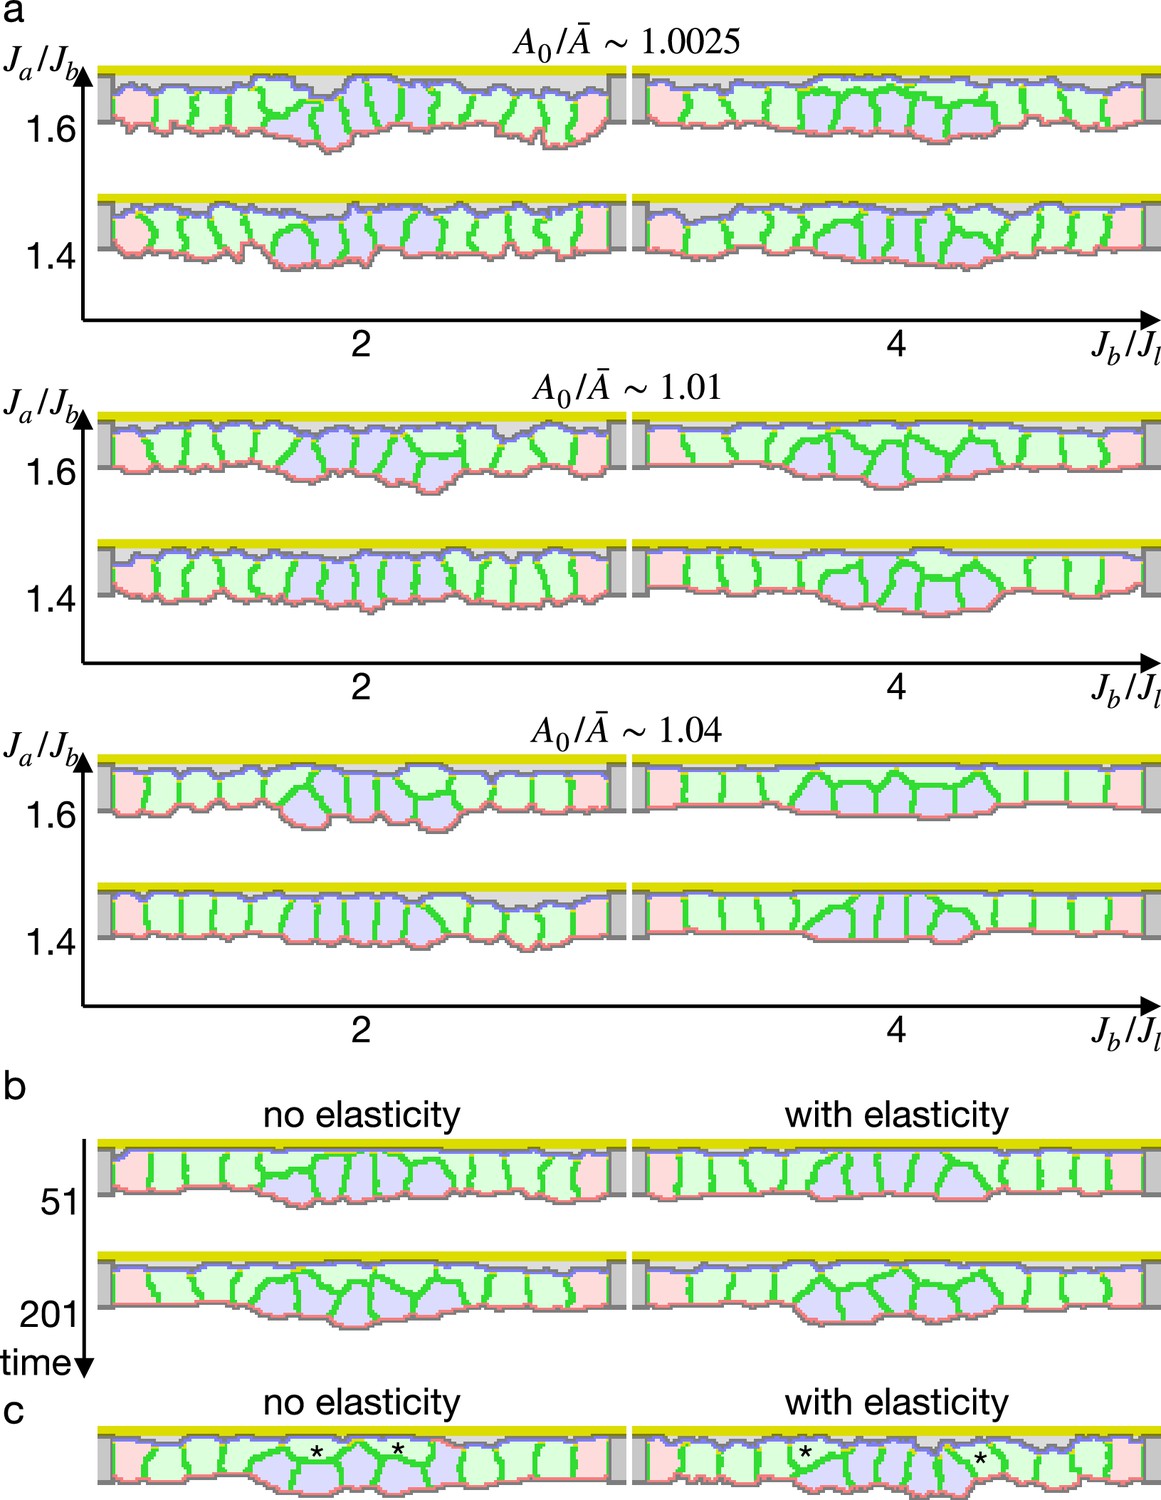
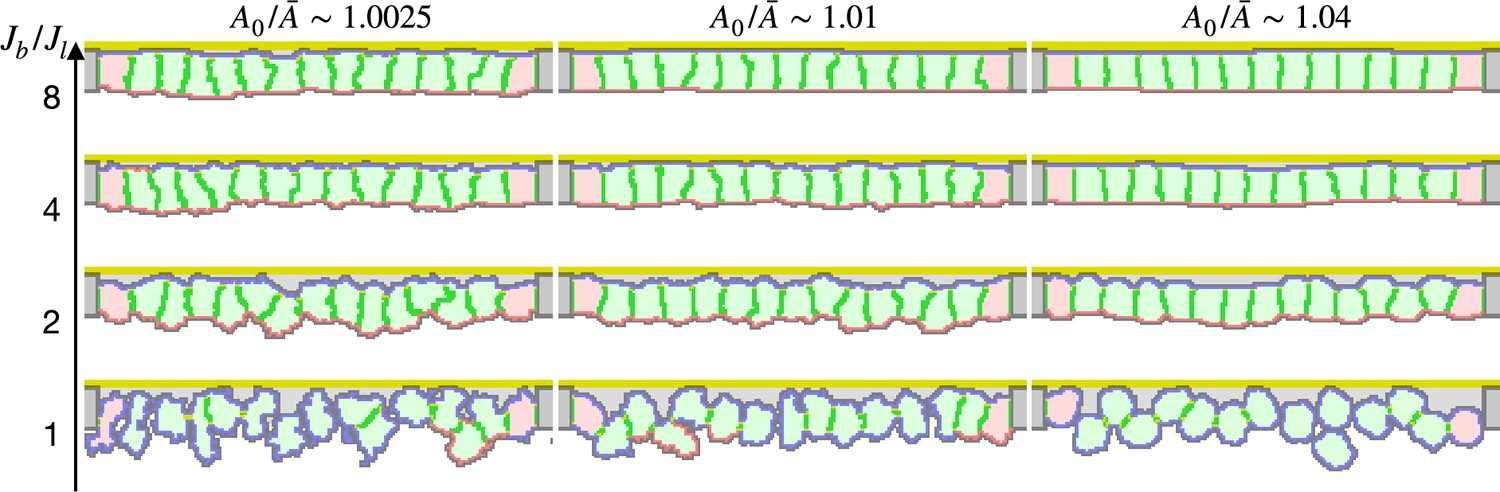
Simulations of epithelial tissue with the increased contractility.
(a) The ratio indicates how much cells were apico-basally compressed by the lateral cell-cell junction contractility . The horizontal axis indicates a ratio between the basal surface and lateral cell-cell junction contractilities. The vertical axis indicates a ratio between the apical and basal surface contractilities in center pale blue five cells. The other surrounding pale red and green cells were assigned the apical surface contractility equal to the basal surface contractility. (b) Simulations w/o the surface elasticity, where , , and . The vertical axis represents time (1 time/1000 updates). (c) Simulations of the supracellular myosin cable. Cells marked with an asterisk were assigned a potential energy on their adherens junction so that they were pulled toward the midline. and .
Figure 2—video 1
Simulation of epithelial tissue with the increased contractility.
The center pale blue five cells were assigned the increased apical surface contractility: , , and , where indicates how much cells were apico-basally compressed by the lateral surface contractility , represents a ratio between the basal and lateral surface contractilities, and represents a ratio between the apical and basal surface contractilities in center pale blue five cells. There were 1000 updates between frames.
Figure 3
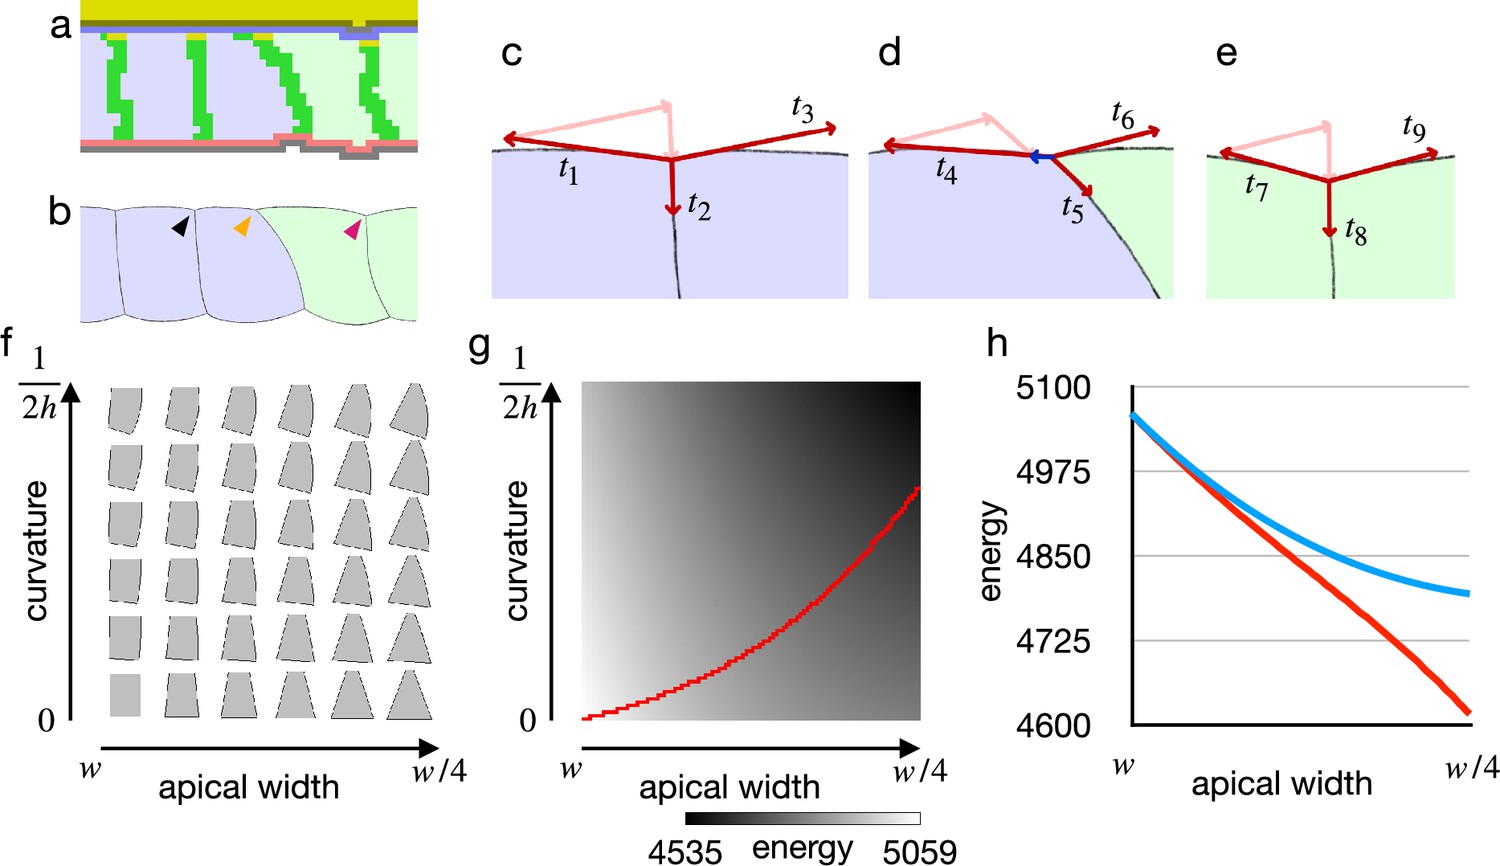
Cell shape and practical force to constrict the apical surface.
(a) The edge cell at the early phase of the cellular Potts model simulation with the increased apical surface contractility. (b) Illustration of the edge cell. (c–e) Illustration of surface contractilities around the cell-cell junction. (c) Shows a junction marked by the black arrowhead in (b). (d) Shows a junction marked by the orange arrowhead in (b). (e) Shows a junction marked by the magenta arrowhead in (b). Vectors - depict the surface contractilities exerted on the junctions. Pale pink arrows in (c) are the same vectors with and , those in (d) are the same with and , and those in (e) are the same with and . Blue arrow in (d) depicts a sum of , , and . (f) Phase diagram of cell shapes. For the apical width and a curvature of the right-side lateral surface, the energy of the cell is at minimum with the shape. The pressure and the surface contractility were set so that the cell took the columnar shape for the apical width , apical-basal height , and 0 curvature. (g) Energy landscape of the cell shapes for the apical width and the lateral curvature. Red line shows a path following a gradient of the energy. (h) Plots of energy with respect to the apical width. Blue plot shows the energy when the lateral surface was restricted to be straight. Red plot shows the energy along the path in (e).
Figure 4 with 2 supplements
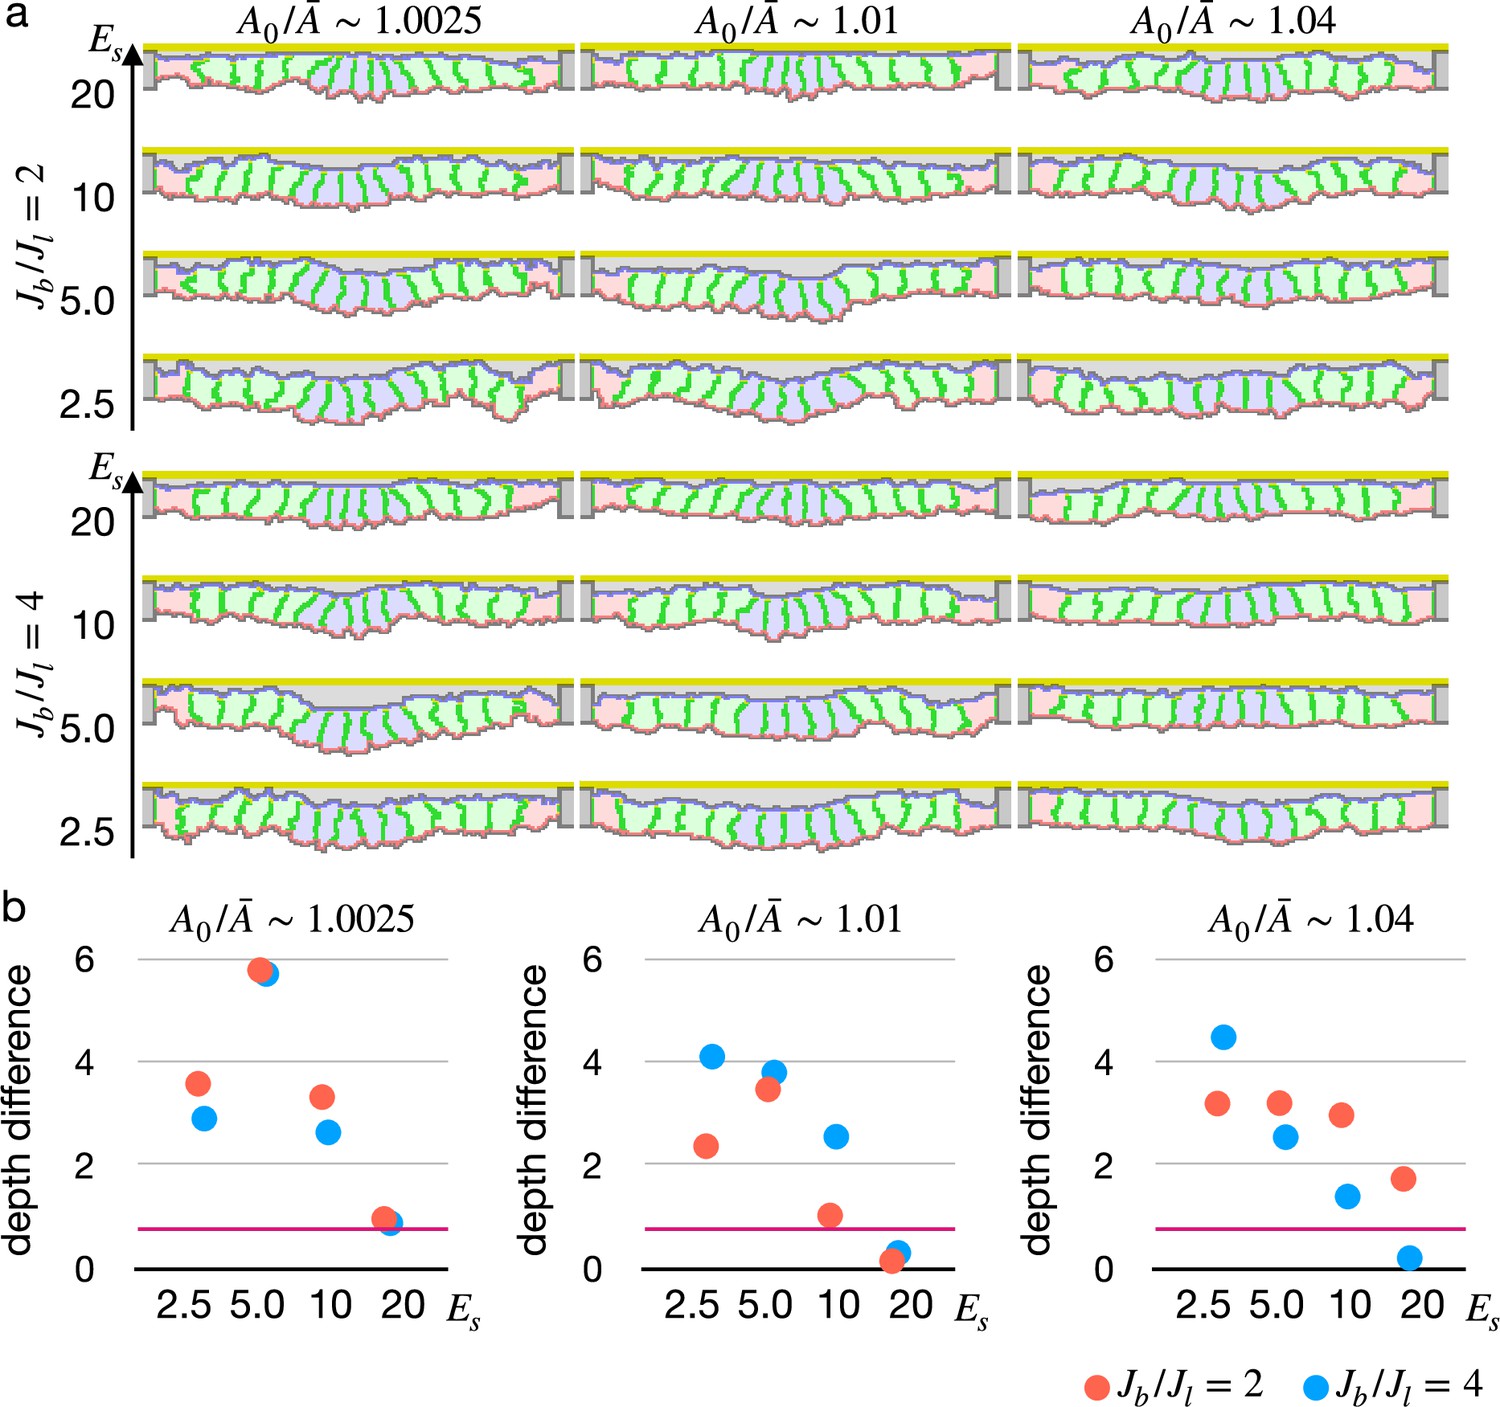
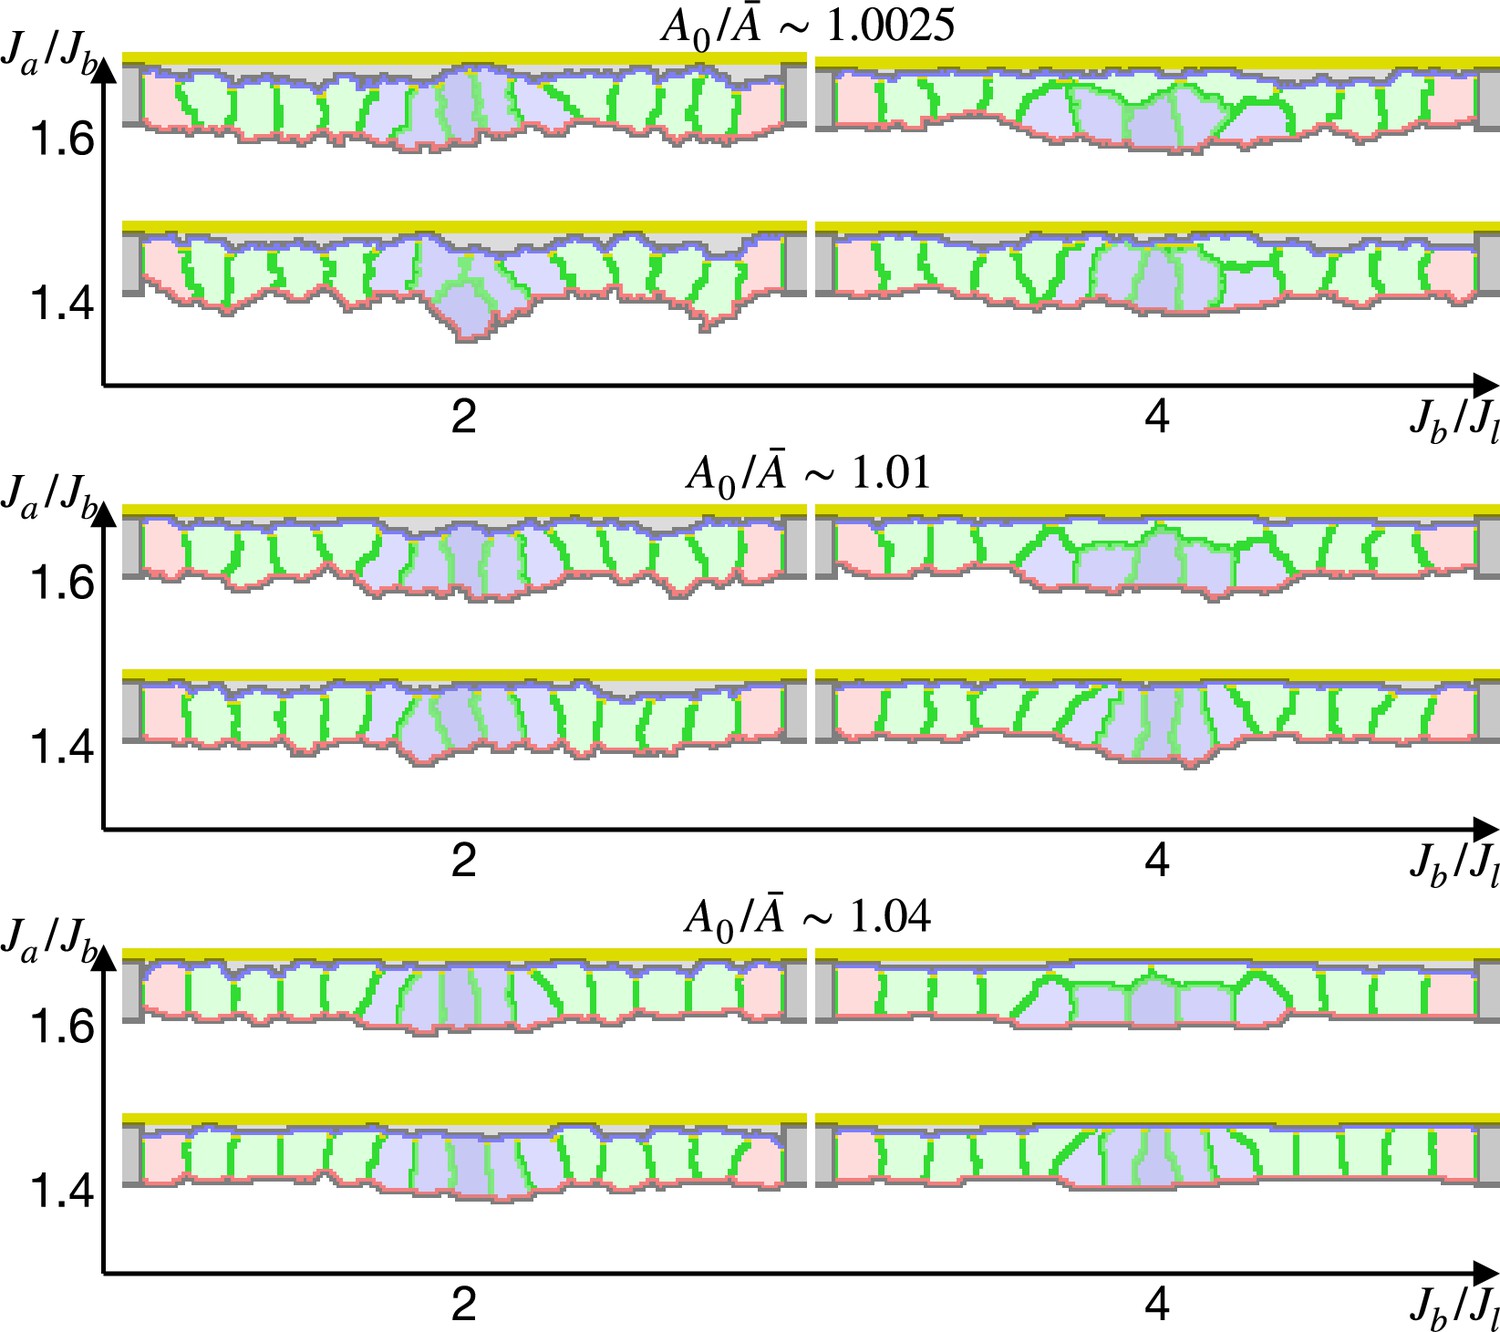
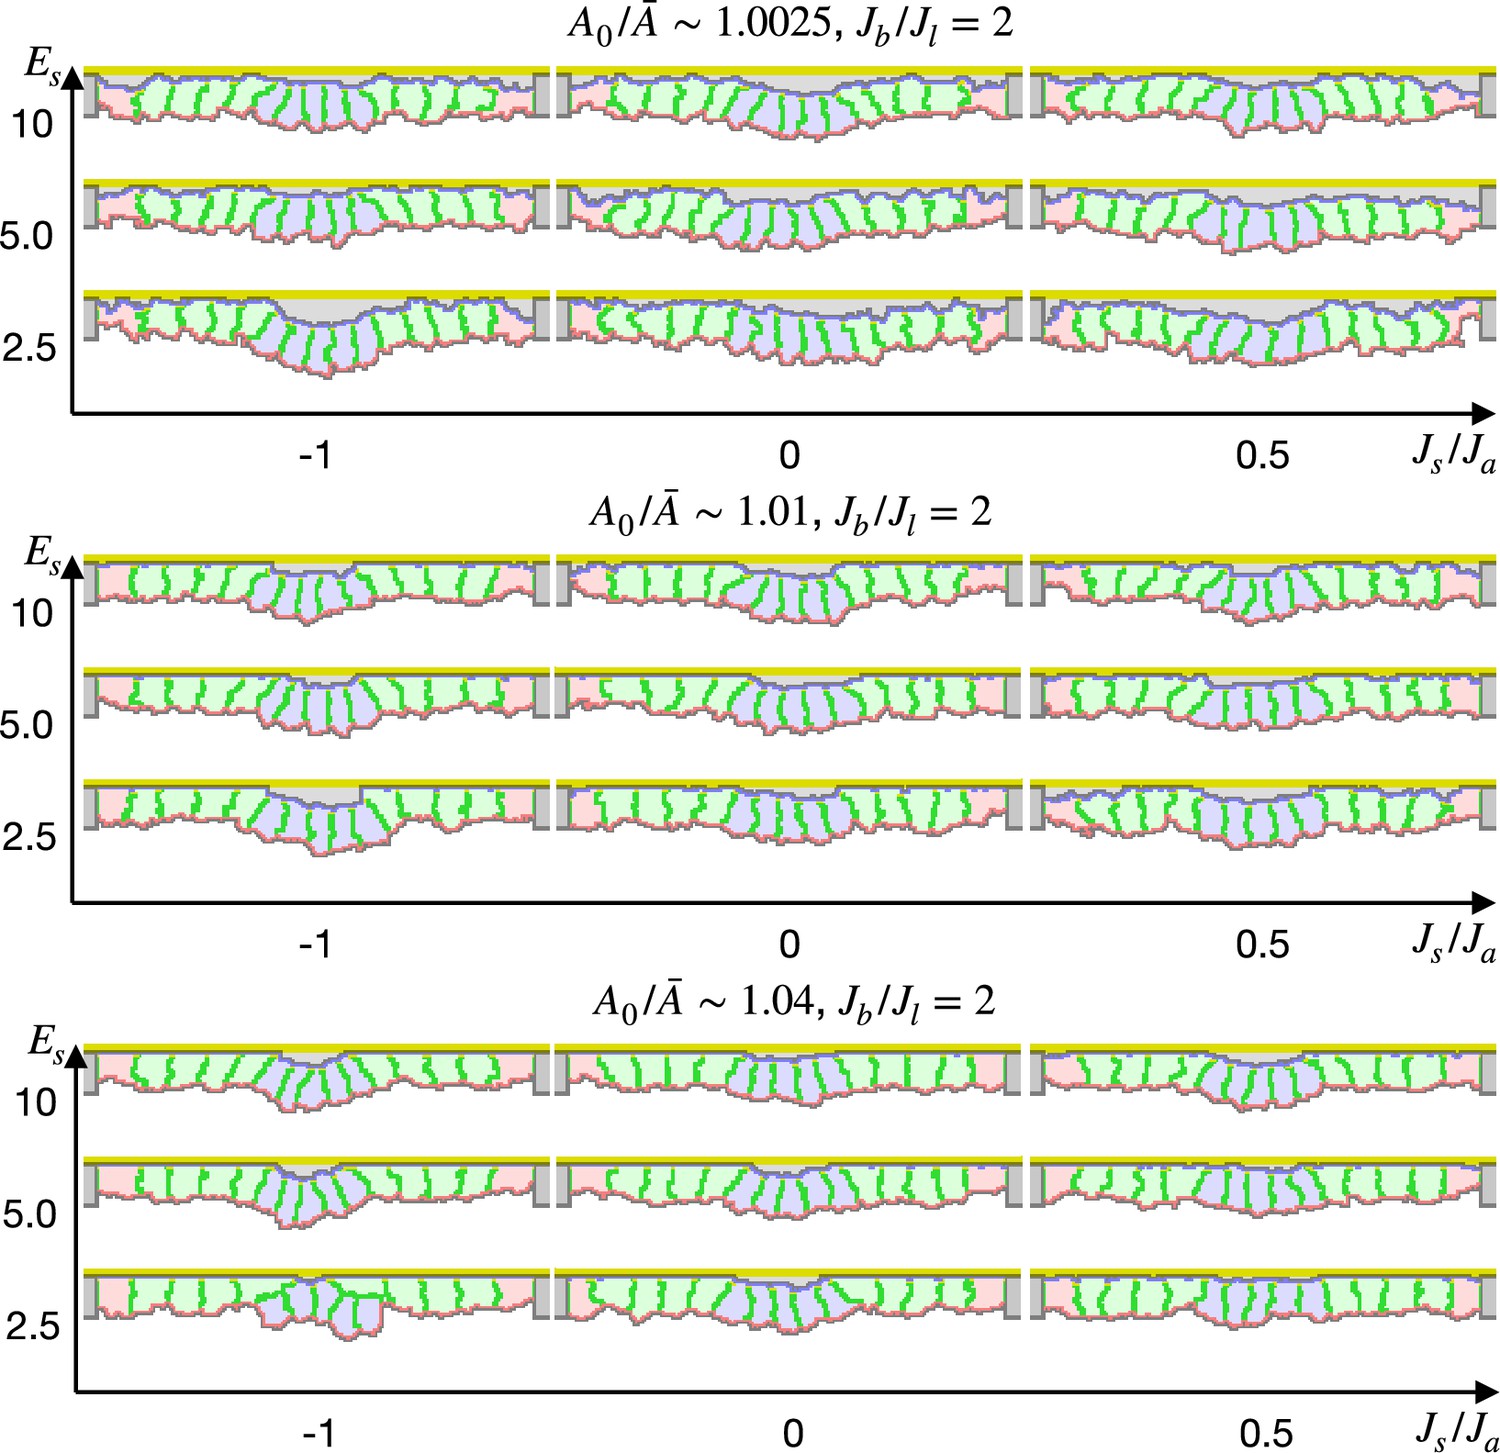
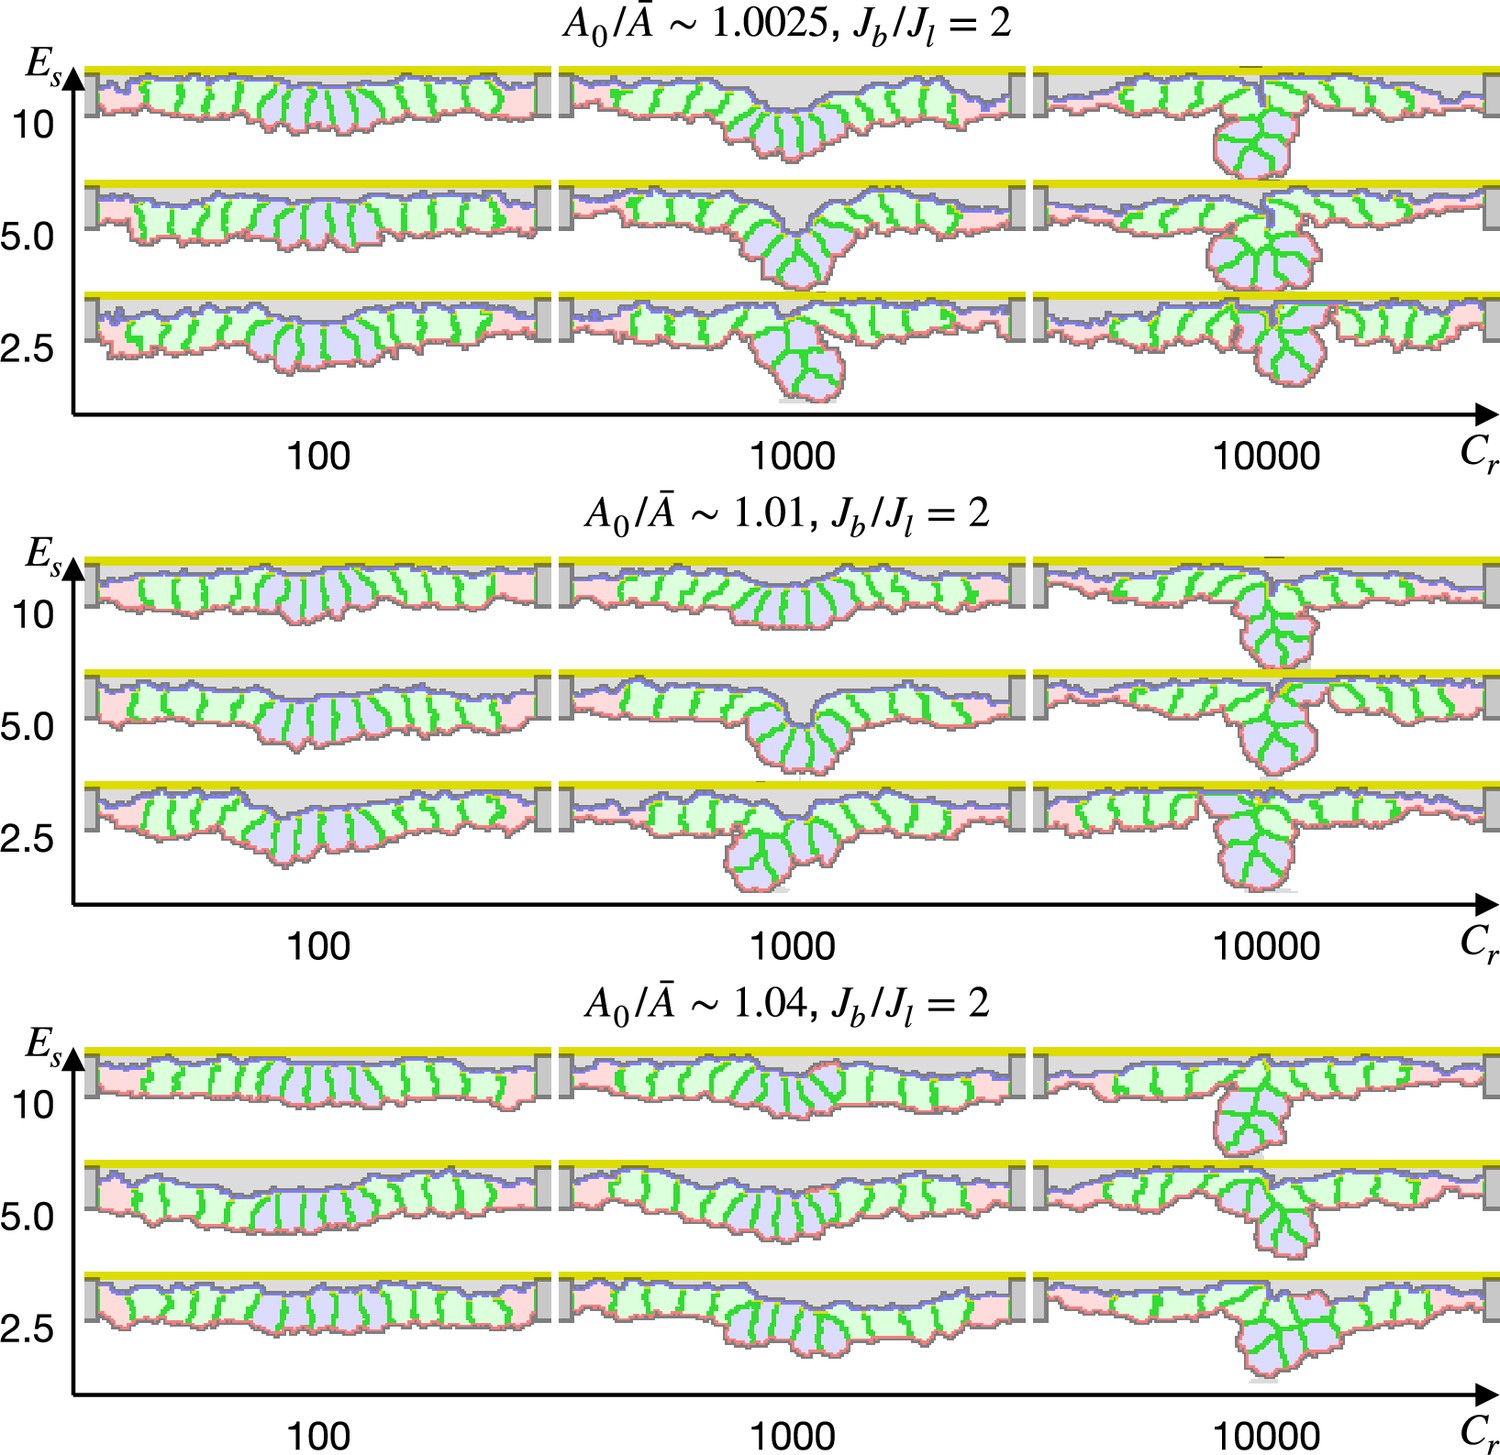
Simulations of epithelial tissue with the modified surface elasticity.
(a) Results of the simulations. The center pale blue five cells were assigned , while the others were assigned equivalent to initial value. The ratio indicates how much cells were compressed, indicates a ratio between the basal surface and lateral cell-cell junction contractility, and denotes the surface elastic modulus for the inner pale blue and green 13 cells. The edge pale red cells were assigned 0.1 times smaller surface elastic modulus than the inner cells. (b) Plots showing difference in distance from the apical extracellular matrix (ECM) between the constricting cells and the surrounding cells. Average distances were compared, and a larger difference indicates a deeper invagination. Magenta horizontal lines indicate 0.73, an average difference between the center cells and surrounding cells when all of the cells were assigned equivalent to the initial value, as a control. Results of three simulations were averaged.
Figure 4—figure supplement 1
Simulation of epithelial tissue with the gradient contractility.
The ratio indicates how much cells were compressed, indicates a ratio between the basal and lateral surface contractility, and indicates a ratio between apical and basal surface contractilities in edge pale blue cells. Darker blue cells were assigned higher apical surface contractility.
Figure 4—video 1
Simulation of epithelial tissue with the decreased elastic reference value.
The center pale blue five cells were assigned a decreased apical surface elastic reference value . The cells were assigned and , and the inner pale blue and green cells were assigned while the edge pale red cells were assigned . There were 10,000 updates between frames.
Figure 5 with 2 supplements
Simulation of apical constriction with the supracellular myosin cable.
The center pale blue five cells were assigned , and the siding pale green two cells adjacent to the center pale blue cells were assigned the potential energy on their adherens junction so that they were pulled toward the midline. The magnitude indicates a gradient of the potential energy, indicates how much cells were compressed, indicates a ratio between the basal and lateral cell-cell junction contractility, and denotes the surface elastic modulus for the inner pale blue and green 13 cells. The edge pale red cells were assigned 0.1 times smaller surface elastic modulus than the inner cells.
Figure 5—figure supplement 1
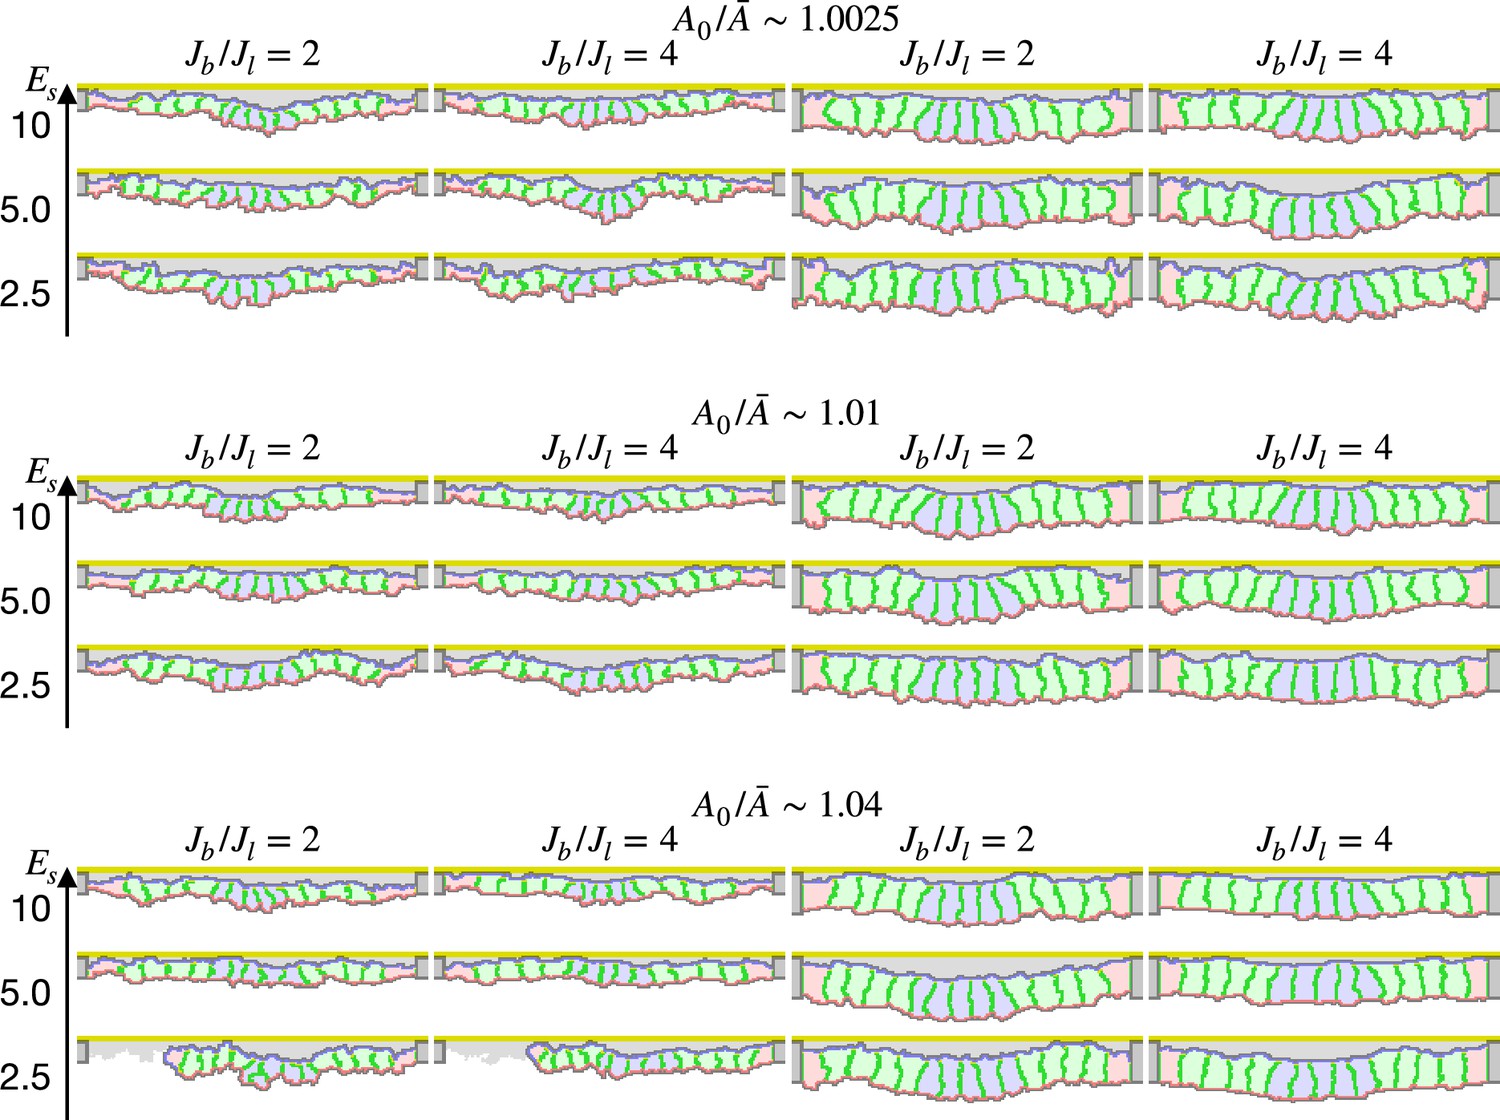
Simulation of apical constriction with various cell heights.
The cells were 2/3 lower (first and second columns) or 4/3 higher (third and fourth columns) in the apical-basal axis. The ratio indicates how much cells were compressed, indicates a ratio between the basal and lateral surface contractility, and denotes the surface elastic modulus for the inner pale blue and green 13 cells. The edge pale red cells were assigned 0.1 times smaller surface elastic modulus than the inner cells. The center pale blue five cells were assigned , while the others were assigned equivalent to initial value.
Figure 5—figure supplement 2
Simulation of apical constriction by the elasticity remodeling with cell-extracellular matrix (ECM) adhesion.
The five center cells were assigned , and the other surrounding cells were assigned an affinity to the apical ECM indicated by a ratio between cytosol-ECM and cytosol-outer body fluid contact energies. The ratio indicates how much cells were compressed, indicates a ratio between the basal and lateral surface contractility, and denotes the surface elastic modulus for the inner pale blue and green 13 cells. The edge pale red cells were assigned 0.1 times smaller surface elastic modulus than the inner cells.
Figure 6
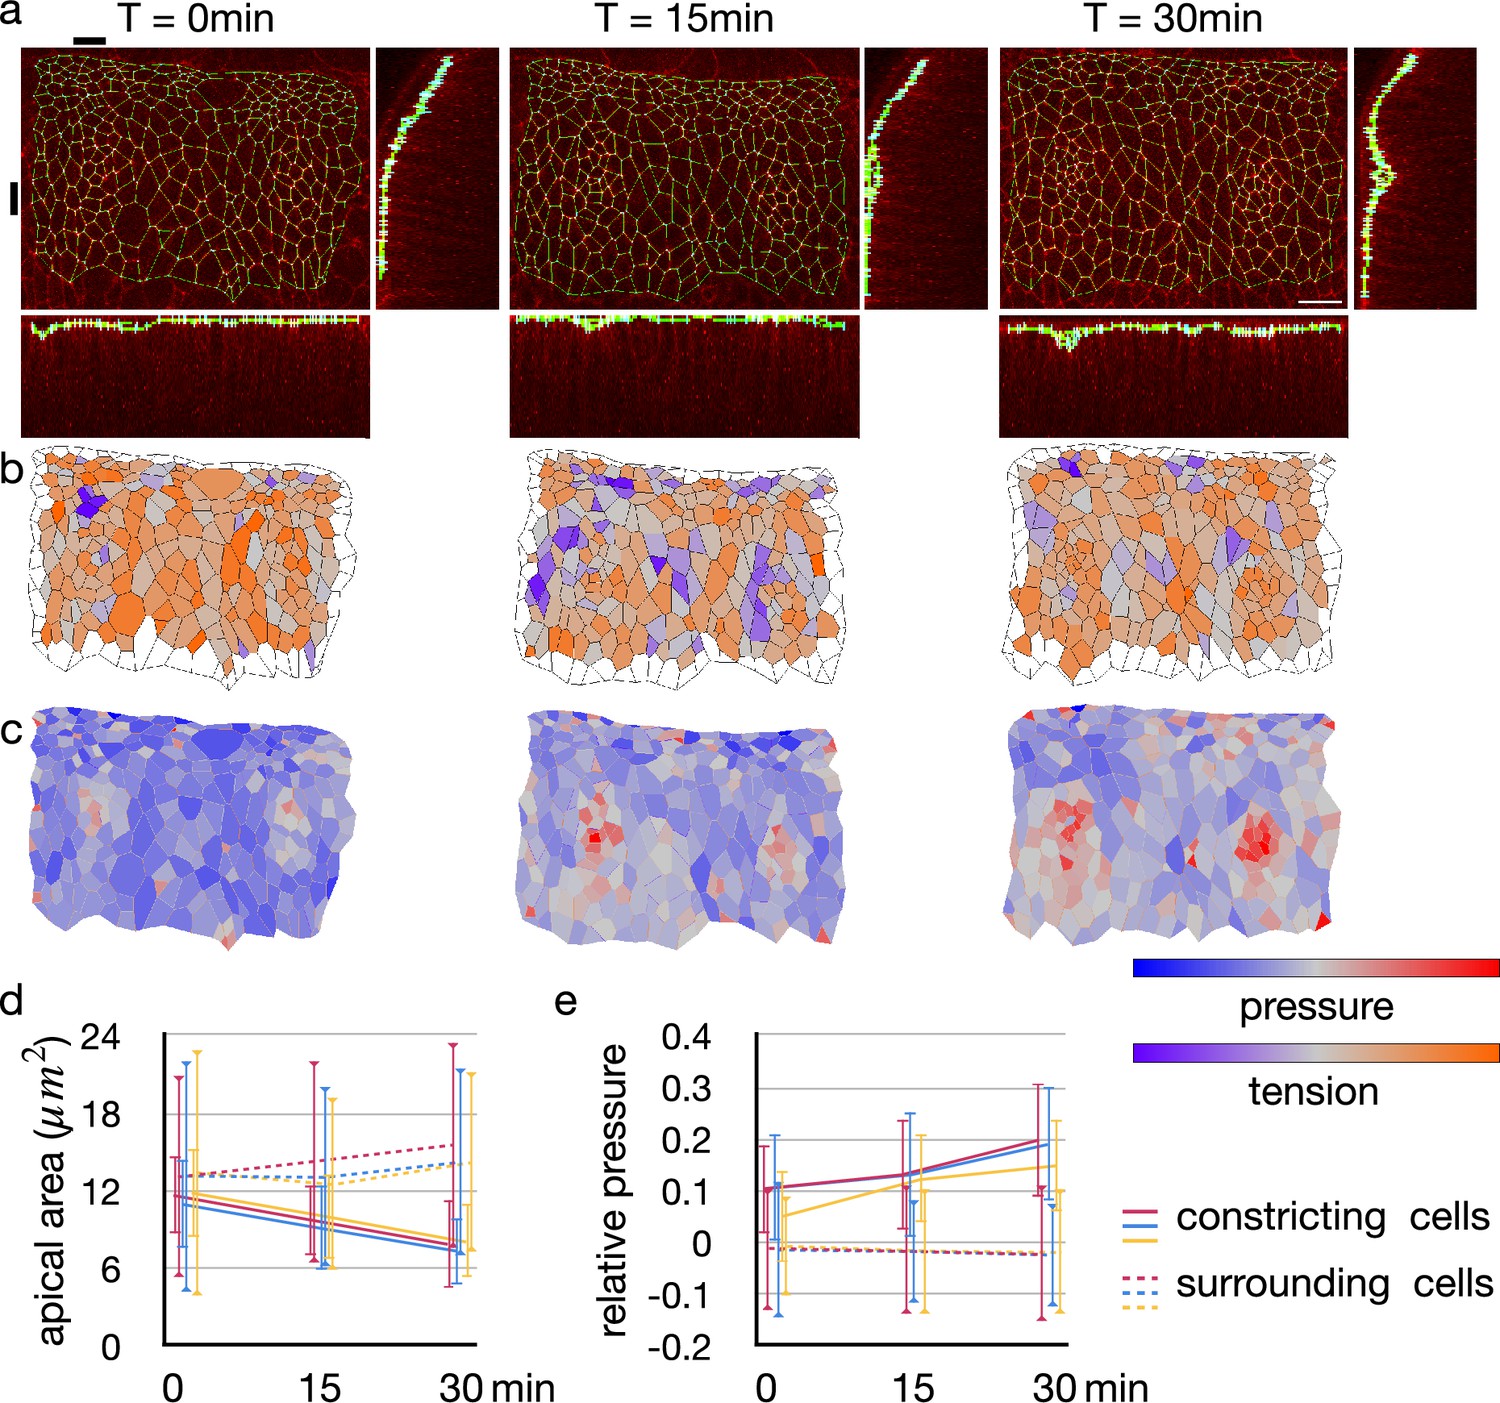
Change in junctional tension and cell pressure distribution during tracheal pit invagination.
(a) Vertices and edges representation of adherens junction inside and around Drosophila embryo tracheal pit. The panels show two tracheal pits from the beginning of the invagination (0 min) and after 15 and 30 minutes. Black bars on top and at left side indicates positions of the y-z and x-z slices. (b) Heat maps showing average junctional tensions in each cell at the three time points. The relative junctional tensions were averaged weighted with the edge lengths for each cell. (c) Heat maps showing relative cell pressure in blue-red and relative junctional tension in purple-orange at the three time points. (d) Change in apical surface area among the invaginated constricting cells (lines) and surrounding cells (dotted lines). Colors indicate different embryos, and the values were averaged in each embryo (n = 26, 34, and 33 for red, blue and yerllow lines, and n > 238 for dotted lines). Error bars indicate SDs. (e) Change in relative cell pressure among the invaginated constricting cells (lines) and surrounding cells (dotted lines). Colors indicate different embryos, and the values were averaged in each embryo (n were same with above). Error bars indicate SDs. A scale bar in a represents 10 nm.
Figure 7
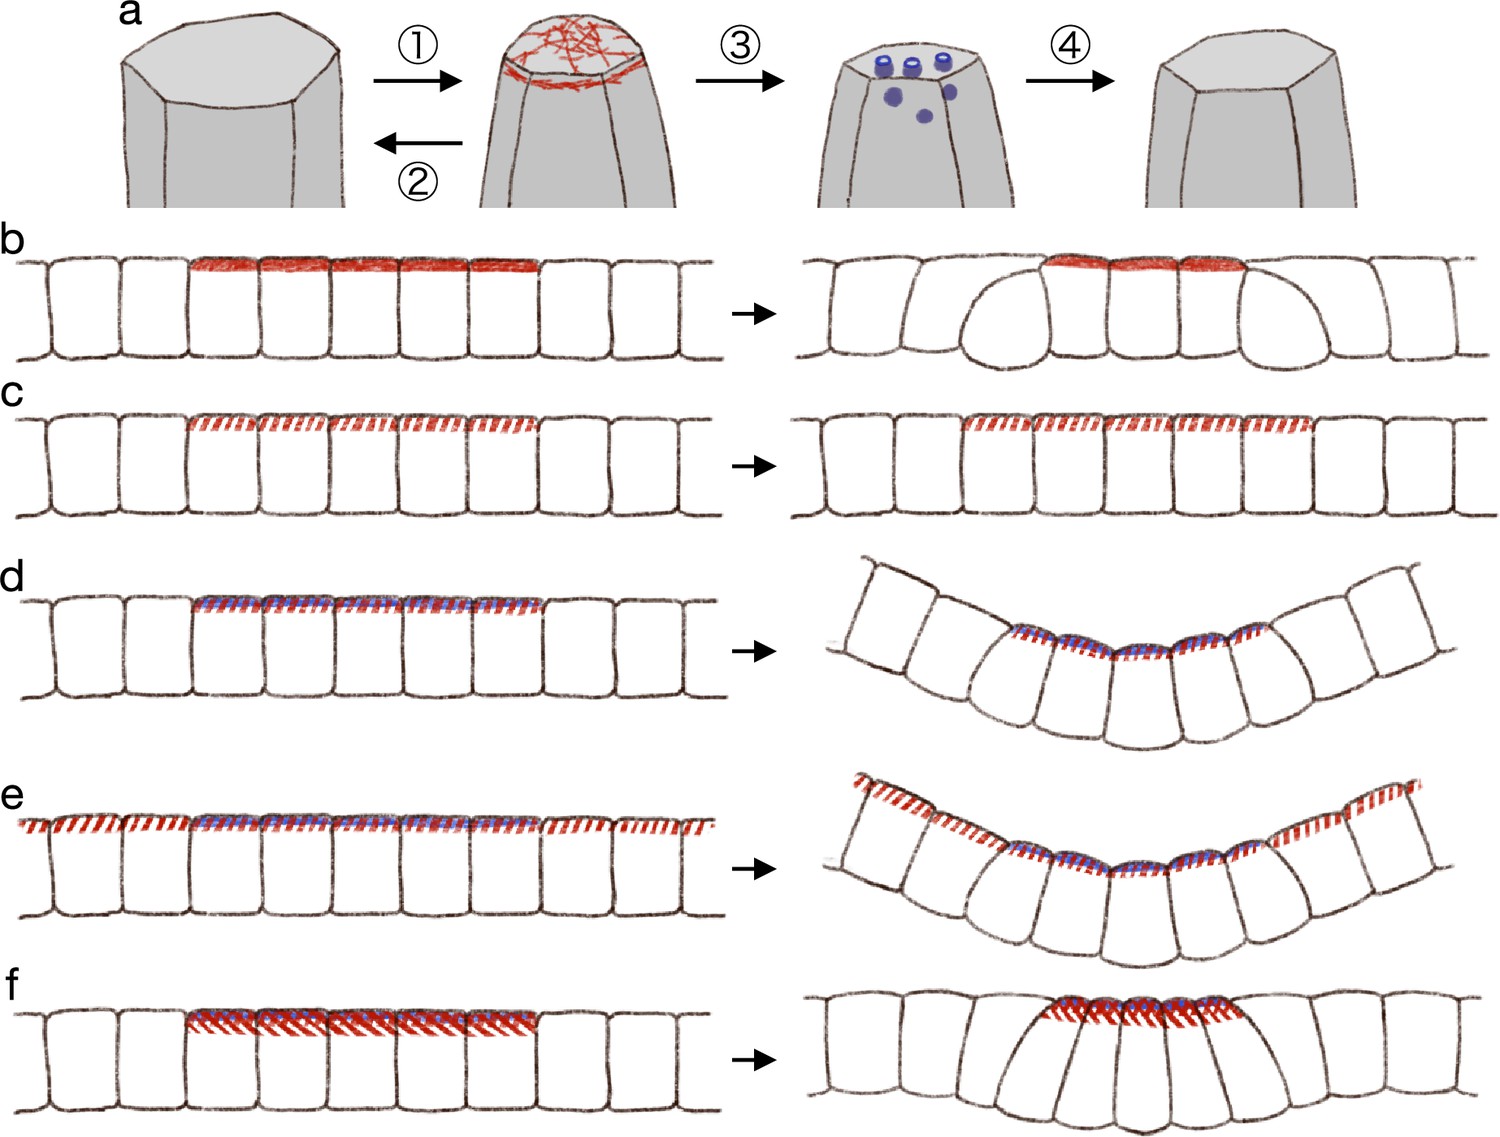
Hypothetical model of endocytosis-based apical constriction.
(a) Flow diagram of the ratcheting by endocytosis. The cell apical surface was contracted by the pulsed myosin activation (1). Without the endocytosis, the apical surface would be fully relaxed (2). By the endocytosis, the apical surface reference value was decreased (3). Because of the modified reference value, the cell apical surface was partially relaxed (4). (b) Expected deformation by the increased apical surface contractility. (c) Expected deformation by the sporadic apical surface contractility. (d) Expected deformation by the patterned sporadic contractility and endocytosis. (e) Expected deformation by the general sporadic contractility and the patterned endocytosis. (f) Expected deformation with the increased apical surface tension.
Tables
Table 1
Parameters for epithelial cell surface tension and tissue integrity.
| Set# | Cell type | , | |||||||
|---|---|---|---|---|---|---|---|---|---|
| (1) | 13 | 18 | Red cell | 1.0025 | 7.605 × x | 7.605 | 1 | 0 | 30 |
| Green cell | 1.0025 | 7.605 × x | 7.605 | 1 | 0 | ||||
| (2) | 13 | 18 | Red cell | 1.01 | 30.42 × x | 30.42 | 1 | 0 | 60 |
| Green cell | 1.01 | 30.42 × x | 30.42 | 1 | 0 | ||||
| (3) | 13 | 18 | Red cell | 1.04 | 121.68 × x | 121.68 | 1 | 0 | 120 |
| Green cell | 1.04 | 121.68 × x | 121.68 | 1 | 0 |
Table 2
Parameters for increased apical contractility.
| Set# | Cell type | |||||||||
|---|---|---|---|---|---|---|---|---|---|---|
| (4) | 13 | 18 | Red cell | 1.0025 | 15.21 | 7.605 | 15.21 | 1 | 0 | 30 |
| Green cell | 1.0025 | 15.21 | 7.605 | 15.21 | 1 | 0 | ||||
| Blue cell | 1.0025 | 15.21 × x | 7.605 | 15.21 | 1 | 0 | ||||
| (5) | 13 | 18 | Red cell | 1.0025 | 30.42 | 7.605 | 30.42 | 1 | 0 | 30 |
| Green cell | 1.0025 | 30.42 | 7.605 | 30.42 | 1 | 0 | ||||
| Blue cell | 1.0025 | 30.42 × x | 7.605 | 30.42 | 1 | 0 | ||||
| (6) | 13 | 18 | Red cell | 1.01 | 60.84 | 30.42 | 60.84 | 1 | 0 | 60 |
| Green cell | 1.01 | 60.84 | 30.42 | 60.84 | 1 | 0 | ||||
| Blue cell | 1.01 | 60.84 × x | 30.42 | 60.84 | 1 | 0 | ||||
| (7) | 13 | 18 | Red cell | 1.01 | 121.68 | 30.42 | 121.68 | 1 | 0 | 60 |
| Green cell | 1.01 | 121.68 | 30.42 | 121.68 | 1 | 0 | ||||
| Blue cell | 1.01 | 121.68 × x | 30.42 | 121.68 | 1 | 0 | ||||
| (8) | 13 | 18 | Red cell | 1.04 | 243.36 | 121.68 | 243.36 | 1 | 0 | 120 |
| Green cell | 1.04 | 243.36 | 121.68 | 243.36 | 1 | 0 | ||||
| Blue cell | 1.04 | 243.36 × x | 121.68 | 243.36 | 1 | 0 | ||||
| (9) | 13 | 18 | Red cell | 1.04 | 486.72 | 121.68 | 486.72 | 1 | 0 | 120 |
| Green cell | 1.04 | 486.72 | 121.68 | 486.72 | 1 | 0 | ||||
| Blue cell | 1.04 | 486.72 × x | 121.68 | 486.72 | 1 | 0 | ||||
| (10) | 13 | 18 | Red cell | 1.01 | 121.68 | 30.42 | 121.68 | 1 | 0.01 | 60 |
| Green cell | 1.01 | 121.68 | 30.42 | 121.68 | 1 | 0.1 | ||||
| Blue cell | 1.01 | 194.688 | 30.42 | 121.68 | 1 | 0.1 | ||||
| (11) | 13 | 18 | Red cell | 1.01 | 121.68 | 30.42 | 121.68 | 1 | 0 | 60 |
| Green cell | 1.01 | 121.68 | 30.42 | 121.68 | 1 | 0 | ||||
| Blue cell | 1.01 | 121.68 | 30.42 | 121.68 | 1 | 0 | ||||
| (12) | 13 | 18 | Red cell | 1.01 | 121.68 | 30.42 | 121.68 | 1 | 0.25 | 60 |
| Green cell | 1.01 | 121.68 | 30.42 | 121.68 | 1 | 2.5 | ||||
| Blue cell | 1.01 | 121.68 | 30.42 | 121.68 | 1 | 2.5 |
Table 3
Parameters for modified surface elasticity.
| Set# | Cell type | , | |||||||
|---|---|---|---|---|---|---|---|---|---|
| (13) | 13 | 18 | Red cell | 1.0025 | 15.21 /30.42 | 7.605 | 1 | 0.25 | 240 |
| Green cell | 1.0025 | 15.21 /30.42 | 7.605 | 1 | 2.5 | ||||
| Blue cell | 1.0025 | 15.21 /30.42 | 7.605 | 1 | 2.5 | ||||
| (14) | 13 | 18 | Red cell | 1.0025 | 15.21 /30.42 | 7.605 | 1 | 0.5 | 240 |
| Green cell | 1.0025 | 15.21 /30.42 | 7.605 | 1 | 5.0 | ||||
| Blue cell | 1.0025 | 15.21 /30.42 | 7.605 | 1 | 5.0 | ||||
| (15) | 13 | 18 | Red cell | 1.0025 | 15.21 /30.42 | 7.605 | 1 | 1 | 360 |
| Green cell | 1.0025 | 15.21 /30.42 | 7.605 | 1 | 10 | ||||
| Blue cell | 1.0025 | 15.21 /30.42 | 7.605 | 1 | 10 | ||||
| (16) | 13 | 18 | Red cell | 1.0025 | 15.21 /30.42 | 7.605 | 1 | 2 | 480 |
| Green cell | 1.0025 | 15.21 /30.42 | 7.605 | 1 | 20 | ||||
| Blue cell | 1.0025 | 15.21 /30.42 | 7.605 | 1 | 20 | ||||
| (17) | 13 | 18 | Red cell | 1.01 | 60.84 /121.68 | 30.42 | 1 | 0.25 | 240 |
| Green cell | 1.01 | 60.84 /121.68 | 30.42 | 1 | 2.5 | ||||
| Blue cell | 1.01 | 60.84 /121.68 | 30.42 | 1 | 2.5 | ||||
| (18) | 13 | 18 | Red cell | 1.01 | 60.84 /121.68 | 30.42 | 1 | 0.5 | 240 |
| Green cell | 1.01 | 60.84 /121.68 | 30.42 | 1 | 5.0 | ||||
| Blue cell | 1.01 | 60.84 /121.68 | 30.42 | 1 | 5.0 | ||||
| (19) | 13 | 18 | Red cell | 1.01 | 60.84 /121.68 | 30.42 | 1 | 1 | 360 |
| Green cell | 1.01 | 60.84 /121.68 | 30.42 | 1 | 10 | ||||
| Blue cell | 1.01 | 60.84 /121.68 | 30.42 | 1 | 10 | ||||
| (20) | 13 | 18 | Red cell | 1.01 | 60.84 /121.68 | 30.42 | 1 | 2 | 480 |
| Geen cell | 1.01 | 60.84 /121.68 | 30.42 | 1 | 20 | ||||
| Blue cell | 1.01 | 60.84 /121.68 | 30.42 | 1 | 20 | ||||
| (21) | 13 | 18 | Red cell | 1.04 | 243.36 /486.72 | 121.68 | 1 | 0.25 | 480 |
| Green cell | 1.04 | 243.36 /486.72 | 121.68 | 1 | 2.5 | ||||
| Blue cell | 1.04 | 243.36 /486.72 | 121.68 | 1 | 2.5 | ||||
| (22) | 13 | 18 | Red cell | 1.04 | 243.36 /486.72 | 121.68 | 1 | 0.5 | 480 |
| Green cell | 1.04 | 243.36 /486.72 | 121.68 | 1 | 5.0 | ||||
| Blue cell | 1.04 | 243.36 /486.72 | 121.68 | 1 | 5.0 | ||||
| (23) | 13 | 18 | Red cell | 1.04 | 243.36 /486.72 | 121.68 | 1 | 1 | 480 |
| Green cell | 1.04 | 243.36 /486.72 | 121.68 | 1 | 10 | ||||
| Blue cell | 1.04 | 243.36 /486.72 | 121.68 | 1 | 10 | ||||
| (24) | 13 | 18 | Red cell | 1.04 | 243.36 /486.72 | 121.68 | 1 | 2 | 600 |
| Green cell | 1.04 | 243.36 /486.72 | 121.68 | 1 | 20 | ||||
| Blue cell | 1.04 | 243.36 /486.72 | 121.68 | 1 | 20 |
Table 4
Parameters for gradient apical contractility.
| Set# | Cell type | |||||||||
|---|---|---|---|---|---|---|---|---|---|---|
| (25) | 13 | 18 | Red cell | 1.0025 | 15.21 /30.42 | 7.605 | 15.21 /30.42 | 1 | 0 | 30 |
| Green cell | 1.0025 | 15.21 /30.42 | 7.605 | 15.21 /30.42 | 1 | 0 | ||||
| Paler blue cell | 1.0025 | 21.294 /42.588 | 7.605 | 15.21 /30.42 | 1 | 0 | ||||
| Middle blue cell | 1.0025 | 24.336 /48.672 | 7.605 | 15.21 /30.42 | 1 | 0 | ||||
| Darker blue cell | 1.0025 | 25.857 /51.714 | 7.605 | 15.21 /30.42 | 1 | 0 | ||||
| (26) | 13 | 18 | Red cell | 1.0025 | 15.21 /30.42 | 7.605 | 15.21 /30.42 | 1 | 0 | 30 |
| Green cell | 1.0025 | 15.21 /30.42 | 7.605 | 15.21 /30.42 | 1 | 0 | ||||
| Paler blue cell | 1.0025 | 24.336 /48.672 | 7.605 | 15.21 /30.42 | 1 | 0 | ||||
| Middle blue cell | 1.0025 | 28.899 /57.798 | 7.605 | 15.21 /30.42 | 1 | 0 | ||||
| Darker blue cell | 1.0025 | 31.1805 /62.361 | 7.605 | 15.21 /30.42 | 1 | 0 | ||||
| (27) | 13 | 18 | Red cell | 1.01 | 60.084 /121.68 | 30.42 | 60.84 /121.68 | 1 | 0 | 60 |
| Green cell | 1.01 | 60.84 /121.68 | 30.42 | 60.84 /121.68 | 1 | 0 | ||||
| Paler blue cell | 1.01 | 85.176 /170.354 | 30.42 | 60.84 /121.68 | 1 | 0 | ||||
| Middle blue cell | 1.01 | 97.344 /194.688 | 30.42 | 60.84 /121.68 | 1 | 0 | ||||
| Darker blue cell | 1.01 | 103.428 /206.856 | 30.42 | 60.84 /121.68 | 1 | 0 | ||||
| (28) | 13 | 18 | Red cell | 1.01 | 60.84 /121.68 | 30.42 | 60.84 /121.68 | 1 | 0 | 60 |
| Green cell | 1.01 | 60.84 /121.68 | 30.42 | 60.84 /121.68 | 1 | 0 | ||||
| Paler blue cell | 1.01 | 97.344 /194.688 | 30.42 | 60.84 /121.68 | 1 | 0 | ||||
| Middle blue cell | 1.01 | 115.596 /231,192 | 30.42 | 60.84 /121.68 | 1 | 0 | ||||
| Darker blue cell | 1.01 | 124.722 /249.444 | 30.42 | 60.84 /121.68 | 1 | 0 | ||||
| (29) | 13 | 18 | Red cell | 1.04 | 243.36 /486.72 | 121.68 | 243.36 /486.72 | 1 | 0 | 120 |
| Green cell | 1.04 | 243.36 /486.72 | 121.68 | 243.36 /486.72 | 1 | 0 | ||||
| Paler blue cell | 1.04 | 340.704 /681.408 | 121.68 | 243.36 /486.72 | 1 | 0 | ||||
| Middle blue cell | 1.04 | 389.376 /778.752 | 121.68 | 243.36 /486.72 | 1 | 0 | ||||
| Darker blue cell | 1.04 | 413.712 /827.424 | 121.68 | 243.36 /486.72 | 1 | 0 | ||||
| (30) | 13 | 18 | Red cell | 1.04 | 243.36 /486.72 | 121.68 | 243.36 /486.72 | 1 | 0 | 120 |
| Green cell | 1.04 | 243.36 /486.72 | 121.68 | 243.36 /486.72 | 1 | 0 | ||||
| Paler blue cell | 1.04 | 389.376 /778.752 | 121.68 | 243.36 /486.72 | 1 | 0 | ||||
| Middle blue cell | 1.04 | 462.384 /924.768 | 121.68 | 243.36 /486.72 | 1 | 0 | ||||
| Darker blue cell | 1.04 | 498.888 /997.776 | 121.68 | 243.36 /486.72 | 1 | 0 |
Table 5
Parameters for various cell heights.
| Set# | Cell type | , | |||||||
|---|---|---|---|---|---|---|---|---|---|
| (31) | 13 | 12 | Red cell | 1.0025 | 10.14 /20.28 | 5.07 | 1 | 0.1 × x | |
| Green cell | 1.0025 | 10.14 /20.28 | 5.07 | 1 | x | ||||
| Blue cell | 1.0025 | 10.14 /20.28 | 5.07 | 1 | x | ||||
| (32) | 13 | 24 | Red cell | 1.0025 | 20.28 /40.56 | 10.14 | 1 | ||
| Green cell | 1.0025 | 20.28 /40.56 | 10.14 | 1 | x | ||||
| Blue cell | 1.0025 | 20.28 /40.56 | 10.14 | 1 | x | ||||
| (33) | 13 | 12 | Red cell | 1.01 | 40.56 /81.12 | 20.28 | 1 | ||
| Green cell | 1.01 | 40.56 / | 20.28 | 1 | x | ||||
| Blue cell | 1.01 | 40.56 /81.12 | 20.28 | 1 | x | ||||
| (34) | 13 | 24 | Red cell | 1.01 | 81.12 /162.24 | 40.56 | 1 | ||
| Green cell | 1.01 | 81.12 /162.24 | 40.56 | 1 | x | ||||
| Blue cell | 1.01 | 81.12 /162.24 | 40.56 | 1 | x | ||||
| (35) | 13 | 12 | Red cell | 1.04 | 162.24 /324.48 | 81.12 | 1 | ||
| Geen cell | 1.04 | 162.24 /324.48 | 81.12 | 1 | |||||
| Blue cell | 1.04 | 162.24 /324.48 | 81.12 | 1 | |||||
| (36) | 13 | 24 | Red cell | 1.04 | 324.48 /648.96 | 162.24 | 1 | ||
| Green cell | 1.04 | 324.48 /648.96 | 162.24 | 1 | |||||
| Blue cell | 1.04 | 324.48 /648.96 | 162.24 | 1 |
Table 6
Parameters for deformation with apical elasticity and cell-extracellular matrix adhesion.
| Set# | Cell type | , | ||||||||
|---|---|---|---|---|---|---|---|---|---|---|
| (36) | 13 | 18 | Red cell | 1.0025 | 15.21 /30.42 | 15.21 /30.42 | 7.605 | 1 | ||
| Green cell | 1.0025 | 15.21 /30.42 | / | 7.605 | 1 | |||||
| Blue cell | 1.0025 | 15.21 /30.42 | 15.21 /30.42 | 7.605 | 1 | |||||
| (37) | 13 | 18 | Red cell | 1.01 | 60.84 /121.68 | 60.84 /121.68 | 30.42 | 1 | ||
| Green cell | 1.01 | 60.84 /121.68 | / | 30.42 | 1 | |||||
| Blue cell | 1.01 | 60.84 /121.68 | 60.84 /121.68 | 30.42 | 1 | |||||
| (38) | 13 | 18 | Red cell | 1.04 | 243.36 /486.72 | 243.36 /486.72 | 121.68 | 1 | ||
| Green cell | 1.04 | 243.36 /486.72 | / | 121.68 | 1 | |||||
| Blue cell | 1.04 | 243.36 /486.72 | 243.36 /486.72 | 121.68 | 1 |
Additional files
Download links
A two-part list of links to download the article, or parts of the article, in various formats.
Downloads (link to download the article as PDF)
Open citations (links to open the citations from this article in various online reference manager services)
Cite this article (links to download the citations from this article in formats compatible with various reference manager tools)
Apical constriction requires patterned apical surface remodeling to synchronize cellular deformation
eLife 13:RP93496.
https://doi.org/10.7554/eLife.93496.4


