Clustered synapses develop in distinct dendritic domains in visual cortex before eye opening
- Department of Synapse and Network Development, Netherlands Institute for Neuroscience, Netherlands
- Department of Functional Genomics, Center for Neurogenomics and Cognitive Research, VU University Amsterdam, Netherlands
Figures
Figure 1
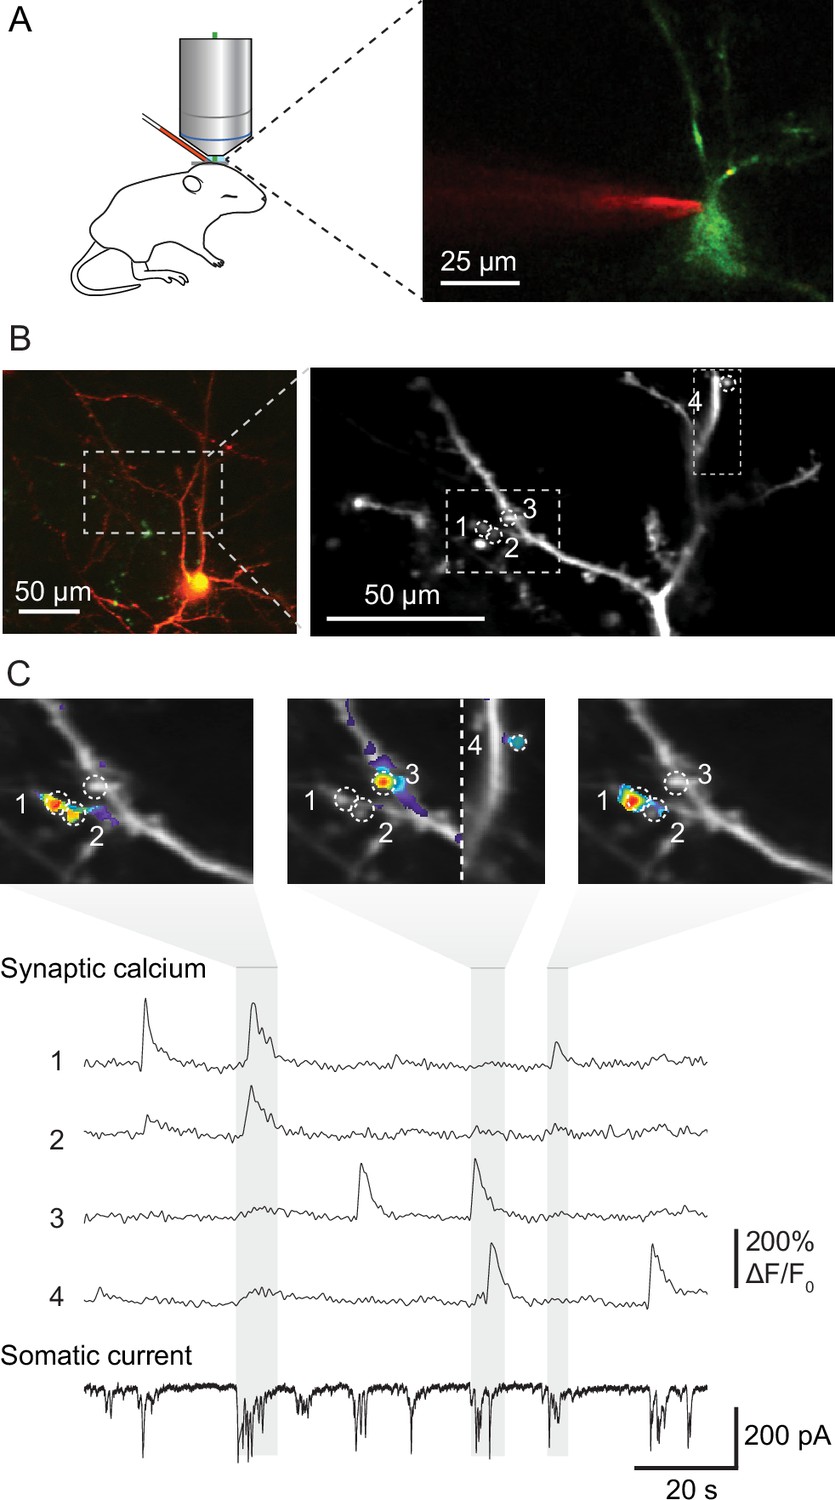
Mapping functional synaptic inputs of V1 layer 2/3 pyramidal cell dendrites in vivo.
(A) Schematic of experimental setup (left) and pyramidal cell in mouse visual cortex expressing DsRed and GCaMP-6s (right). Layer 2/3 neurons were targeted in vivo under two-photon guidance. Patch-clamp pipettes were coated with Alexa 594 for visualization. (B) Left: layer 2/3 pyramidal neuron expressing DsRed and GCaMP-6s at postnatal day (P) 12 (D9 in Figure 2—figure supplements 1 and 2). Right: high-magnification view of the dendrite marked with dashed lines on the left. Dashed circles and numbers mark four individual synaptic sites. Dashed rectangle indicates the views shown in (C). (C) Spontaneous synaptic inputs were visible both as local increases in fluorescence at the four synaptic sites labeled in (B), and as synaptic currents in the somatic whole-cell voltage-clamp recording. Gray vertical bars indicate three individual barrages of synaptic inputs, and panels above show synaptic calcium increases at the four example synapses during each labeled barrage. Synaptic transmission of individual synapses could be detected and distinguished clearly from that at neighboring synapses.
Figure 2 with 5 supplements

Sampling synaptic transmission in spine and shaft synapses (D3).
(A) Synaptic transmission in a spine of a layer 2/3 pyramidal neuron at P9. (B) Synaptic transmission at two neighboring shaft synapses of the neuron shown in (A). (C) Schematic representation of the synaptic inputs of the neuron shown in (A) and (B). Left: all functional synapses are labeled as individual discs. Yellow and blue discs represent spine and shaft synapses, respectively. The disc diameter indicates the observed transmission frequency at each synapse. Right: schematic representation of synaptic transmission across time in the same dendrite. Dots represent individual synaptic transmission events.
Figure 2—figure supplement 1
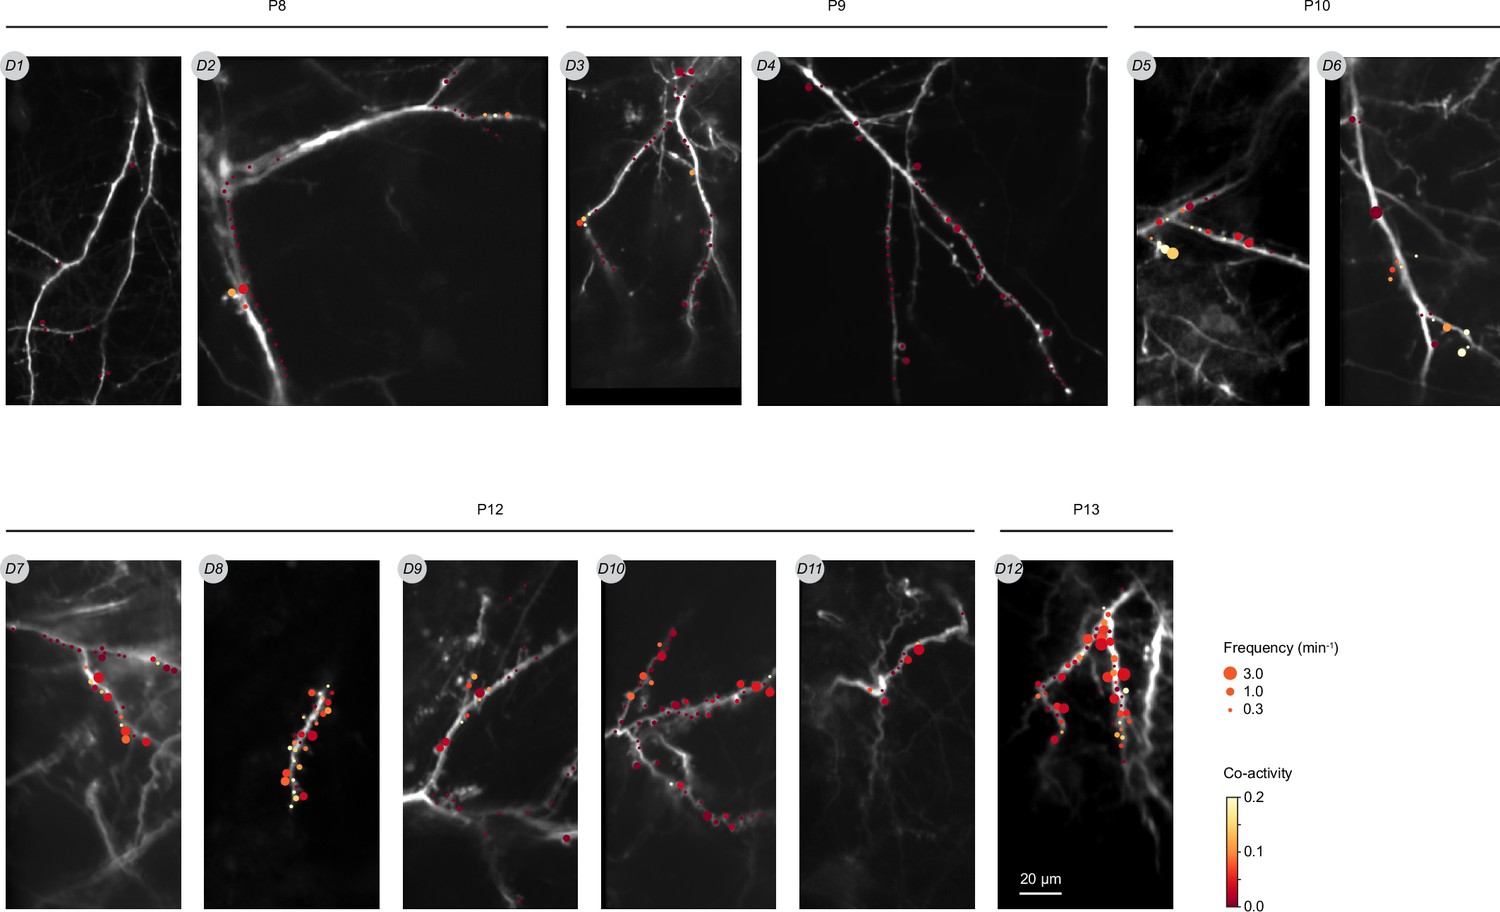
Overview of all imaged dendrites and synapses.
Each synapse is represented as a disc whose size and color indicate transmission frequency and local co-activity, respectively. D1–D12 are each dendrite’s identifier. The scale bar applies to all images.
Figure 2—figure supplement 2
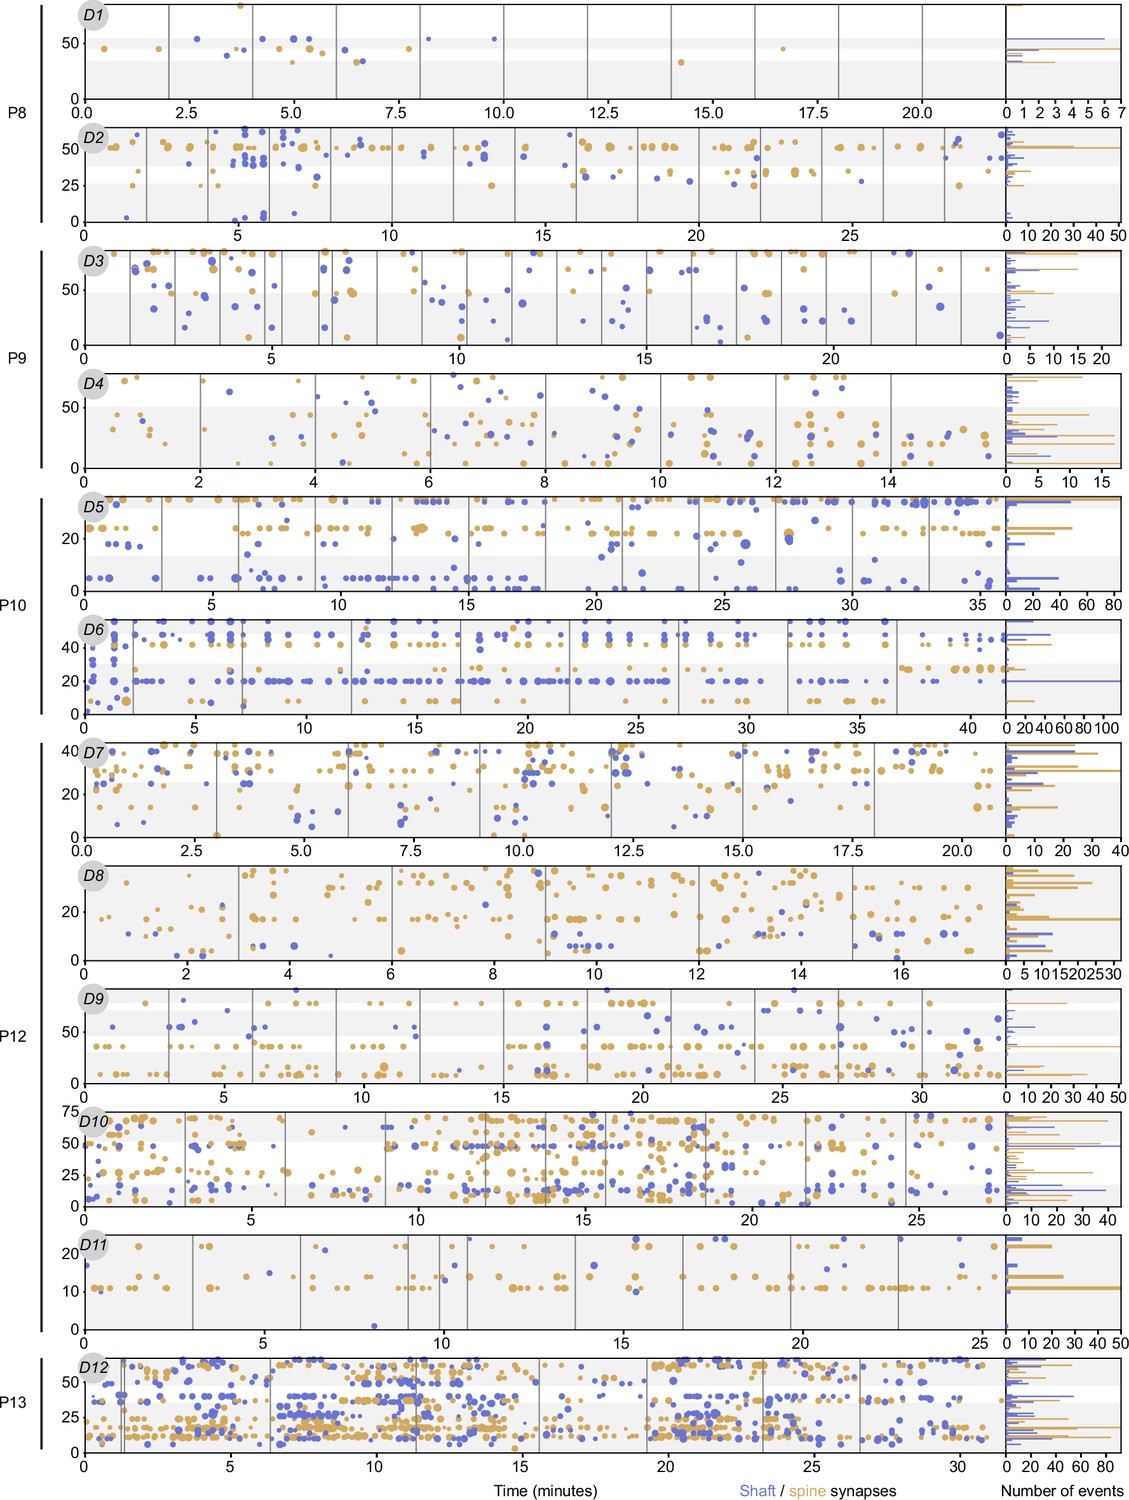
Overview of all recorded synaptic transmission events across all imaged dendrites.
Y-axes show synaptic position along dendrites. White and gray shaded areas represent individual dendritic segments. Each synaptic transmission event is shown as a disc in yellow (spines) or blue (shaft synapses). Disc size indicates the relative amplitude of each event (z-scored for each synapse). Bar plots on the right show the number of transmission events detected at each synapse. Individual dendrites are shown in the same sequence as in Figure 2—figure supplement 1.
Figure 2—figure supplement 3
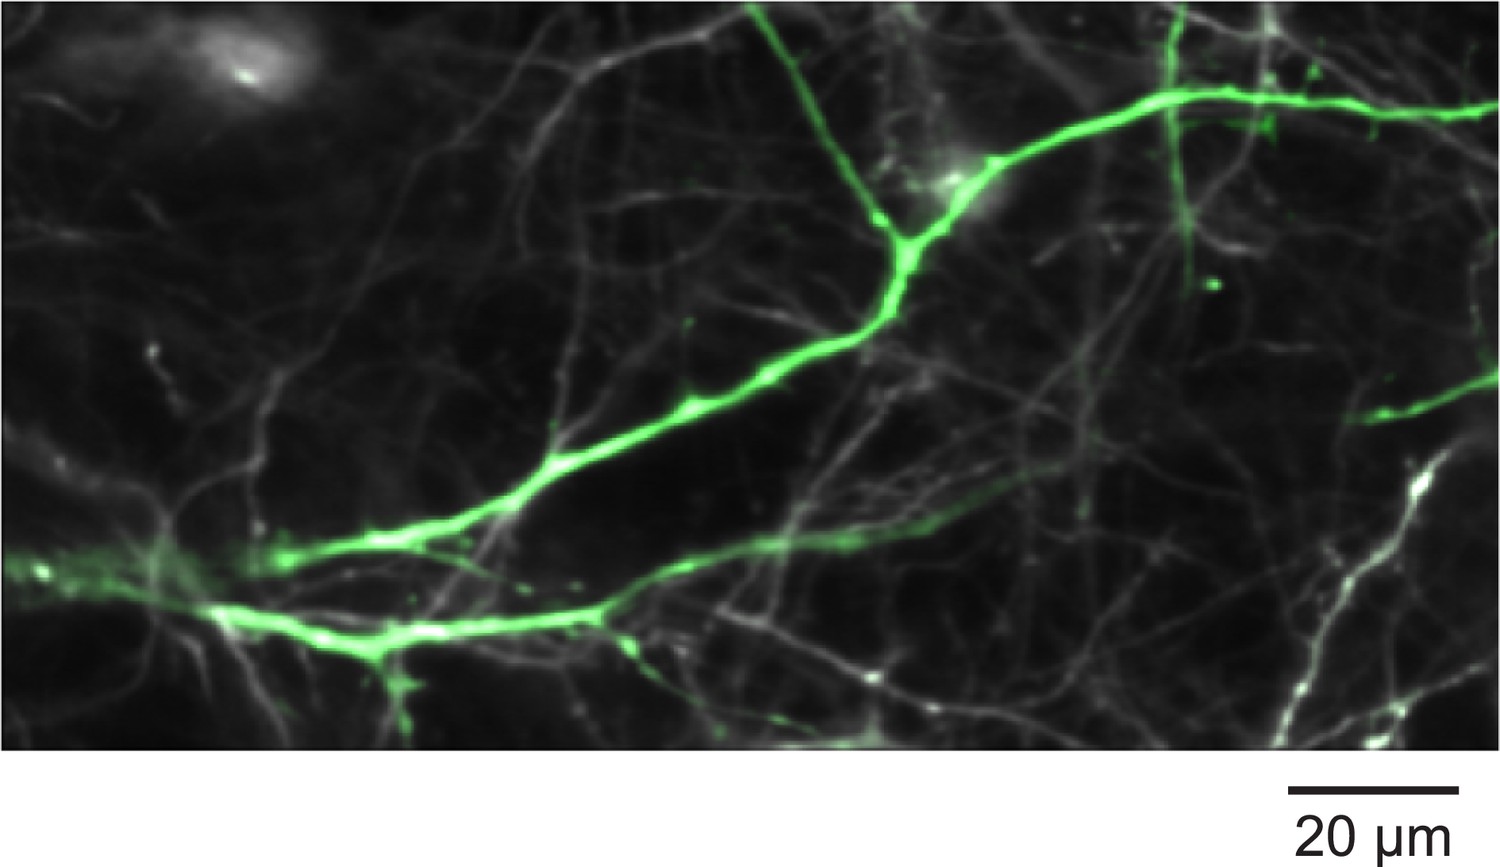
Identification of the patched neuron and its dendrites.
Composite of the DSred channel (gray) and the GCaMP6s channel (green) after switching the holding potential to –30 mV of a layer 2/3 pyramidal neuron at P8 (D1). The depolarization triggers a transient calcium increase in the patched neuron, which labels its dendrites (green) clearly above the background (gray processes).
Figure 2—figure supplement 4
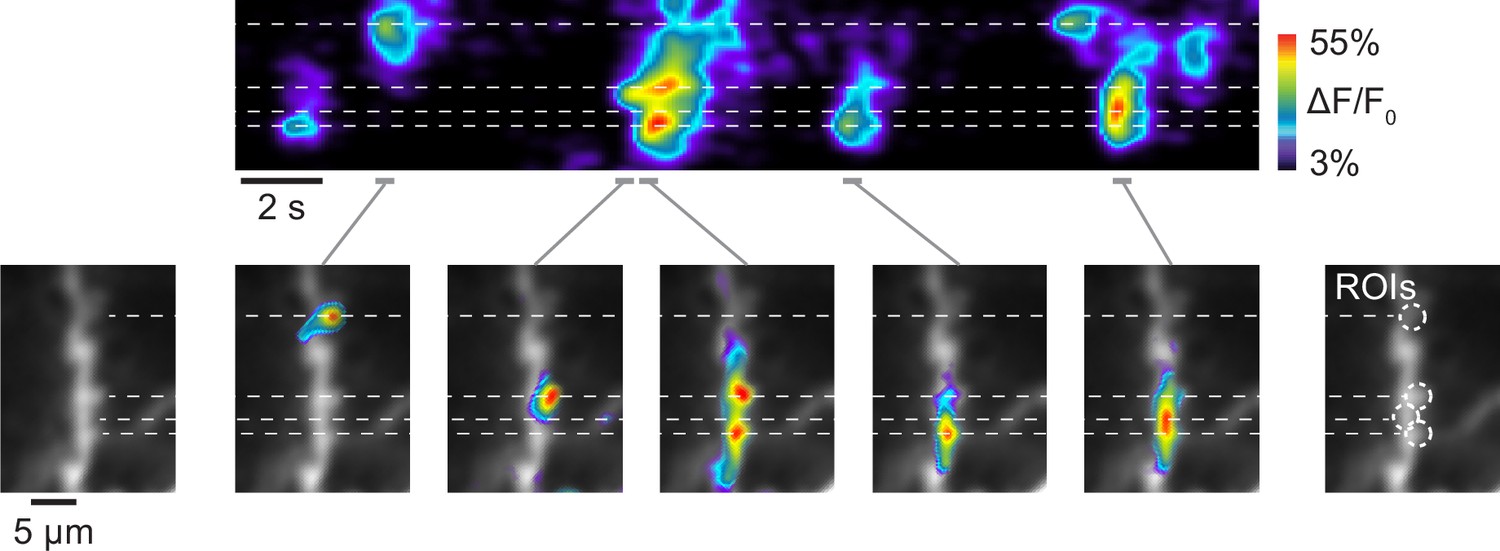
Region of interest (ROI) selection.
Synaptic calcium transients in a dendrite of a layer 2/3 pyramidal neuron at P13 (D12). Top: occurrence of synaptic calcium transients in the dendritic stretch shown on the left. Stippled lines indicate the position of several transients. Bottom: spatial representation of the events shown above at the time points indicated by the gray bars. Circles on the right indicate ROIs selected based on the calcium transients shown here.
Figure 2—figure supplement 5
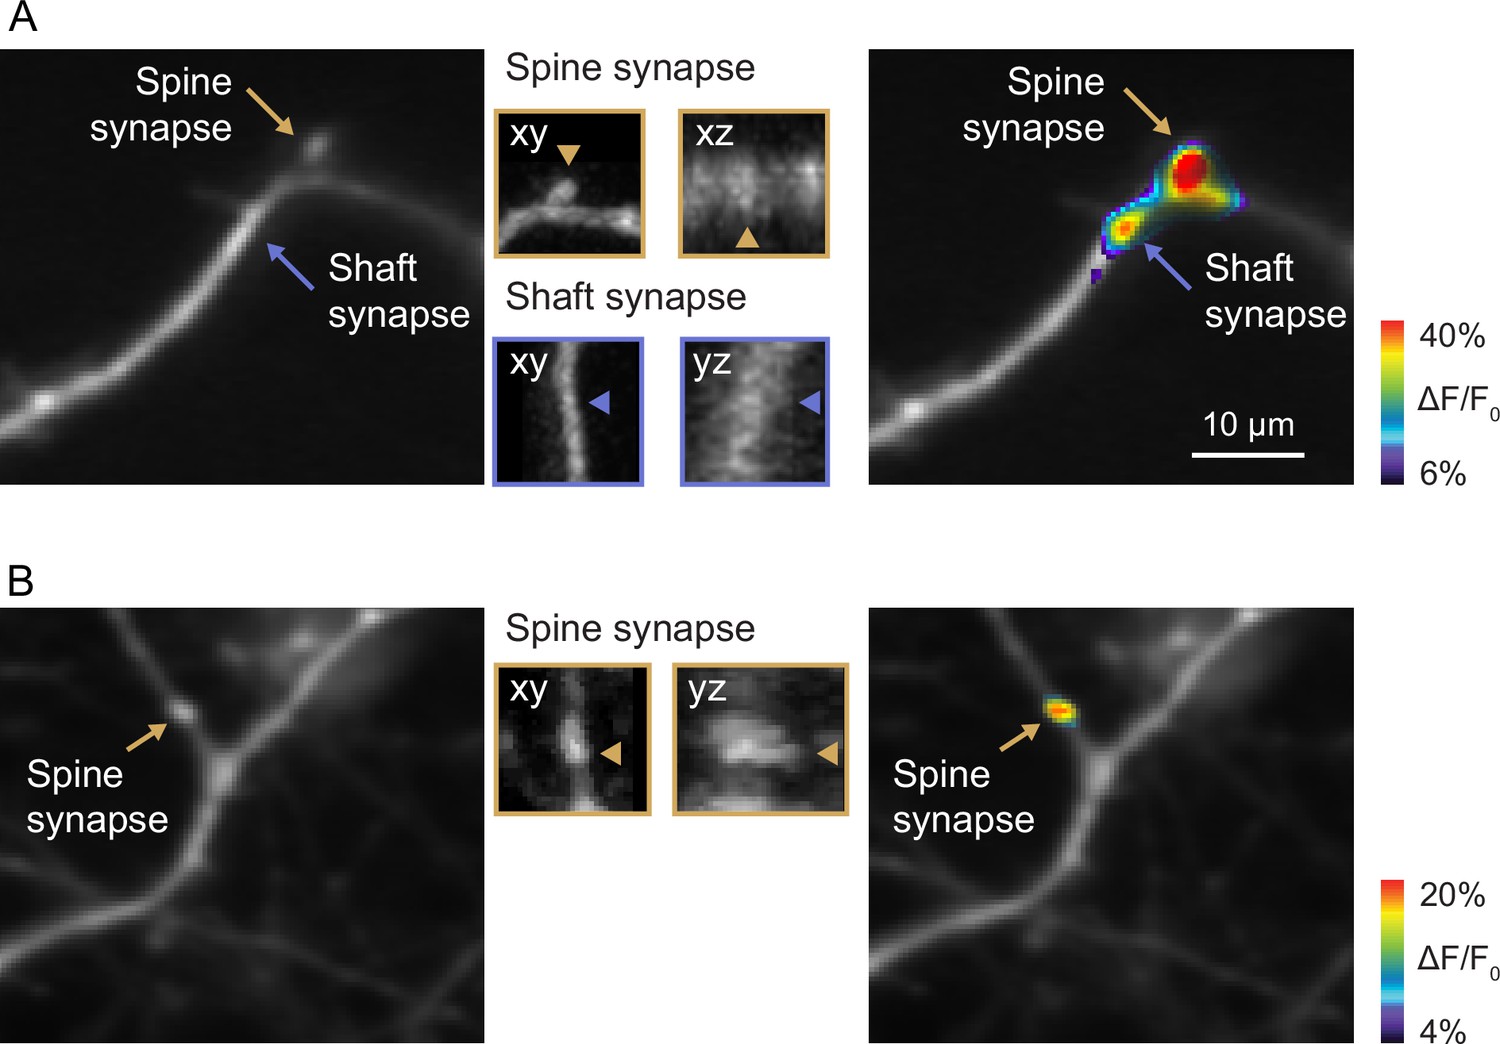
Identification of shaft and spine synapses.
(A) Dendrite of a layer 2/3 pyramidal neuron at P9 (D3). Left: arrows indicate the positions of a spine (yellow) and a shaft synapse (blue). Middle: xy- and xz/yz views show the dendritic segments around these synapses acquired in a z-stack before the here shown time-lapse recording. The arrowheads point to the same synapses as in the left panel. Right: synaptic transmission events at these synapses. (B) Dendrite of a layer 2/3 pyramidal neuron at P8 (D1). The arrow points to a putative spine synapse located in the axis of the dendritic shaft. xy- and yz views show the dendritic segment around this synapse acquired in a z-stack before the here shown time-lapse recording. The arrowheads points to a putative spine below the dendrite in the image plane. Right: synaptic transmission event at this synapse.
Figure 3

Synapse density and synaptic transmission frequency increased rapidly during the second postnatal week.
(A) Plots of layer 2/3 pyramidal cell dendrites from two experiments at P9 (D3) and P12 (D10), respectively. Each functional synapse is indicated as a disc where the diameter represents the frequency of transmission at shaft (blue) and spine (yellow) synapses. (B) The density of functional synapses increased with age. Each dot represents the number of synapses per 100 µm dendrite of one experiment. Statistical parameters in this panel and (C–E) were derived from linear regressions on the data from n = 12 experiments. The light gray area indicates the 95% confidence interval as in all following regression plots. (C) The frequency of synaptic transmission per synapse increased with age. Each dot represents the mean frequency across all synapses from one experiment. (D) The frequency of synaptic inputs along a stretch of dendrite increased multifold during the second postnatal week. (E) The percentage of synapses that are located on spines did not change significantly during the observed period. (F) The distribution of transmission rates across all sampled synapses. While most synapses show only low transmission frequency, the distribution is very long-tailed, demonstrating that few synapses show very high synaptic transmission rates. Inset: frequency distribution shown on a logarithmic scale. (G) Cumulative distribution of transmission frequencies across spine and shaft synapses in younger (P8–10) and older dendrites (P12–P13). The transmission frequency was higher at spine than at shaft synapses at both ages (each p<10–9, Mann–Whitney U tests, P8–10: n = 36 spine/113 shaft synapses, N = 6 dendrites, P12–13: n = 83 spine/122 shaft synapses, N = 6 dendrites).
Figure 4
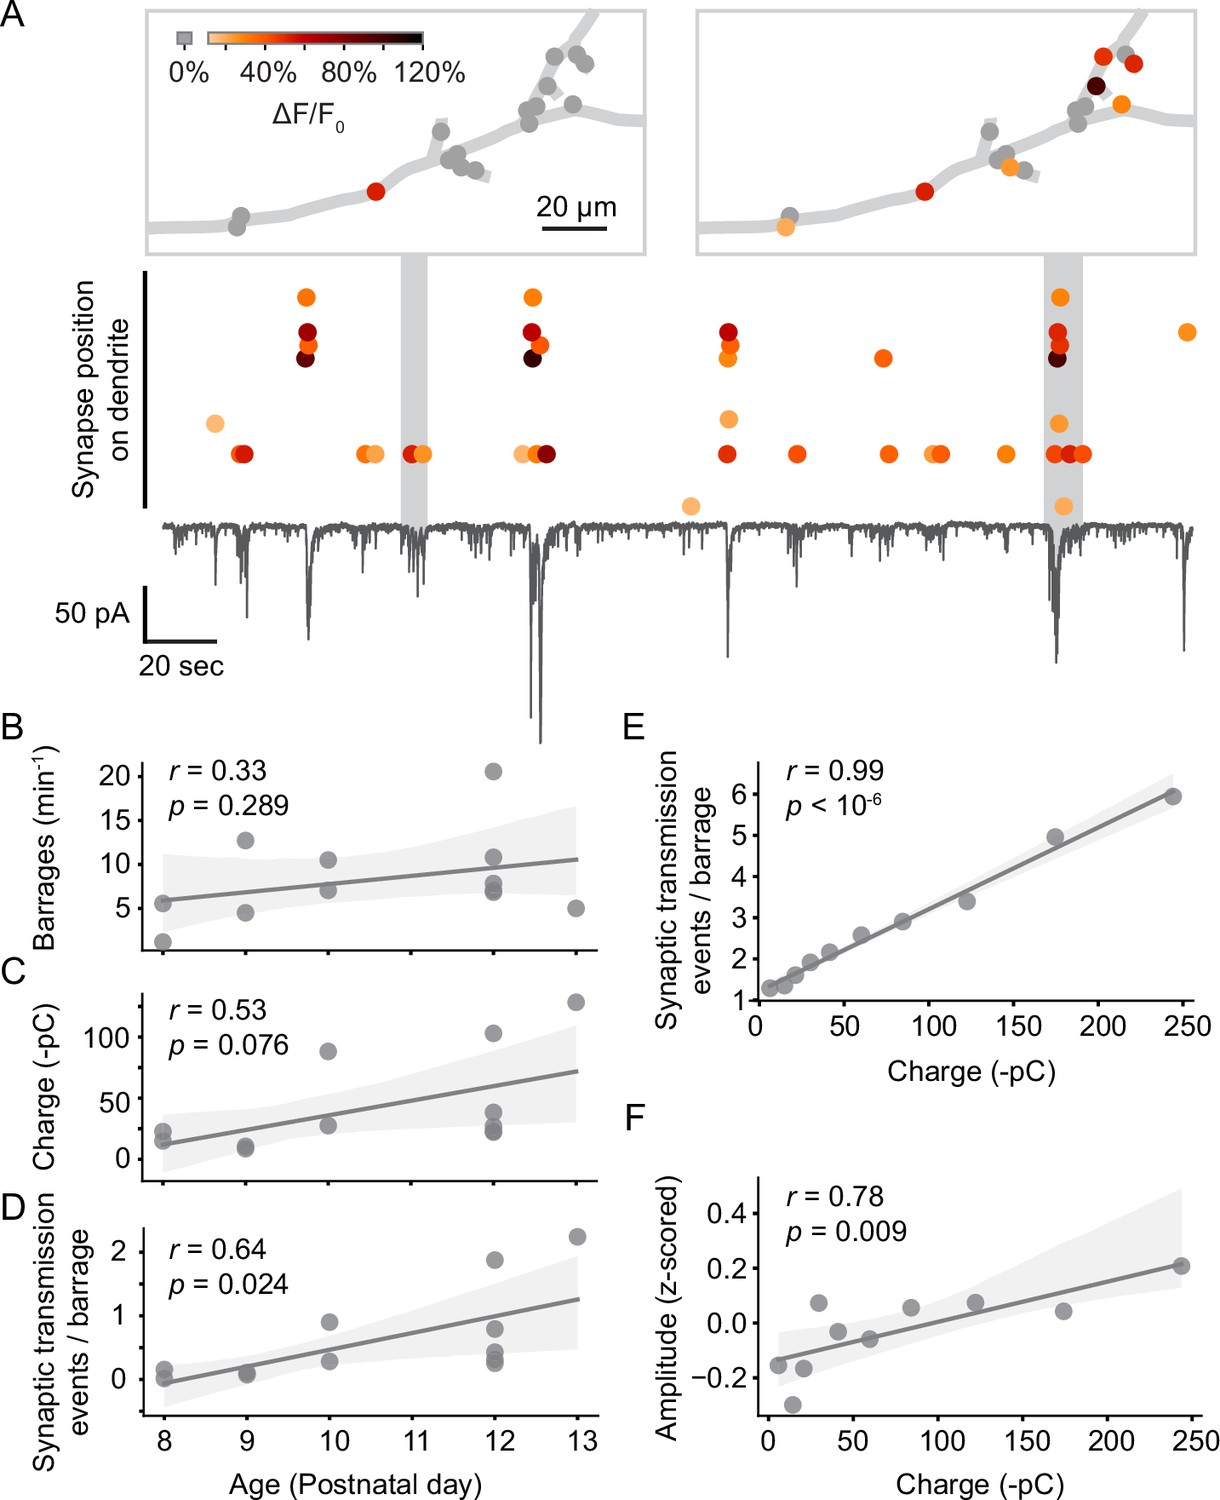
Synaptic transmission at the synapse and soma level.
(A) Synaptic transmission events (dots) at individual synapses and synaptic currents recorded simultaneously from the soma (black trace) in a layer 2/3 neuron at P10 (D6). Top: dendritic location of synapses that are active during two example barrages. Colors represent the amplitude of individual synaptic transmission events. Gray dots show synapses that were inactive during the respective barrages. Most synaptic transmission events occurred during barrages of somatic currents. (B) The number of barrages did not change significantly during the observed developmental period. Each dot represents the mean from one experiment. The light gray area indicates the 95% confidence interval as in all following regression plots. (C) The total charge transferred during barrages of synaptic currents showed a trend toward increases with age. (D) The number of synaptic transmission events observed during individual barrages increased with age. (E) The number of synaptic transmission events correlated linearly with the total charge transferred of barrages during which they occurred. Each data point shows the mean number of synaptic transmission events per barrage for geometrically binned barrage sizes. (F) The amplitude of synaptic transmission events at a given synapse correlated with the total charge transferred, suggesting that more than one vesicle was released per synapse during larger barrages. Each data point shows the mean amplitude (z-scored across all events of each synapse) per barrage for geometrically binned barrage sizes.
Figure 5
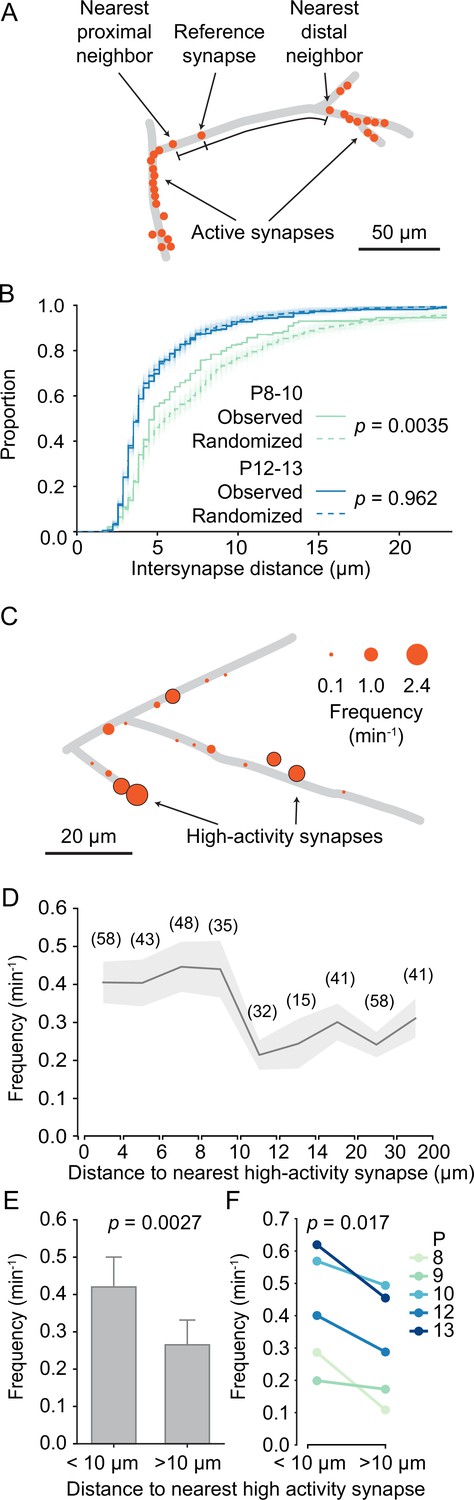
Structured organization of synapses along developing dendrites.
(A) Graphical representation of layer 2/3 pyramidal cell dendrites at P8 (D2). Each dot shows an active synapse. Several dendritic segments carried a high density of synapses; others did not receive functional synaptic inputs. (B) Cumulative distribution of inter-synapse distances between each synapse and their nearest proximal and distal neighbors. The inter-synapse distance distribution of synapses in younger dendrites (P8–10, green, N = 6 dendrites) differed significantly from randomized distributions (100 runs are shown as faint lines and their average as dashed line). In older dendrites (P12–13, blue, N = 6 dendrites), inter-synapse distributions did not differ from randomized distributions (Kolmogorov–Smirnov tests). (C) Graphical representation of layer 2/3 pyramidal cell dendrites at P10 (D5). The diameter of each disc represents the transmission frequency of a synapse. Synapses that were among the 20% most active synapses within their age group (high-activity synapses) are outlined in black. Frequently, highly active synapses were located in close proximity to other highly active synapses. (D) The mean transmission frequency of synapses was higher at synapses that were located nearby high-activity synapses. A clear drop in transmission frequency was observed at distances larger than 10 µm from the nearest high-activity synapse. In parentheses, the number of synapses averaged for each distance bin are shown. Gray area represents SEMs. (E) The mean transmission frequency was higher at synapses that were located within 10 µm of a high-activity synapse than at synapses farther away from high-activity synapses (Student’s t-test for independent samples, two-sided, n = 181 [<10 µm] and 173 [>10 µm] synapses; error bars: SEM). (F) Within each age group, synapses that were located within 10 µm from an high-activity synapse were more active than those that were located farther away from high-activity synapses (Student’s t-test for paired samples, two-sided).
Figure 6
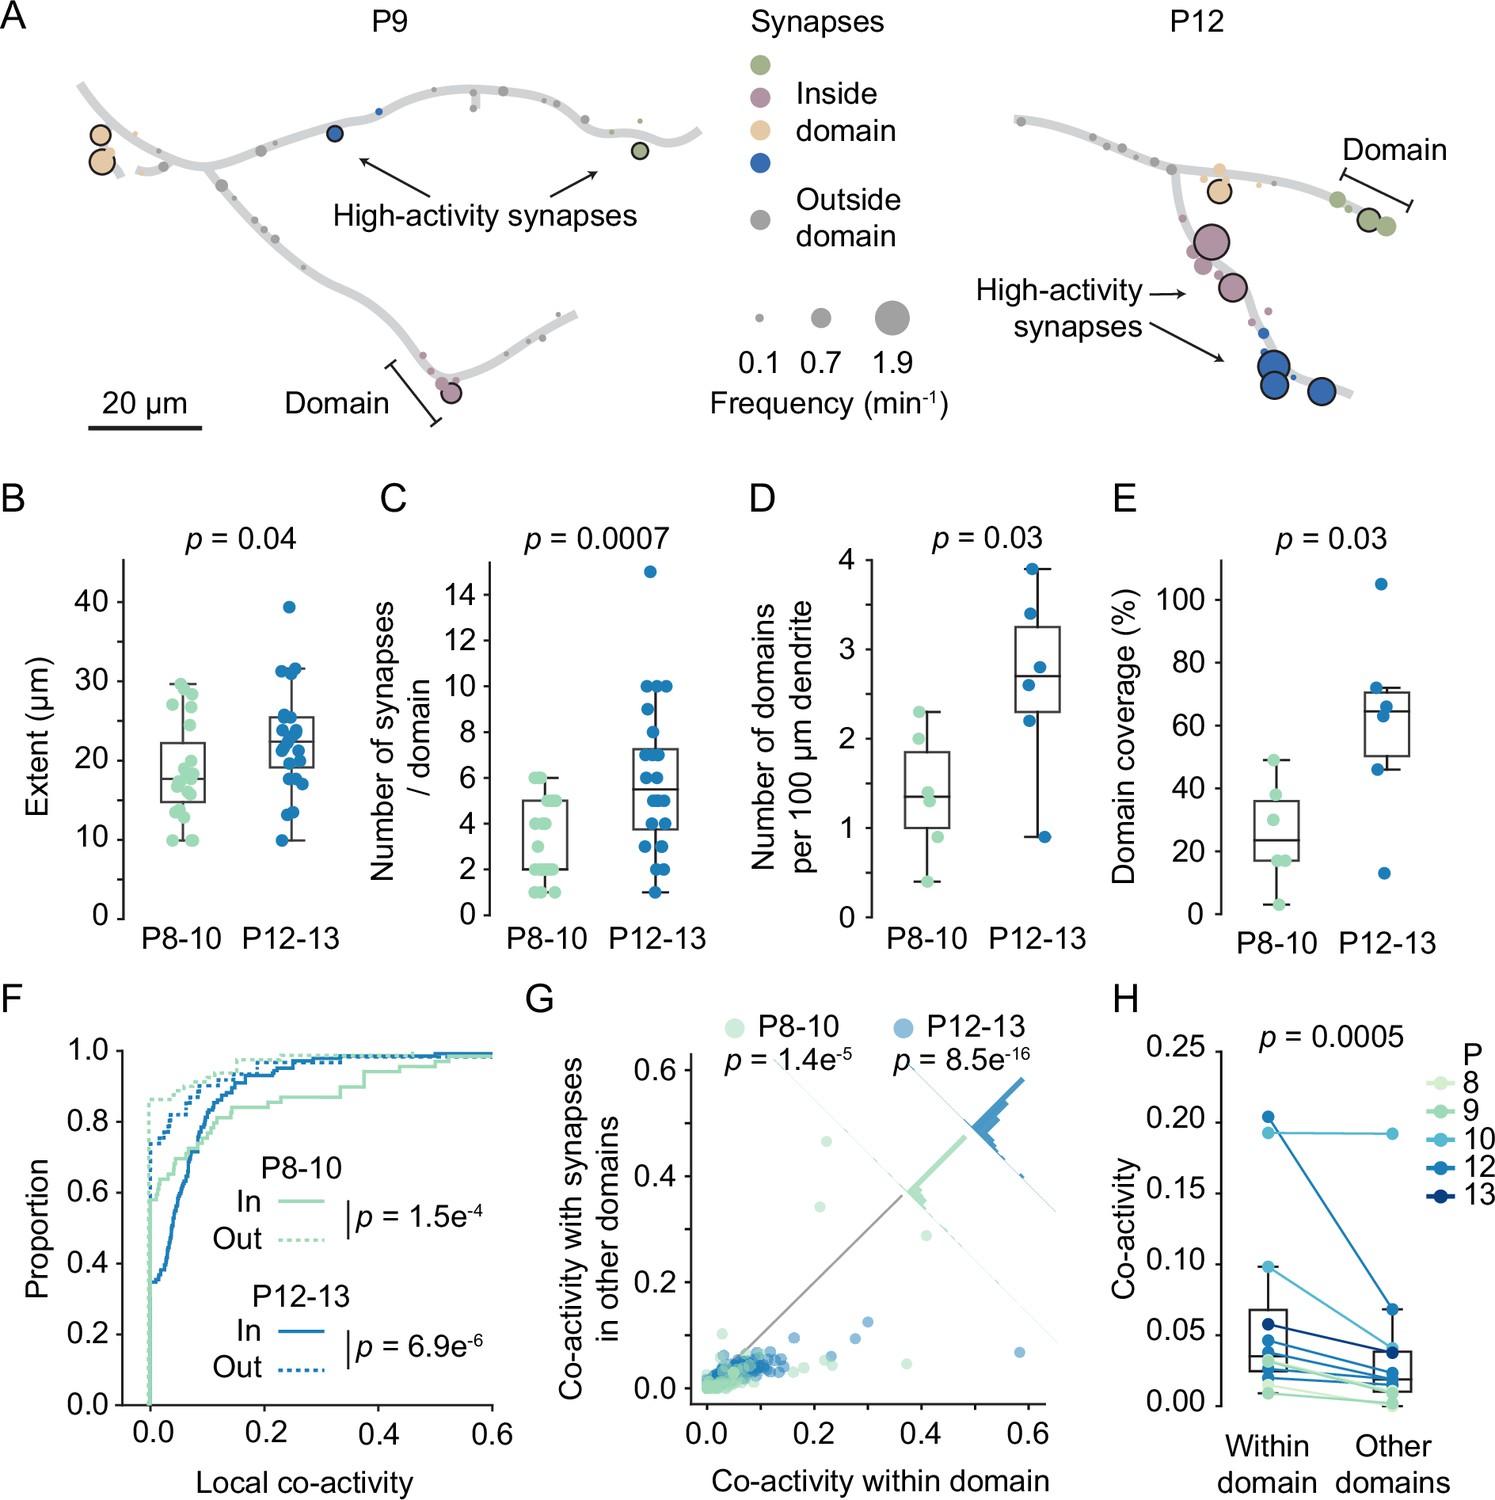
Domains of clustered synapses emerged during the second postnatal week.
(A) Graphical representation of layer 2/3 pyramidal cell dendrites at P9 (D3) and P12 (D7). Discs represent individual synapses. The disc size indicates synaptic transmission frequency, and high-activity synapses are labeled by black outlines. Individual domains are shown in different colors. Synapses located outside domains are shown in gray. (B, C) The extent of domains and the number of synapses increased during development. Each dot represents one domain (P8–10: N = 6 dendrites, P12–13: N = 6 dendrites; Student’s t-test for independent samples, two-sided, boxes indicate quartiles, and whiskers outline the entire distribution, except outliers). (D, E) The density of domains along dendrites and the fraction of dendrite covered by domains (E) increased with age. Each dot represents one dendrite (Student’s t-test for independent samples, two-sided, boxes indicate quartiles, and whiskers outline the entire distribution, except outliers). (F) Cumulative distributions of local co-activity values of all recorded synapses. The local co-activity of synapses inside domains was higher than that of outside-domain synapses (Mann–Whitney U test, two-sided, n = 213 [in domain] and 173 [outside domain] synapses; error bars: SEM). (G) Synapses in domains were more co-active with their domain neighbors than with synapses in other domains. Each dot represents the co-activity of a synapse with its neighbors within the domain and its co-activity with synapses in other domains (Wilcoxon signed-rank test). The histograms perpendicular to the equality line show the distribution of differences. (H) For each experiment, the co-activity of synapses within domains was higher than their co-activity with synapses in other domains (Wilcoxon signed-rank test).
Figure 7
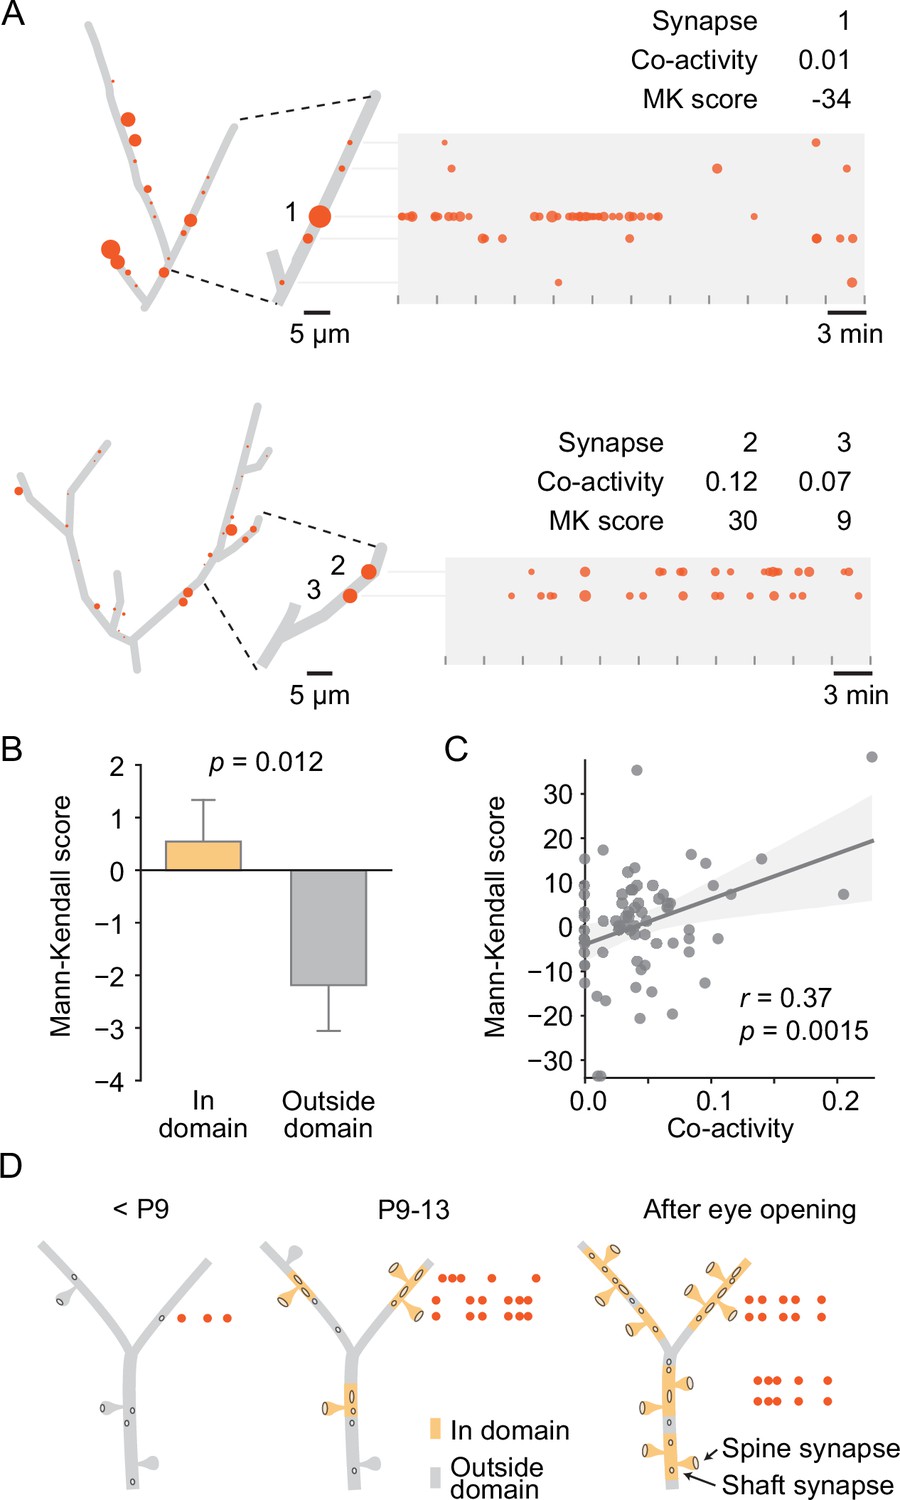
Local co-activity of synapses inside dendritic domains correlated with synaptic potentiation.
(A) Graphical representation of two layer 2/3 pyramidal cell dendrites at P12 (D5, D9). Left: red discs on each dendrite represent active synapses, and their size shows relative activity levels. Activity of synapse (1) was mostly out of sync with its neighbors as indicated by a low co-activity score. This synapse was very active at the beginning of the experiment and stopped transmitting toward the end, resulting in a low Mann–Kendall (MK) score, which indicates a monotonic decrease in synaptic activity. Synapses (2) and (3) showed higher local co-activity and increased in activity over time as evidenced by a positive MK score. Tick marks indicate durations of individual 3 min recordings. Red dots in the time plots represent individual synaptic transmission events. The size of each data point indicates the relative amplitude of each event. (B) The MK score, a measure of monotonic changes in synaptic transmission frequency, was higher for domain synapses than synapses located outside domains. (Student’s t-test for independent samples, two-sided, n = 213 [in domain] and 173 [outside domain] synapses from all ages; error bars: SEM). (C) The change in transmission frequency of a synapse was correlated with its local co-activity. Each dot represents one synapse with a transmission frequency of at least 0.6 min–1 (linear regression). (D) Model for the establishment of domains of clustered synaptic inputs in layer 2/3 neurons of the developing visual cortex. Until P8, only a few active synapses are scattered across the developing dendrites. During the second postnatal week, synapses become sorted into distinct domains where in-sync synapses become stabilized or potentiated, and desynchronized synapses undergo synaptic depression. By eye opening, most dendrites are covered by domains of synapses that are more co-active with each other than with synapses that are located in other domains.
Tables
Appendix 1—key resources table
| Reagent type (species) or resource | Designation | Source or reference | Identifiers | Additional information |
|---|---|---|---|---|
| Strain (Mus musculus, both sexes, postnatal days 8–13) | C57BL/6J | Janvier | SC-C57J-F | |
| Recombinant DNA reagent | GCaMP6s, cloned into pCAGGS (plasmid) | Douglas Kim; Chen et al., 2013 | Addgene 40753 | Calcium indicator |
| Recombinant DNA reagent | DsRed, cloned into pCAGGS (plasmid) | Christiaan Levelt | ||
| Software, algorithm | MATLAB scripts | This paper; Leighton et al., 2023 | https://figshare.com/articles/dataset/Domain_development/22674748 | |
| Software, algorithm | Jupyter Notebooks, Python | This paper; Leighton et al., 2023 | https://figshare.com/articles/dataset/Domain_development/22674748 |
Additional files
Download links
A two-part list of links to download the article, or parts of the article, in various formats.
Downloads (link to download the article as PDF)
Open citations (links to open the citations from this article in various online reference manager services)
Cite this article (links to download the citations from this article in formats compatible with various reference manager tools)
Clustered synapses develop in distinct dendritic domains in visual cortex before eye opening
eLife 12:RP93498.
https://doi.org/10.7554/eLife.93498.3


