Dynamic localization of the chromosomal passenger complex in trypanosomes is controlled by the orphan kinesins KIN-A and KIN-B
- Department of Biochemistry, University of Oxford, United Kingdom
- The Wellcome Centre for Cell Biology, Institute of Cell Biology, School of Biological Sciences, United Kingdom
Figures
Figure 1 with 1 supplement
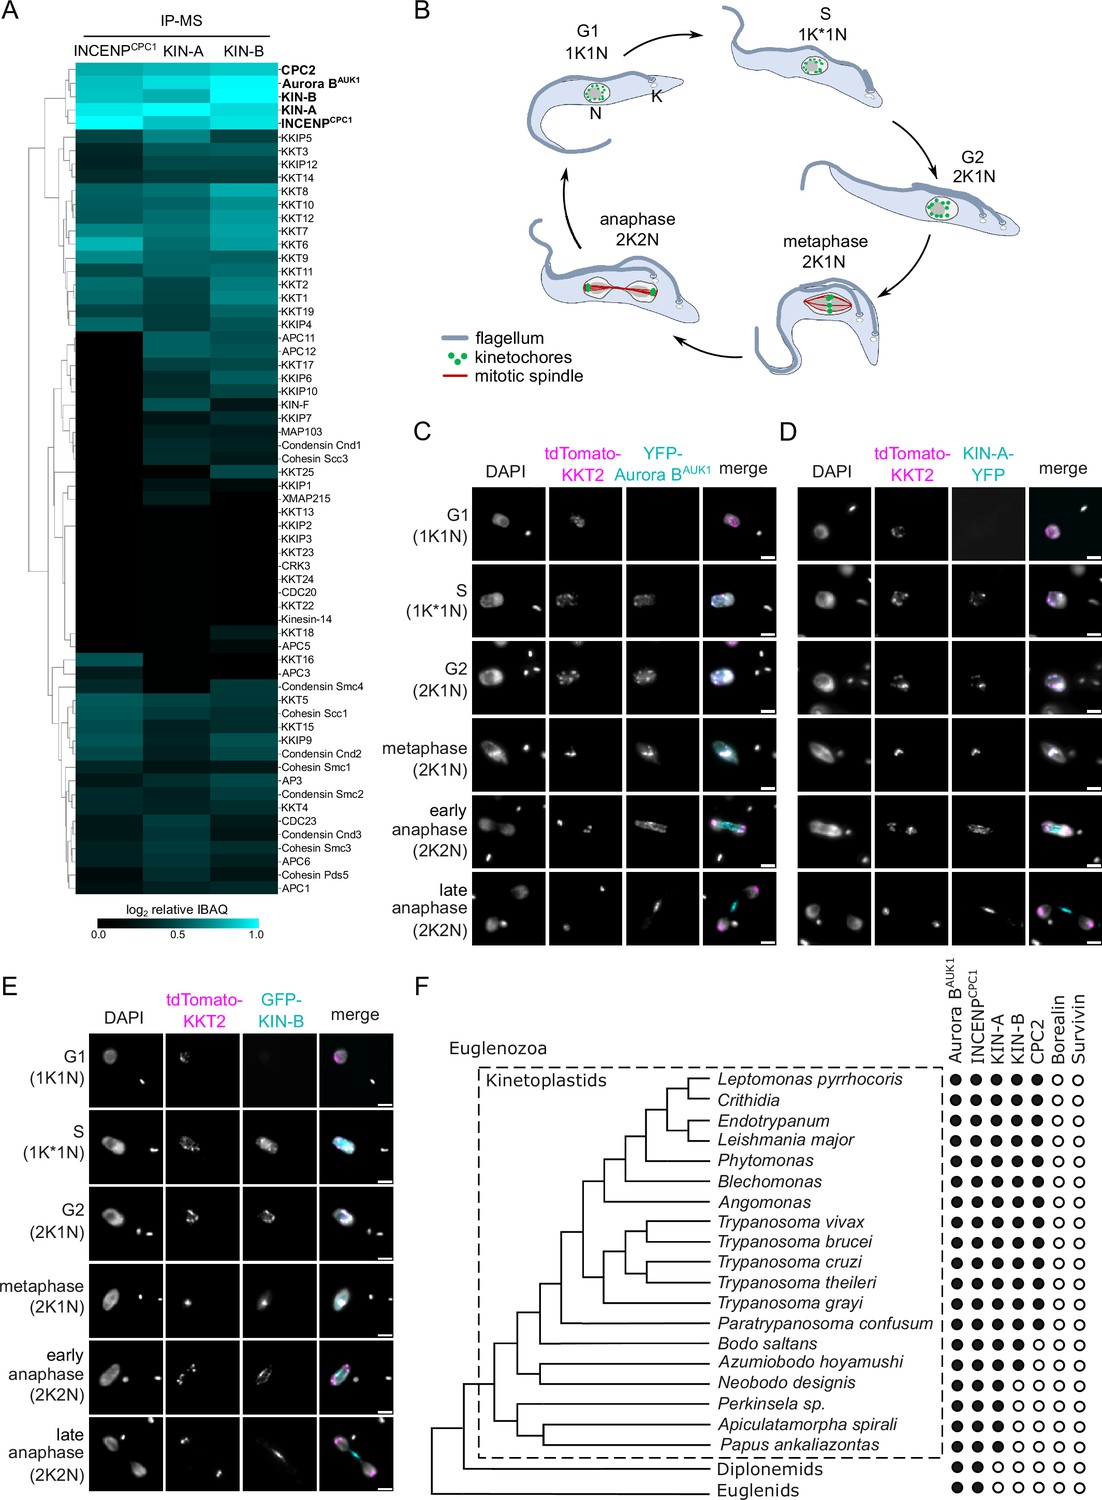
KIN-A and KIN-B are bona fide chromosomal passenger complex (CPC) proteins in T. brucei.
(A) Clustered heatmap showing enrichment (log2 intensity-based absolute quantification [IBAQ]) of mitotic proteins co-purifying with ectopically expressed GFP-INCENPCPC1, GFP-KIN-A, and GFP-KIN-B. The heatmap was generated using the Python Seaborn library using WPGMA clustering. Cell lines: BAP2190, BAP2286, BAP2288. Immunoprecipitation was performed using anti-GFP antibodies. See Supplementary file 2 for all proteins identified by mass spectrometry. (B) Cartoon depicting the kinetoplast (K)/nucleus (N) configuration throughout the cell cycle in procyclic T. brucei, with K* denoting an elongated kinetoplast. The kinetoplast is an organelle found uniquely in kinetoplastids, which contains the mitochondrial DNA and replicates and segregates prior to nuclear division. The KN configuration serves as a cell cycle marker (Siegel et al., 2008; Woodward and Gull, 1990). (C–E) Representative fluorescence micrographs showing the dynamic localization of YFP-Aurora BAUK1 (C), KIN-A-YFP (D), and GFP-KIN-B (E) over the course of the cell cycle. Kinetochores are marked with tdTomato-KKT2. DNA was stained with DAPI. Cell lines: BAP1515, BAP3066, BAP2288. Scale bars, 2 μm. (F) Phylogenetic tree of kinetoplastids, diplonemids, and euglenids along with the presence (black dots)/absence (white dots) patterns of CPC components. The phylogenetic tree of Euglenozoa is based on Butenko et al., 2020.
Figure 1—figure supplement 1
KIN-A and KIN-B are bona fide chromosomal passenger complex (CPC) proteins in T. brucei.
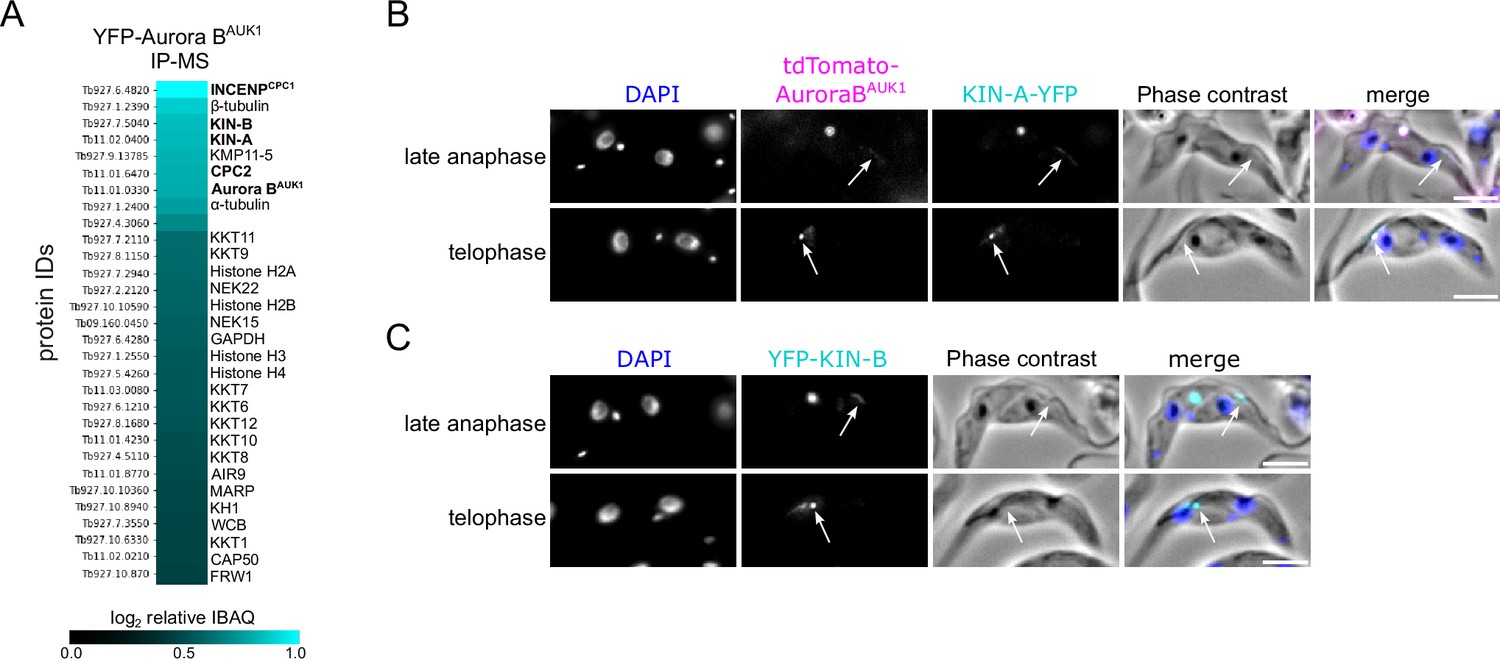
(A) Heatmap showing enrichment (log2 intensity-based absolute quantification [IBAQ]) of the top 30 proteins, excluding ribosomal proteins, co-purifying with YFP-Aurora BAUK1. Cell line: BAP73. Immunoprecipitation was performed using anti-GFP antibodies. See Supplementary file 2 for all proteins identified by mass spectrometry. (B and C) Representative fluorescence micrographs showing the localization of tdTomato-Aurora BAUK1 and KIN-A-YFP (B) and YFP-KIN-B (C) in late anaphase and telophase cells. Arrows indicate the population of CPC proteins localized to the new flagellum attachment zone (FAZ) tip. DNA was stained with DAPI. Cell lines: BAP3067, BAP2528. Scale bars, 2 μm.
Figure 2 with 1 supplement
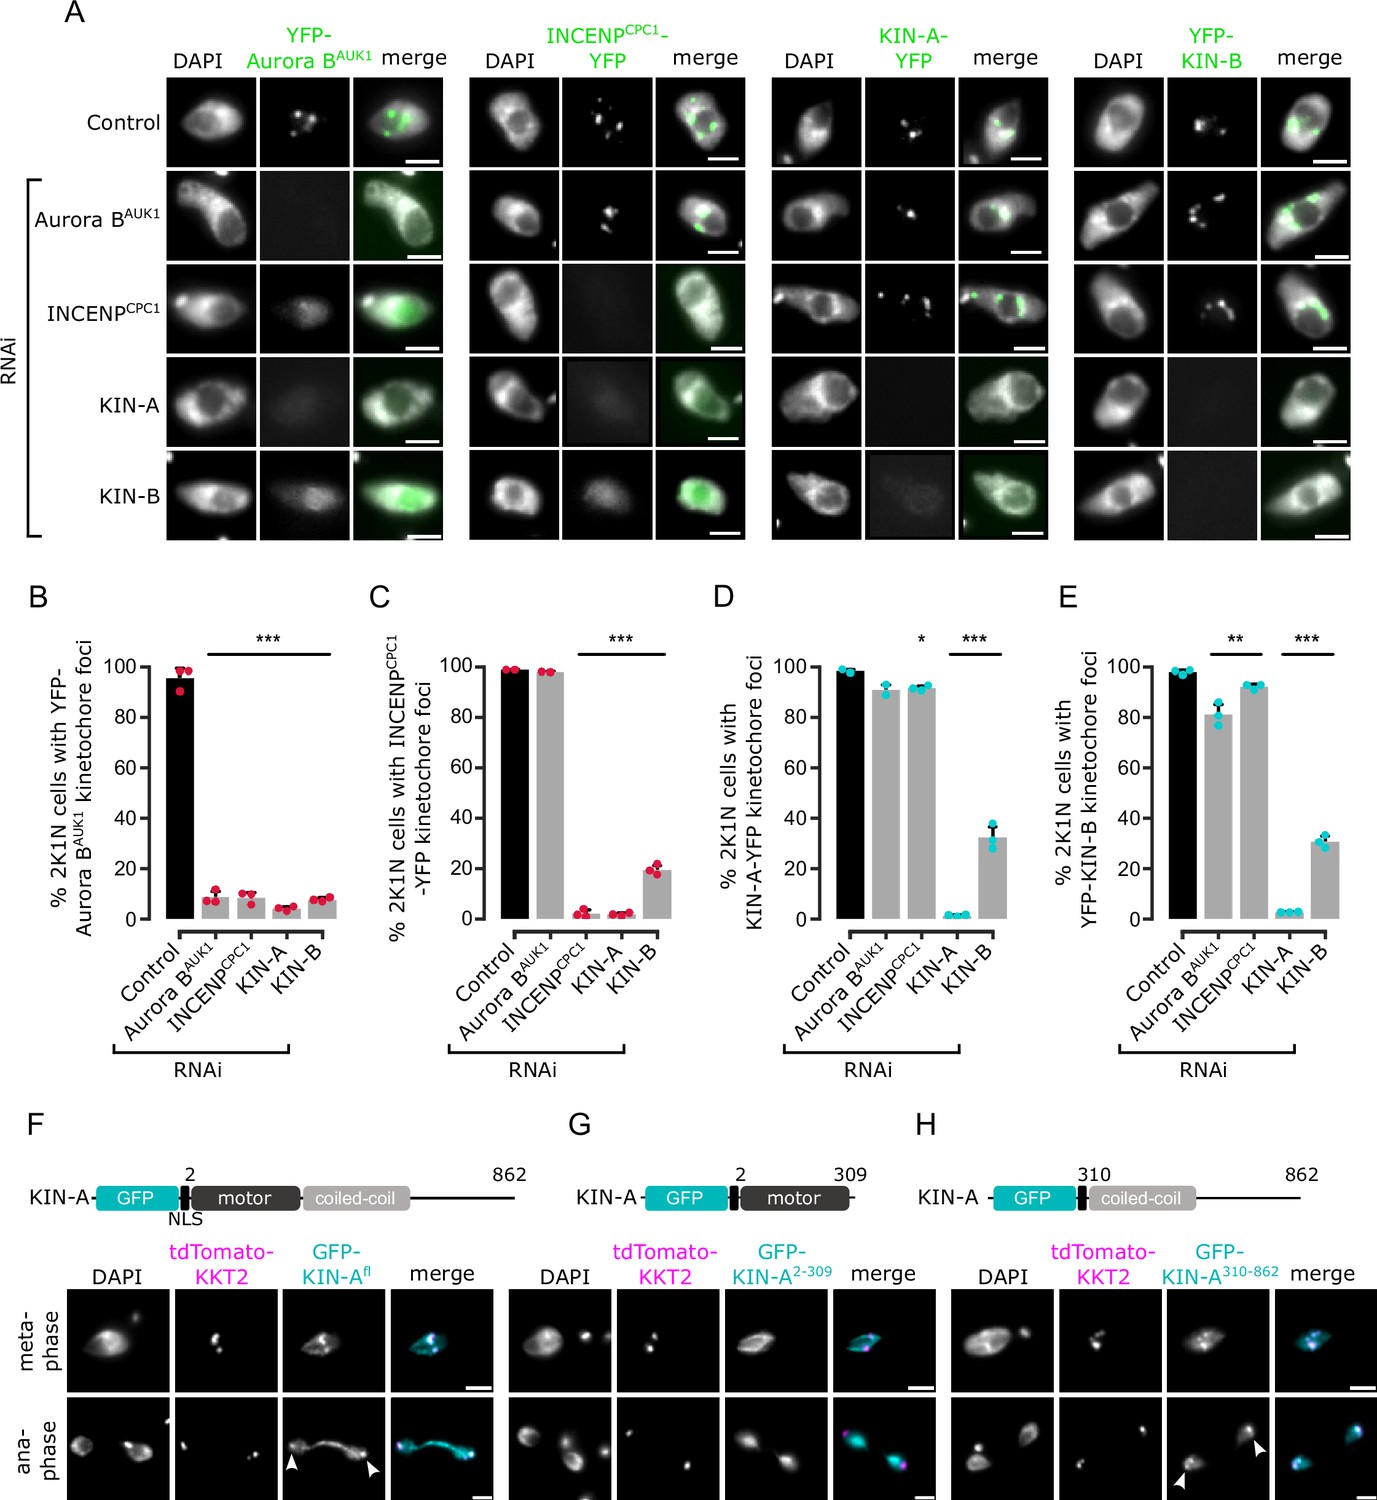
Kinetochore localization of the chromosomal passenger complex (CPC) depends on KIN-A and KIN-B.
(A) Representative fluorescence micrographs showing the localization of YFP-tagged Aurora BAUK1, INCENPCPC1, KIN-A, and KIN-B in 2K1N cells upon RNAi-mediated knockdown of indicated CPC subunits. Note that nuclear close-ups are shown here. CPC proteins were not detected in the cytoplasm. RNAi was induced with 1 μg/ml doxycycline for 24 hr (KIN-B RNAi) or 16 hr (all others). Cell lines: BAP3092, BAP2552, BAP2557, BAP3093, BAP2906, BAP2900, BAP2904, BAP3094, BAP2899, BAP2893, BAP2897, BAP3095, BAP3096, BAP2560, BAP2564, BAP3097. Scale bars, 2 μm. (B–E) Quantification of 2K1N cells that have kinetochore-like dots of YFP-tagged Aurora BAUK1 (B), INCENPCPC1 (C), KIN-A (D), and KIN-B (E) upon RNAi-mediated depletion of indicated CPC components. All graphs depict the means (bar) ± SD of at least two replicates (shown as dots). A minimum of 100 cells per replicate were quantified. *p<0.05, **p≤0.01, ***p≤0.001 (two-sided, unpaired t-test). (F–H) Representative fluorescence micrographs showing the localization of ectopically expressed GFP-KIN-Afl (F), -KIN-A2-309 (G), and -KIN-A310-862 (H). Expression of GFP fusion proteins was induced with 10 ng/ml doxycycline for 24 hr. Kinetochores are marked with tdTomato-KKT2. Arrowheads indicate KIN-Afl and KIN-A310-862 signals at kinetochores in anaphase. KIN-A2-309 localizes to the mitotic spindle during (pro)metaphase. Cell lines: BAP2286, BAP2297, BAP2287. Scale bars, 2 μm.
Figure 2—figure supplement 1
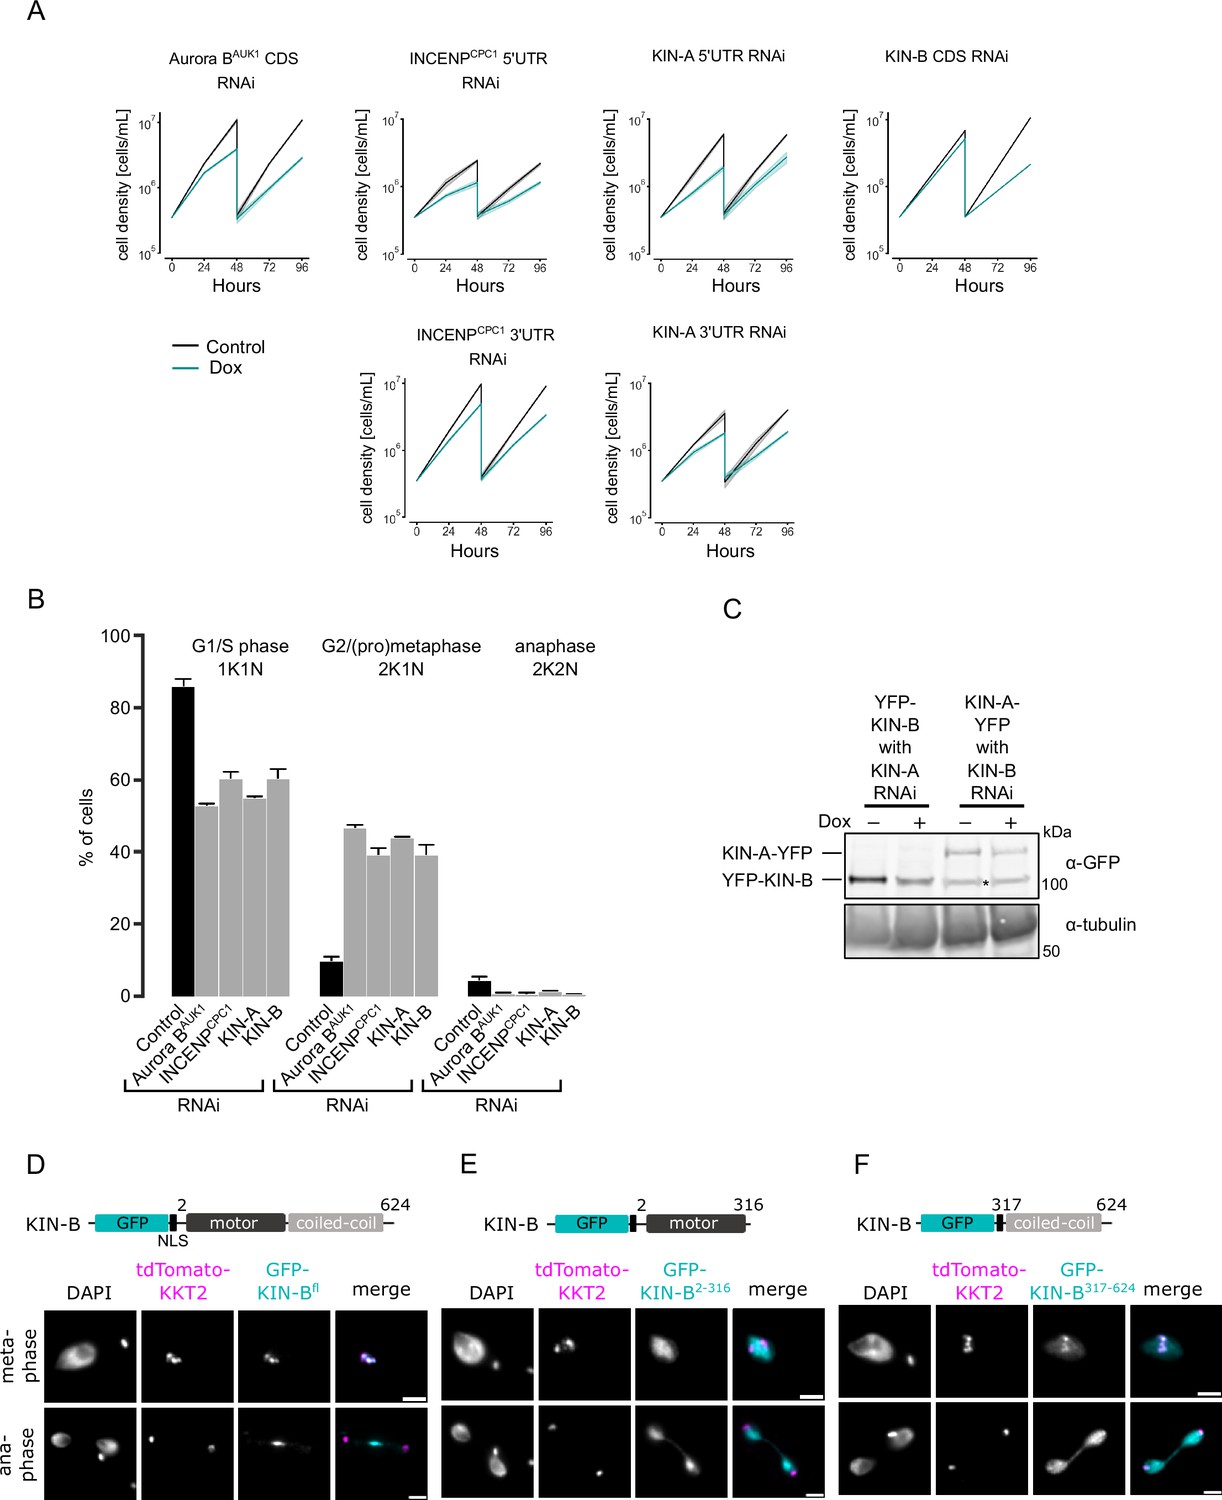
Depletion of chromosomal passenger complex (CPC) proteins causes growth defects and cell cycle arrest.
(A) Growth curves upon RNAi-mediated knockdown of indicated CPC subunits. Data are presented as the mean ± SD of at least three replicates. RNAi was induced with 1 μg/ml doxycycline and cultures were diluted at day 2. CDS stands for coding sequence, UTR for untranslated region. Cell lines: BAP941, BAP2250, BAP2251, BAP2557, BAP2558, BAP3076. (B) Cell cycle profiles upon knockdown of indicated CPC subunits. RNAi was induced with 1 μg/ml doxycycline and cells were fixed at 16 hr (for Aurora BAUK1, INCENPCPC1, and KIN-A RNAi) or 24 hr (CPC2 and KIN-B RNAi). All graphs depict the means (bar) ± SD of at least two replicates. A minimum of 150 cells per replicate were quantified. Cell lines: BAP3092, BAP2554, BAP2557, BAP3093. (C) Western blot showing levels of YFP-tagged KIN-A or KIN-B upon RNAi-mediated knockdown of KIN-B and KIN-A, respectively. Note that the KIN-A RNAi cell line expresses YFP-KIN-B, whereas the KIN-B RNAi cell line expresses KIN-A-YFP. RNAi was induced with 1 μg/ml doxycycline for 16 hr (KIN-A) or 24 hr (KIN-B). Proteins were detected using anti-GFP antibodies. Asterisk indicates unspecific band. Cell lines: BAP3095, BAP2564. Raw, uncropped blots are shown in Figure 2—figure supplement 1—source data 1 and 2. (D–F) Representative fluorescence micrographs showing the localization of ectopically expressed GFP-KIN-Bfl (D), -KIN-B2-316 (E), and -KIN-B317-624 (F). Expression of GFP fusion proteins was induced with 10 ng/ml doxycycline for 24 hr. Kinetochores are marked with tdTomato-KKT2. Cell lines: BAP2288, BAP2289, BAP2290. Scale bars, 2 μm.
-
Figure 2—figure supplement 1—source data 1
Original scans of the western blot analysis (anti-GFP and anti-tubulin) in Figure 2—figure supplement 1C.
- https://cdn.elifesciences.org/articles/93522/elife-93522-fig2-figsupp1-data1-v1.zip
-
Figure 2—figure supplement 1—source data 2
PDF containing the uncropped, original scans of the western blot analysis (anti-GFP and anti-tubulin) in Figure 2—figure supplement 1C with highlighted bands and sample labels.
- https://cdn.elifesciences.org/articles/93522/elife-93522-fig2-figsupp1-data2-v1.zip
Figure 3 with 1 supplement
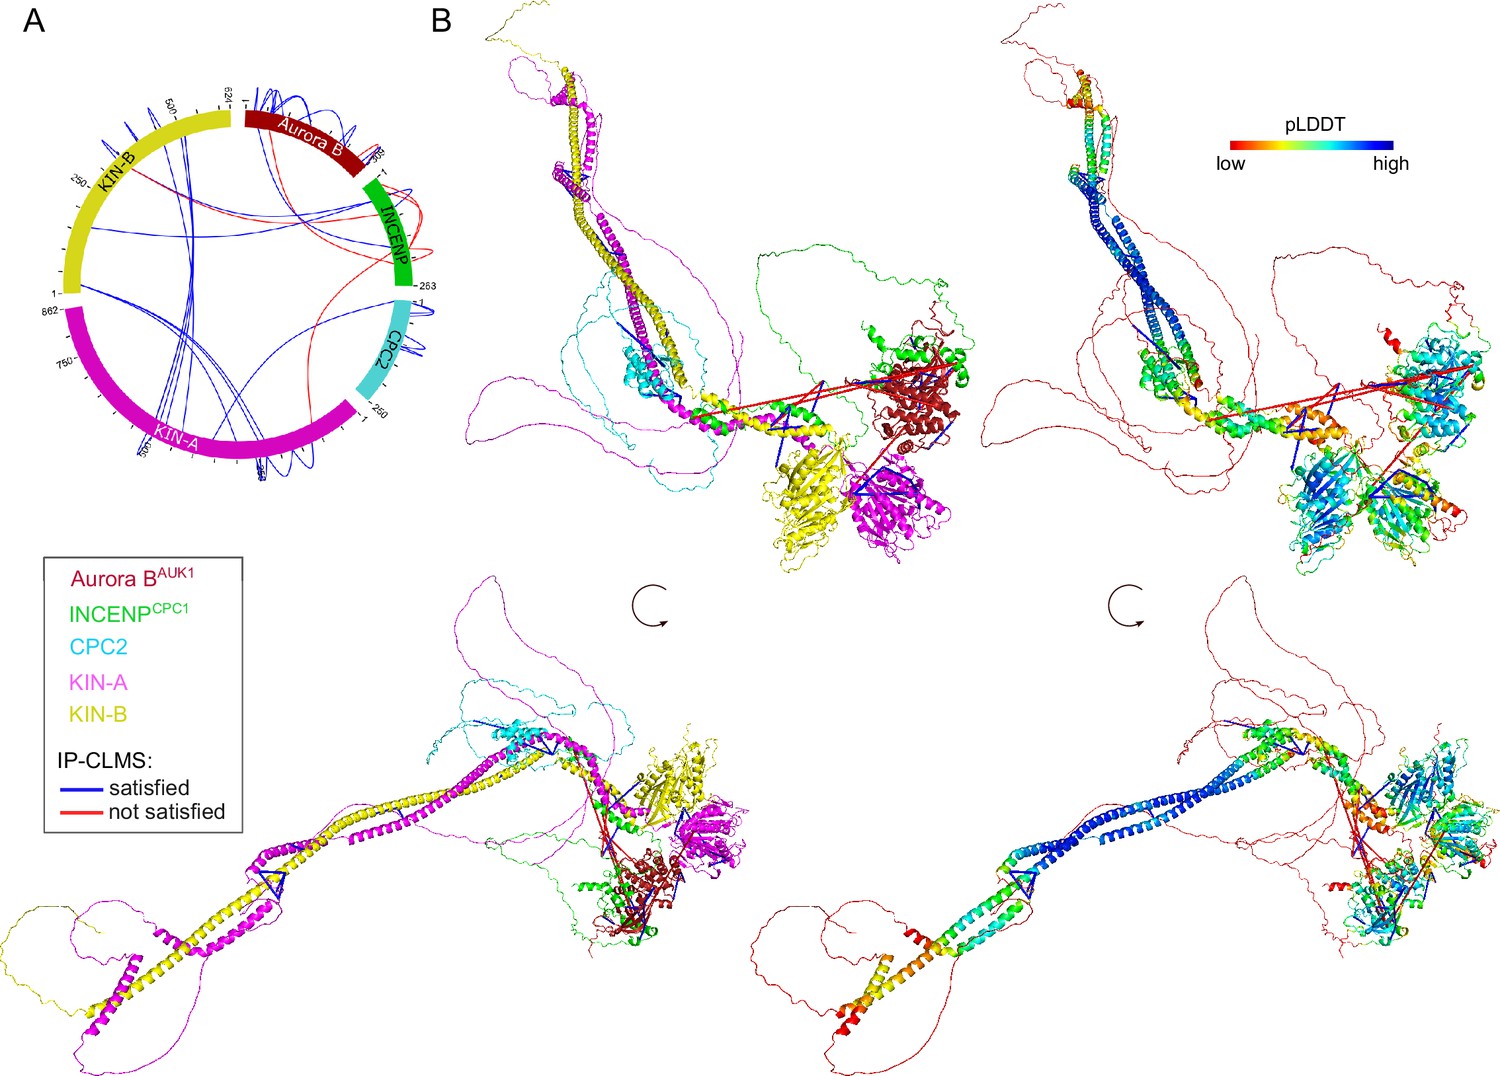
Structural model of the trypanosome chromosomal passenger complex (CPC).
(A) Circular view of the bis(sulfosuccinimidyl) suberate (BS3) crosslinks observed between the subunits of the trypanosome CPC, obtained from native complexes isolated by immunoprecipitation of YFP-Aurora BAUK1 (cell line: BAP2198). pLink2 (Chen et al., 2019) was used to obtain crosslinks from mass spectrometry data. xiView (Graham et al., 2019) was used for data visualization. Only crosslinks with a score better than e–3 are shown. See Supplementary file 2 for all crosslinks identified by mass spectrometry. (B) Cartoon representation showing two orientations of the trypanosome CPC, colored by protein on the left (Aurora BAUK1: crimson, INCENPCPC1: green, CPC2: cyan, KIN-A: magenta, and KIN-B: yellow) or according to their pLDDT values on the right, assembled from AlphaFold2 predictions shown in Figure 3—figure supplement 1. The pLDDT score is a per-residue estimate of the confidence in the AlphaFold prediction on a scale from 0 to 100. pLDDT >70 (blue, cyan) indicates a reasonable accuracy of the model, while pLDDT <50 (red) indicates a low accuracy and often reflects disordered regions of the protein (Jumper et al., 2021). BS3 crosslinks in (B) were mapped onto the model using PyXlinkViewer (blue = distance constraints satisfied, red = distance constraints violated, Cα-Cα Euclidean distance threshold = 30 Å) (Schiffrin et al., 2020).
Figure 3—figure supplement 1
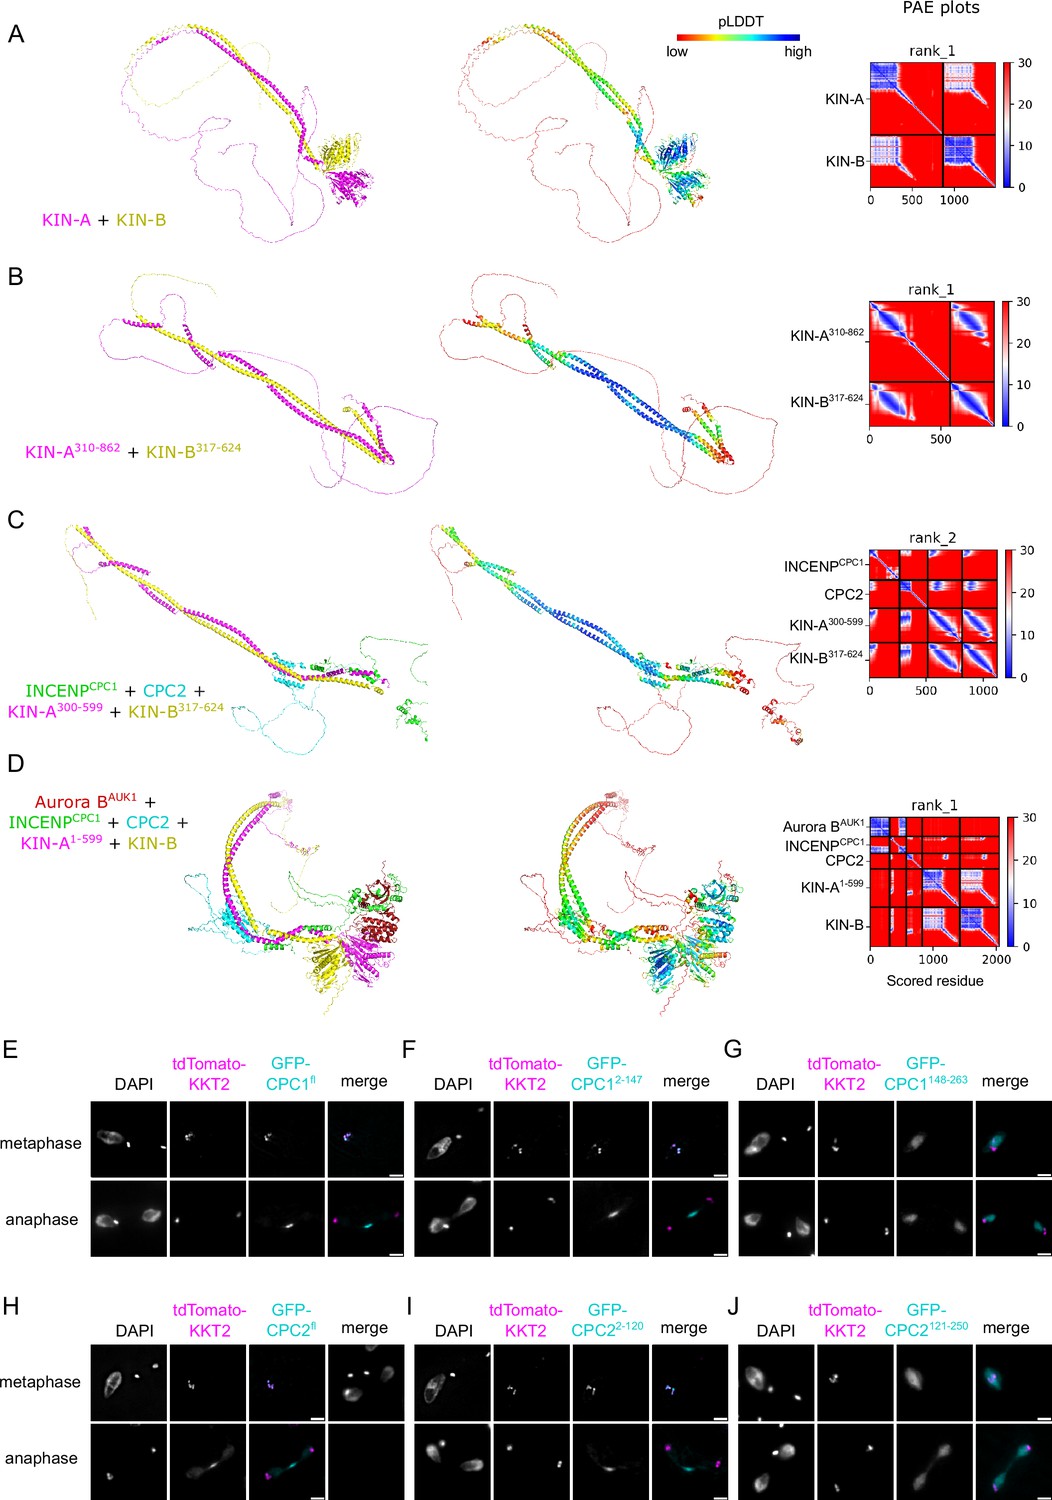
AlphaFold2 models of chromosomal passenger complex (CPC) subcomplexes and localization of CPC protein 1 (CPC1) and CPC2 truncations.
(A–D) Cartoon representations colored by protein (left) and pLDDT (center), and predicted aligned error (PAE) plots (right) of AlphaFold2 predictions for indicated CPC subcomplexes. (E–J) Representative fluorescence micrographs showing the localization of ectopically expressed GFP-INCENPCPC1 fl (E), -INCENPCPC1 2-147 (F), -INCENPCPC1 148-263 (G), -CPC2fl (H), -CPC22-120 (I), and -CPC2121-250 (J) in metaphase and anaphase. Expression of GFP fusion proteins was induced with 10 ng/ml doxycycline for 24 hr. Kinetochores are marked with tdTomato-KKT2. Cell lines: BAP2190, BAP2191, BAP2193, BAP2194, BAP2195, BAP2196. Scale bars, 2 μm.
Figure 4 with 2 supplements
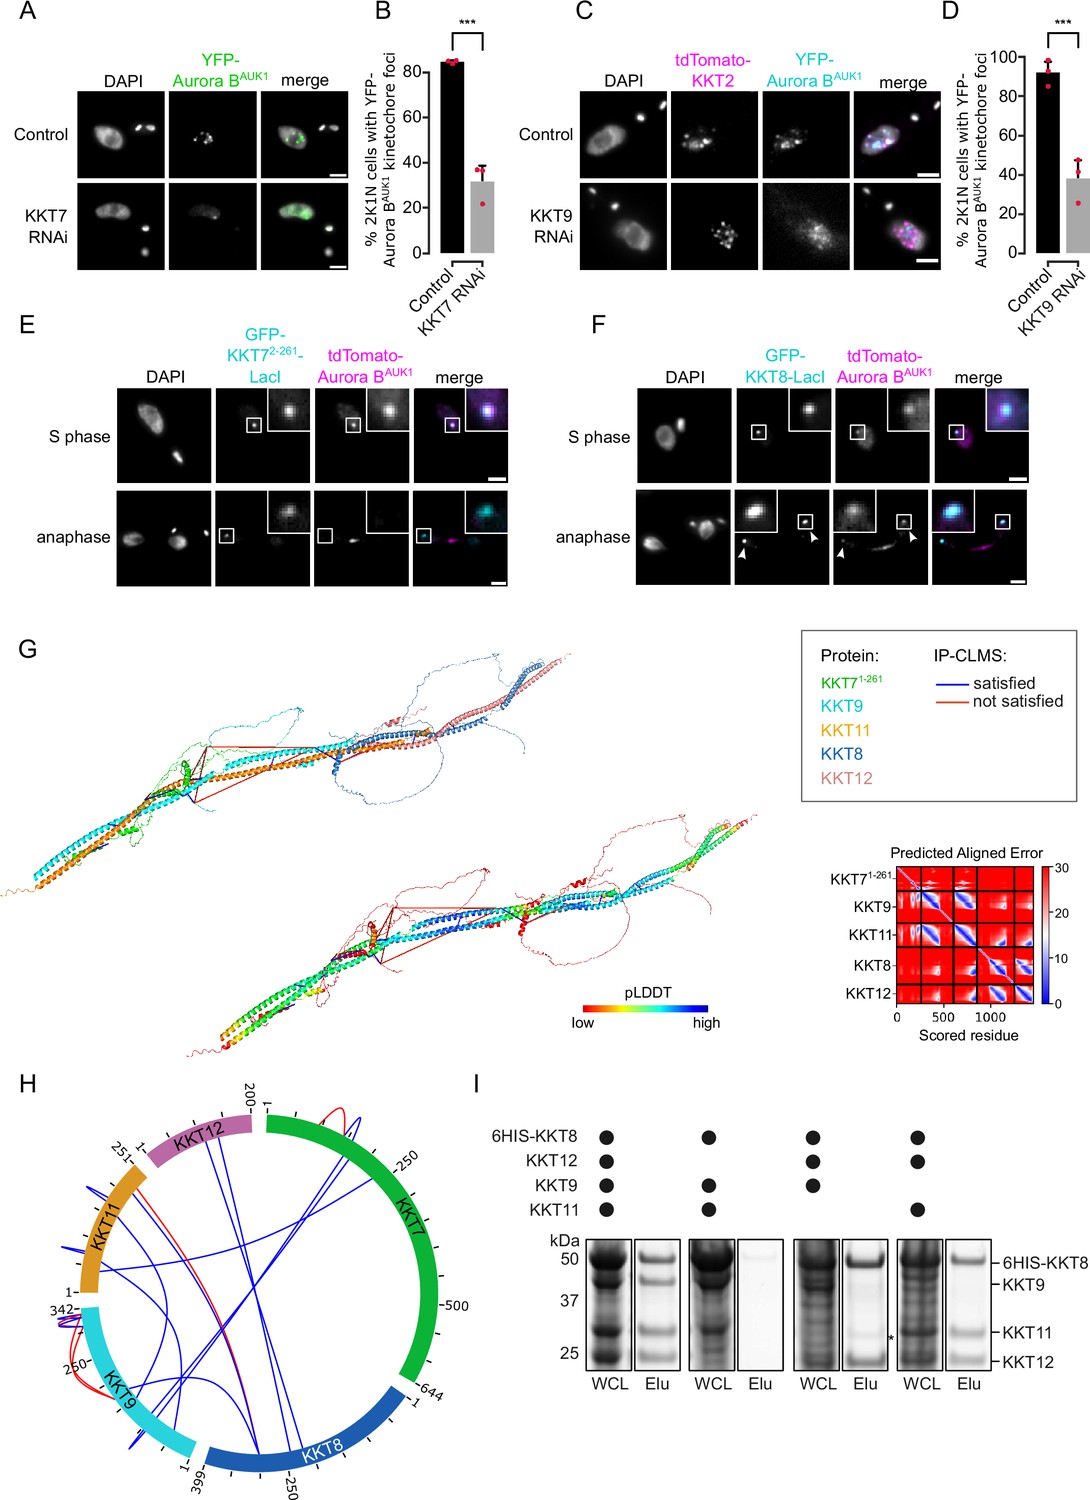
The chromosomal passenger complex (CPC) is recruited to kinetochores via the KKT7-KKT8 complex pathway.
(A) Representative fluorescence micrographs showing the localization of YFP-Aurora BAUK1 upon RNAi-mediated knockdown of KKT7. RNAi was induced with 1 μg/ml doxycycline for 24 hr. Cell line: BAP577. Scale bars, 2 μm. (B) Quantification of 2K1N cells that have kinetochore-like dots of YFP-Aurora BAUK1 upon knockdown of KKT7. All graphs depict the means (bar) ± SD of three replicates (shown as dots). A minimum of 50 cells per replicate were quantified. ***p≤0.001 (two-sided, unpaired t-test). (C) Representative fluorescence micrographs showing the localization of YFP-Aurora BAUK1 upon RNAi-mediated knockdown of KKT9. RNAi was induced with 1 μg/ml doxycycline for 24 hr. Kinetochores are marked with tdTomato-KKT2. Cell line: BAP2276. Scale bars, 2 μm. (D) Quantification of 2K1N cells that have kinetochore-like dots of YFP-Aurora BAUK1 upon knockdown of KKT9. All graphs depict the means (bar) ± SD of three replicates (shown as dots). A minimum of 50 cells per replicate were quantified. ***p≤0.001 (two-sided, unpaired t-test). (E and F) Representative micrographs of cells in S phase and anaphase showing recruitment of tdTomato-Aurora BAUK1 to LacO foci marked by ectopically expressed GFP-KKT72-261-LacI (E) or -KKT8-LacI (F). The insets show the magnification of the boxed region. Expression of LacI fusion proteins was induced with 10 ng/ml doxycycline for 24 hr. Arrowheads in (F) indicate anaphase kinetochore localization of GFP-KKT8-LacI and tdTomato-Aurora BAUK1. Anaphase kinetochore localization of tdTomato-Aurora BAUK1 was observed in 75% of anaphase cells expressing GFP-KKT8-LacI (n=28). Cell lines: BAP1395, BAP2640. Scale bars, 2 μm. Of note, LacI fusions with INCENPCPC1, KIN-A, and KIN-B constructs robustly localized to kinetochores like their endogenous counterparts and failed to form distinct LacI foci and could therefore not be used to assess ectopic recruitment of KKT proteins. (G) AlphaFold2 model of the KKT7-KKT8 complex, colored by protein (KKT71-261: green, KKT8: blue, KKT12: pink, KKT9: cyan, and KKT11: orange) (left) and by pLDDT (center). Bis(sulfosuccinimidyl) suberate (BS3) crosslinks in (H) were mapped onto the model using PyXlinkViewer (Schiffrin et al., 2020) (blue = distance constraints satisfied, red = distance constraints violated, Cα-Cα Euclidean distance threshold = 30 Å). Right: Predicted aligned error (PAE) plot of model shown on the left (rank_2). The color indicates AlphaFold’s expected position error (blue = low, red = high) at the residue on the x axis if the predicted and true structures were aligned on the residue on the y axis (Jumper et al., 2021). (H) Circular view of the BS3 crosslinks observed among KKT7 and KKT8 complex subunits, obtained from native complexes isolated by immunoprecipitation of YFP-tagged KKIP1 (cell line: BAP710). pLink2 (Chen et al., 2019) was used to obtain crosslinks from mass spectrometry data and xiView (Graham et al., 2019) was used for data visualization. Only crosslinks with a score better than e–3 are shown. See Supplementary file 2 for all crosslinks identified by mass spectrometry. (I) Indicated combinations of 6HIS-tagged KKT8 (~46 kDa), KKT9 (~39 kDa), KKT11 (~29 kDa), and KKT12 (~23 kDa) were co-expressed in Escherichia coli, followed by metal affinity chromatography and SDS-PAGE. The asterisk indicates a common contaminant. Raw, uncropped gels are shown in Figure 4—source data 1 and 2.
-
Figure 4—source data 1
Original scans of the SimplyBlue-stained SDS-PAGE gel in Figure 4I.
- https://cdn.elifesciences.org/articles/93522/elife-93522-fig4-data1-v1.zip
-
Figure 4—source data 2
PDF containing the uncropped, original scans of the SimplyBlue-stained SDS-PAGE gel in Figure 4I with highlighted bands and sample labels.
- https://cdn.elifesciences.org/articles/93522/elife-93522-fig4-data2-v1.zip
Figure 4—figure supplement 1
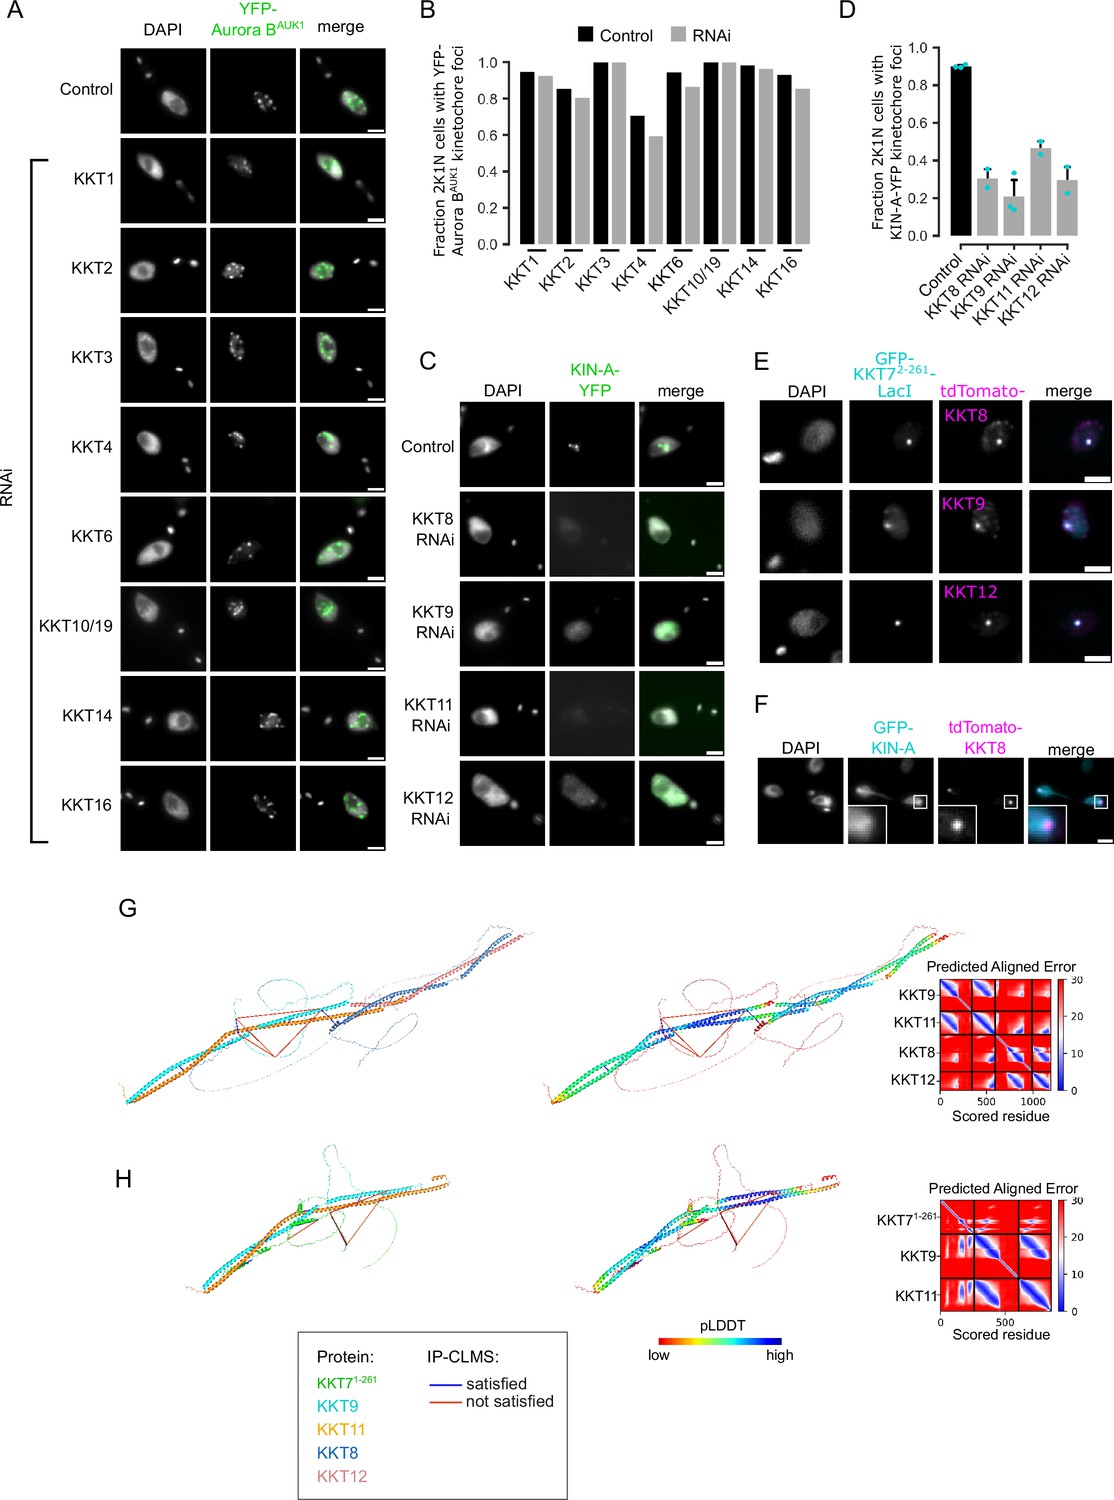
Kinetochore localization of Aurora BAUK1 and KIN-A depends on the KKT7-KKT8 complex pathway.
(A) Representative fluorescence micrographs showing the localization of YFP-Aurora BAUK1 upon RNA-mediated knockdown of indicated KKT proteins. RNAi was induced with 1 μg/ml doxycycline for 24 hr. Cell lines: BAP3132, BAP576, BAP2551, BAP2550, BAP3133, BAP1019, BAP2549, BAP2446. Scale bars, 2 μm. (B) Quantification of 2K1N cells that have kinetochore-like dots of YFP-Aurora BAUK1 upon knockdown of indicated KKT proteins. A minimum of 40 cells per replicate were examined. (C) Representative fluorescence micrographs showing the localization of KIN-A-YFP upon RNA-mediated knockdown of KKT8 complex subunits. RNAi was induced with 1 μg/ml doxycycline for 24 hr. Cell lines: BAP2970, BAP2968, BAP2969, BAP2971. Scale bars, 2 μm. (D) Quantification of 2K1N cells that have kinetochore-like dots of KIN-A-YFP upon knockdown of indicated KKT8 complex subunits. All graphs depict the means (bar) ± SD of at least two replicates (shown as dots). A minimum of 50 cells per replicate were quantified. (E) Representative micrographs showing recruitment of tdTomato-tagged KKT8, KKT9, and KKT12 to LacO foci marked by ectopically expressed GFP-KKT72-261-LacI. Expression of GFP fusion proteins was induced with 10 ng/ml doxycycline for 24 hr. Cell lines: BAP871, BAP873, BAP874. Scale bars, 2 μm. (F) Representative fluorescence micrograph of an anaphase cell showing localization of tdTomato-KKT8 and ectopically expressed GFP-KIN-A. The insets show the magnification of the boxed region. Expression of GFP-KIN-A was induced with 10 ng/ml doxycycline for 24 hr. Cell line: BAP3080. Scale bars, 2 μm. (G and H) Cartoon representations colored by protein (left) and pLDDT (center), and PAE plots (right) of AlphaFold2 predictions for indicated protein complexes.
Figure 4—figure supplement 2
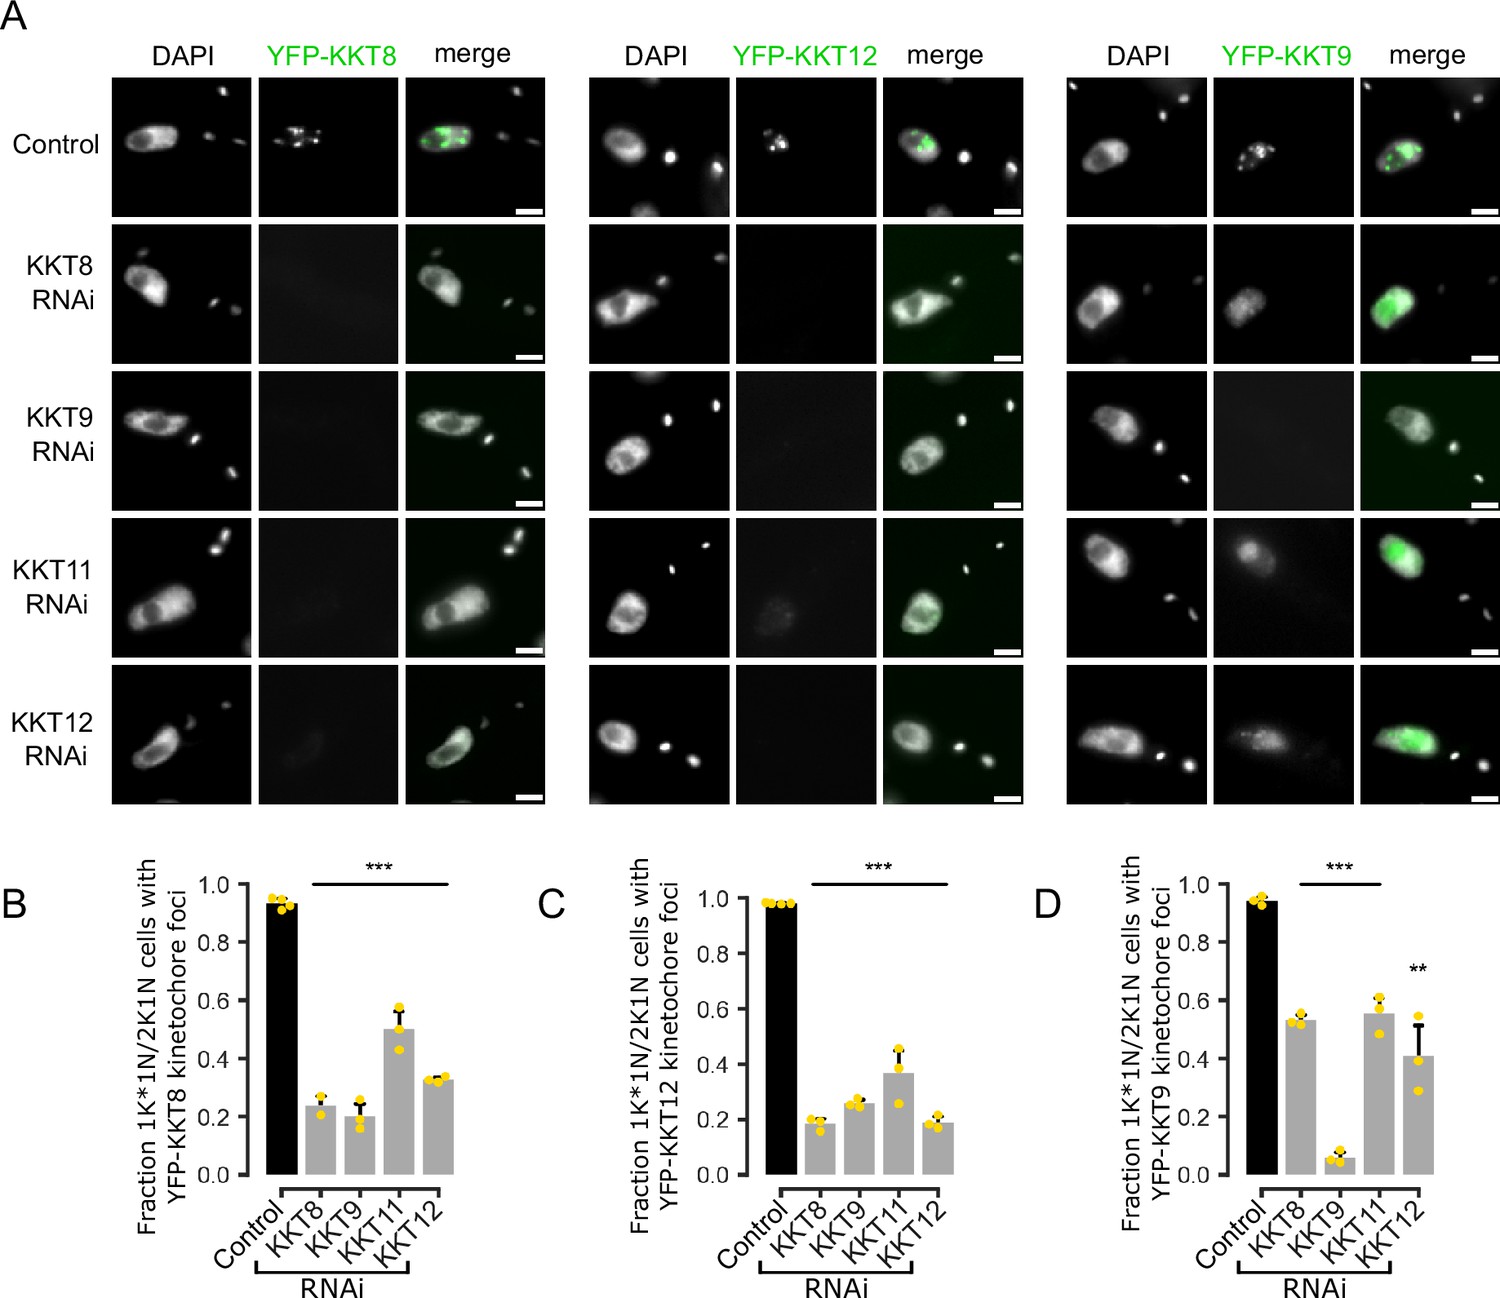
Co-dependencies of KKT8 complex subunits for kinetochore localization.
(A) Representative fluorescence micrographs showing localization of YFP-tagged KKT8, KKT12, and KKT9 upon RNAi-mediated knockdown of indicated KKT8 complex subunits. RNAi was induced with 1 μg/ml doxycycline for 24 hr. Cell lines: BAP2954, BAP2952, BAP2953, BAP2955, BAP2966, BAP2964, BAP2965, BAP2967, BAP2958, BAP2956, BAP2957, BAP2959. Scale bars, 2 μm. (B–D) Quantification of 1K*1N and 2K1N cells that have kinetochore-like dots of YFP-tagged KKT8 (B), KKT12 (C), and KKT9 (D) upon knockdown of indicated KKT8 complex subunits. All graphs depict the means (bar) ± SD of at least three technical replicates (shown as dots) from one experiment. A minimum of 100 cells per replicate were quantified. **p≤0.01, ***p≤0.001 (two-sided, unpaired t-test).
Figure 5 with 2 supplements
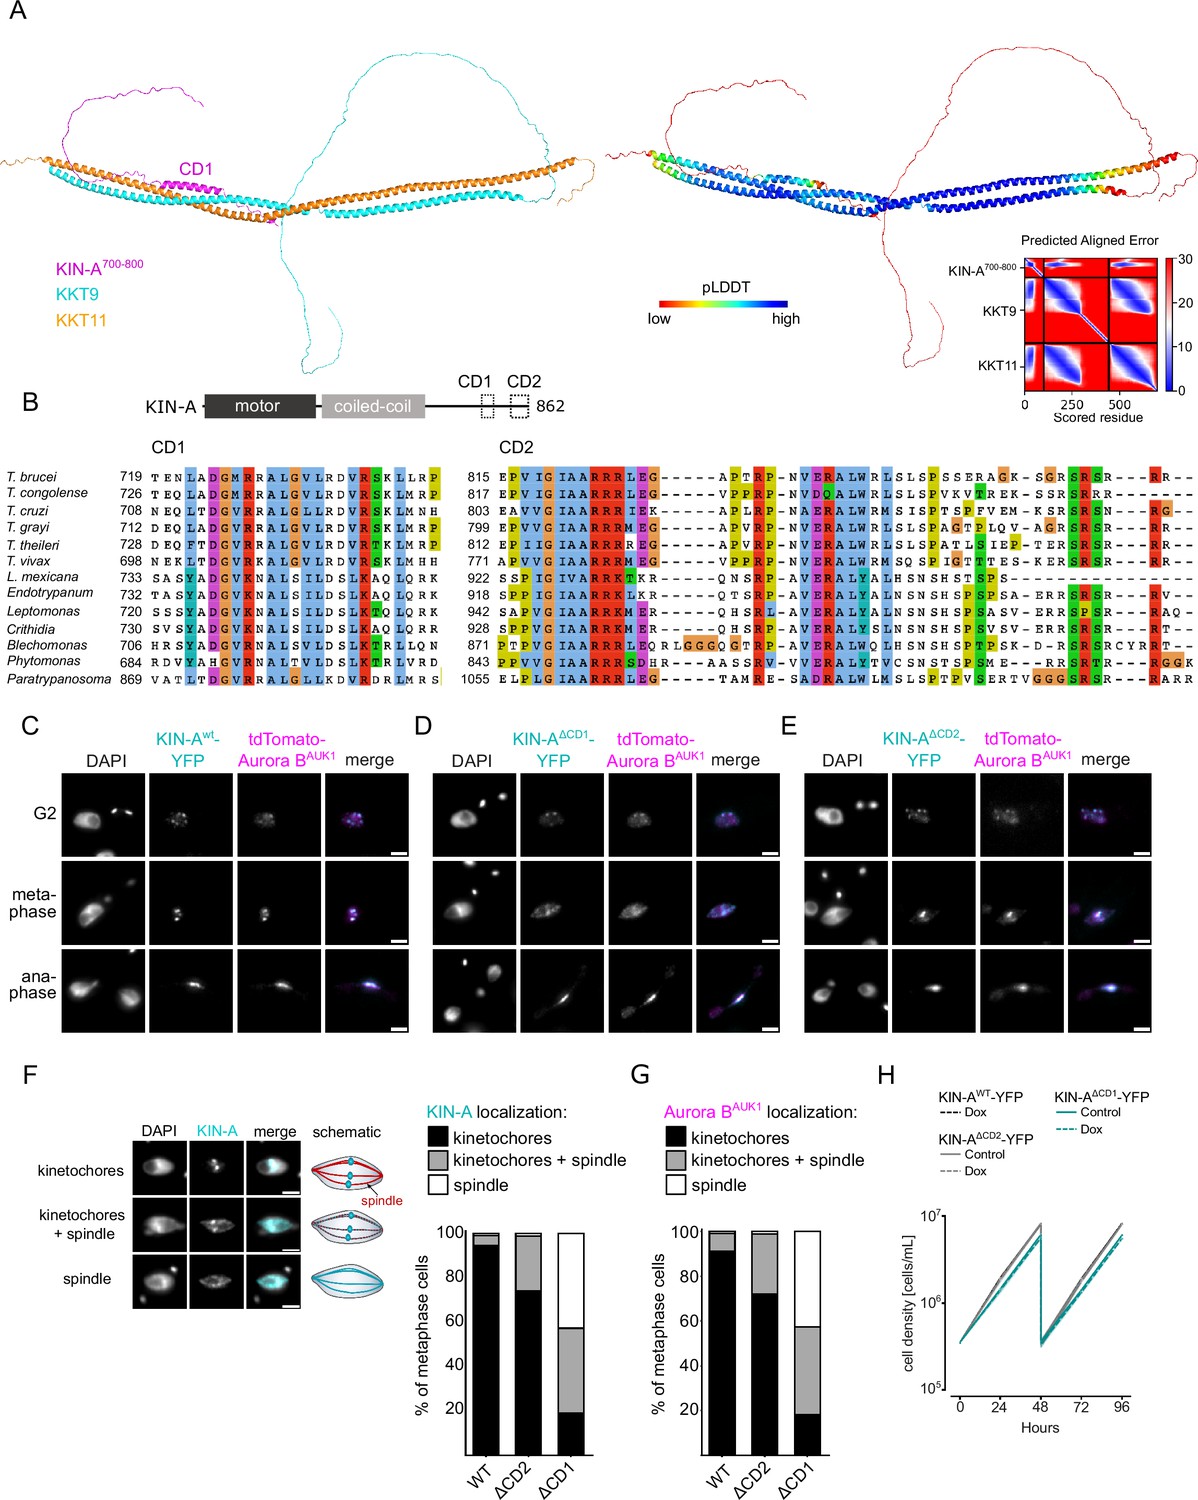
Two conserved domains within the C-terminal tail of KIN-A promote kinetochore recruitment of the chromosomal passenger complex (CPC).
(A) Left: AlphaFold2 model of KKT9:KKT11 in complex with KIN-A700-800. Cartoon representations are colored by protein (KKT9: cyan, KKT11: orange, KIN-A: magenta) (left) or according to their pLDDT values (blue = high confidence, red = low confidence) (center). Right: Predicted aligned error (PAE) plot of model (rank_1) predicted by AlphaFold2 (blue = high confidence, red = low confidence in the relative positions of the domains to one another). Conserved domain 1 (CD1) of KIN-A was predicted to interact with KKT9:KKT11 in all five AlphaFold2 models (rank_1 to rank_5). (B) Multiple sequence alignment of KIN-A CD1 and CD2 showing conservation. (C–E) Representative fluorescence micrographs showing the localization of tdTomato-Aurora BAUK1 and YFP-tagged KIN-Awt (C), KIN-AΔCD1 (717–743) (D), and KIN-AΔCD2 (816–862) (E). RNAi was induced with 1 μg/ml doxycycline for 24 hr to deplete the untagged KIN-A allele. Cell lines: BAP3067, BAP3128, BAP3127. Scale bars, 2 μm. (F) Stacked bar charts showing the percentage of YFP-tagged KIN-Awt, KIN-AΔCD1, and KIN-AΔCD2 on kinetochores, kinetochores+spindle, and spindle only in metaphase cells. Examples and schematic illustrations of the three categories used for scoring are presented on the left. A minimum of 50 cells per condition were quantified. (G) Stacked bar charts showing the percentage of tdTomato-Aurora BAUK1 on kinetochores, kinetochores+spindle, and spindle only in metaphase cells upon rescue with YFP-tagged KIN-Awt, KIN-AΔCD1, or KIN-AΔCD2. A minimum of 50 cells per condition were quantified. (H) Growth curves for indicated cell lines and conditions. RNAi was induced with 1 μg/ml doxycycline for to deplete the untagged KIN-A allele in the knockdown conditions and cultures were diluted at day 2. Cell lines: BAP3067, BAP3128, BAP3127.
Figure 5—figure supplement 1
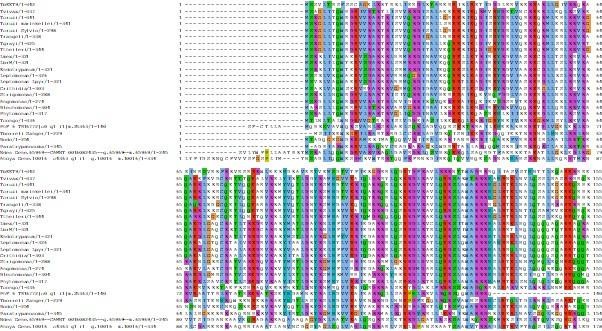
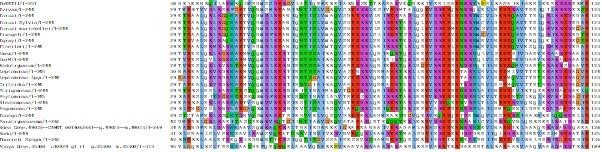
Multiple sequence alignment of KIN-A.
Figure 5—figure supplement 2
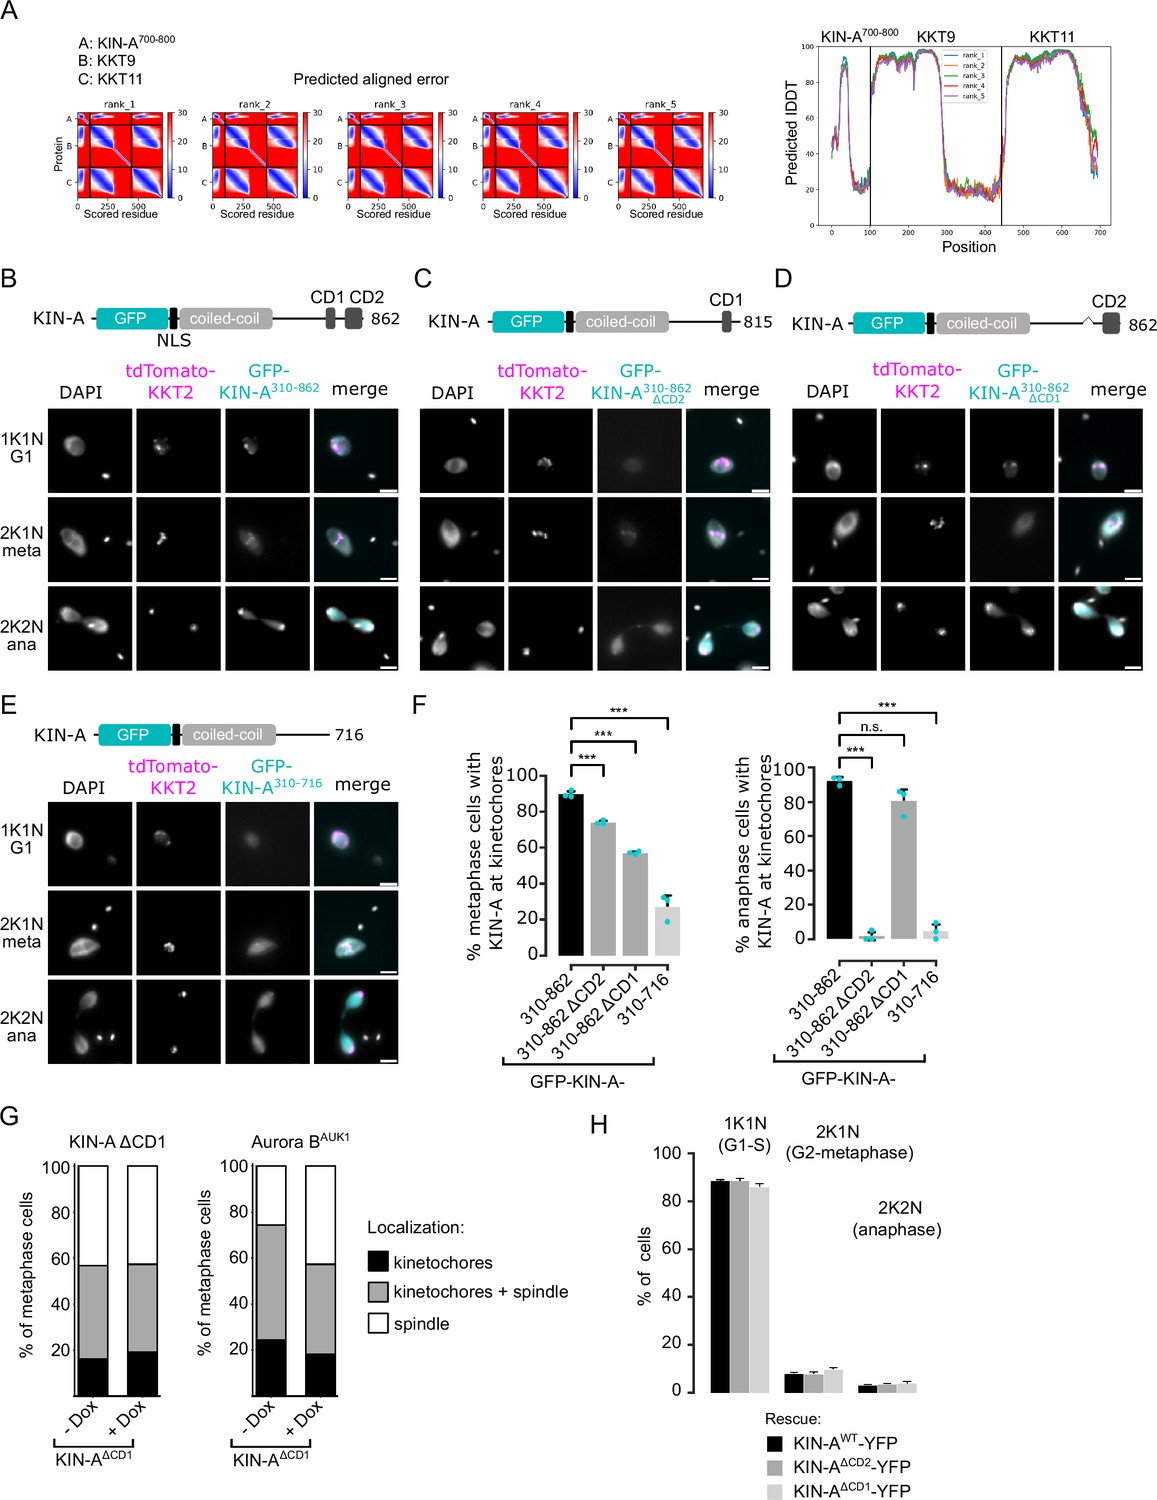
Conserved domain 1 (CD1) and CD2 contribute synergistically to kinetochore localization of KIN-A.
(A) Predicted aligned error (PAE) (left) and pLDDT plots (right) of AlphaFold2 predictions rank_1 to rank_5 for KIN-A700-800 in complex with KKT9 and KKT11. (B–E) Representative fluorescence micrographs showing the localization of ectopically expressed GFP-KIN-A310-862 (B), -KIN-A310-862 ΔCD2 (C) and -KIN-B310-862 ΔCD1 (D) and -KIN-A310-716 (E). Expression of GFP fusion proteins was induced with 10 ng/ml doxycycline for 24 hr. Kinetochores are marked with tdTomato-KKT2. Cell lines: BAP2287, BAP2948, BAP2949, BAP2947. Scale bars, 2 μm. (F) Quantification of metaphase (left) and anaphase (right) cells that have kinetochore-like dots of indicated GFP fusion proteins. All graphs depict the means (bar) ± SD of three replicates (shown as dots). A minimum of 150 cells per replicate were quantified. ***p≤0.001 (two-sided, unpaired t-test). (G) Stacked bar charts showing the percentage of KIN-AΔCD1-YFP (left) or tdTomato-Aurora BAUK1 (right) on kinetochores, kinetochores+spindle and spindle in KIN-AΔCD1 metaphase cells with and without KIN-A RNAi. A minimum of 70 cells per condition were quantified. Cell line: BAP3128. (H) Cell cycle profiles for the indicated cell lines and conditions. RNAi was induced with 1 μg/ml doxycycline to deplete the untagged KIN-A allele in the knockdown conditions and cells were fixed after 24 hr. All graphs depict the means (bar) ± SD of three replicates. A minimum of 500 cells per replicate were quantified. Cell lines: BAP3067, BAP3127, BAP3128.
Figure 6 with 2 supplements
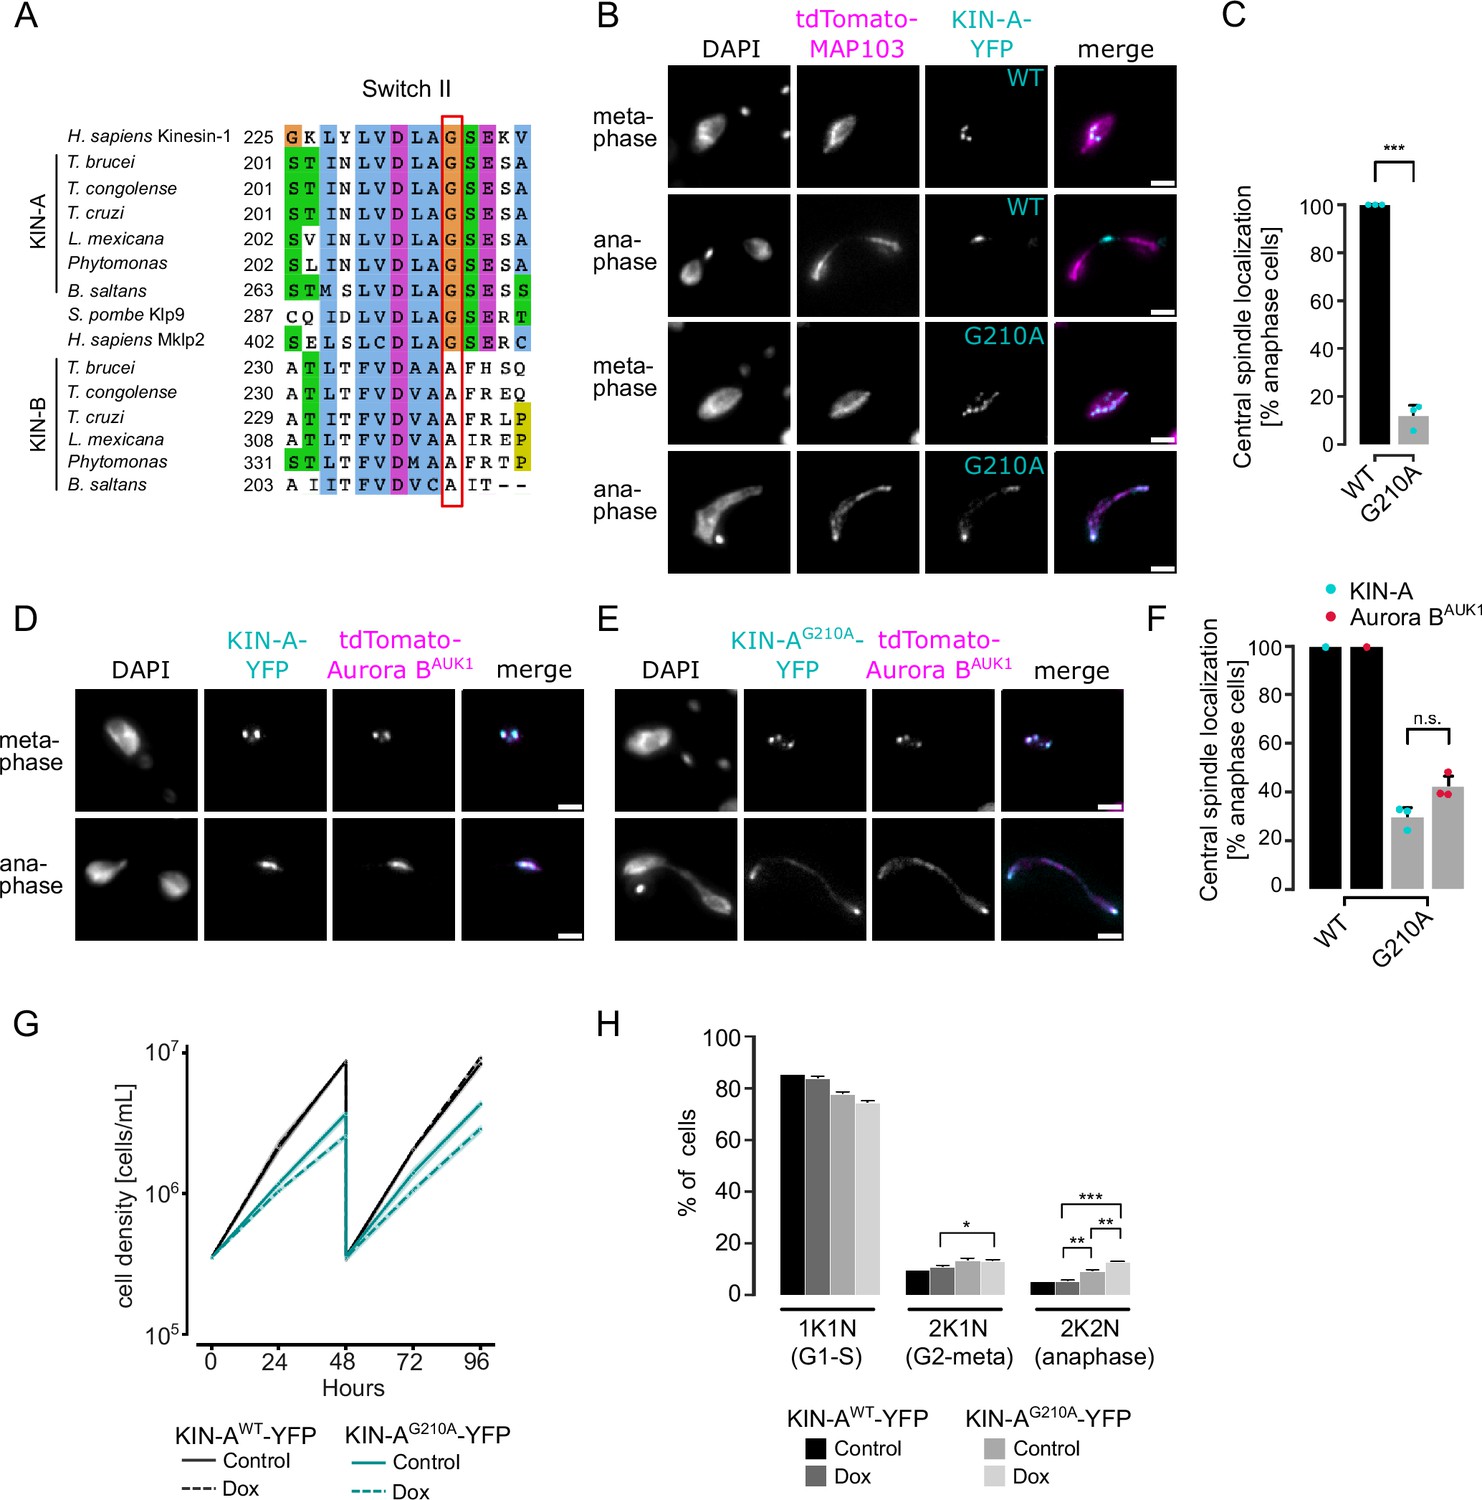
KIN-A ATPase activity is required for central spindle localization of the chromosomal passenger complex (CPC) in anaphase.
(A) Multiple sequence alignment showing conservation of switch II region in KIN-A and KIN-B, with the key glycine residue (G210 in T. brucei) targeted for rigor mutation highlighted in red. (B) Representative fluorescence micrographs showing the localization of tdTomato-MAP103 (spindle marker) and YFP-tagged KIN-Awt or KIN-AG210A (rigor mutant). RNAi was induced with 1 μg/ml doxycycline for 24 hr to deplete the untagged KIN-A allele. Cell lines: BAP3068, BAP3071. Scale bars, 2 μm. (C) Quantification showing the percentage of anaphase cells that have YFP-tagged KIN-Awt or KIN-AG210A localized at the central spindle. All graphs depict the means (bar) ± SD of three replicates (shown as dots). A minimum of 40 cells per replicate were quantified. ***p≤0.001 (two-sided, unpaired t-test). (D and E) Representative fluorescence micrographs showing the localization of tdTomato-Aurora BAUK1 and YFP-tagged KIN-Awt (D) or KIN-AG210A (E). RNAi was induced with 1 μg/ml doxycycline for 24 hr to deplete the untagged KIN-A allele. Cell lines: BAP3067, BAP3070. Scale bars, 2 μm. (F) Quantification showing the percentage of anaphase cells that have tdTomato-Aurora BAUK1 localized at the central spindle upon rescue with YFP-tagged KIN-Awt or KIN-AG210A. Graphs for the KIN-AG210 rescue conditions (gray) depict the means (bar) ± SD of three replicates (shown as dots). A minimum of 30 cells per replicate were quantified. (G) Growth curves for indicated cell lines and conditions. RNAi was induced with 1 μg/ml doxycycline for to deplete the untagged KIN-A allele in the knockdown conditions and cultures were diluted at day 2. Cell lines: BAP3064, BAP3065. (H) Cell cycle profiles for the indicated cell lines and conditions. RNAi was induced with 1 μg/ml doxycycline to deplete the untagged KIN-A allele in the knockdown conditions and cells were fixed after 24 hr. All graphs depict the means (bar) ± SD of at least two replicates. A minimum of 300 cells per replicate were quantified. Cell lines: BAP3064, BAP3065. ***p≤0.001 (two-sided, unpaired t-test).
Figure 6—figure supplement 1
Multiple sequence alignment of KIN-A and KIN-B from different kinetoplastids with human kinesin-1, human Mklp2, and yeast Klp9.
Positions of the P-loop, switch I and II motifs, α4 and α5 are highlighted.
Figure 6—figure supplement 2
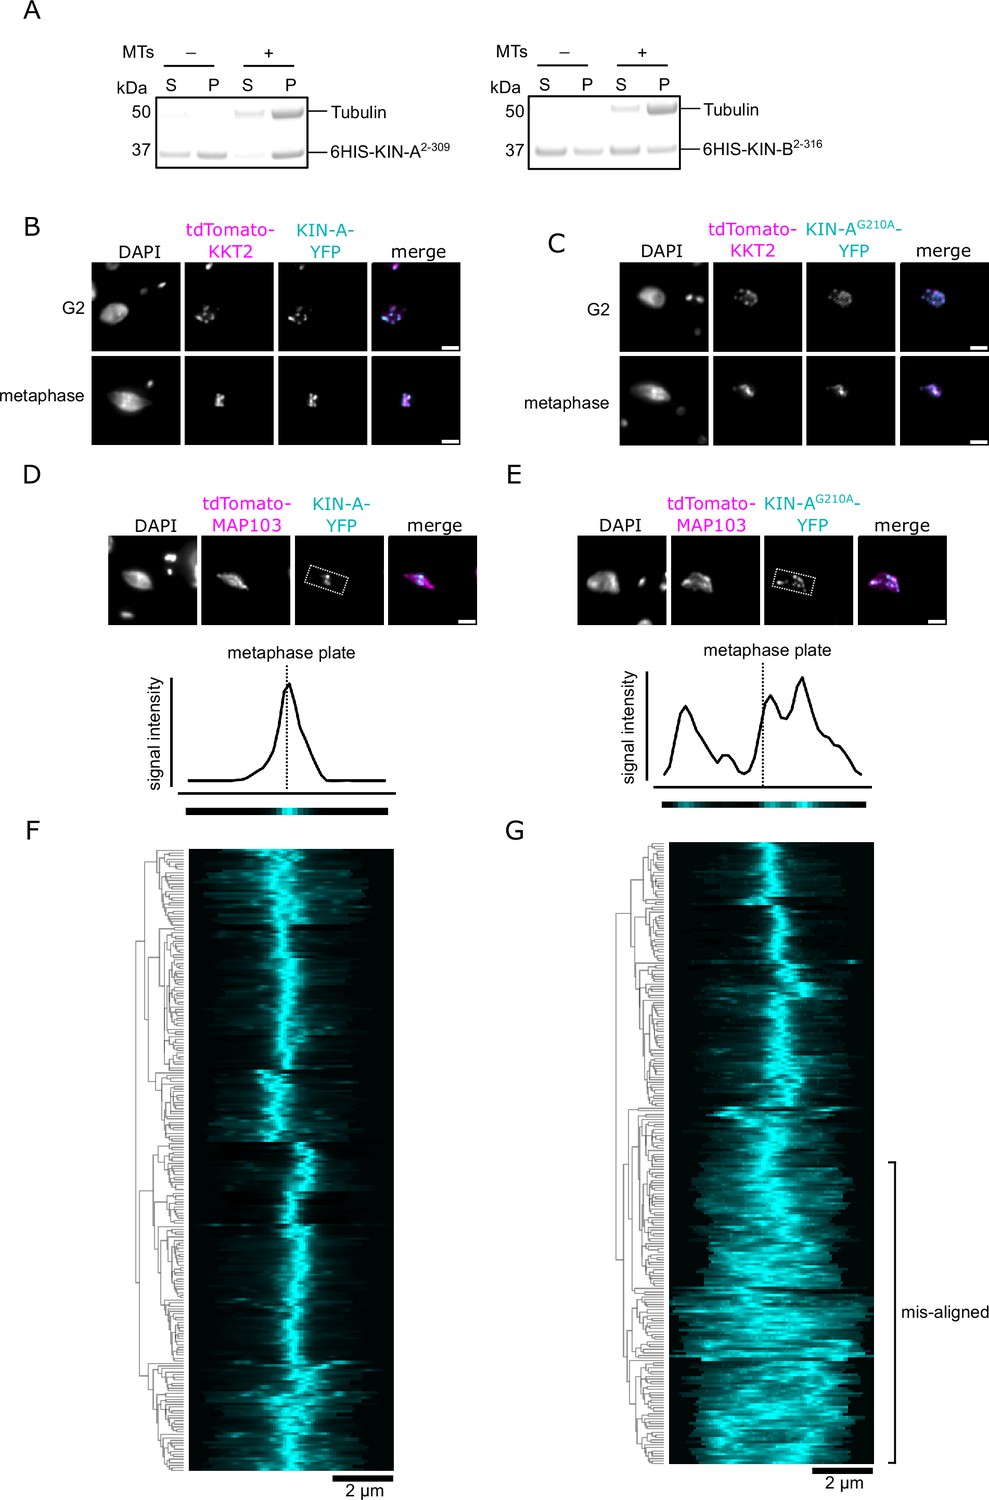
ATPase activity of KIN-A promotes kinetochore alignment at the metaphase plate.
(A) Microtubule co-sedimentation assay with 6HIS-KIN-A2-309 (left) and 6HIS-KIN-B2-316 (right). S and P correspond to supernatant and pellet fractions, respectively. Note that both constructs to some extent sedimented even in the absence of microtubules. Hence, lack of microtubule binding for KIN-B may be due to the unstable non-functional protein used in this study. Raw, uncropped gels are shown in Figure 6—figure supplement 2—source data 1 and 2. (B and C) Representative fluorescence micrographs showing localization of YFP-tagged KIN-A (B) and KIN-AG210A (rigor mutant) (C) in G2 and metaphase. Kinetochores are marked with tdTomato-KKT2. Cell lines: BAP3066, BAP3069. Scale bars, 2 μm. (D and E) Upper: Representative fluorescence micrographs showing localization of YFP-tagged KIN-A (D) and KIN-AG210A (rigor mutant) (E) in metaphase. The mitotic spindle is marked with tdTomato-MAP103. Bounding boxes indicate area used for generation of intensity profiles in Fiji/ImageJ. Cell lines: BAP3068, BAP3071. Scale bars, 2 μm. Lower: Example of 1D intensity profiles and corresponding heatmaps from the example cells shown above. (F and G) Kinetochore alignment profiles for YFP-tagged KIN-A (F) and KIN-AG210A (G). RNAi was induced with 1 μg/ml doxycycline for 24 hr to deplete the untagged KIN-A allele and cells were treated with 10 μM MG132 for 4 hr prior to fixing to prevent anaphase entry (Hayashi and Akiyoshi, 2018). WPGMA clustering was performed using the Python Seaborn library. Cell lines: BAP3064, BAP3065.
-
Figure 6—figure supplement 2—source data 1
Original scans of the SimplyBlue-stained SDS-PAGE gel in Figure 6—figure supplement 2A.
- https://cdn.elifesciences.org/articles/93522/elife-93522-fig6-figsupp2-data1-v1.zip
-
Figure 6—figure supplement 2—source data 2
PDF containing the uncropped, original scans of the SimplyBlue-stained SDS-PAGE gel in Figure 6—figure supplement 2A with highlighted bands and sample labels.
- https://cdn.elifesciences.org/articles/93522/elife-93522-fig6-figsupp2-data2-v1.zip
Figure 7
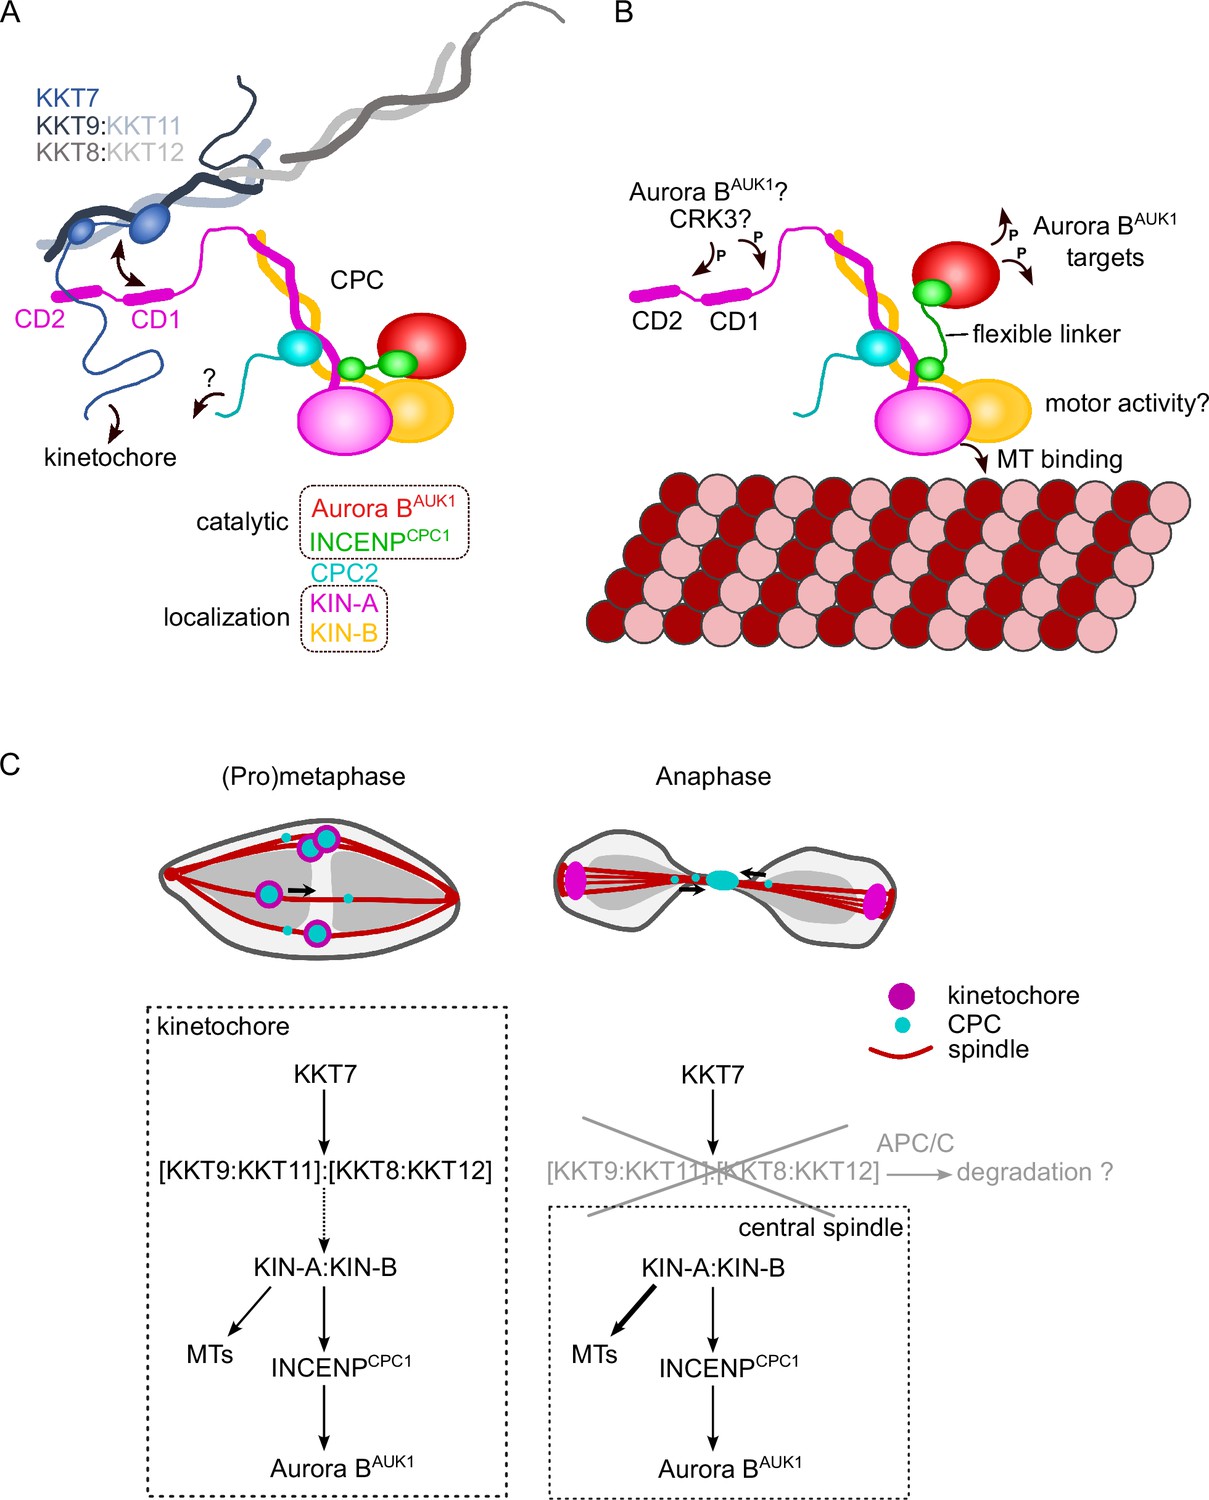
Model for chromosomal passenger complex (CPC) localization and function in trypanosomes.
(A) KIN-A (magenta) and KIN-B (yellow) interact via their coiled-coil domains and form a scaffold for the assembly of CPC2 (cyan) and the catalytic module of the CPC, composed of Aurora BAUK1 (red) and INCENPCPC1 (green). During interphase, the catalytic module is positioned close to the kinesin head domains of KIN-A and KIN-B. CPC recruitment to the inner kinetochore is mediated through multiple weak interactions between the C-terminal unstructured tail of KIN-A, containing CD1 and CD2, with the coiled-coil domain of KKT9:KKT11 (dark blue:light blue) and possibly the N-terminus of KKT7 (blue). The KKT8 complex, comprising KKT9:KKT11 and KKT8:KKT12 (dark gray:light gray) subcomplexes, is connected to other kinetochore proteins through KKT7. Additional kinetochore targeting domains of the CPC may reside within the C-terminus of KIN-B and/or CPC2. We propose that the KIN-A:KIN-B subcomplex represents the main localization module of the trypanosome CPC. As illustrated in (B), the affinity of the KIN-A C-terminal tail for its receptor(s) at the kinetochore may be further modulated through phosphorylation by the CDK1 homolog CRK3 and the Aurora BAUK1 kinase itself (Ballmer et al., 2024). Interaction of the N-terminal motor domain of KIN-A with spindle microtubules (MTs) from prometaphase onward causes the catalytic module to disengage from its kinesin head-associated state. The ~100 amino acid long flexible linker within INCENPCPC1 would then permit Aurora BAUK1 to phosphorylate its substrates within a larger but nevertheless spatially constrained target area while still being anchored to the kinetochore via KIN-A:KIN-B. The motor domain of KIN-A could thus act as built-in sensor for KT-MT attachments. (C) We propose that the trypanosome CPC is recruited to kinetochores via the KKT7-KKT8 complex pathway (dashed arrow) and that motor activity of KIN-A promotes congression of kinetochores to the metaphase plate during early mitosis. The KKT8 complex dissociates from kinetochores at the metaphase-to-anaphase transition and is possibly degraded in an APC/C-dependent manner. Elimination of the KKT8 complex, the primary kinetochore receptor of the CPC, coupled to microtubule (MT) binding and motor activity of the KIN-A motor domain strips the CPC off kinetochores and facilitates its translocation to the central spindle in anaphase.
Author response image 1
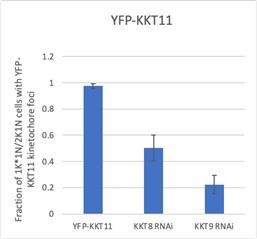
Author response image 2
KKT9 (residues ~53 – 80 predicted to interact with KIN-A in T. brucei).
Author response image 3
KKT11 (residues 61-85 predicted to interact with KIN-A in T. brucei).
Tables
Appendix 1—key resources table
| Reagent type (species) or resource | Designation | Source or reference | Identifiers | Additional information |
|---|---|---|---|---|
| Cell line (Trypanosoma brucei brucei) | TREU 927/4 procyclic cells expressing T7 RNA polymerase and the tetracycline repressor to allow inducible expression | Poon et al., 2012 | SmOxP9 | Background strain used for derivation of cell lines described in Supplementary file 1 |
| Cell line (Trypanosoma brucei brucei) | TREU 927/4 expressing T7 RNA polymerase, tetracycline repressor, and the Cas9 nuclease | Beneke et al., 2017 | PCF1339 | Background strain used for derivation of cell lines described in Supplementary file 1 |
| Strain, strain background (Escherichia coli) | Rosetta 2(DE3)pLysS | Novagen | 71403 | |
| Strain, strain background (Escherichia coli) | BL21(DE3) | Novagen | 69450 | |
| Recombinant DNA reagent | pEnT5-Y, endogenous YFP tagging, hygromycin | Kelly et al., 2007 | pEnT5-Y (pBA1) | See Supplementary file 1 for construction details on all plasmids used in this study |
| Recombinant DNA reagent | pBA148, endogenous tdTomato tagging, blasticidin | Akiyoshi and Gull, 2014 | pBA148 | See Supplementary file 1 for construction details on all plasmids used in this study |
| Recombinant DNA reagent | pMig96 (pBA152), 256 LacO, integrate at rDNA | Landeira and Navarro, 2007 | pMig96 (pBA152) | See Supplementary file 1 for construction details on all plasmids used in this study |
| Recombinant DNA reagent | pJ1339 (1173+Cas9), for CRISPR-Cas9 gene editing | Beneke et al., 2017 | pJ1339 | See Supplementary file 1 for construction details on all plasmids used in this study |
| Recombinant DNA reagent | p2T7-177, inducible expression of RNAi constructs (head to head), integrate at 177 bp | Wickstead et al., 2002 | p2T7-177 (pBA3) | See Supplementary file 1 for construction details on all plasmids used in this study |
| Recombinant DNA reagent | pRSFDuet-1, expression of one or two target proteins in bacteria | Novagen | pRSFDuet-1, catalog number 71341-3 | See Supplementary file 1 for construction details on all plasmids used in this study |
| Recombinant DNA reagent | pBA310, inducible expression vector, integrate at 177 bp | Nerusheva and Akiyoshi, 2016 | pBA310 | See Supplementary file 1 for construction details on all plasmids used in this study |
| Recombinant DNA reagent | pBA795, inducible GFP-NLS-LacI expression vector, integrate at 177 bp | Ishii and Akiyoshi, 2020 | pBA795 | See Supplementary file 1 for construction details on all plasmids used in this study |
| Recombinant DNA reagent | pPOTv7 (pBA1919), (eYFP, Hygromycin) vector for PCR only tagging (POT) of target genes in Trypanosoma brucei | Dean et al., 2015 | pPOTv7 (pBA1919) | See Supplementary file 1 for construction details on all plasmids used in this study |
| Recombinant DNA reagent | pEnT6-Y (pBA191), endogenous YFP tagging, G418 | Kind gift from Dehua Lai | pEnT6-Y (pBA191) | See Supplementary file 1 for construction details on all plasmids used in this study |
| Recombinant DNA reagent | pMig75, Tet inducible GFP-LacI, SAT, ClonNAT | Kind gift from Miguel Navarro | pMig75 (pBA150) | See Supplementary file 1 for construction details on all plasmids used in this study |
| Recombinant DNA reagent | pMig96, rDNA targeting, 256LacO, Phleo | Kind gift from Miguel Navarro | pMig96 (pBA152) | See Supplementary file 1 for construction details on all plasmids used in this study |
| Recombinant DNA reagent | BAG164 (shRNA against KIN-A 5’ UTR) in pMK-RQ plasmid | Life Technologies Ltd (Invitrogen Division) | NA | See Supplementary file 1 for sequence information |
| Recombinant DNA reagent | BAG165 (shRNA against KIN-A 3’UTR) in pMK-RQ plasmid | Life Technologies Ltd (Invitrogen Division) | NA | See Supplementary file 1 for sequence information |
| Recombinant DNA reagent | BAG157 (shRNA against CPC1 5’ UTR) in pMK-RQ plasmid | Life Technologies Ltd (Invitrogen Division) | NA | See Supplementary file 1 for sequence information |
| Recombinant DNA reagent | BAG158 (shRNA against CPC1 3’ UTR) in pMK-RQ plasmid | Life Technologies Ltd (Invitrogen Division) | NA | See Supplementary file 1 for sequence information |
| Recombinant DNA reagent | BAG159 (shRNA against CPC2 5’ UTR) in pMK-RQ plasmid | Life Technologies Ltd (Invitrogen Division) | NA | See Supplementary file 1 for sequence information |
| Recombinant DNA reagent | BAG160 (shRNA against CPC2 3’ UTR) in pMK-RQ plasmid | Life Technologies Ltd (Invitrogen Division) | NA | See Supplementary file 1 for sequence information |
| Recombinant DNA reagent | BAG62 (shRNA against KKT16 CDS) in pMK-RQ plasmid | Life Technologies Ltd (Invitrogen Division) | NA | See Supplementary file 1 for sequence information |
| Recombinant DNA reagent | BAG80 (shRNA against KKT12 3’UTR) in pMK-RQ plasmid | Life Technologies Ltd (Invitrogen Division) | NA | See Supplementary file 1 for sequence information |
| Antibody | Mouse monoclonal anti-GFP | Roche | 11814460001 | For immunoprecipitation experiments: 12 μg of antibodies preconjugated with 60 μl slurry of Protein-G magnetic beads |
| Antibody | Rabbit polyclonal anti-GFP | OriGene | TP401 | Dilution for western blot 1:5000 |
| Antibody | Mouse monoclonal TAT1 (anti-trypanosomal-alpha-tubulin) | kind gift from Keith Gull Woods et al., 1989 | TAT1 | Dilution for western blot 1:5000 |
| Antibody | IRDye 680RD goat anti-mouse | LI-COR | 926-68070 | Dilution for western blot 1:20,000 |
| Antibody | IRDye 800CW goat anti-rabbit | LI-COR | 926-32211 | Dilution for western blot 1:20,000 |
| Commercial assay, kit | Protein-G magnetic beads | Thermo Fisher Scientific | 10004D | |
| Chemical compound, drug | RapiGest | Waters | 186001860 | |
| Peptide, recombinant protein | Trypsin | Promega | V5111 | |
| Chemical compound, drug | BS3 (bis(sulfosuccinimidyl)suberate) | Thermo Fisher Scientific | 21580 | |
| Commercial assay, kit | TALON metal affinity resin | TAKARA BIO EUROPE | 635503 | |
| Commercial assay, kit | Zeba spin desalting columns | Thermo Fisher Scientific | 89883 | |
| Commercial assay, kit | SimplyBlue SafeStain | Life Technologies Ltd (Invitrogen Division) | LC6060 | |
| Peptide, recombinant protein | Porcine tubulin | Cytoskeleton | T-240 | |
| Software, algorithm | TriTrypDB | http://tritrypdb.org/tritrypdb/ | RRID:SCR_007043 | |
| Software, algorithm | MaxQuant (version 2.0.1) | Cox and Mann, 2008 | RRID:SCR_014485 | |
| Software, algorithm | pLink2 | Chen et al., 2019 | RRID:SCR_000084 | |
| Software, algorithm | AlphaFold2-Multimer-v2 | Evans et al., 2022; Jumper et al., 2021 | ||
| Software, algorithm | ColabFold | Mirdita et al., 2022 | ||
| Software, algorithm | hmmsearch | https://www.ebi.ac.uk/Tools/hmmer/search/hmmsearch | ||
| Software, algorithm | MAFFT | https://mafft.cbrc.jp/alignment/server/index.html | RRID:SCR_011811 | |
| Software, algorithm | Fiji | Schneider et al., 2012 | RRID:SCR_002285 | |
| Software, algorithm | Python | https://www.python.org/ | RRID:SCR_008394 | |
| Software, algorithm | xiView | Graham et al., 2019, https://xiview.org/index.php |
Additional files
-
Supplementary file 1
Table containing information (e.g. names, sequences, source, or construction details) on trypanosome cell lines, primers, plasmids, bacmids, and synthetic DNA used in this study.
- https://cdn.elifesciences.org/articles/93522/elife-93522-supp1-v1.xlsx
-
Supplementary file 2
Table containing list of proteins (and their iBAQ values) that co-purified with YFP-Aurora BAUK1, GFP-INCENPCPC1, GFP-KIN-A, and GFP-KIN-B (Figure 1), as well as CLMS results for native chromosomal passenger complexes (CPCs) isolated by immunoprecipitation of YFP-Aurora BAUK1 (Figure 3) and kinetochore proteins isolated by immunoprecipitation of YFP-KKIP1 (KKT8 complex shown in Figure 4).
- https://cdn.elifesciences.org/articles/93522/elife-93522-supp2-v1.xlsx
-
MDAR checklist
- https://cdn.elifesciences.org/articles/93522/elife-93522-mdarchecklist1-v1.docx
Download links
A two-part list of links to download the article, or parts of the article, in various formats.
Downloads (link to download the article as PDF)
Open citations (links to open the citations from this article in various online reference manager services)
Cite this article (links to download the citations from this article in formats compatible with various reference manager tools)
Dynamic localization of the chromosomal passenger complex in trypanosomes is controlled by the orphan kinesins KIN-A and KIN-B
eLife 13:RP93522.
https://doi.org/10.7554/eLife.93522.3


