Interchromosomal segmental duplication drives translocation and loss of P. falciparum histidine-rich protein 3
- Department of Medicine, University of Massachusetts Chan Medical School, United States
- Center for Computational Molecular Biology, Brown University, United States
- Warren Alpert Medical School, Brown University, United States
- Department of Molecular Pharmacology, Physiology and Biotechnology, Brown University, United States
- Department of Pathology and Laboratory Medicine, Brown University, United States
- Department of Epidemiology, Gillings School of Global Public Health, University of North Carolina, United States
- Division of Infectious Diseases, Department of Medicine, School of Medicine, University of North Carolina, United States
- Curriculum in Genetics and Molecular Biology, School of Medicine, University of North Carolina at Chapel Hill, United States
Figures
Figure 1 with 7 supplements
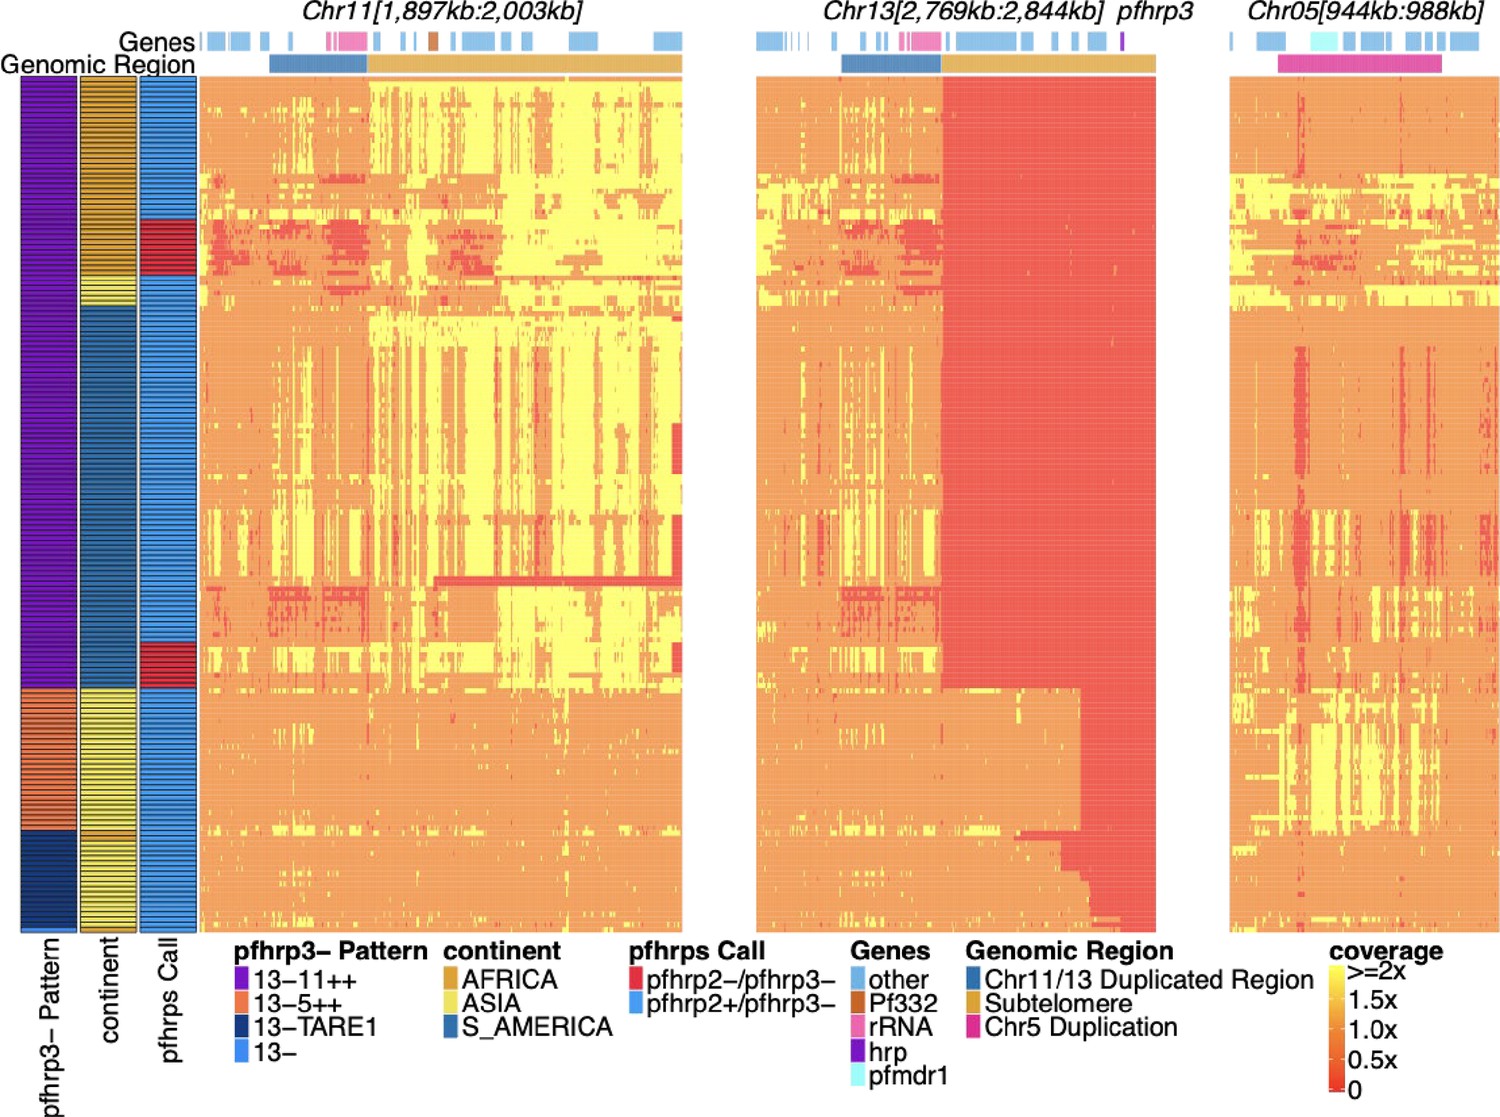
Pfhrp2/3 deleted parasites with altered sequence coverage across regions of chromosomes 11, 13, and 5.
Sequence coverage heatmap of pfhrp3 deletion associated regions of chromosomes 11 (1,897,151–2,003,328 bp), 13 (2,769,916–2,844,785 bp), and 5 (944,389–988,747 bp) in the 168 samples with evidence of pfhrp3 deletion out of the 19,313 publicly available samples. The regions from chromosomes 11 and 13 are at the end of their core region, while the region from chromosome 5 is the region around pfmdr1 involved in its duplication event. Each row is a whole-genome sequencing (WGS) sample, and each column is normalized coverage. The top annotation along chromosomes depicts the location of genes with relevant genes colored: rRNA (light pink), pf332 (red-orange), pfhrp3 (purple), pfmdr1 (electric-blue), and all other genes are colored light-blue. The second row delineates significant genomic regions: The chromosome 11/13 duplicated region (dark blue), the subtelomere regions of chr11/13 (orange), and the chromosome 5 duplicated region (fuchsia). The left annotation for samples includes the genomic rearrangement/deletion pattern (patterns with telomere-associated tandem repeat 1 (TARE1) have evidence of TARE1 addition following deletion), the continent of origin, and pfhrp2/3 deletion calls. Increased variation and biases in coverage correlate with P. falciparum selective whole-genome amplification (sWGA), which adds variance and biases to the sequence coverage before sequencing.
Figure 1—figure supplement 1
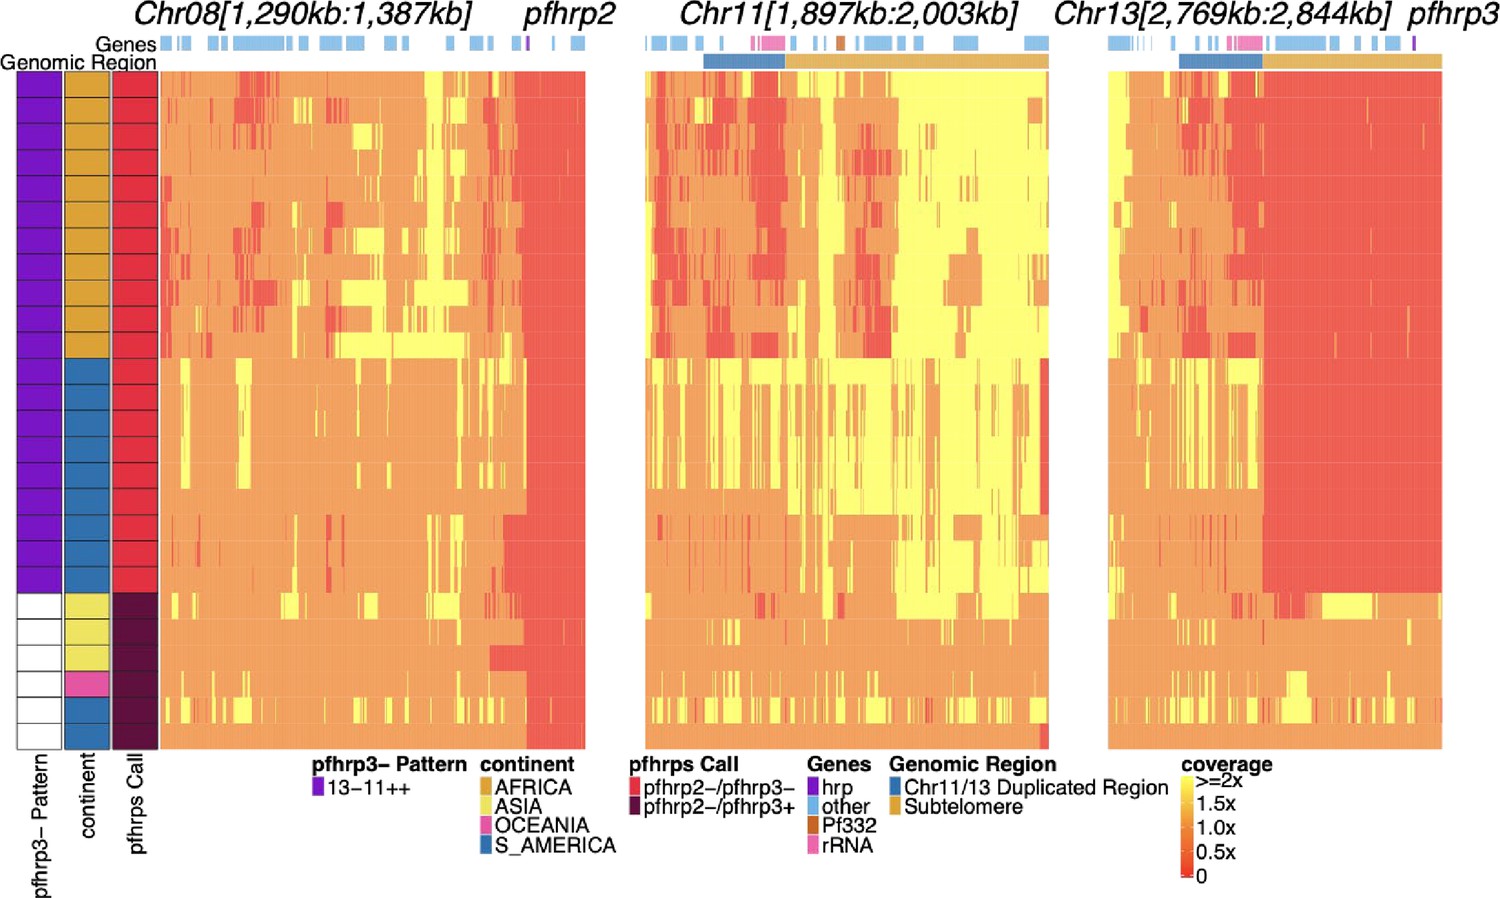
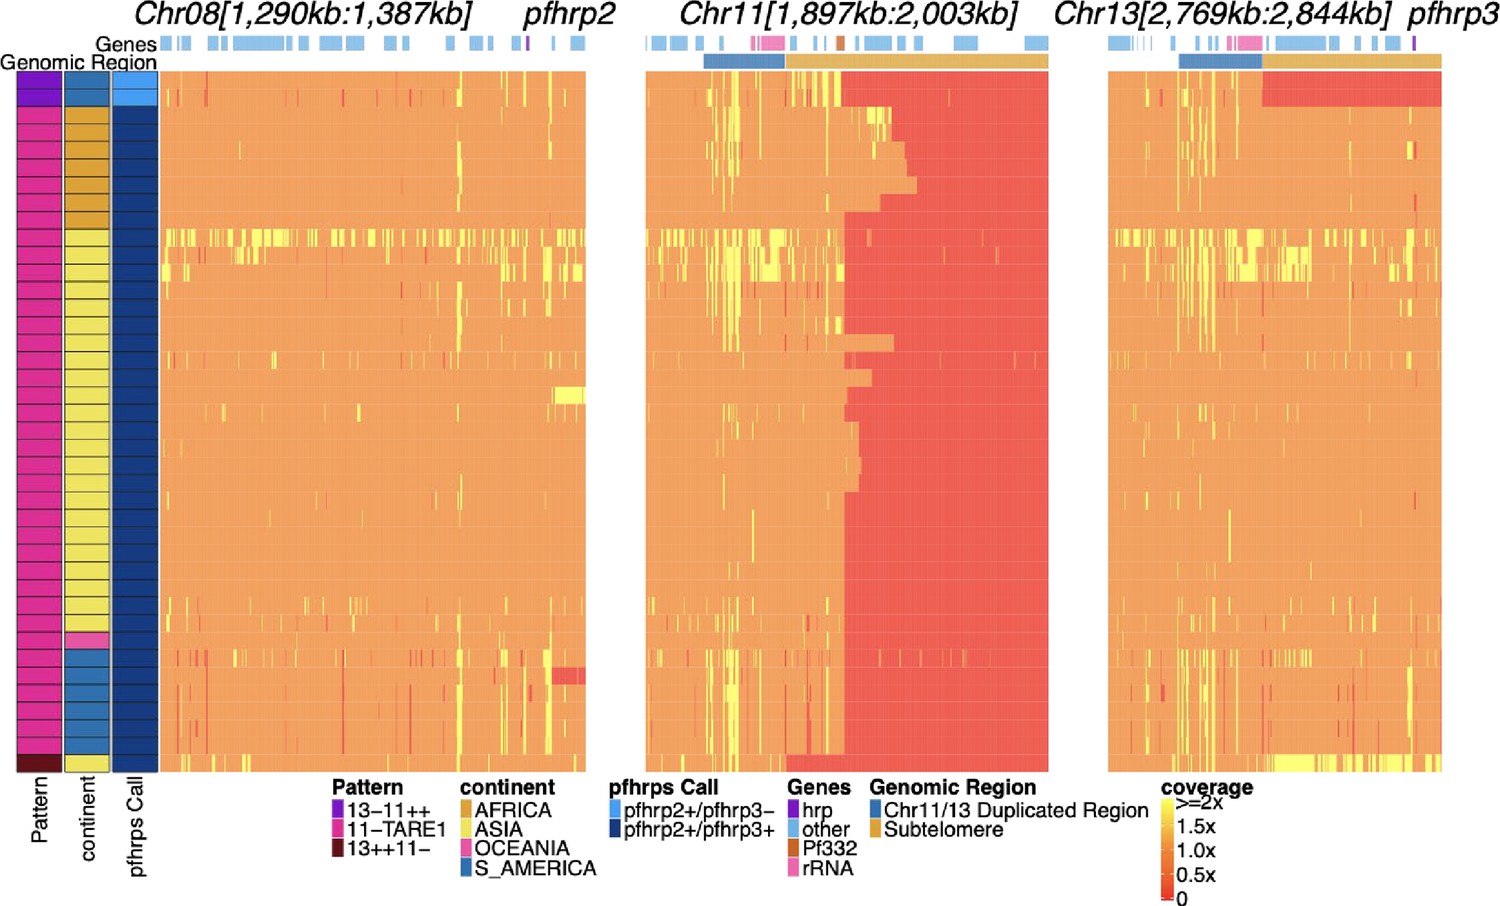
Genome coverage of isolates with evidence of pfhrp2 deletion.
Sequence coverage heatmap of chromosomes 8 (1,290,239–1,387,982 bp), 11 (1,897,151–2,003,328 bp), 13 (2,769,916–2,844,785 bp). Displaying the 26 parasites out of the 19,313 samples with signs of possible pfhrp2 deletions. Each row is a parasite. The top annotation along chromosomes depicts the location of genes, and the second row delineates the duplicated region (dark blue) and subtelomere region (orange). The left parasite annotation includes the deletion pattern, continent of origin, and pfhrp2/3 deletion calls. The 20 parasites with evidence of HRP3 deletion were only found within South America (six in Peru, three in Brazil) and Africa (11 in Ethiopia) and had evidence of the 13-11++ deletion HRP3 deletion pattern. Of the 6 parasites without HRP3 deletion (marked as white in pfhrp3- Pattern column for having no pfhrp3 deletion), two were from South America,three from Asia (one being lab isolate DD2), and one from Oceania (lab isolate D10).
Figure 1—figure supplement 2
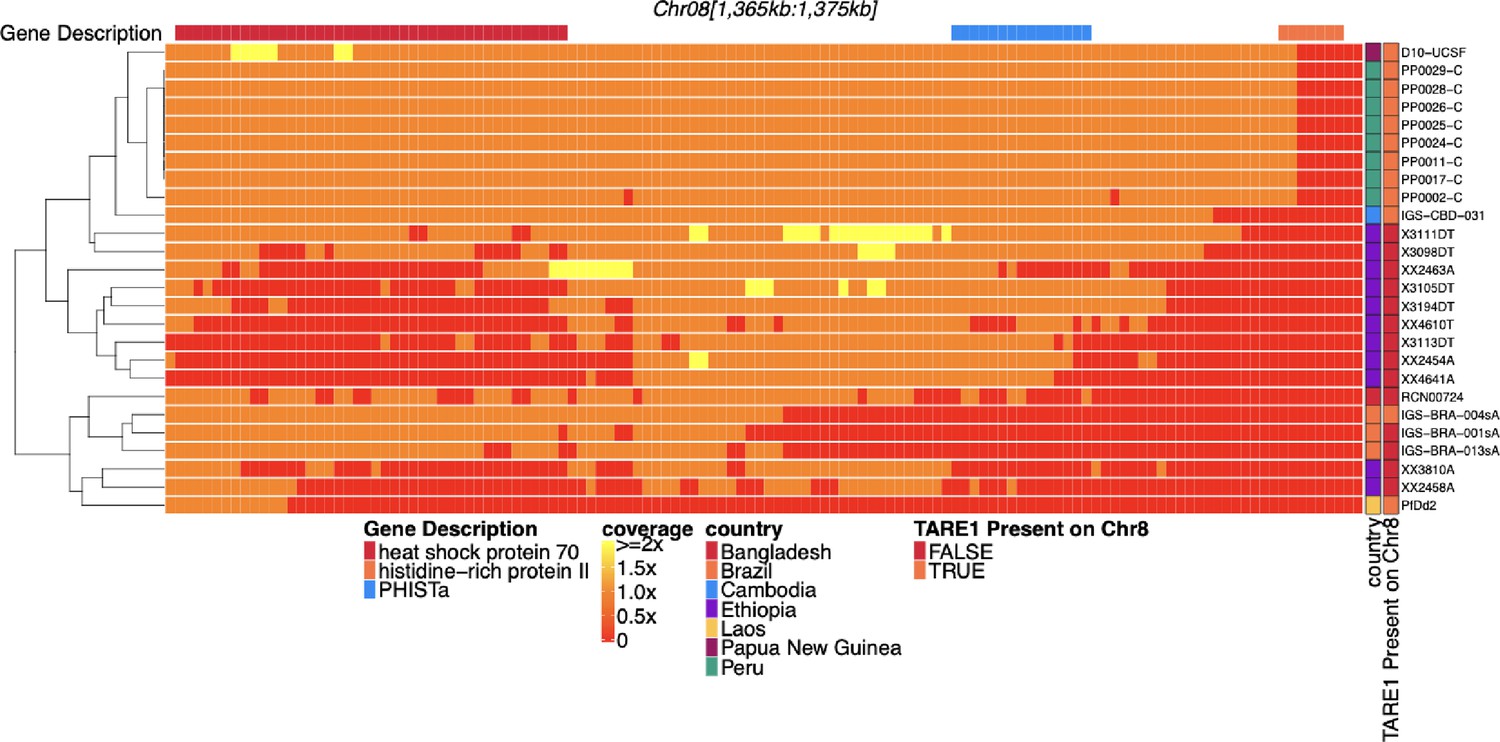
Coverage of sub-telomeric region of chromosome 8 before pfhrp2 of parasites with pfhrp2 deletion.
Heatmap coverage normalized to genomic coverage of the sub-telomeric region of chromosome 8 (spanning 1,365,360–1,375,435 bp, 10,075 bp in length) for the 26 parasites with pfhrp2 genomic deletion. Each row is a parasite, and each column is a genomic location. The top annotates which gene the region falls within. The right side annotation shows the country of origin and which parasites have evidence of at the location where genomic coverage (telomere-associated tandem repeat 1, TARE1) at the location where genomic coverage drops to zero within this region. Most parasites without evidence of TARE1 or other genomic rearrangement are selective whole genome amplification (sWGA) parasites and may lack the coverage to detect such events.
Figure 1—figure supplement 3
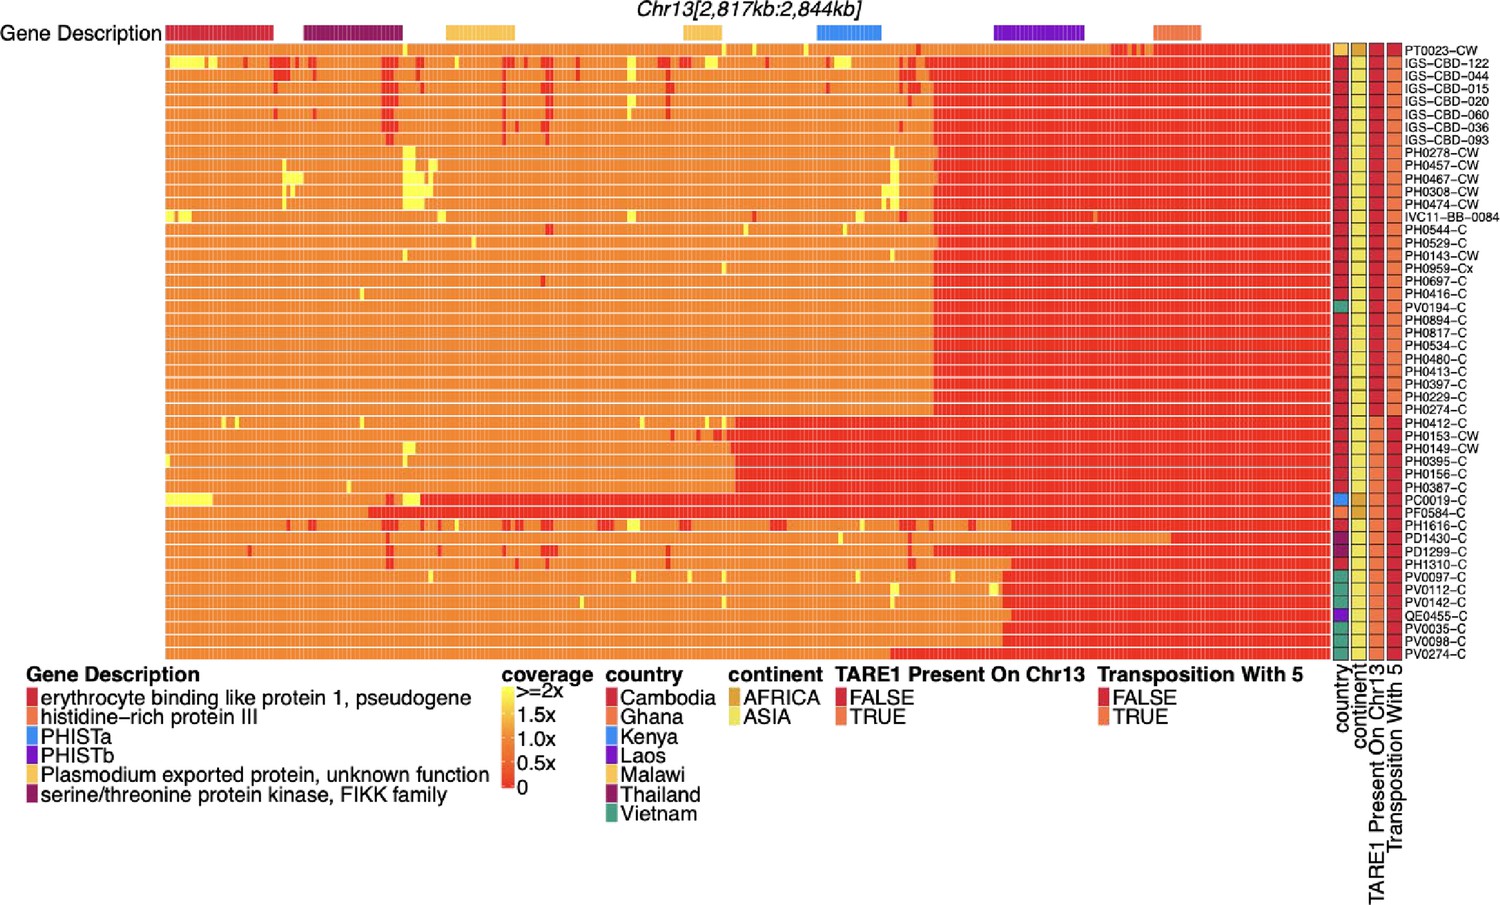
Coverage of chromosome 13 for parasites with pfhrp3 deletion pattern 13-TARE1.
Heatmap coverage normalized to genomic coverage of the sub-telomeric region of chromosome 13 (spanning 2,817,793–2,844,785 bp, 26,992 bp in length) for the 48 parasites with pfhrp3 deletions not associated with pattern 13-11++. Each row is a parasite, and each column is a genomic location. The top annotates which gene the region falls within. The right side annotation shows which parasites have evidence of telomere-associated tandem repeat 1 (TARE1) at the location where genomic coverage drops to zero within this region (n=19 pattern 13-TARE) and which parasites have evidence of genomic rearrangement with chromosome 5 from discordant paired-end reads, which results in duplication of pfmdr1 (n=28 pattern 13-5++). The top parasite lacks evidence of either deletion type. The next 28 parasites have evidence of rearrangement with chromosome 5 with discordant reads with mates mapping to chromosome 13 and other mates mapping to chromosome 5. The next 19 parasites have evidence of TARE1 contiguous with chromosome 13 sequence on various locations consistent with breakage and telomere healing. These breaks occur on chromosome 13 at 2,836,793 (n=8), 2,830,793 (n=4), 2,829,793 (n=2), 2,821,793 (n=1), 2,822,793 (n=1), 2,833,793 (n=1), 2,834,793 (n=1), 2,836,793 (n=1), and 2,840,793 (n=1).
Figure 1—figure supplement 4
Coverage of chromosome 5 for parasites with pfhrp3 deletion pattern 13-TARE1 and 13-5++.
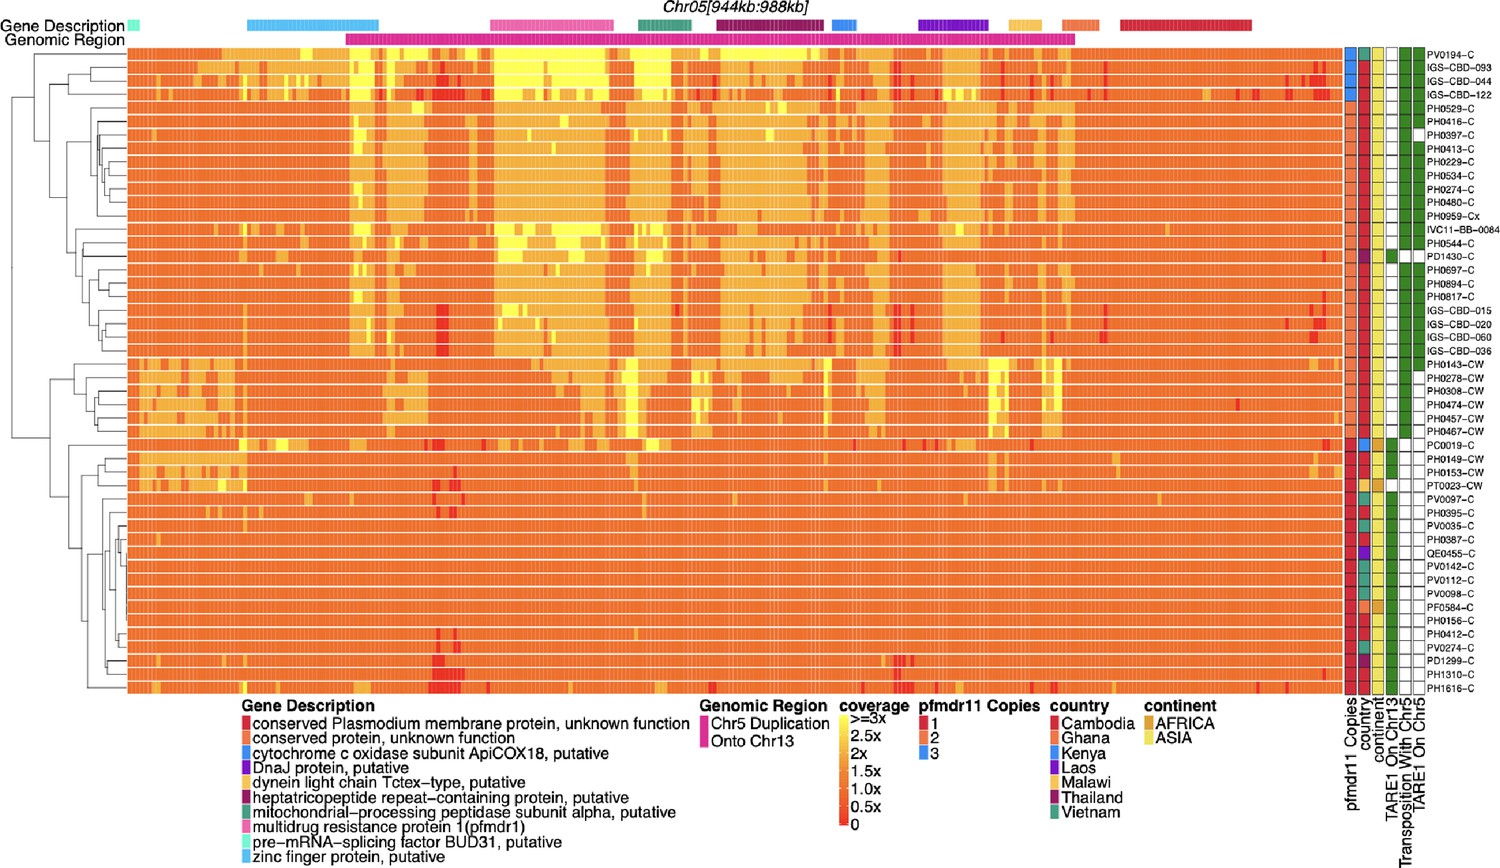
Heatmap coverage normalized to genomic coverage of a region of chromosome 5 (spanning 944,534–988,747 bp, 44,213 bp in length) for parasites with pfhrp3 deletion pattern 13-TARE1. Each row is a parasite, and each column is a genomic location. The top annotates which gene the region falls within. The right side annotates the country of origin of the parasite. The third annotation bar on the right side shows which parasites have telomere-associated tandem repeat 1 (TARE1) detected on chromosome 13; parasites with green have TARE1 detected on chromosome 13 that are clustered on the bottom of the graph and have normal coverage across this region of chromosome 5, while the parasites on top have evidence of re-arrangement between chromosome 13 (position 2,835,587) and chromosome 5 (position 979,203) and show increased coverage across chromosome 5 up to the point where TARE1 sequence is detected on the reverse strand. The second annotation hot-pink bar from the top indicates the duplicated region. The beginning of this bar is where the TARE1 sequence on the reverse strand is detected. The above would be consistent with a genomic rearrangement between chromosome 13 at position 2,835,587 and chromosome 5 at position 979,203, which results in the deletion of chromosome 13 from 2,835,587 onwards and the duplication of a 26 KB region of the reverse strand of chromosome 5 from position 979,203–952,668 resulting in the duplication of pfmdr1 and the deletion of pfhrp3. The parasites with transposition evidence between 13 and 5 but no TARE1 detected on 5 were all sWGA parasites, which likely limited the ability to detect the TARE1 sequence. The top four parasites appear coverage-wise to have three copies of pfmdr1. The top four parasites, in addition to the likely copy on chromosome 13, have a tandem duplication on chromosome 5. There were two different tandem duplications detected. The first parasite is tandemly duplicated from a monomeric stretch of Ax19 at 947,967 and Ax18 at 970,043 and is from Laos. The second, third, and fourth parasites, all from Cambodia, are tandemly duplicated from Ax22 at chromosome 5 946,684 and Ax36 at 964,504. All parasites with evidence for 13-5++ have only wild-type pfmdr1 or are a mix of wild-type and 184 F. The four parasites with three copies of pfmdr1 have 2 x coverage of 184 F and 1 x coverage of wild-type pfmdr1, which is consistent with the duplicated pfmdr1 on chromosome 13 being wild-type pfmdr1. All parasites with this deletion pattern are found within Asia.
Figure 1—figure supplement 5
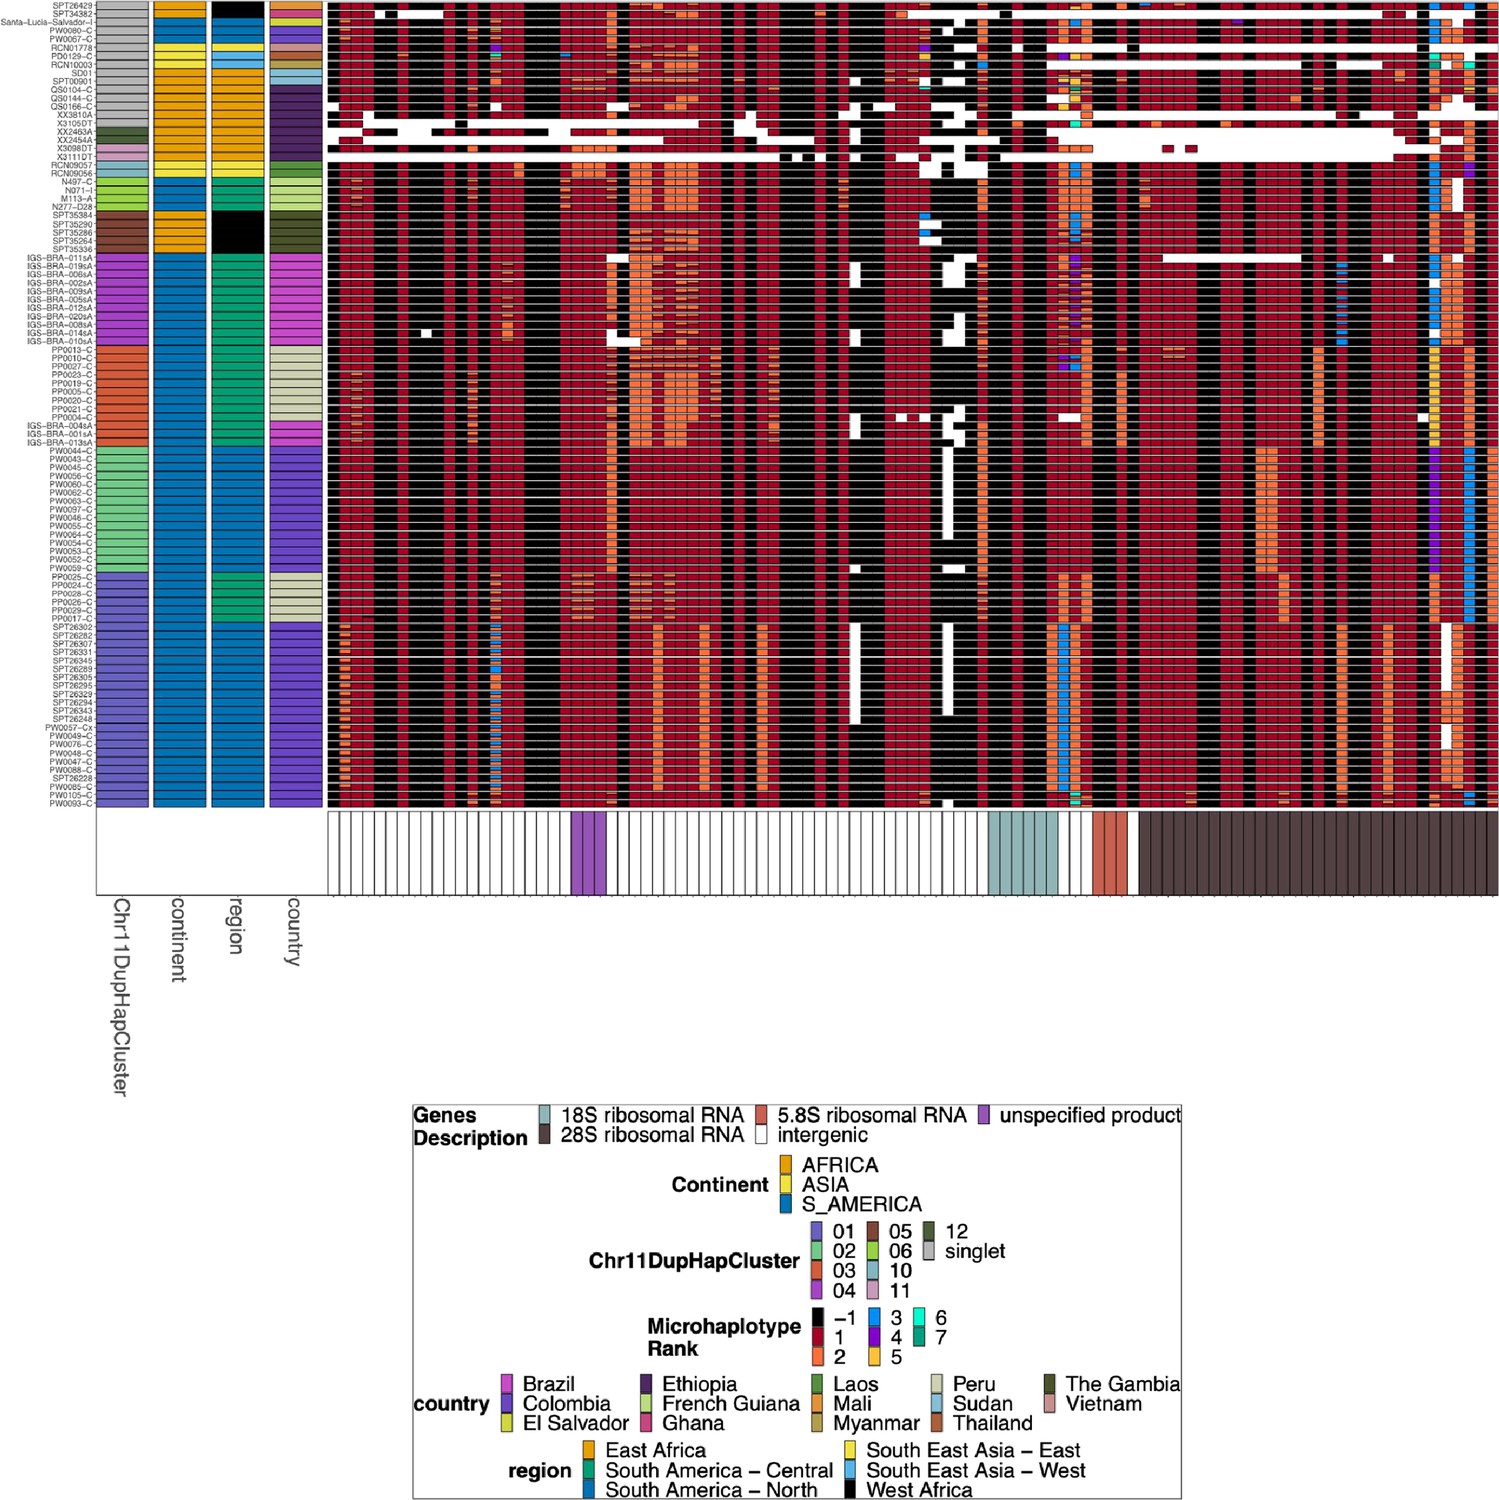
Chromosome 5 duplicated region microhaplotypes.
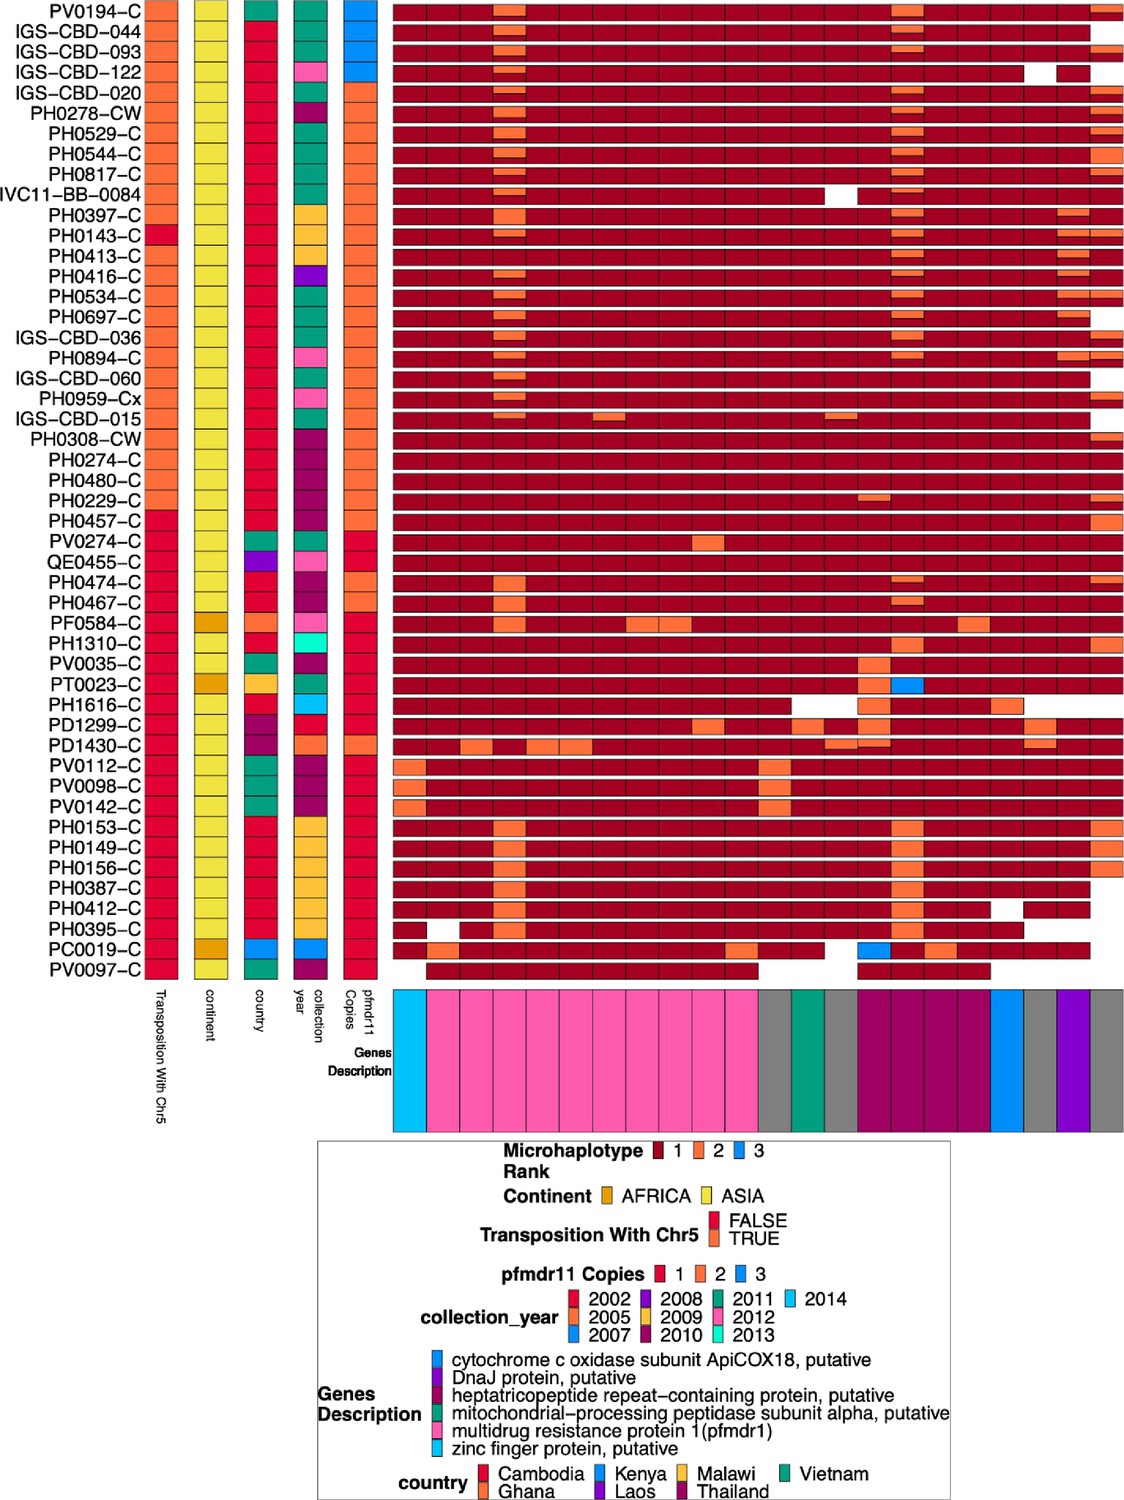
The 22 microhaplotype regions with variation across the duplicated portion of chromosome 5 spanning from 952,668–979,203 for the 48 isolates with chromosome 13 deletion without chromosome 11 duplication. Each row is an isolate. In each column, the isolate is typed by microhaplotype (colored by the prevalence of each microhaplotype, with 1=red being most prevalent, 2=orange second most prevalent, and 3=blue least prevalent). This color coding system is specific to each column, and the same color across columns does not indicate the same haplotype, just the prevalence in the population for that column. Associated metadata for each isolate can be seen on the left after the isolate’s name. Most (n=28) of these show evidence of complex recombination with chromosome 5 at 952,668 and 2,835,587 on chromosome 13, resulting in the deletion of pfhrp3 and the duplication of pfmdr1. Only 6 isolates with MDR duplication have no variation within pfmdr1. The other isolates have a wild type Y184 (yellow) on one copy and 184 F (red) on the other copy.
Figure 1—figure supplement 6
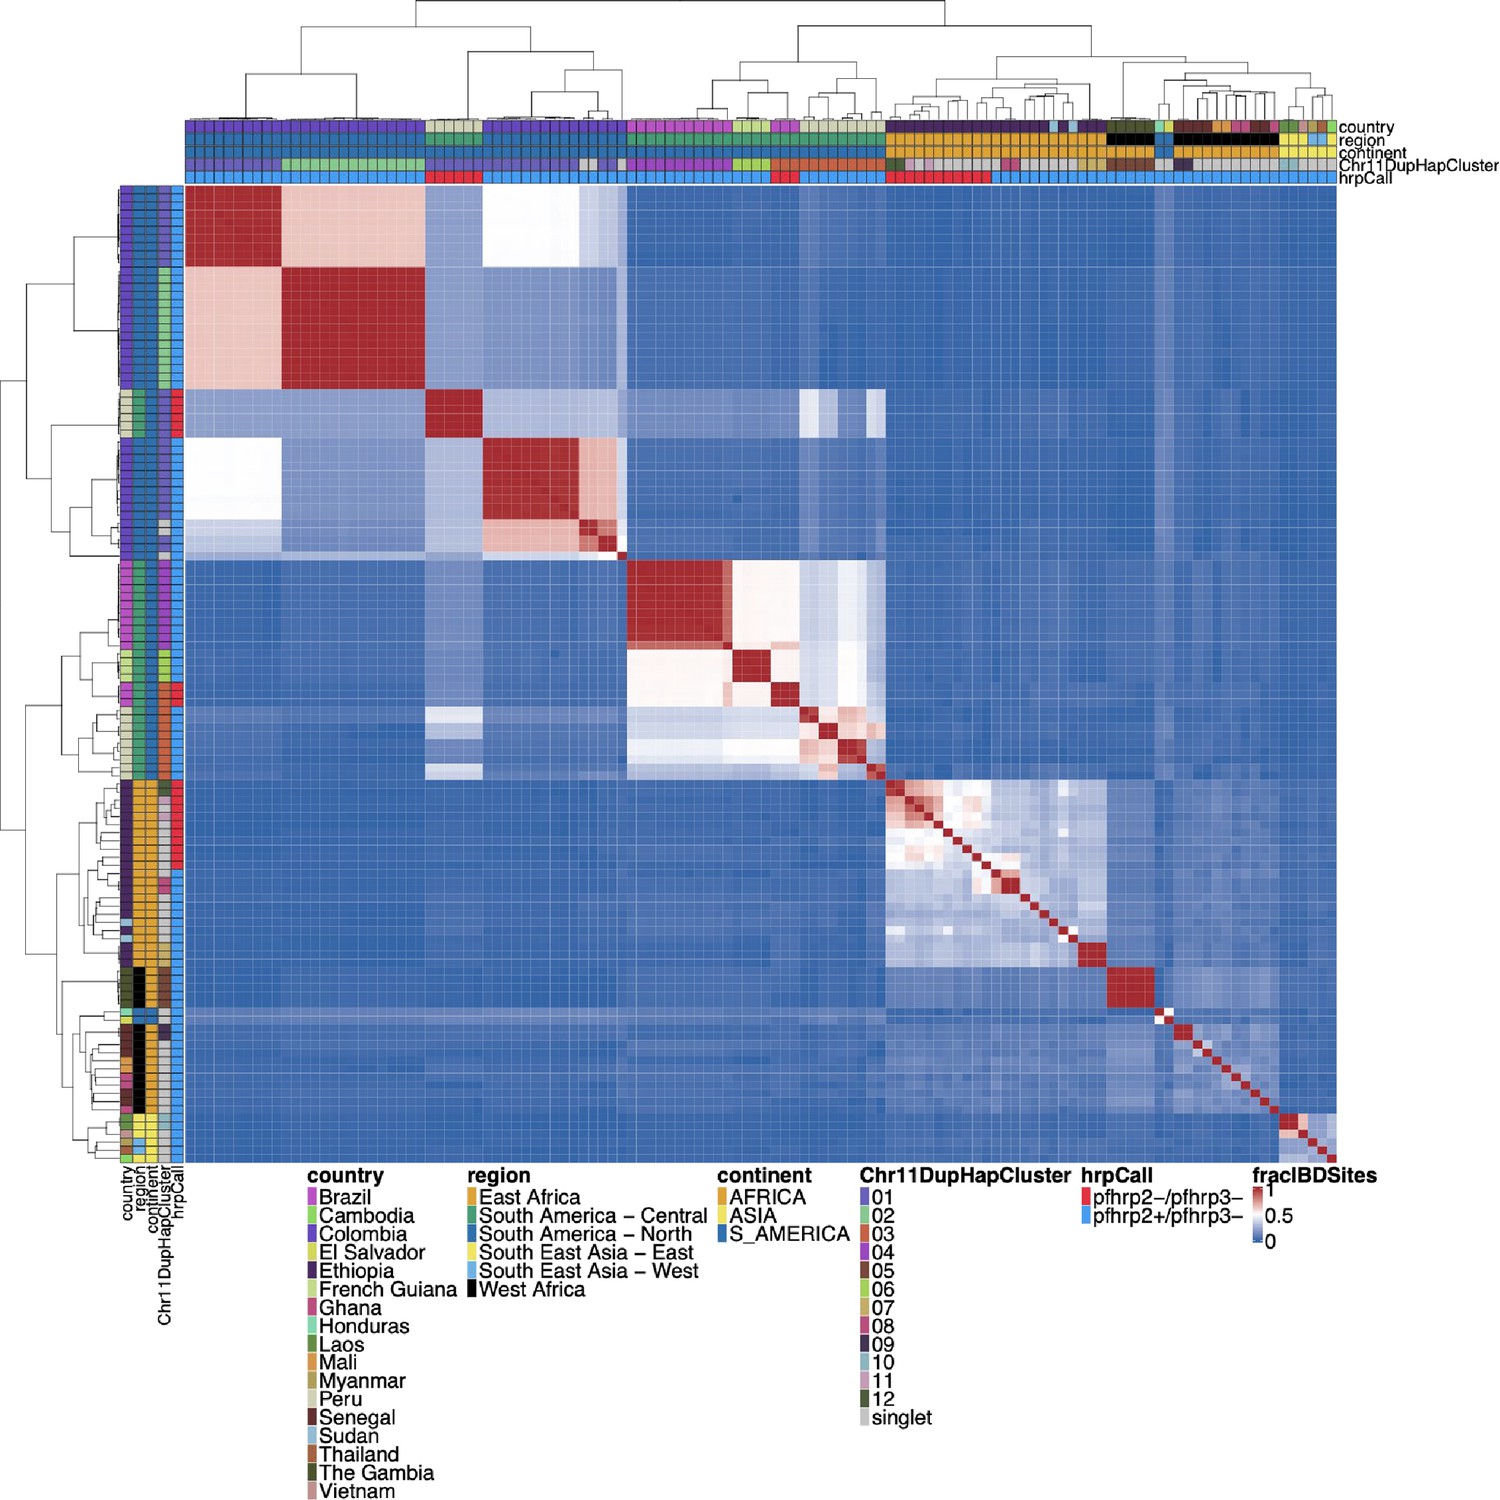
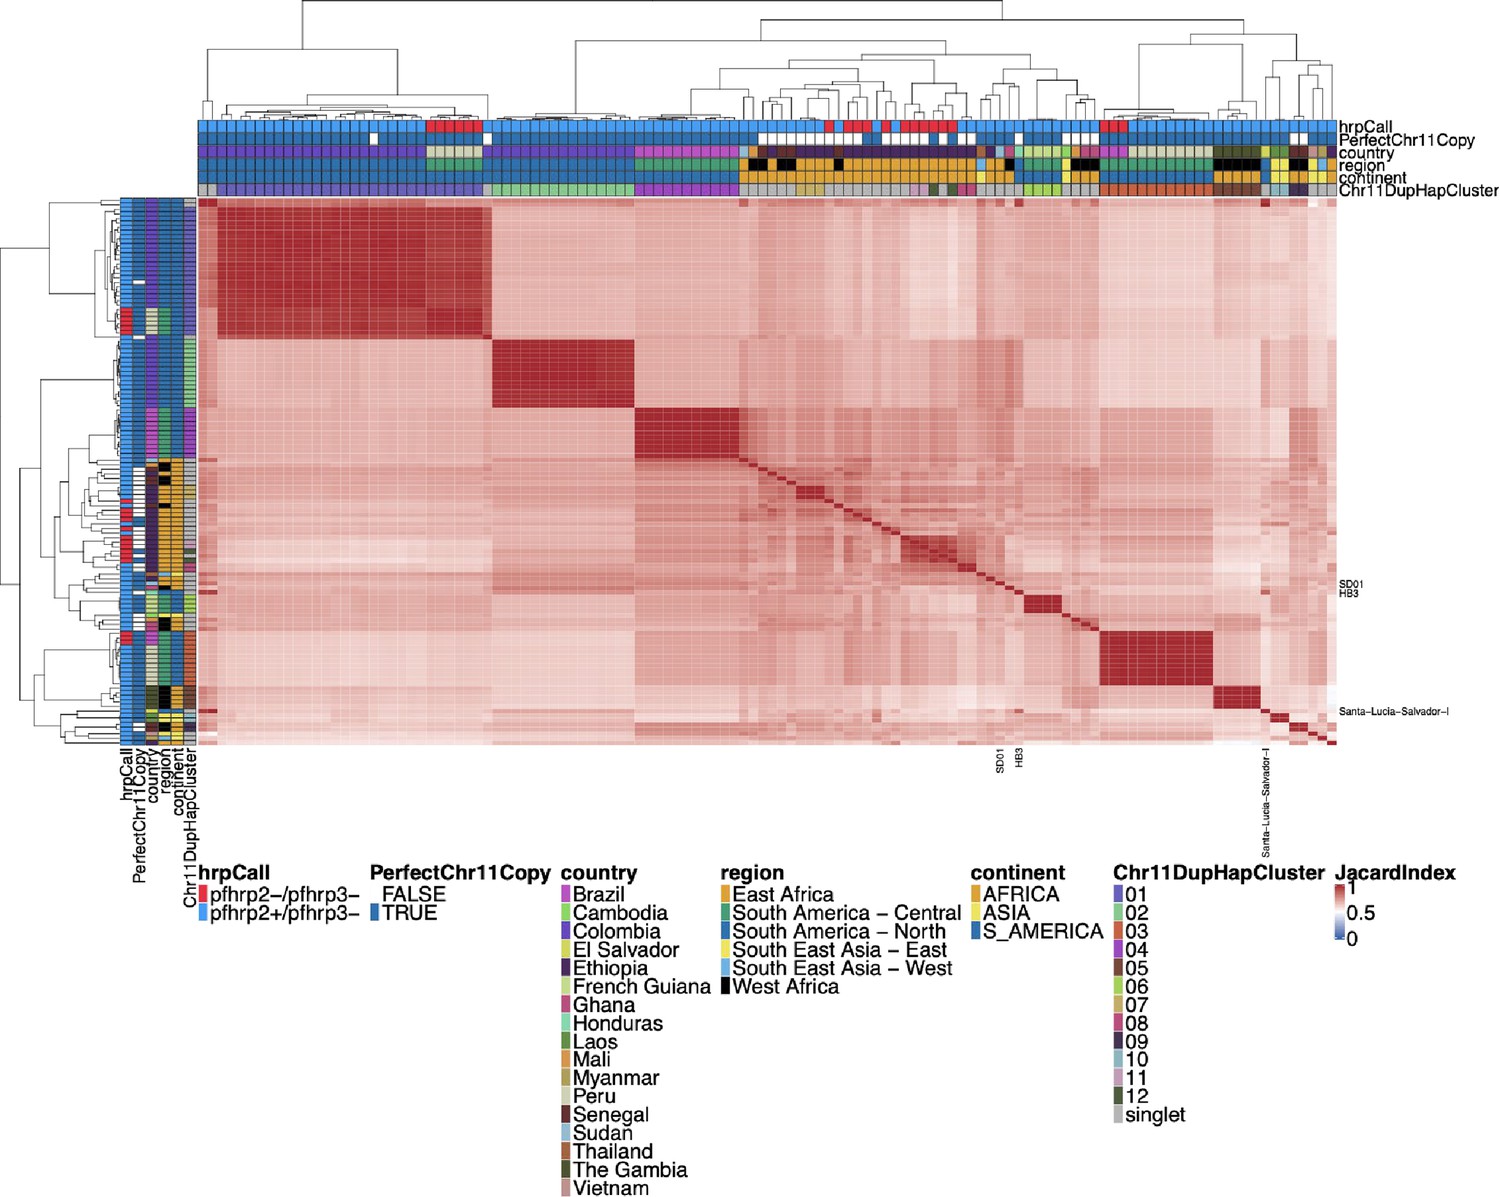
Whole genome identity by descent (IBD) between all parasites with a genomic deletion.
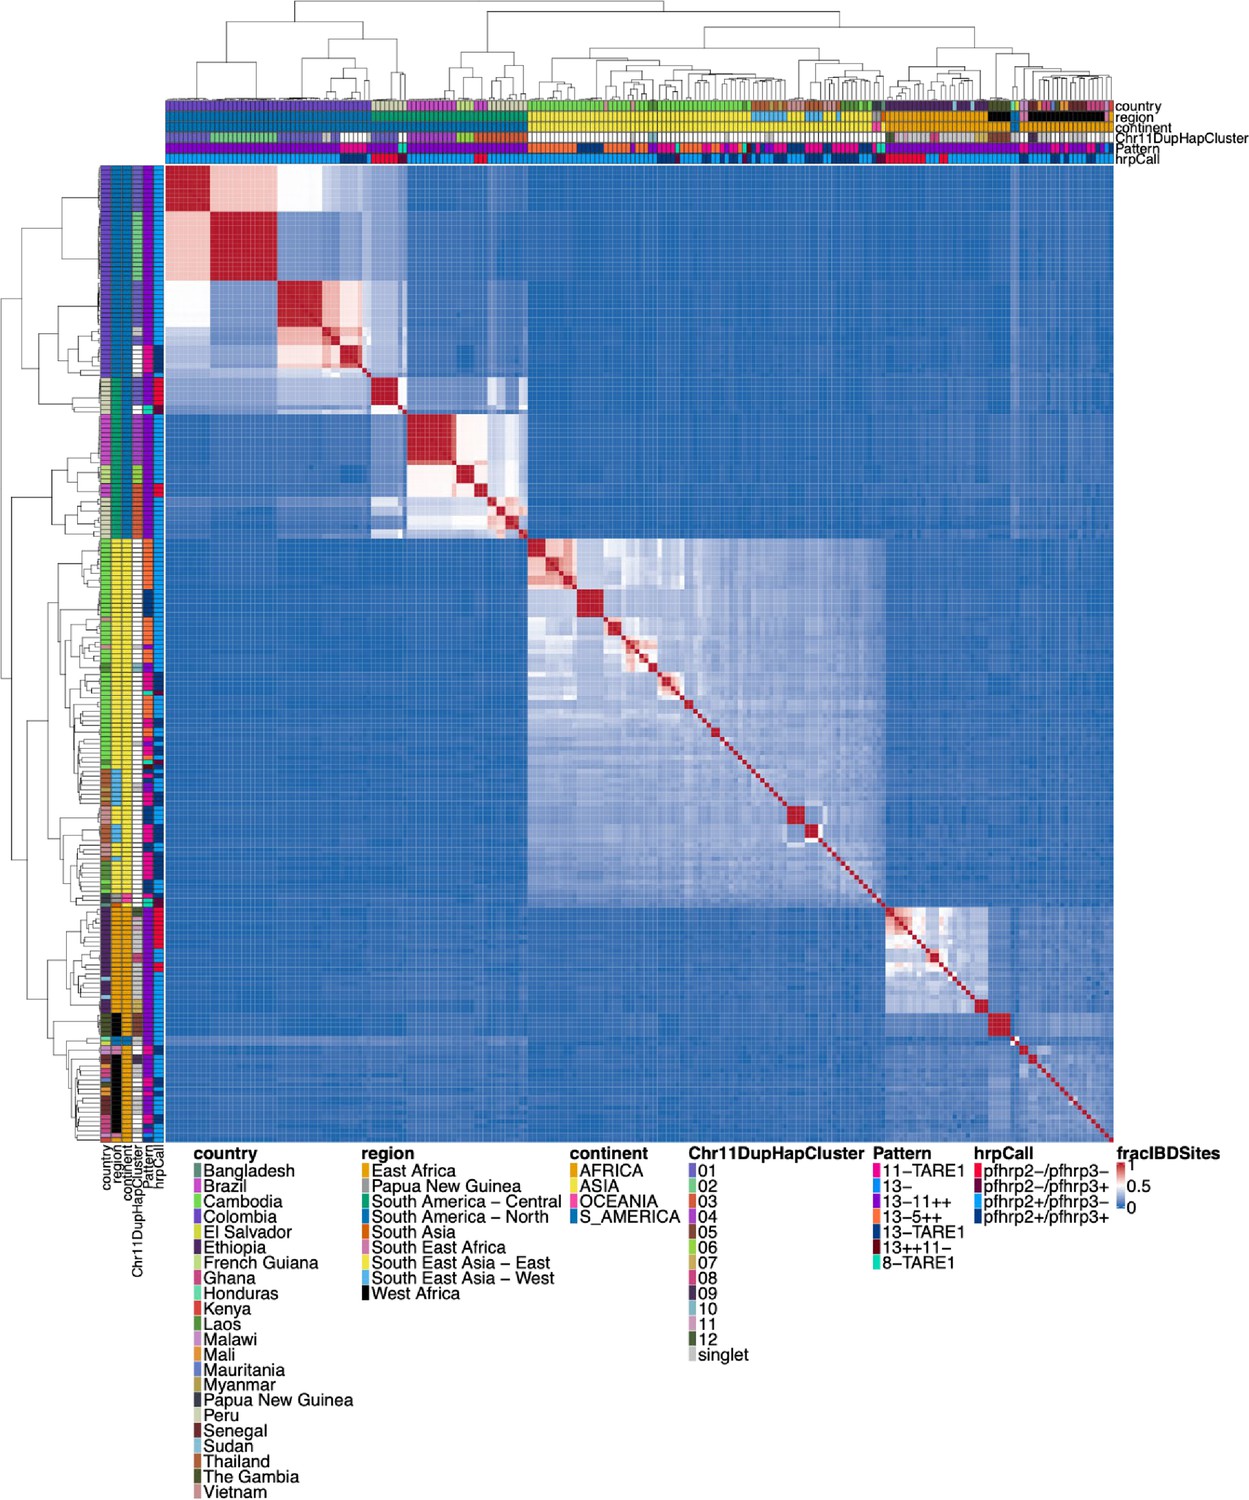
Whole genomic IBD was calculated between all parasites within this study with a genomic deletion (on chromosome 8, 11, or 13) using hmmIBD and whole genome biallelic single nucleotide polymorphisms (SNPs). The fraction of sites in IBD between parasites was plotted above. The top and left side annotations are the same and contain the parasite’s country, region, and continent of origin. The annotation also has the deletion calls for pfhrp2/3, the deletion Pattern, and which chromosome 11 haplotype cluster the parasite belongs to. The parasites cluster strongly by continent and by subregion/country. The two South American parasites clustered within the African samples are lab isolates HB3 and Santa-Luca-Salvador-1.
Figure 1—figure supplement 7
Whole genome identity by descent (IBD) between pfhrp3 deletion pattern 13-5++ parasites.
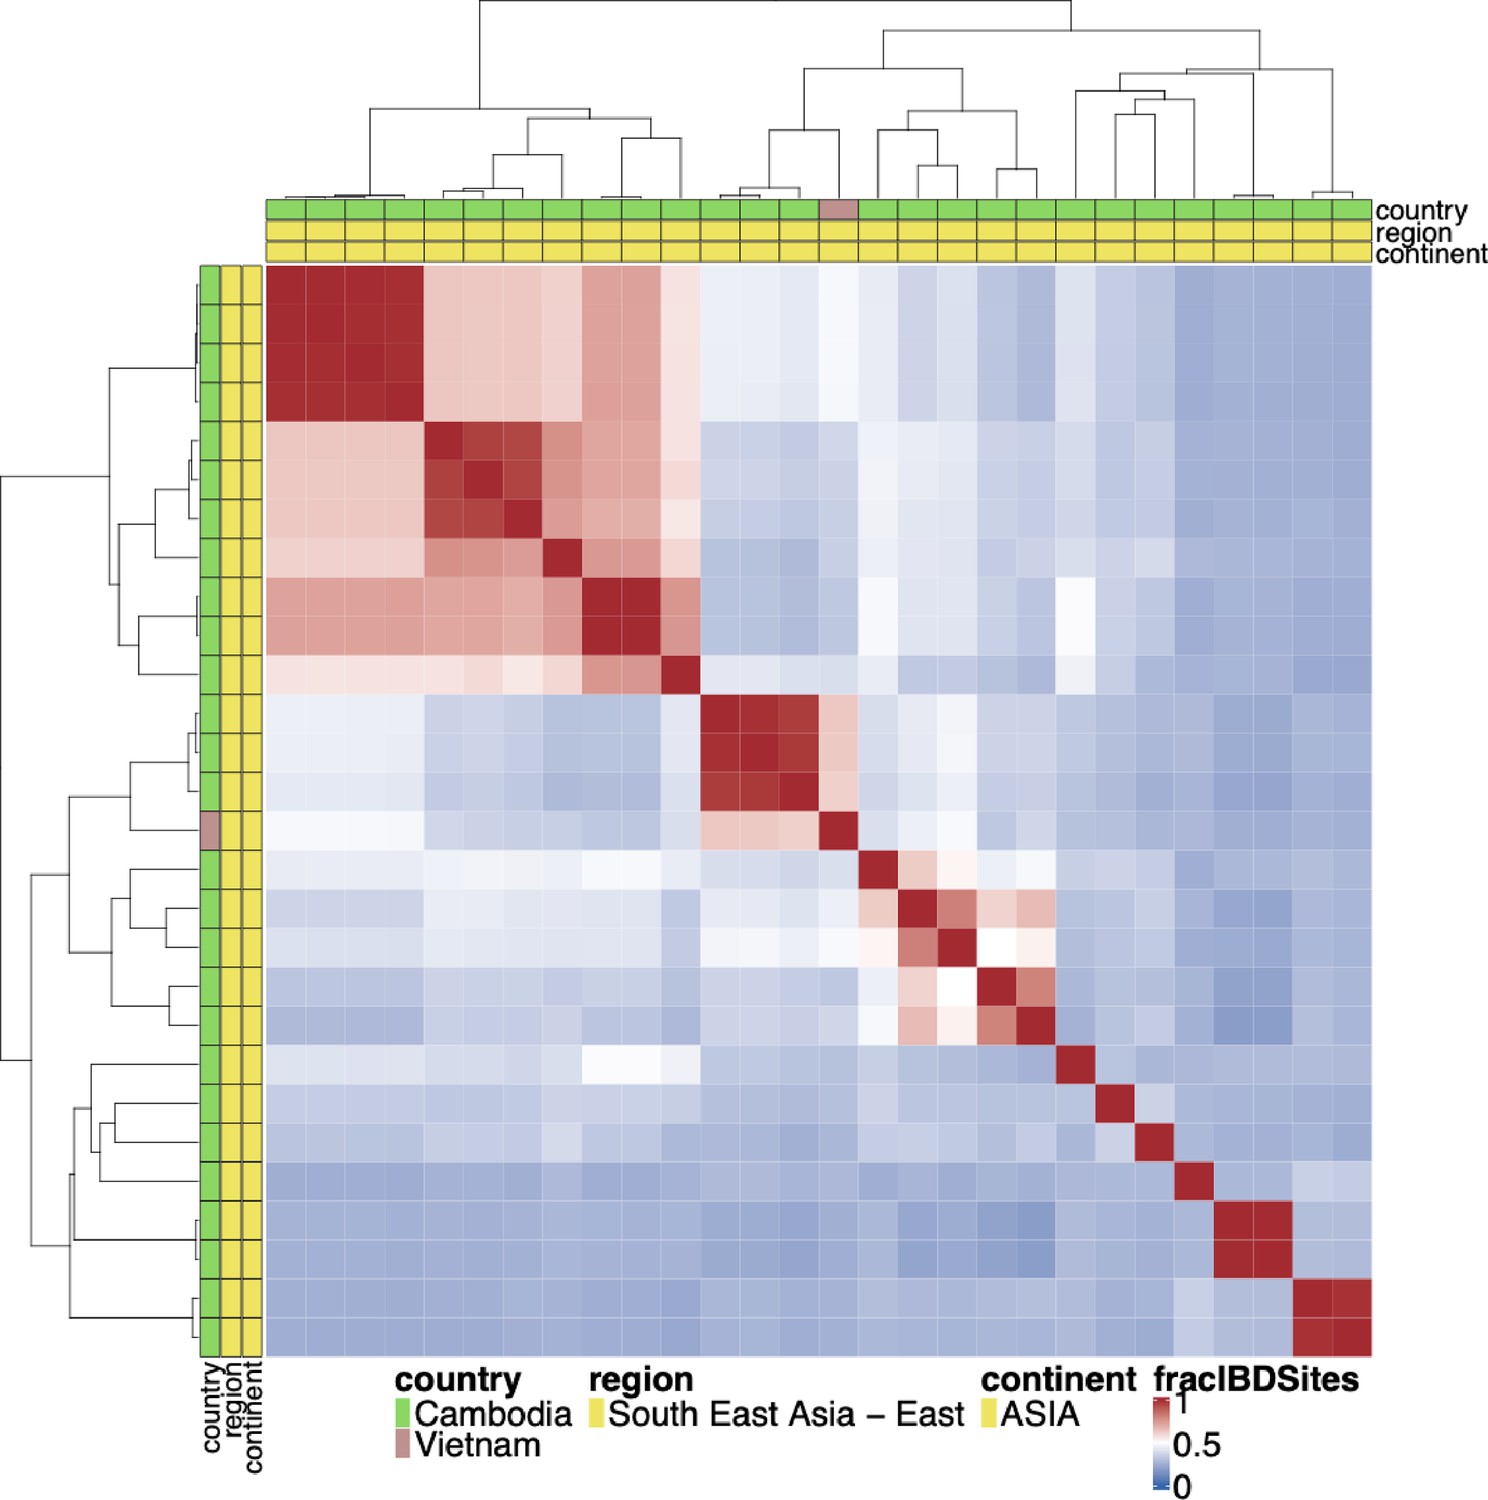
Whole genome IBD was calculated between pfhrp3 deletion pattern 13-5++ parasites using hmmIBD using whole genome biallelic single nucleotide polymorphisms (SNPs). The fraction of sites in IBD between parasites was plotted above. The top and left side annotations are the same and contain the parasite’s country, region, and continent of origin. Haplotypes do not appear like a clonal expansion of a parasite containing the 13–5 hybrid chromosome, and either multiple different events occurred to create this hybrid translocation, or it occurred once, and the hybrid 13–5 chromosome has been passed onto prodigies which have continued to undergo sexual recombination decreasing their whole genome IBD.
Figure 2 with 6 supplements
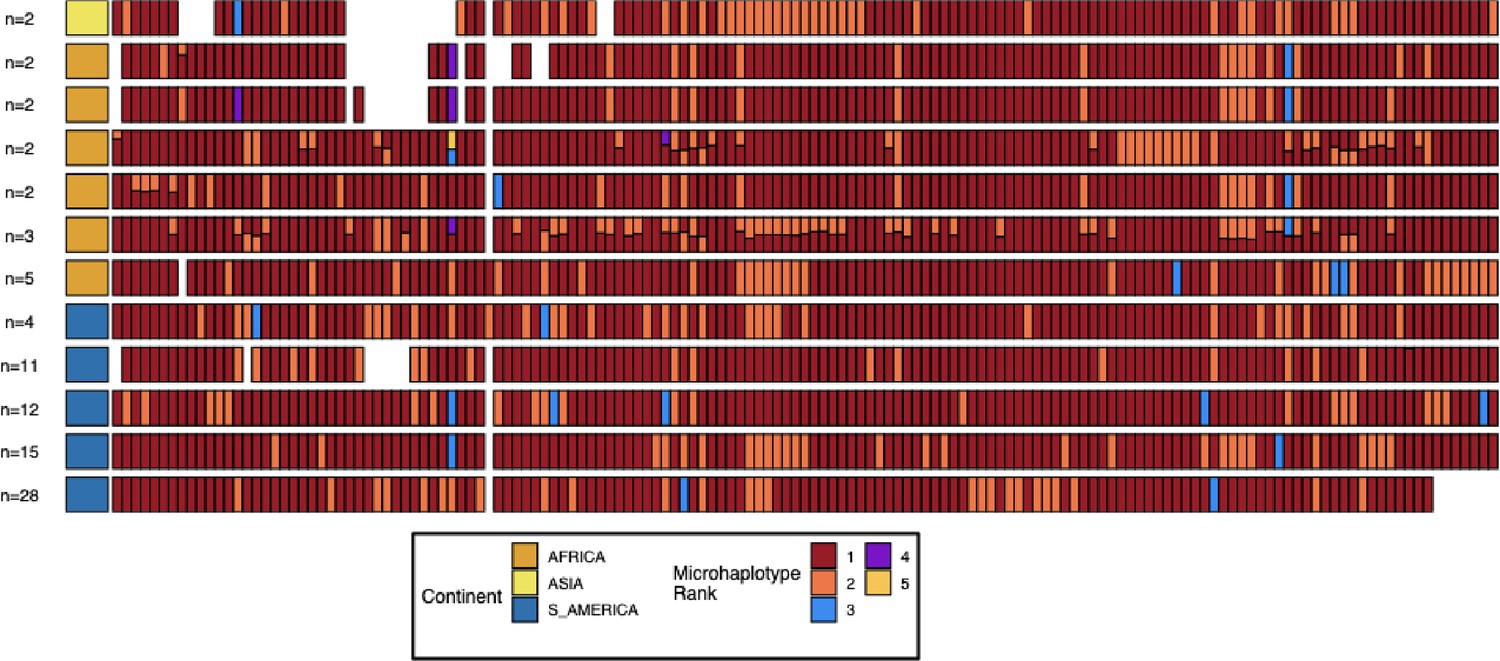
Microhaplotype patterns for the duplicated portion of chromosome 11 in 13-11++ parasites form 11 distinct haplotype groups with a geographic distinction between Africa and the Americas.
Each row represents a group of 13-11++ parasites based on shared haplotypes on the chromosome 11 duplicated segment. The number of parasites and continent of origin are on the left for each group. Each column is a different genomic region across the duplicated portion of chromosome 11. In each column, the microhaplotype is colored by the prevalence of each microhaplotype (named Microhaplotype Rank), with 1=red being the most prevalent, 2=orange being the second most prevalent, and so forth. If more than one microhaplotype for a parasite is present at a genomic location, its height is relative to within-parasite frequency. Only sites with microhaplotype variation are shown (n=202). Most parasites show singular haplotypes at variant positions despite two copies consistent with identical haplotypes in the group, and when there are multiple microhaplotypes, the relative frequencies are 50/50, consistent with two divergent copies. Overall, haplotype groups are markedly different, consistent with separate translocations emerging and spreading independently.
Figure 2—figure supplement 1
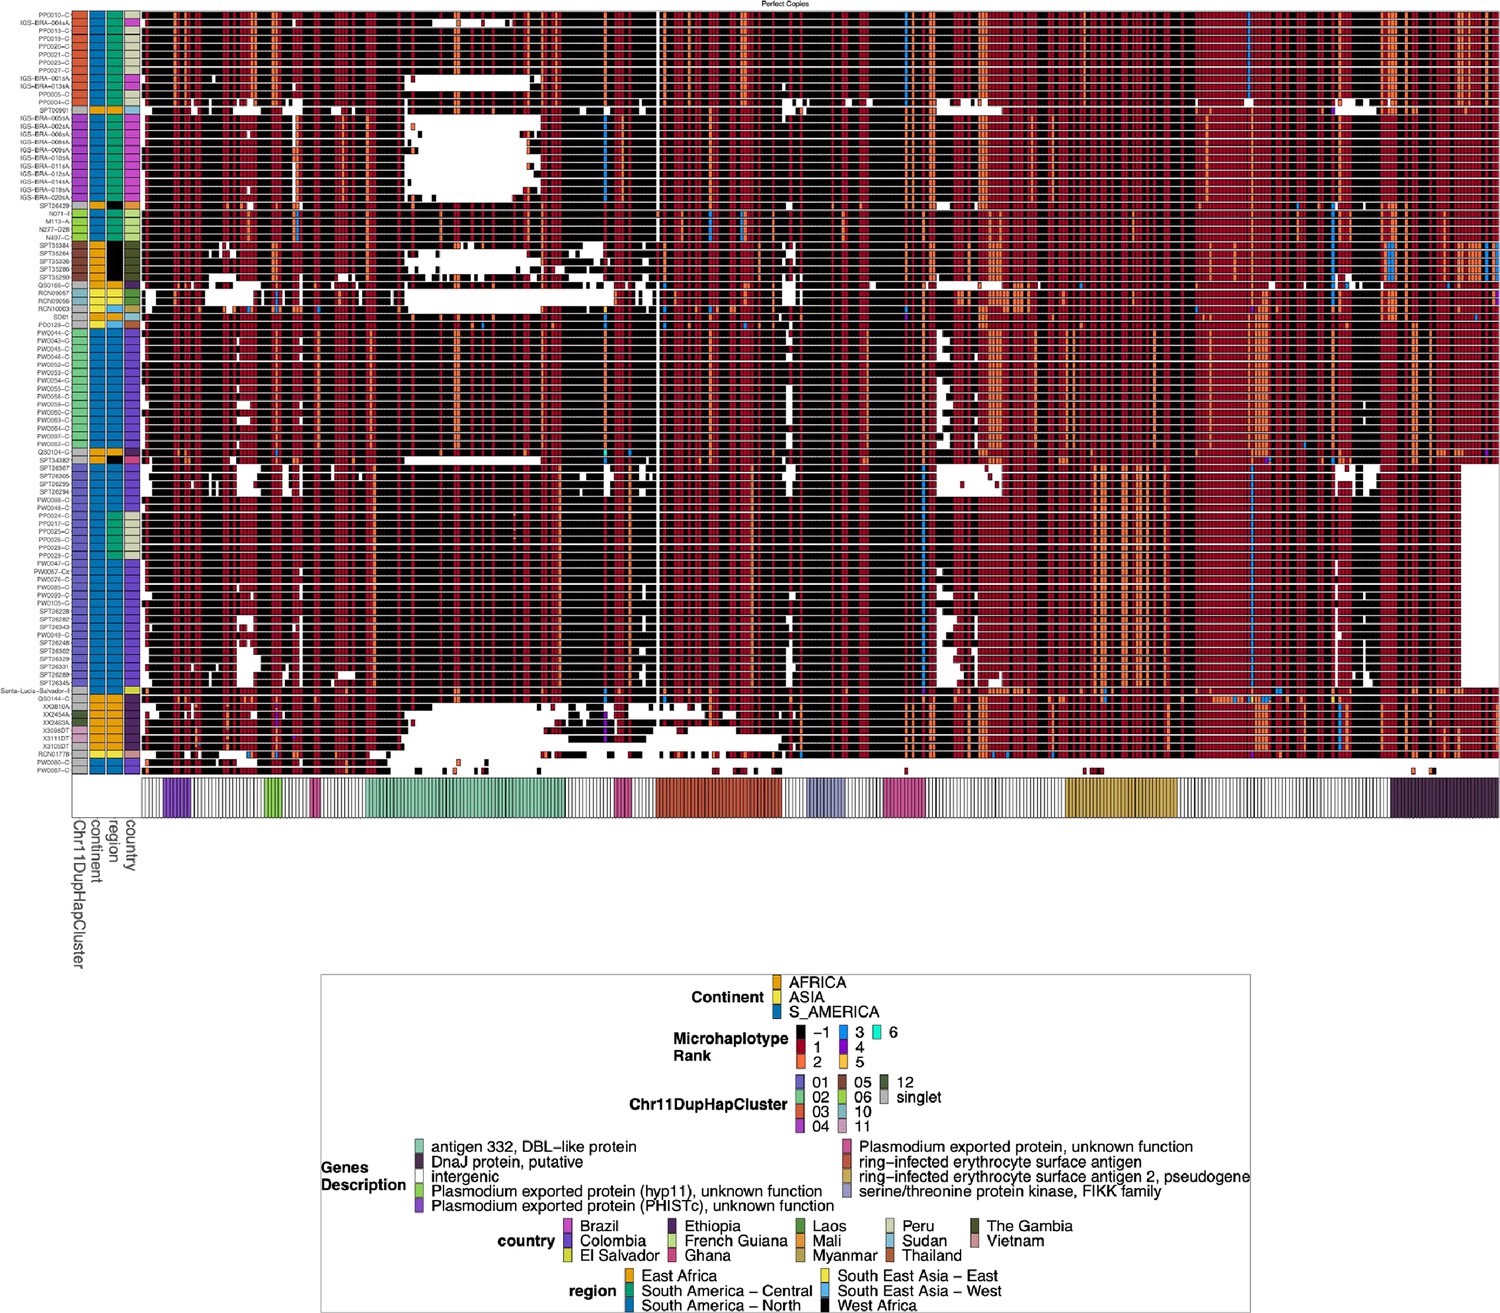
Chromosome 11 Duplicated Segment pfhrp3 deletion Pattern 13-11++ parasites with perfect copies.
Subset of the parasites from Figure 2—figure supplement 4 for the parasites that have a perfect duplication of the chromosome 11 segment. There are clear divergent haplotypes (nine can be found in multiple samples, with the largest group being found in 28 samples) for the perfect duplications, consistent with the duplication event occurring multiple times and does not stem from a single event from which all parasites are descended.
Figure 2—figure supplement 2
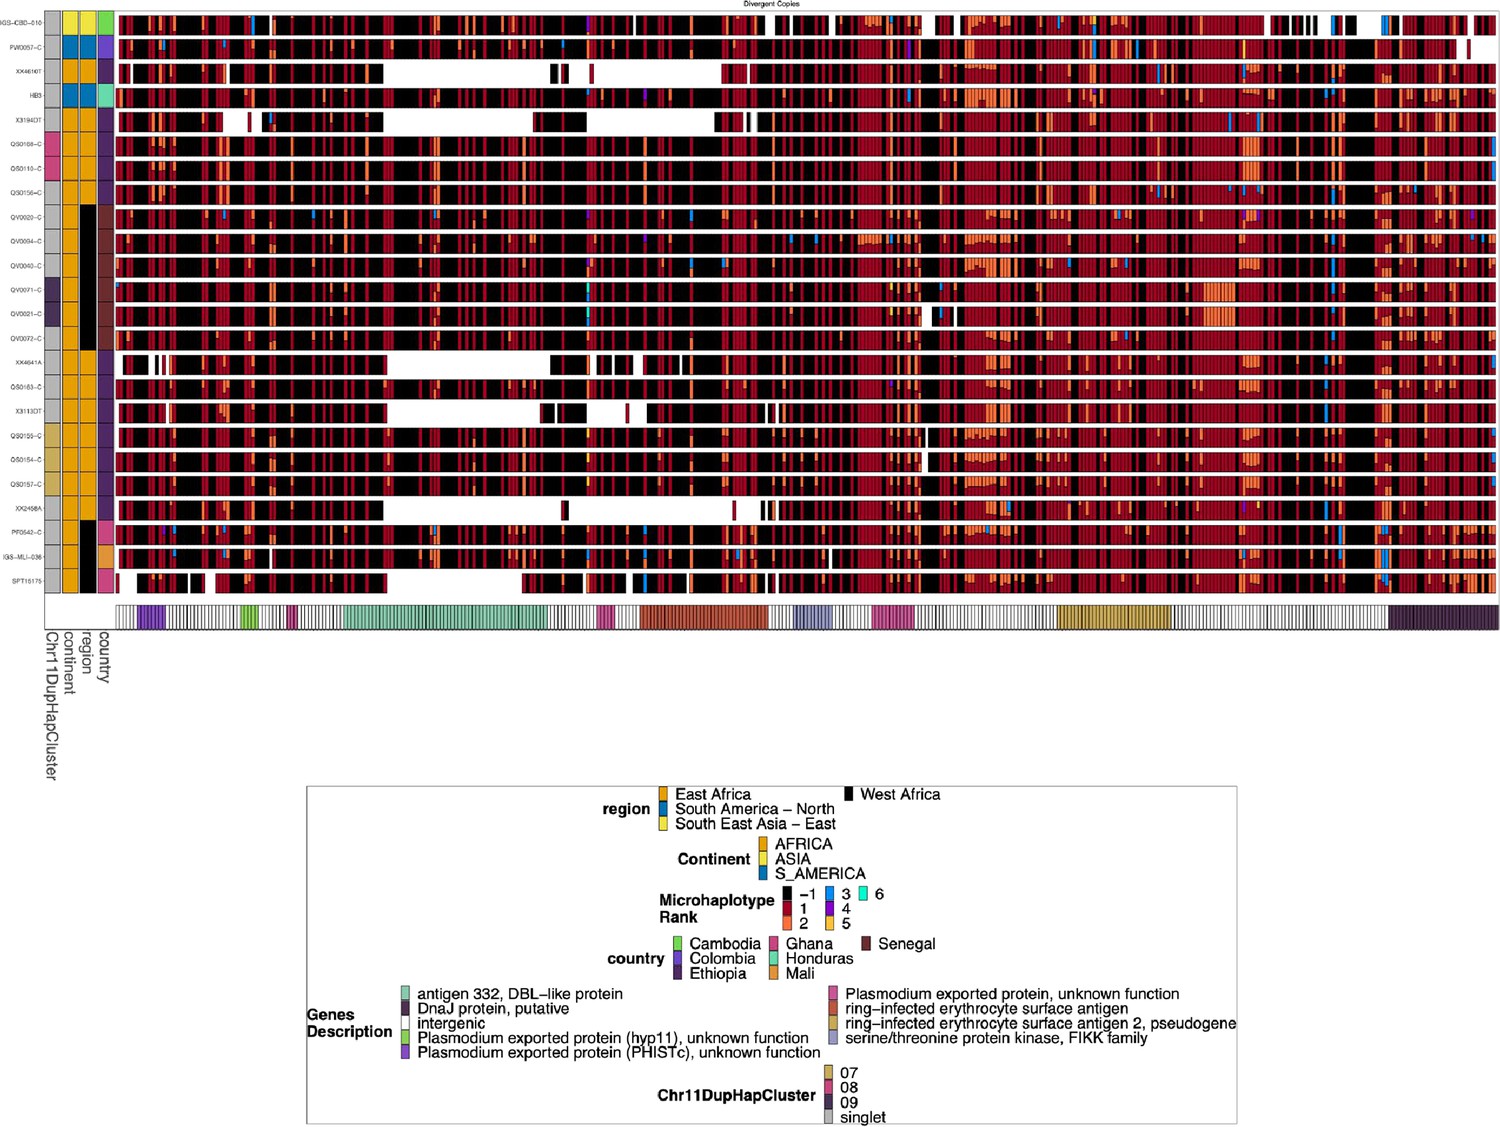
Chromosome 11 Duplicated Segment pfhrp3 deletion Pattern 13-11++ parasites with divergent chromosome 11 copies.
Subset of the parasites from Figure 2—figure supplement 4 for the parasites that have divergent duplicates of the chromosome 11 segment. Several parasites have divergent chromosome 11 segments, but they share the same exact divergent copies with other parasites, which would be consistent with the coinheritance of the two divergent copies simultaneously. This could be consistent with parasites inheriting from previous duplication events involving divergent copies or meiotic recombination between parasites with two separate duplication events of disparate chromosome 11 segments, inheriting one chromosome 11 segment on chromosome 13 from parent 1 and a different chromosome 11 segment on chromosome 11 from parent 2.
Figure 2—figure supplement 3
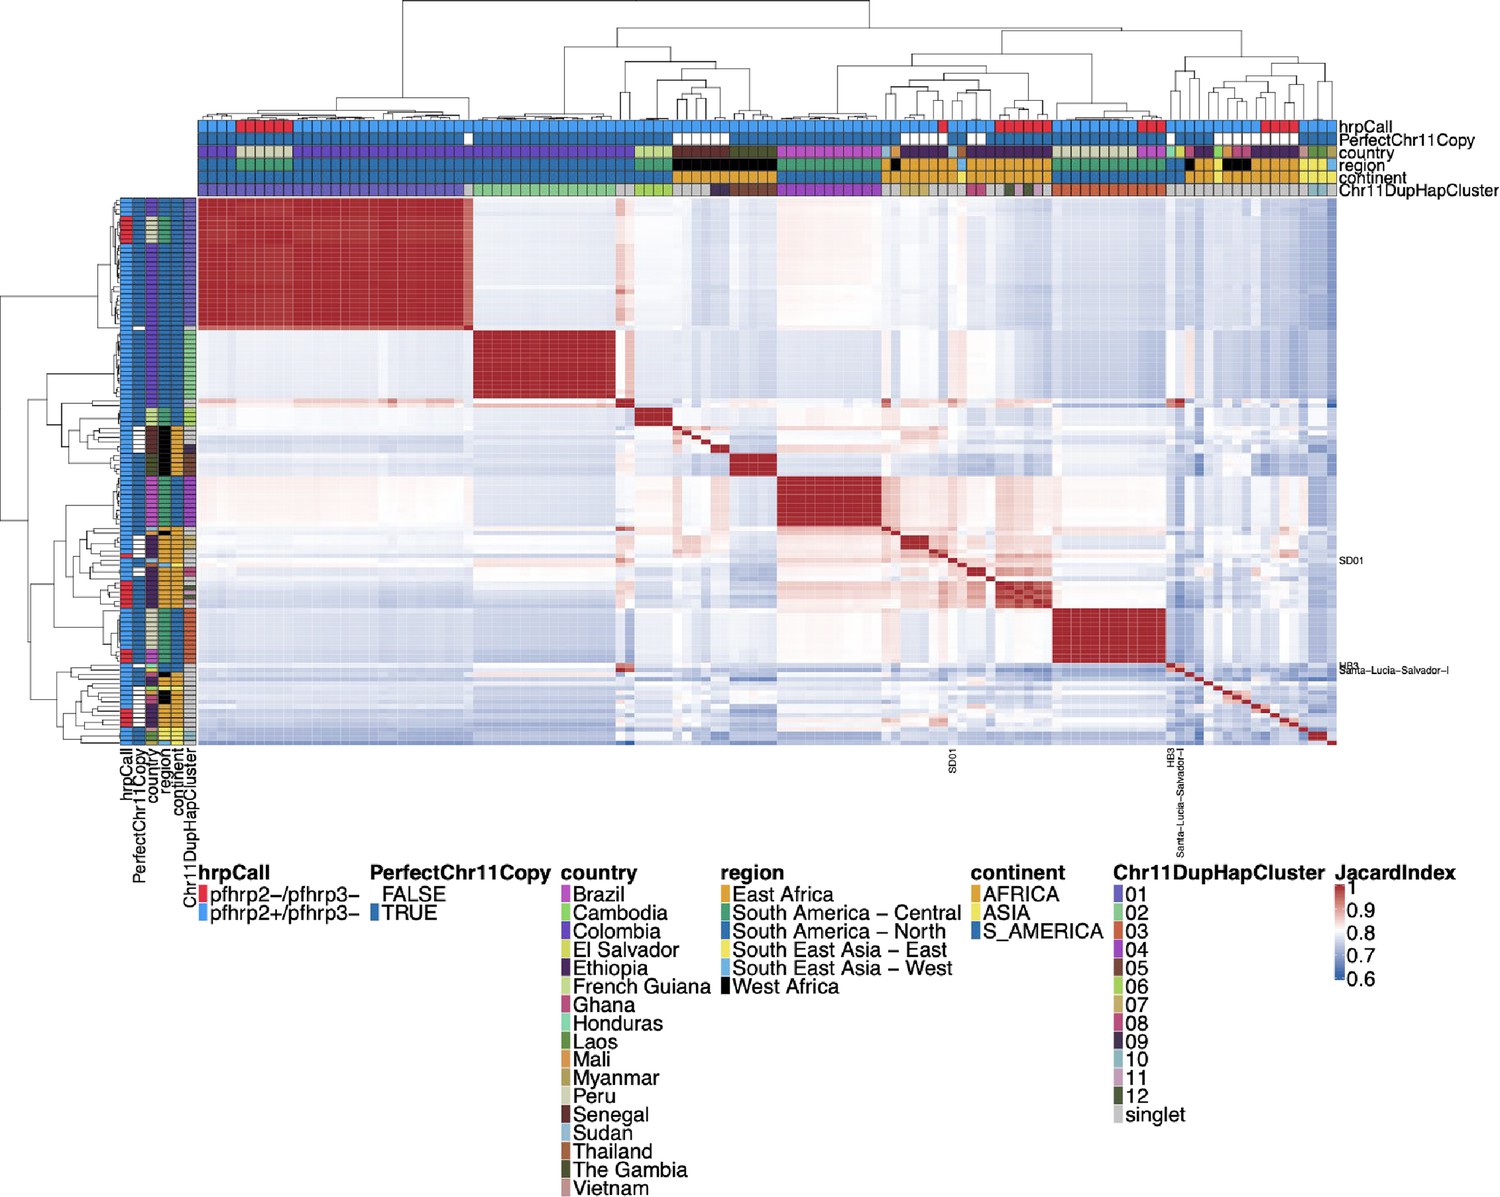
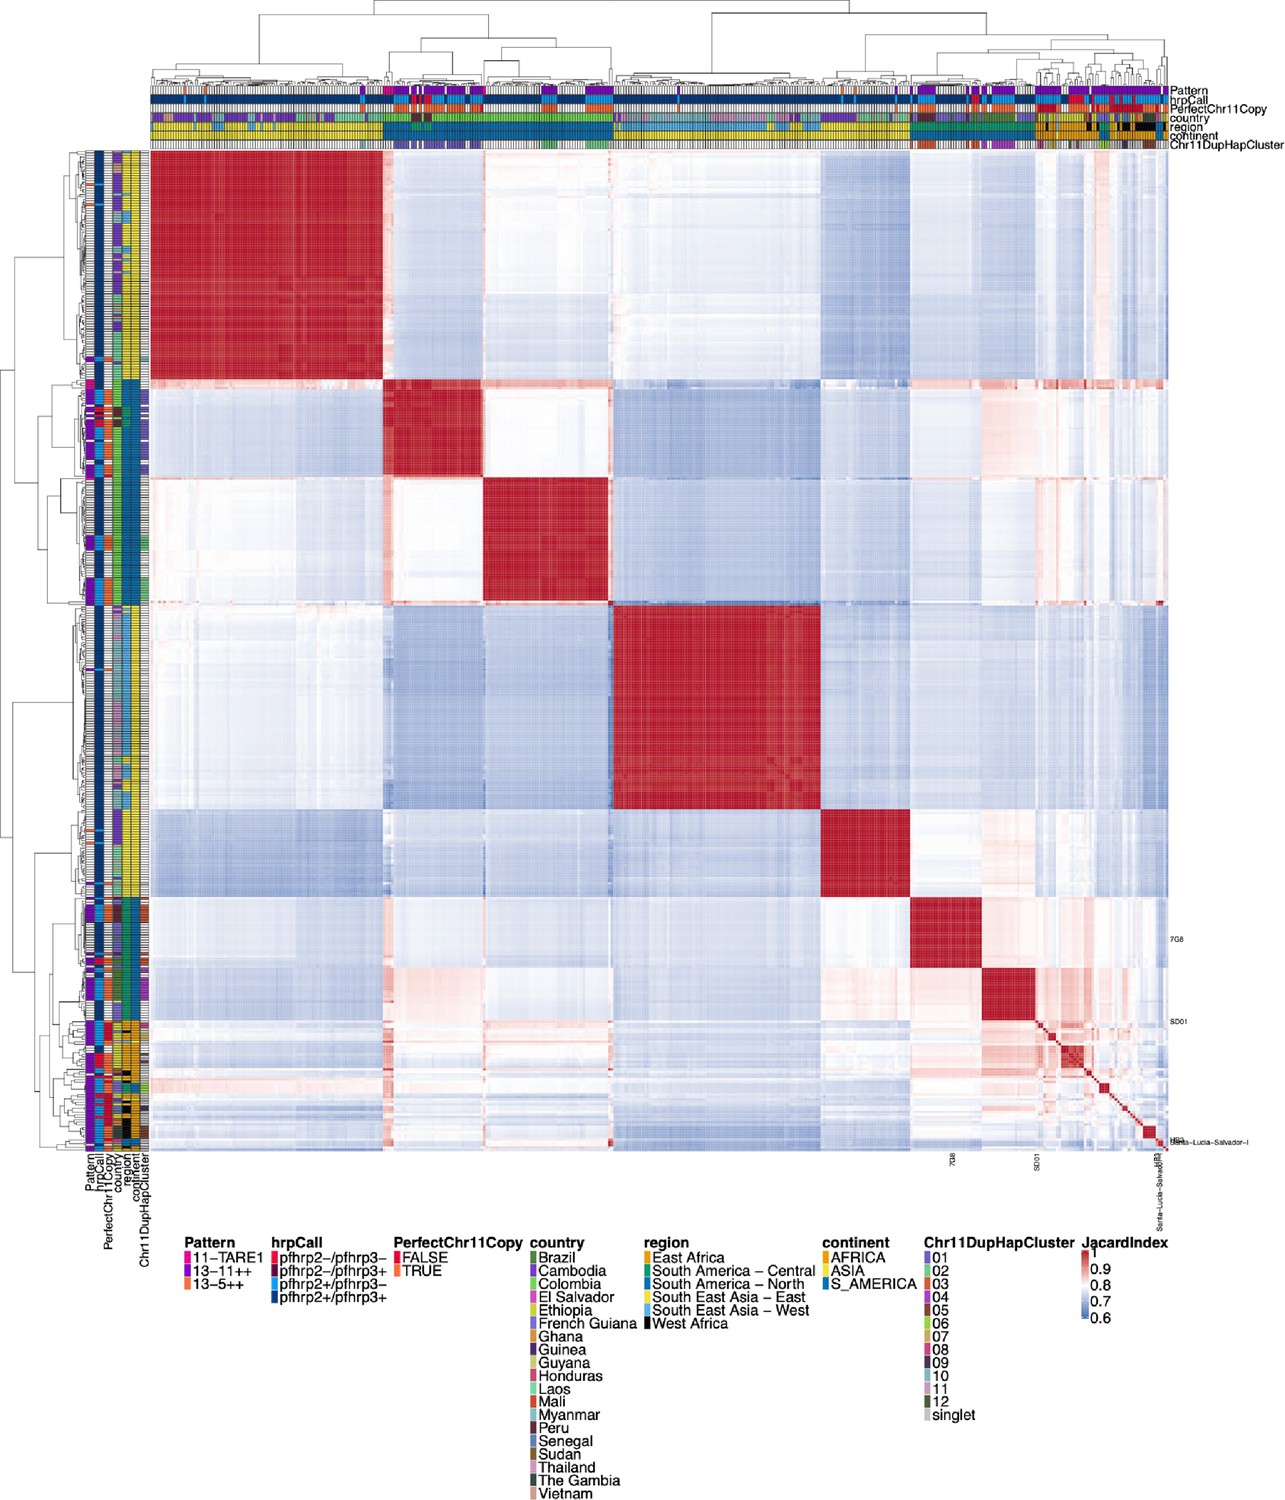
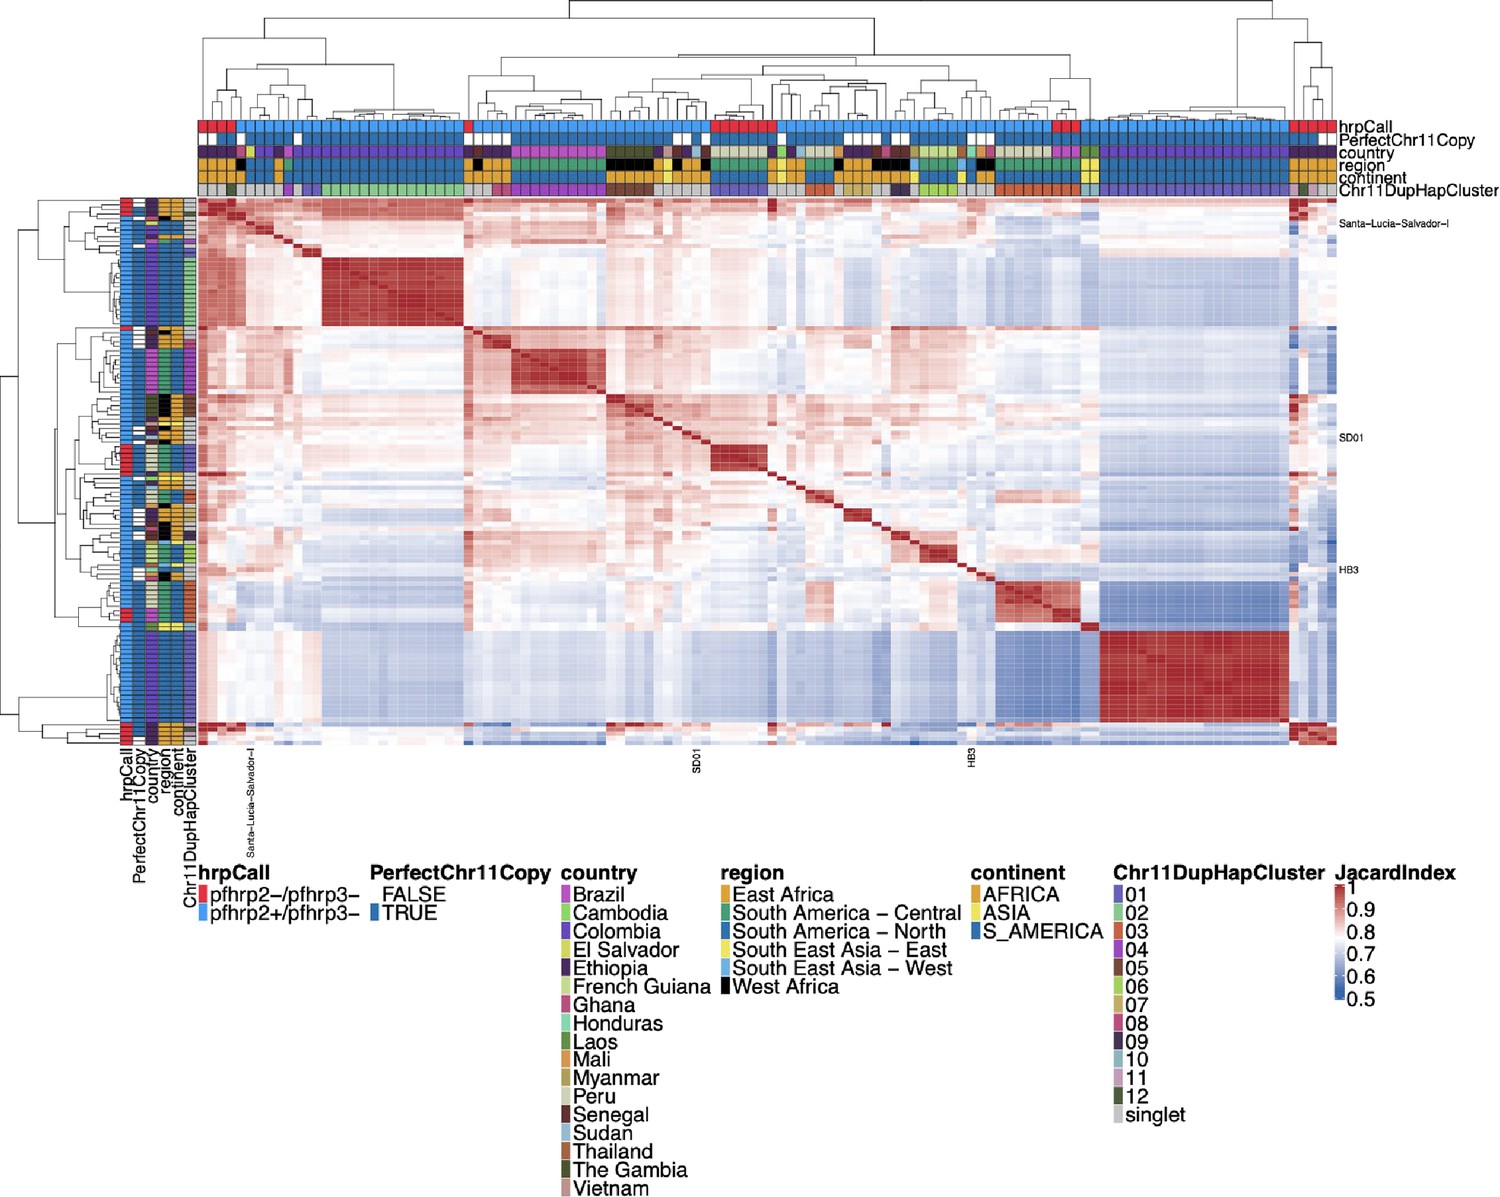
Jaccard similarity between parasites for chromosome 11 duplicated segment for pfhrp3 deletion pattern 13-11++ parasites.
This is an all-by-all distance matrix showing Jaccard similarity for the duplicated chromosome 11 segments between all parasites with pfhrp3 deletion pattern 13-11++. The parasites’ continent, region, and country are annotated on the sides of the heatmap, along with the pfhrp2/3 deletion calls and whether the chromosome 11 duplicated segment shows an identical haplotype across the chromosome 11 duplicated segment. There are clearly several different haplotypes within the duplicated chromosome 11 segment, and there does not appear to be one specific haplotype associated with the duplication. The haplotypes found in more than 1 sample are clustered into ‘Chr11DupHapClusters’ and colored in the annotation bar. Parasites group strongly by geographical location.
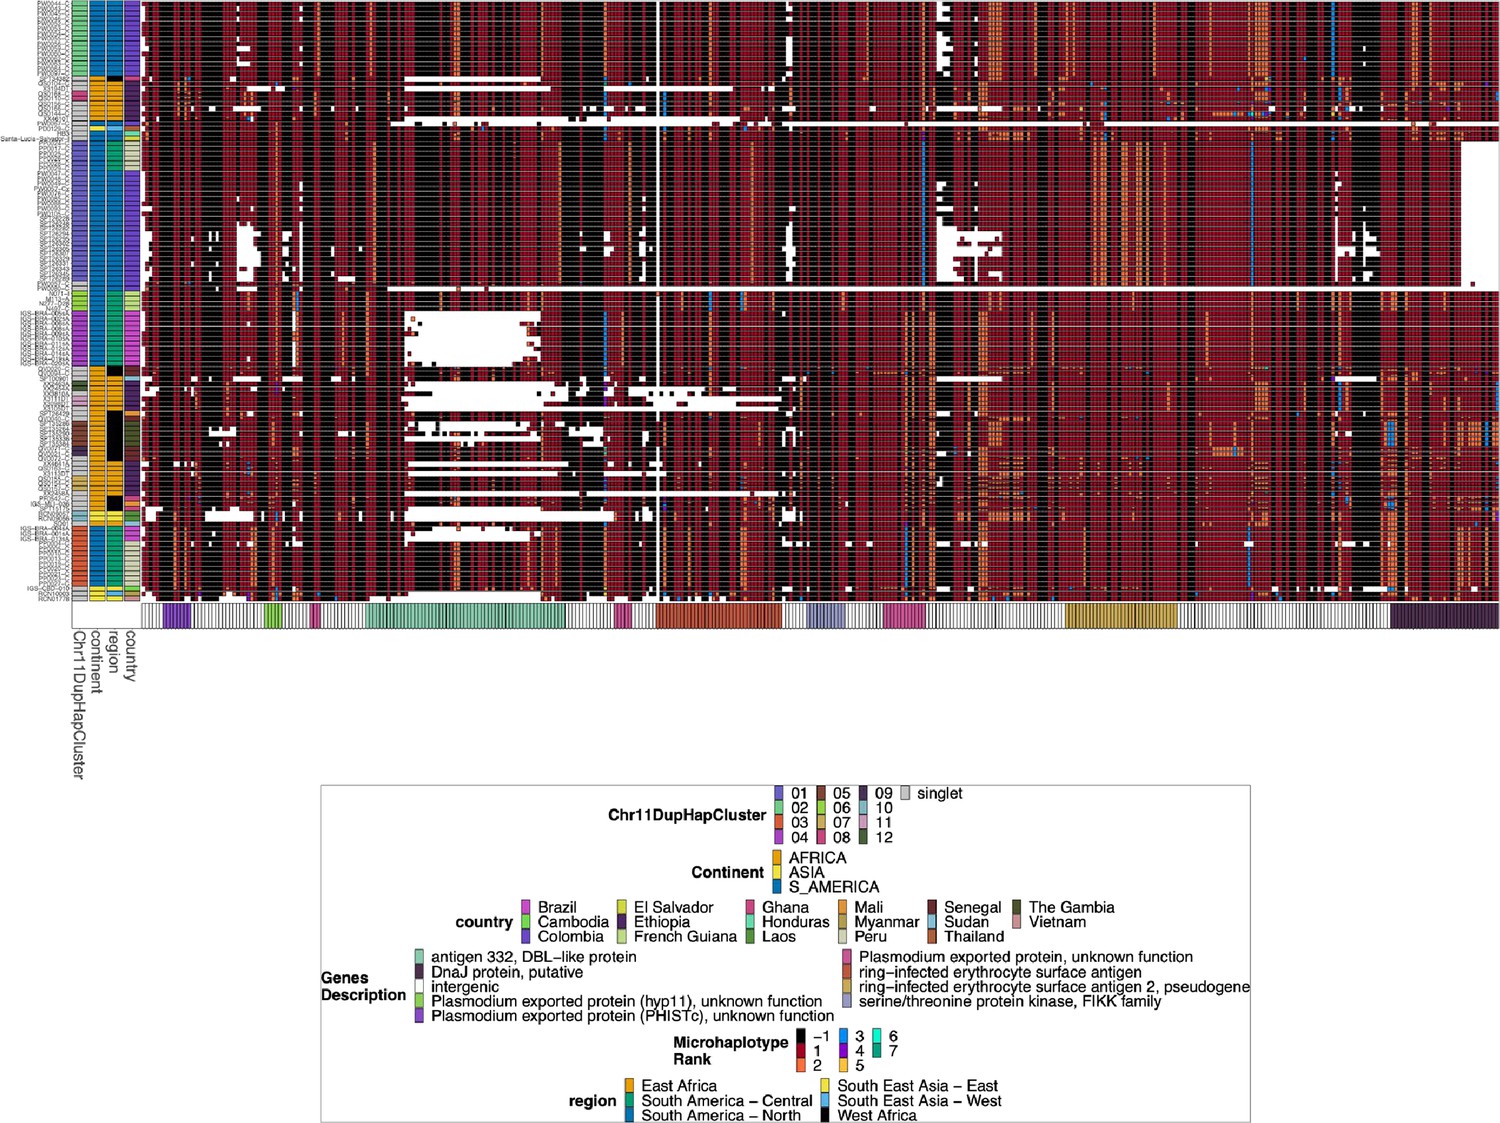
Figure 2—figure supplement 4
Chromosome 11 Duplicated Segment pfhrp3 deletion Pattern 13-11++ parasites.
Plotted haplotype variation per sub-genomic regions across the duplicated chromosome 11 segment for the pfhrp3 pattern 13-11++ parasites. Across the x-axis are the genomic regions in genomic order, and the genomic region genes are colored on the bottom bar. Each genomic area is slightly different in size, and there is genomic space between each region, so the plot is not on a genomic scale. The y-axis is each parasite with pattern 13-11++ of pfhrp3 deletion where this segment of chromosome 11 is duplicated onto chromosome 13. The continent, region, and country are colored per parasite on the leftmost of the plot. Each column contains the haplotypes for that genomic region colored by the haplotype prevalence rank more prevalent have a lower rank number, with most prevalent having rank (1) at that window/column. Colors are by frequency rank of the haplotypes most prevalent haplotypes have rank 1 and colored red, second most prevalent haplotypes are rank 2 and colored orange, and so forth. Shared colors between columns do not mean they are the same haplotype. If the column is black, there is no variation at that genomic window. If there is more than one variant for a parasite at a genomic location, the bar’s height is the relative within-parasite frequency of that haplotype for that parasite. The parasites are in the same order as the heatmap dendrogram in Figure 2—figure supplement 3. There are clear, distinctive haplotypes for this duplicated region. The leftmost annotation bar shows which cluster (based on the sharing >99% identity in this area) the parasite belongs to, which is named ‘Chr11DupHapCluster’.
Figure 2—figure supplement 5
Jaccard similarity for chromosome 11 duplicated segment.
All parasites with micohaplotypes similar to the duplicated chromosome 11 microhaplotypes for the pfhrp3 deletion Pattern 13-11++ parasites. While similar to Figure 2—figure supplement 3, this all-by-all heatmap of Jaccard similarity includes all parasites with a similar chromosome segment to the parasites with pattern 13-11++ pfhrp3 deletions. For the side and top annotations of parasites that do not have chromosome 11 duplication, there is a white bar for whether or not they have perfect chromosome 11 duplication. There are many parasites with closely related chromosome 11 segments to the duplicated chromosome 11 segments, indicating that the duplicated chromosome 11 segments also circulate within the population in strains with normal chromosome 11 and 13 arrangements.
Figure 2—figure supplement 6
Chromosome 11 duplicated segment coverage for pfhrp3 deletion Pattern 13-11++ parasites SD01, HB3, and Salvador 1.
Subset of the parasites from Figure 2—figure supplement 4 but for SD01 and HB3, which were sequenced in this paper, and for Santa-Luca-Salvador-1, another lab isolate that shows similar pfhrp3 deletion pattern 13-11++. SD01 and Santa-Luca-Salvador-1 have perfect copies, while HB3 has divergent copies.
Figure 3 with 7 supplements
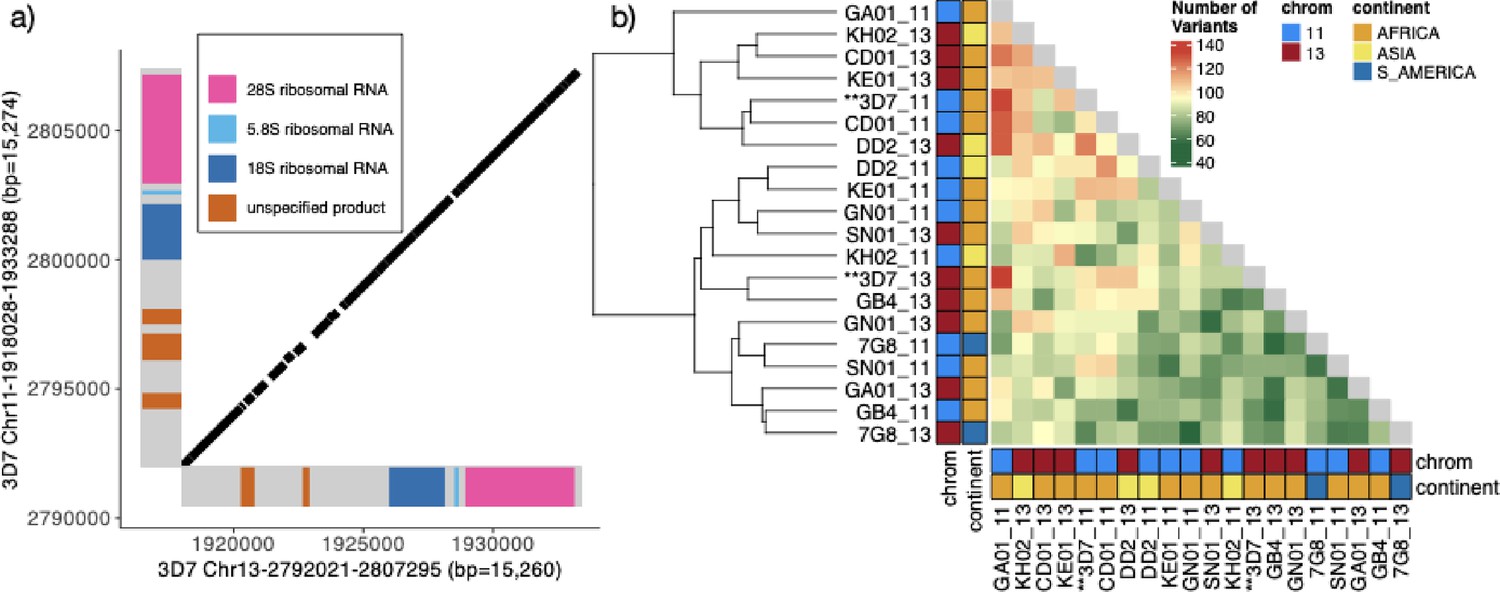
Characterization of the 15.2 kb segmental duplication containing ribosomal genes on chromosomes 11 and 13.
(a) Alignment of 3D7 reference genome copies on chromosome 11 (1,918,028–1,933,288 bp) and chromosome 13 (2,792,021–2,807,295 bp). These two regions are 99.3% identical. The diagonal black bars show 100% conserved regions of at least 30 bp in length, representing 89.1% of the alignment. Gene annotation is colored. (b) Comparison by pairwise alignments of the duplicated copies from non-pfhrp3 deleted strains (Otto et al., 2018a) assemblies (n=10) does not show a discrete separation of the paralogs with copies intermixed (chromosome 11 in blue and 13 in red). All copies are ≥99.0% similar, with the number of variants between segments ranging from 55 to 133 with no clear separation by continent or chromosome.
Figure 3—figure supplement 1
Jaccard similarity for Chromosome 11/13 15.2 kb duplicated region for pfhrp3 deletion pattern 13-11++ parasites.
An all-by-all distance matrix showing Jaccard similarity for the chromosome 11 and 13 duplicated region between all the parasites with pfhrp3 deletion pattern 13-11++. The top triangle is identical to the bottom triangle. Parasites’ continent, region, and country are annotated on the sides of the heatmap, as well as the pfhrp2/3 deletion calls and whether the chromosome 11 duplicated segment is a perfect copy. Sequences cluster loosely per geographic region, with similar sequences from the same country. However, parasites are not as strong separately by continent as for the duplicated chromosome 11 segment. Despite all parasites having duplicated chromosome 11 via this region, there are clearly different haplotype groups, consistent with multiple origins of this duplication event.
Figure 3—figure supplement 2
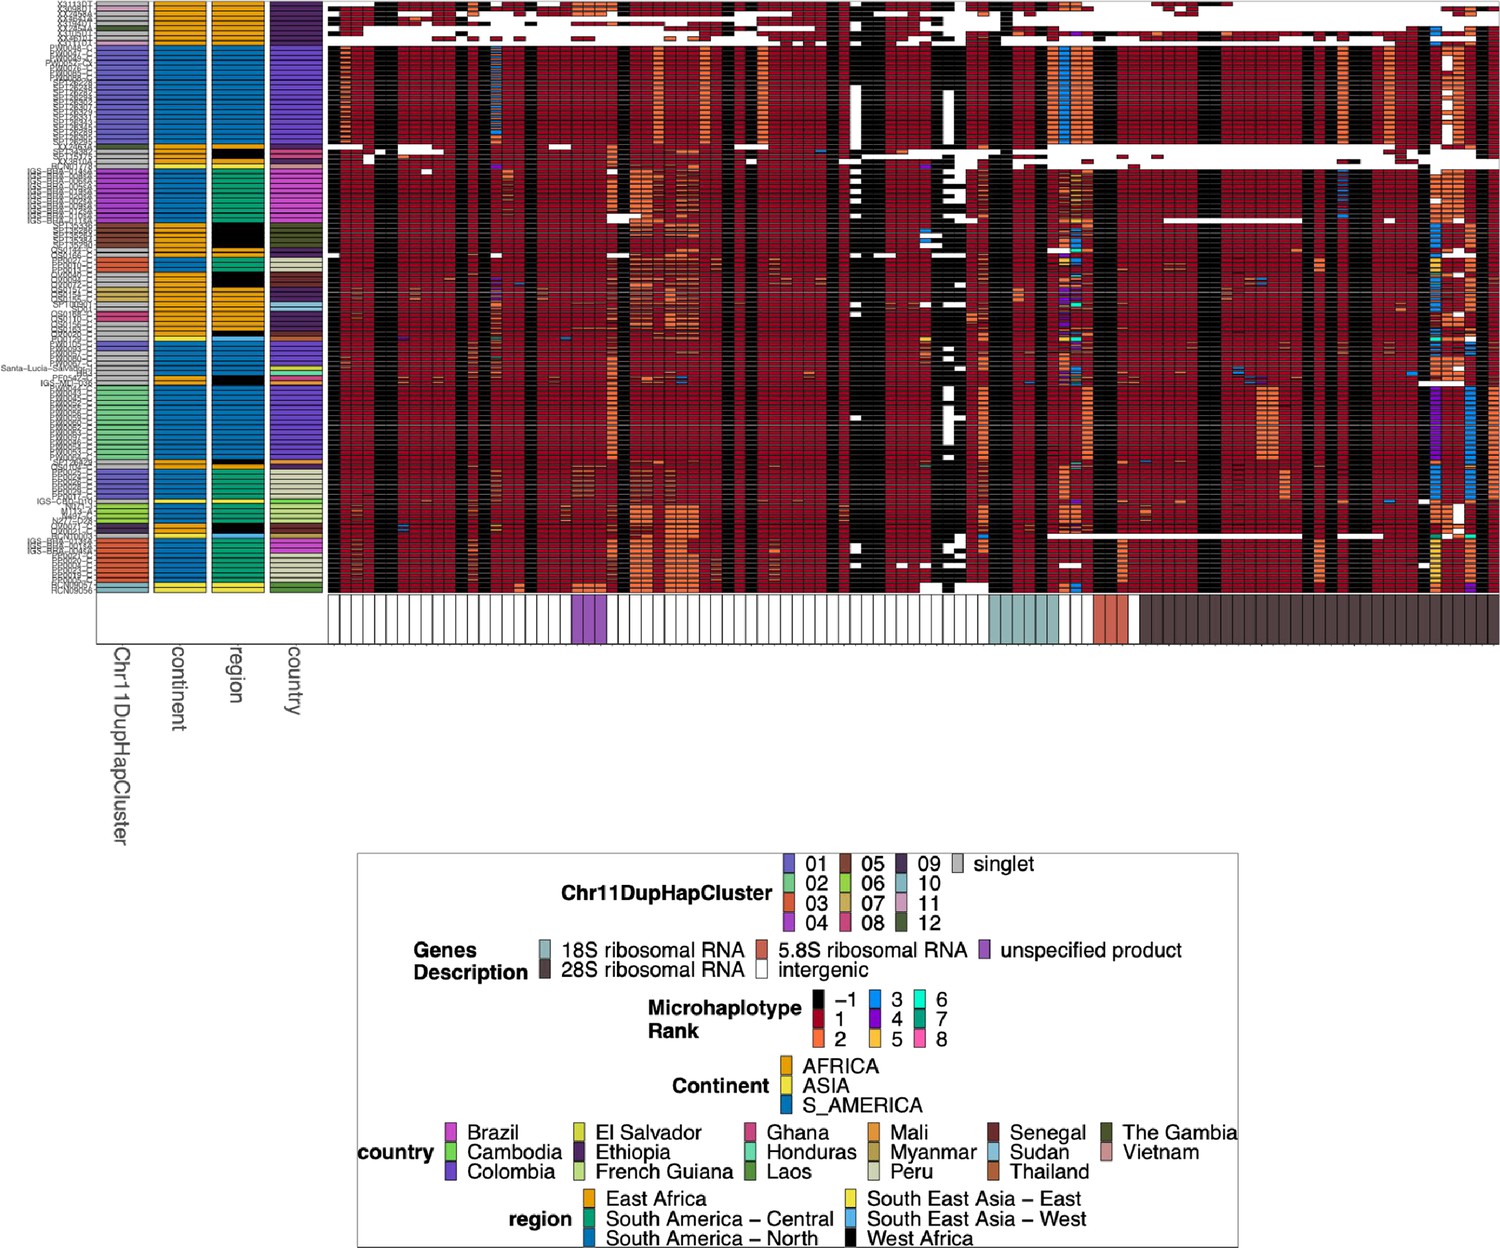
Chromosome 11/13 15.2 kb duplicated region for pfhrp3 deletion pattern 13-11++ parasites.
Plotted microhaplotype variation across the region shared between all chromosomes 11 and 13. Across the x-axis are the genomic regions in genomic order, and the genomic region genes are colored on the bottom bar. The y-axis is each parasite with pattern 13-11++ of pfhrp3 deletion where this segment of chromosome 11 is duplicated onto chromosome 13. The continent, region, and country are colored per parasite on the left most of the plot. Each column contains the haplotypes for that genomic region colored by the haplotype prevalence rank more prevalent have a lower rank number, with most prevalent having rank (1) at that window/column. Colors are by frequency rank of the haplotypes most prevalent haplotypes have rank 1 and colored red, second most prevalent haplotypes are rank 2 and colored orange, and so forth. Shared colors between columns do not mean they are the same haplotype. If the column is black, there is no variation at that genomic window. If there is more than one variant for a parasite at a genomic location, the bar’s height is the relative within-parasite frequency of that microhaplotype for that parasite. Pattern 13-11++ is missing 46,323 bases from chromosome 13 (2,807,159–2,853,482) with a gain of 70,190 bases of chromosome 11 (1,933,138–2,003,328). Based on genomes that are assembled to the end of their telomeres (Otto et al., 2018a), an additional 17–84 kb is deleted from the paralogous sub-telomeric region on chromosome 13, and an additional 15–87 kb of the paralogous sub-telomeric region on chromosome 11 is duplicated.
Figure 3—figure supplement 3
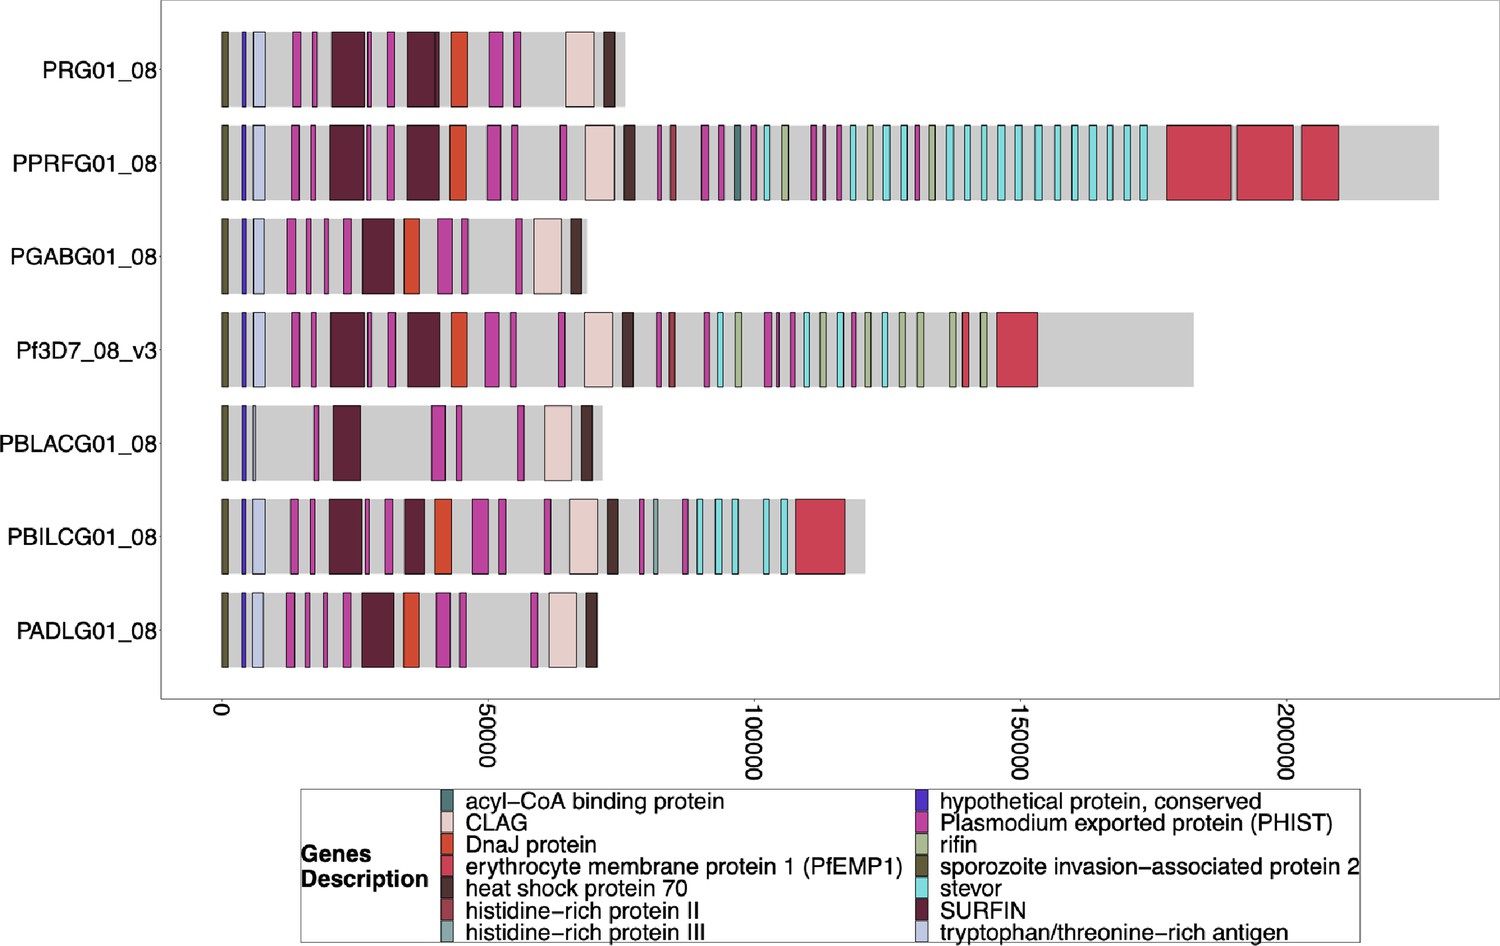
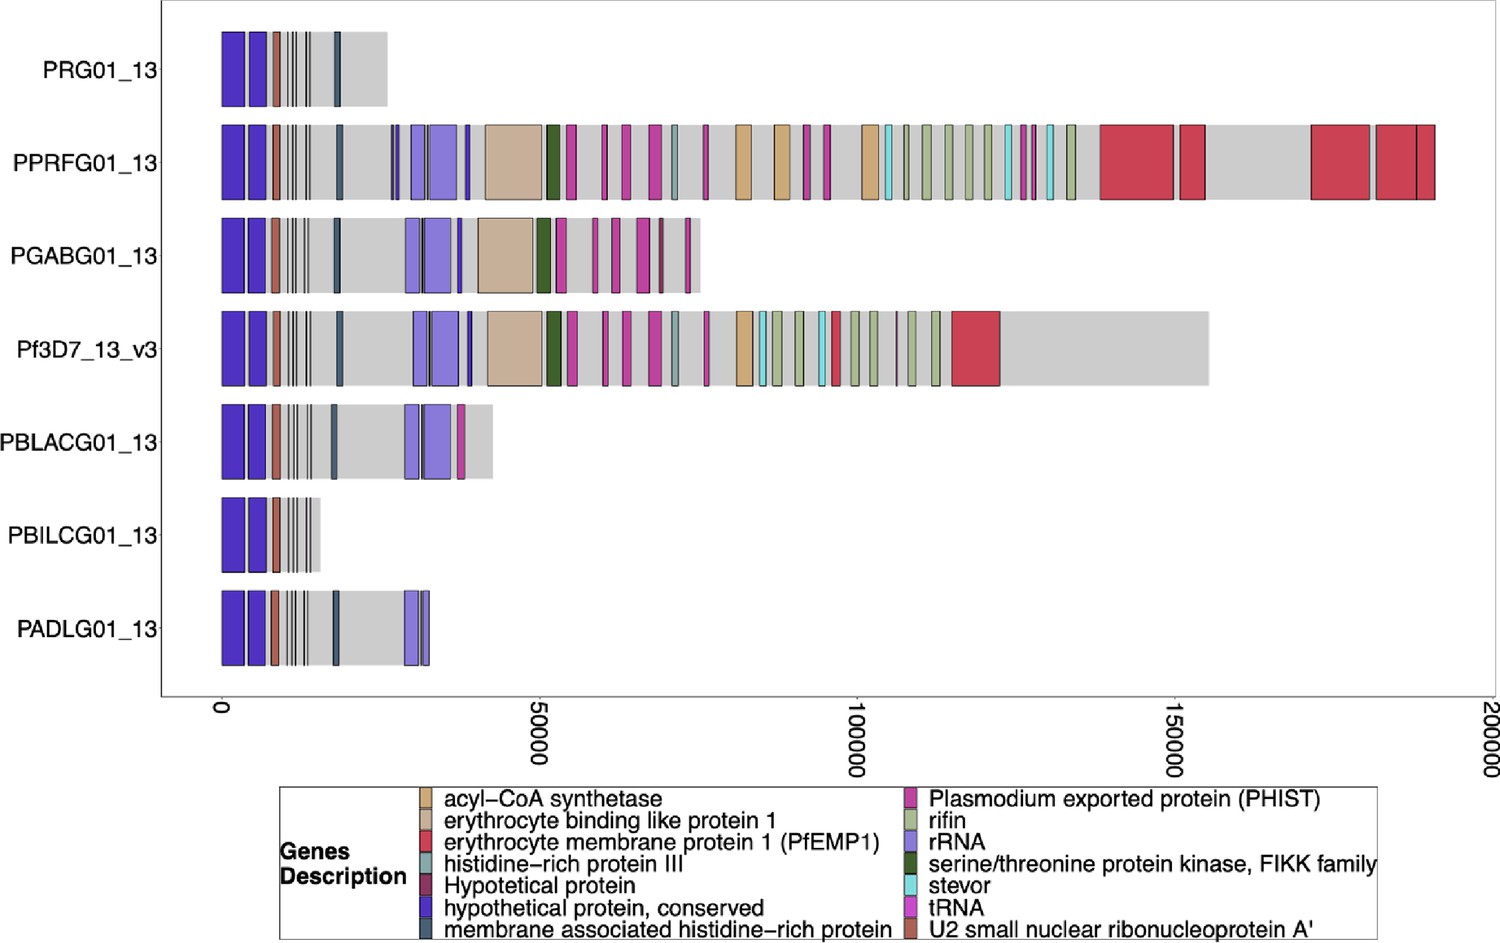
Gene Annotations of Chromosome 8 of PacBio-assembled P. Laverania Genomes.
Plots of the peri-telomere regions of chromosome 8 across all sequenced Laverania Genomes (Otto et al., 2018b). This region’s assembly is incomplete for most strains, and only Pf3d7 and the closest relative to falciparum, PPRFG01, contain hrp2, but they are in similar locations. The bottom x-axis shows the genomic distance from the starting point in each strain but there is significantly more core genome to the left of the starting point.
Figure 3—figure supplement 4
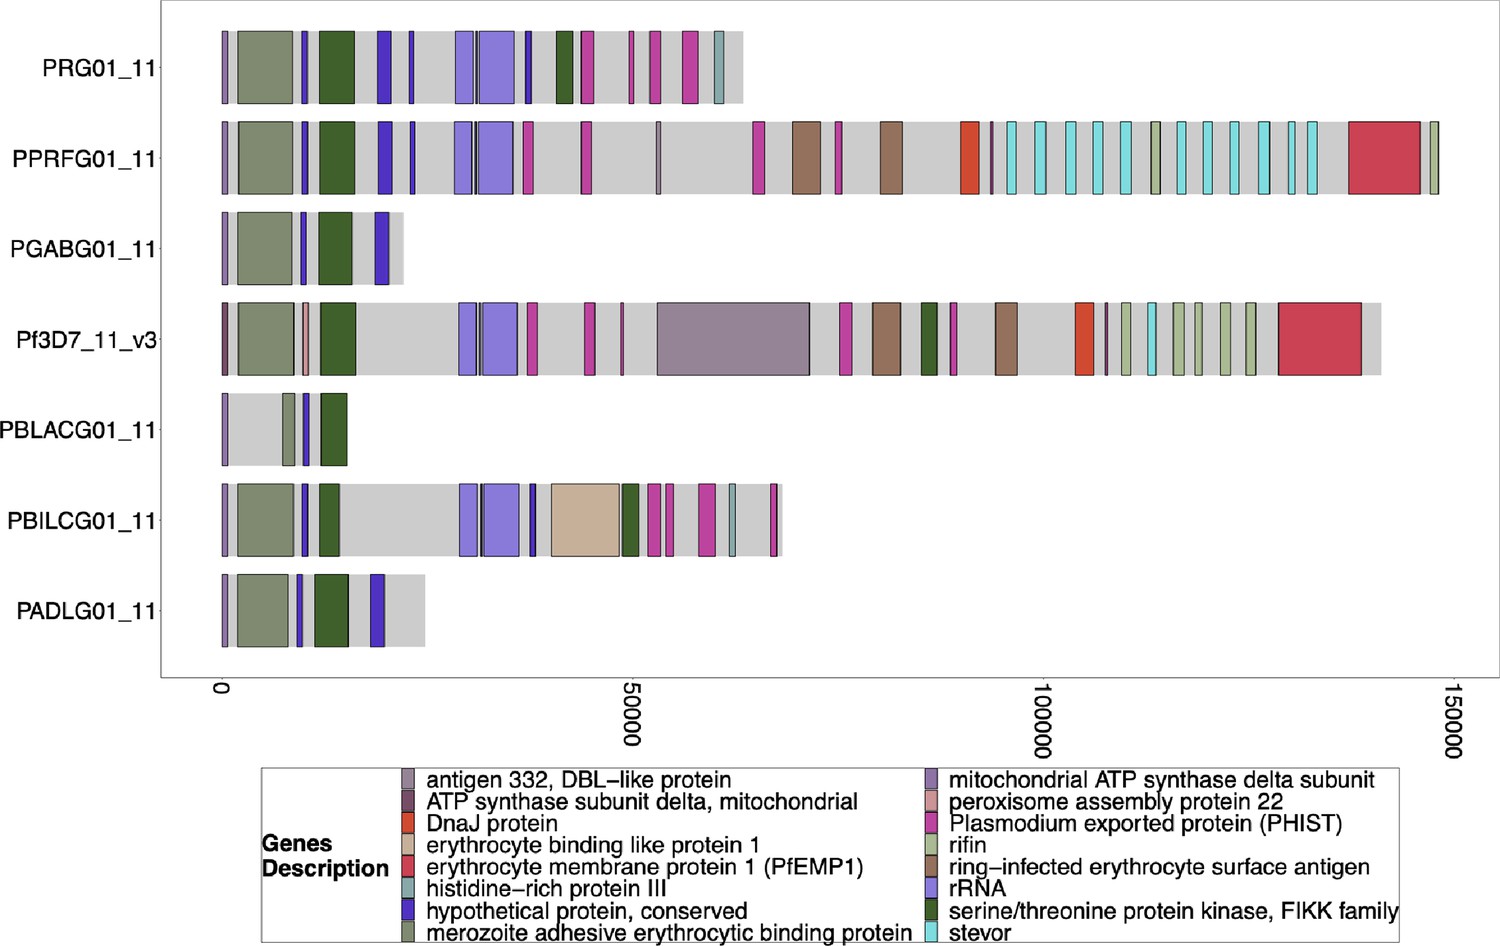
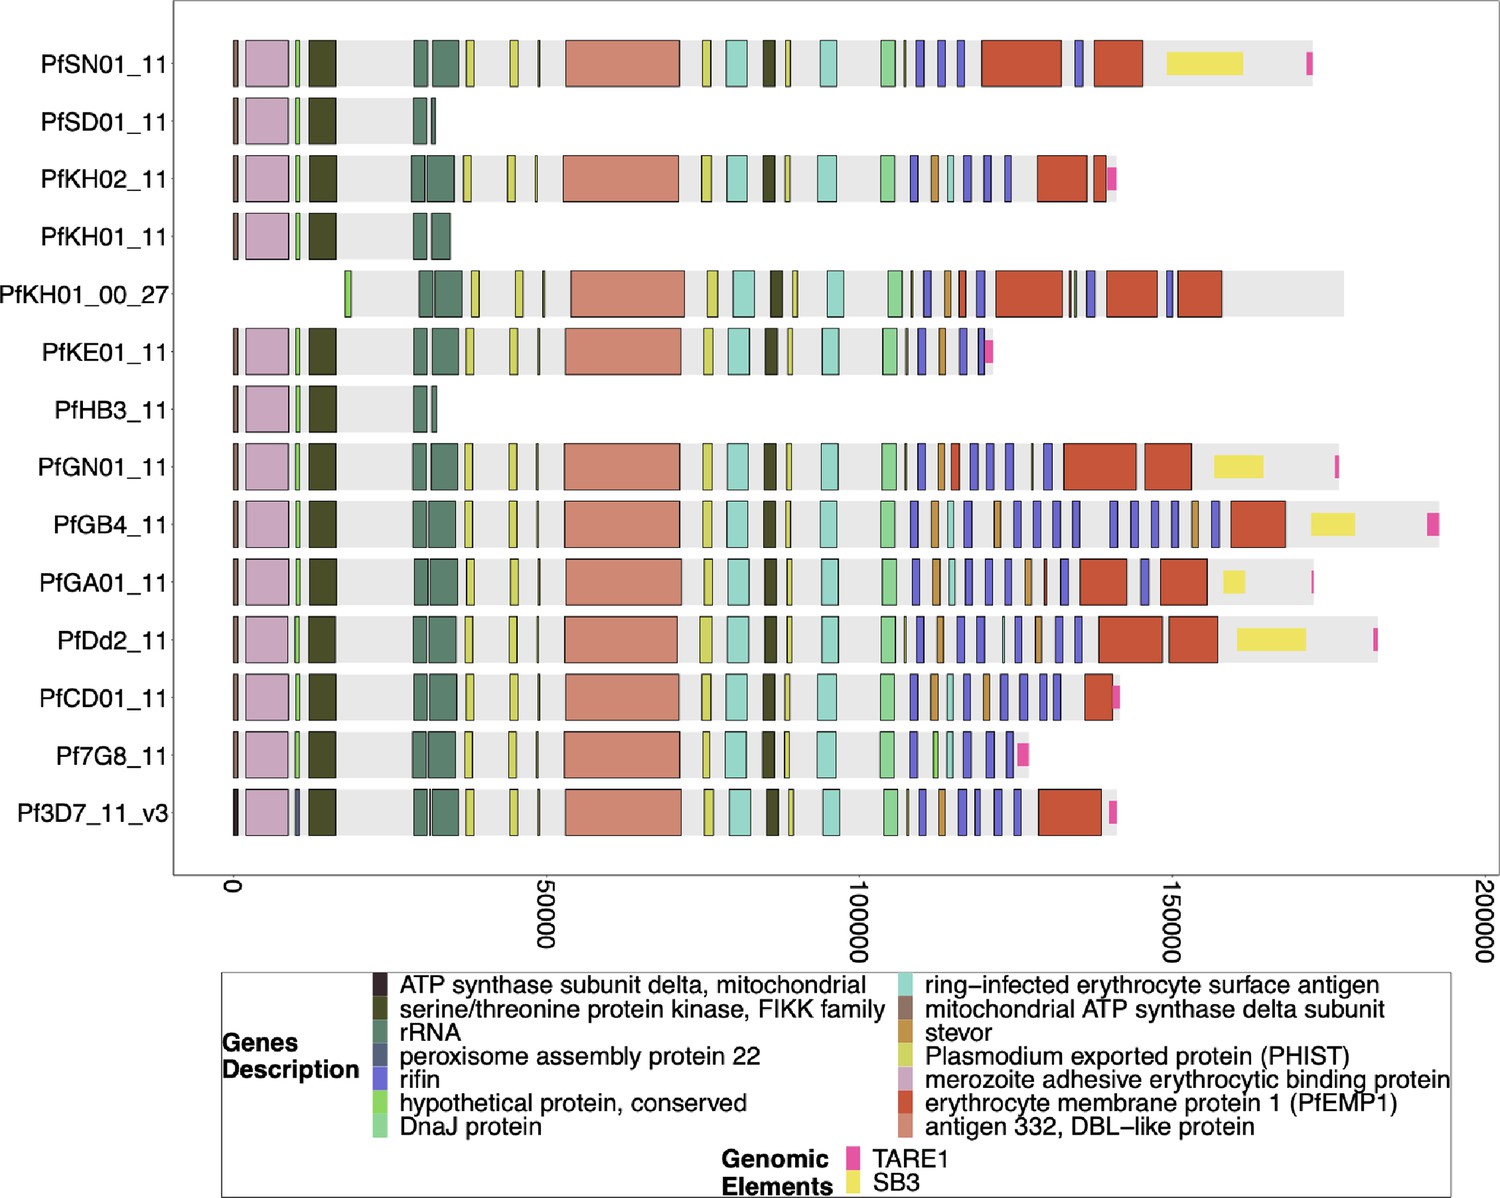
Gene Annotations of Chromosome 11 of PacBio-assembled P. Laverania Genomes.
Plots of the peri-telomere regions of chromosome 11 across all sequenced Laverania Genomes (Otto et al., 2018b). Assembly of this region is incomplete for the majority of strains. Plots begin 25 kb before the rRNA loci on this region where the duplicated region between chromosomes 11 and 13 is. All assemblies of the strains that contain this region have this region shared between species and between chromosomes 11 and 13. The bottom x-axis shows the genomic distance from the starting point in each strain, but there is significantly more of the core genome to the left of the starting point.
Figure 3—figure supplement 5
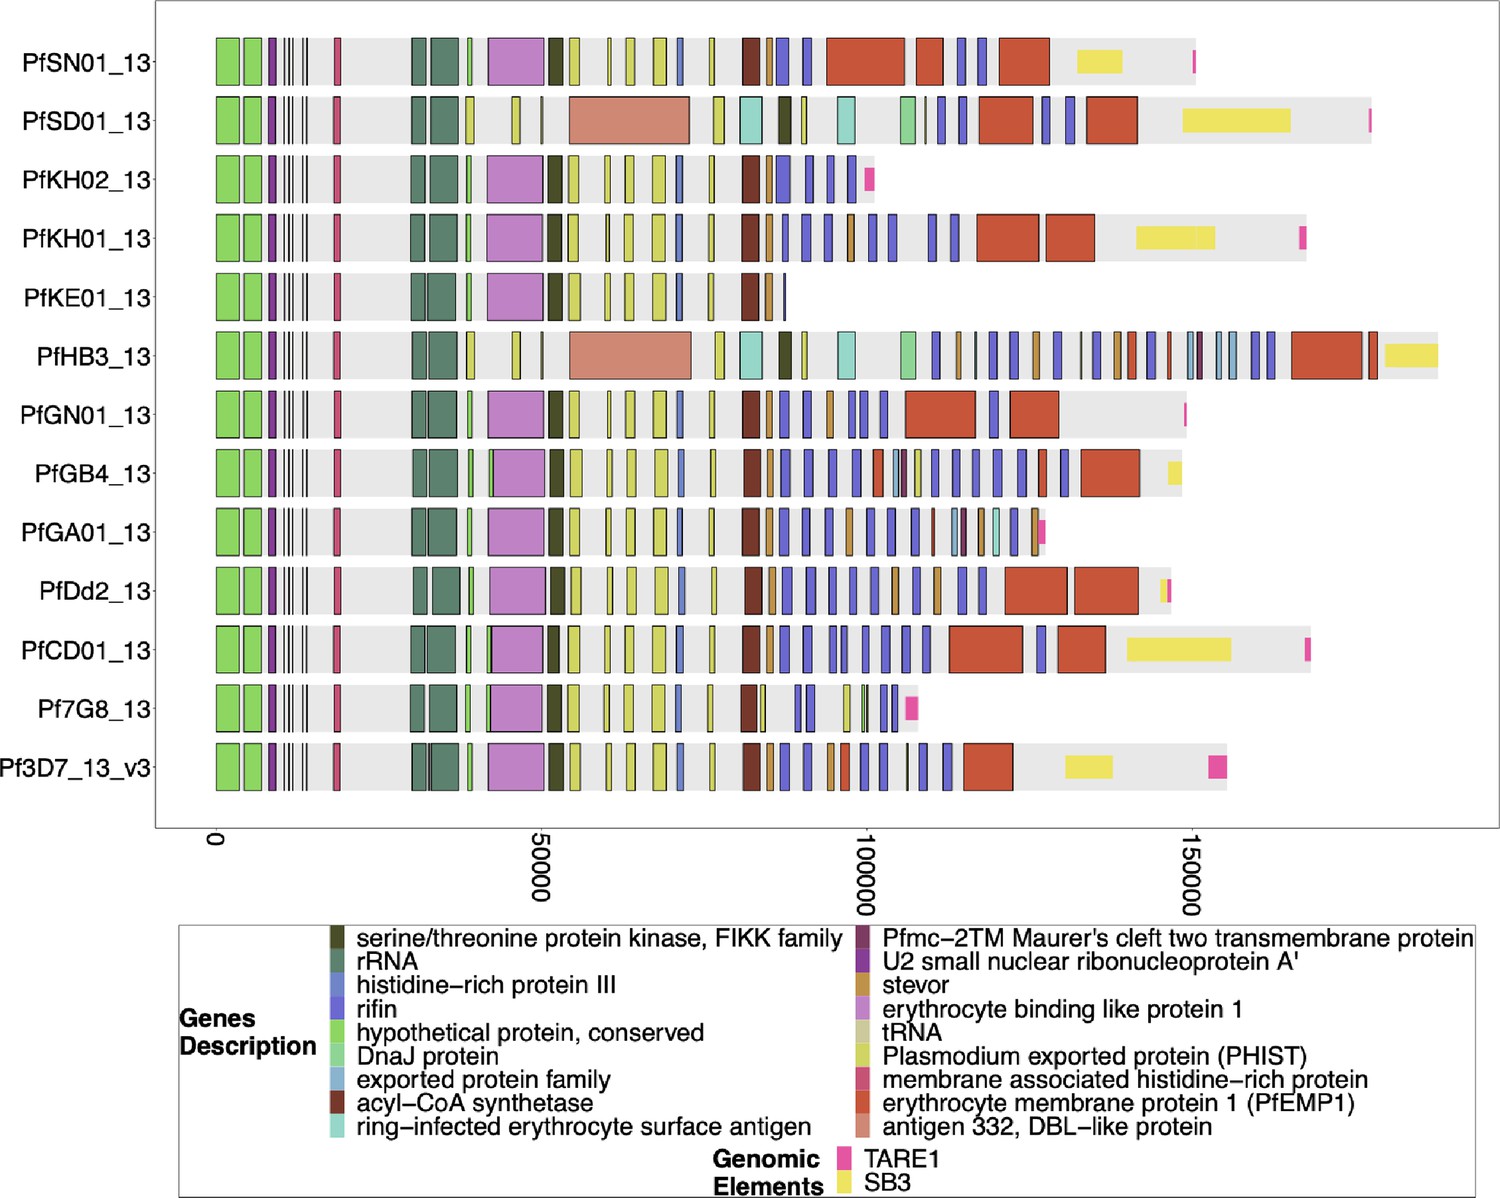
Gene Annotations of Chromosome 13 of PacBio-assembled P. Laverania Genomes.
Plots of the peri-telomere regions of chromosome 13 across all sequenced Laverania Genomes (Otto et al., 2018b). Assembly of this region is incomplete for the majority of strains. Plots begin 25 kb before the rRNA loci on this region where the duplicated region between chromosomes 11 and 13 is. All strain assemblies that contain this region have this region shared between species and between chromosomes 11 and 13. The bottom x-axis shows the genomic distance from the starting point in each strain, but there is significantly more of the core genome to the left of the starting point.
Figure 3—figure supplement 6
Gene annotations of chromosome 11 of PacBio-assembled genomes.
The genomic annotations across the 3` telomeric regions of PacBio-assembled genomes (Otto et al., 2018a) across chromosome 11 with the telomere repetitive elements (TAREs) are also shown if present. The presence of TAREs suggests that the assembly has made its way to the chromosome’s sub-telomeric region (end). The previously published PacBio assembled genomes for SD01 and HB3 did not reach the TAREs for chromosome 11 and terminated in the segmental duplication. The absence of an assembled sub-telomeric region on chromosome 11 prevents a detailed analysis of the mechanism behind the deletion of pfhrp3. It is likely a result of the inability of the assembler and/or underlying PacBio reads to unambiguously traverse the segmental duplication and separate the duplicated chromosome 11 subtelomeric region sequence into two copies. The bottom x-axis shows the genomic distance from the starting point in each strain, but there is significantly more of the core genome to the left of the starting point.
Figure 3—figure supplement 7
Gene annotations of chromosome 13 of PacBio-assembled genomes.
The genomic annotations across the 3` telomeric regions of PacBio-assembled genomes (Otto et al., 2018a) across chromosome 13 with the telomere repetitive elements (TAREs) are also shown if present. The presence of TAREs would suggest that the assembly has made its way all the way through the sub-telomeric region for the chromosome. The previously published PacBio-assembled genomes for SD01 and HB3 have sub-telomeric chromosome 11 sequences beginning after the segmental duplication, which suggests a translocation. Still, given the incompleteness of the chromosome 11 assembly in Figure 3—figure supplement 6, it cannot be determined if this is simply a misassembly or a true translocation. The bottom x-axis shows the genomic distance from the starting point in each strain, but there is significantly more of the core genome to the left of the starting point.
Figure 4 with 2 supplements
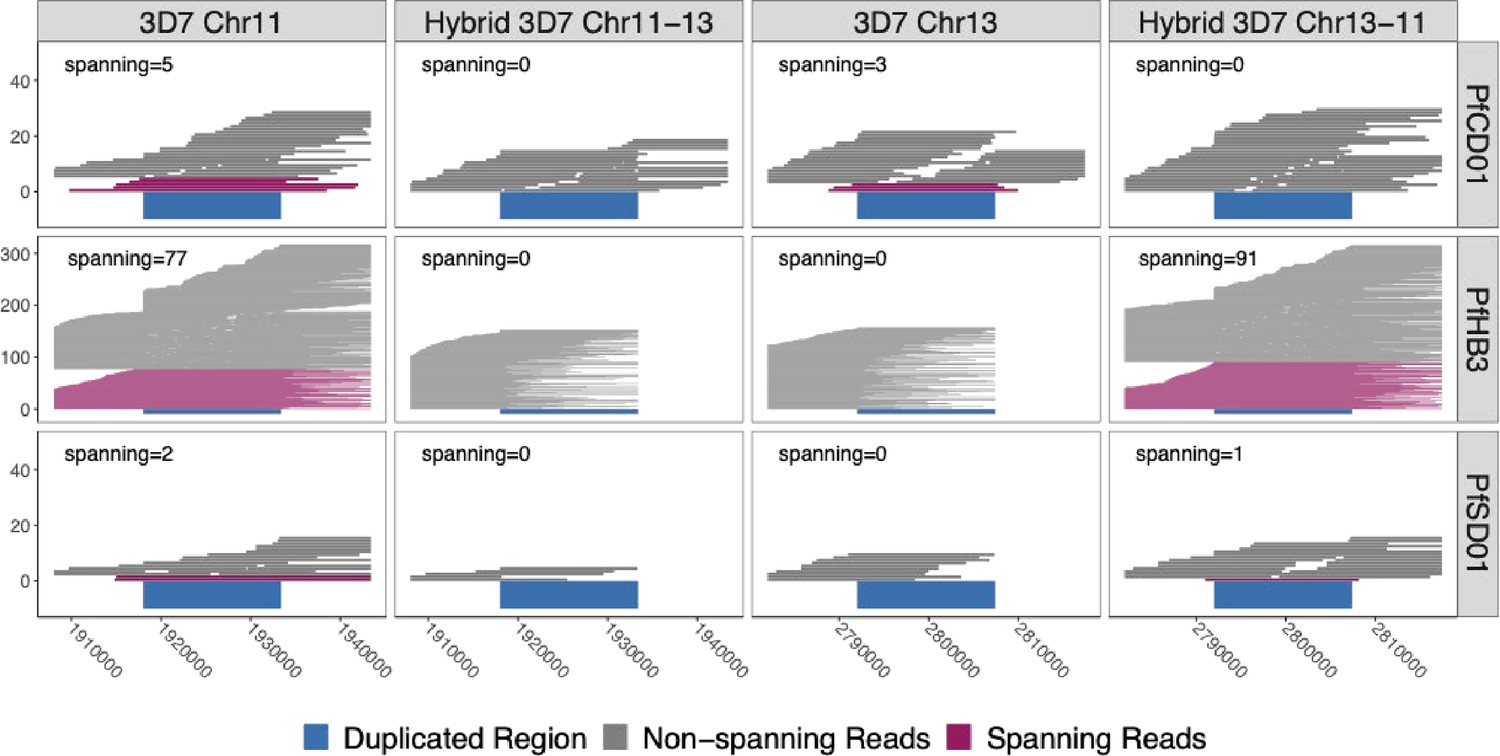
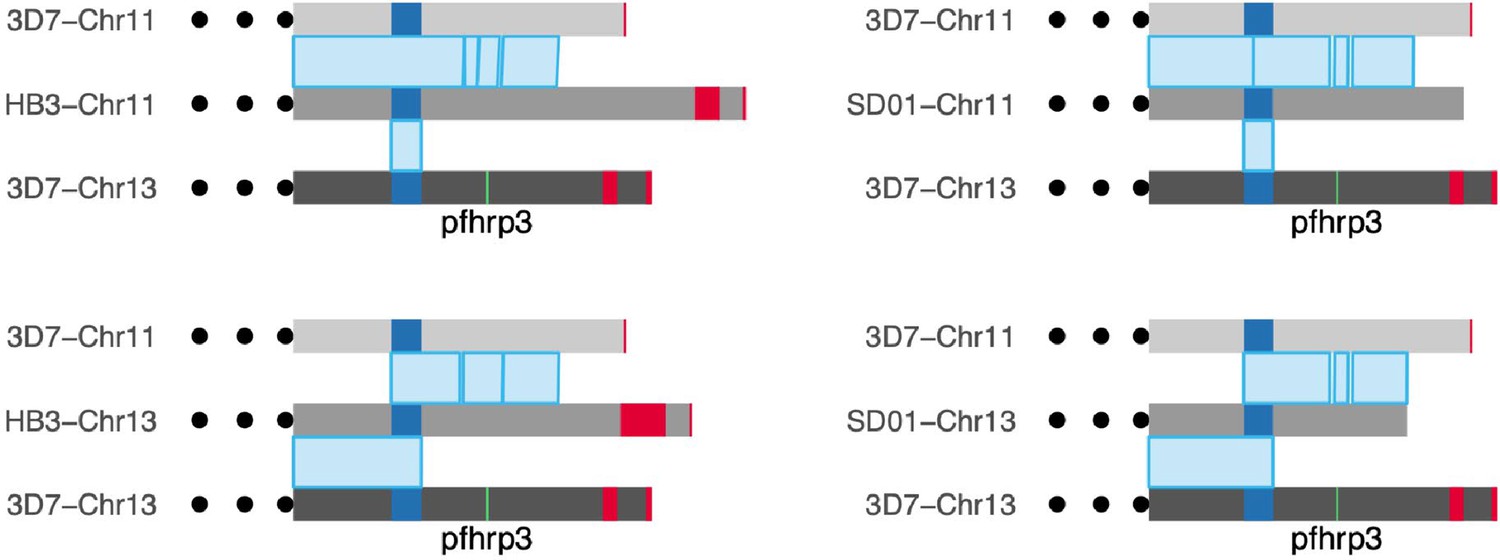
Long reads spanning the 15 kb duplicated region confirm the presence of translocated chromosome 13–11 in pfhrp3-deleted HB3 (Americas) and SD01 (Africa) but not pfhrp3-intact chromosomes.
PacBio and Nanopore read >15 kb for HB3, SD01, and CD01 are shown aligned to normal chromosomes 11 and 13 and hybrid chromosomes 11–13 and 13–11 constructed from the 3D7 sequence. Reads that completely span the segmental duplication (dark blue) anchoring in the unique flanking sequence are shown in maroon. Spanning reads are mapped only to this one location, whereas the non-spanning reads are mapped to both the hybrid or normal chromosomes as these chromosome segments are identical. SD01 and HB3 only have reads that span the duplicated region on chromosome 11, but no reads that span out of the duplicated region on chromosome 13. Instead, SD01 and HB3 have spanning reads across the hybrid chromosome 13–11. Other non-deleted isolates had spanning reads mapped solely to normal chromosomes, exemplified by CD01 (top row). No isolates had spanning reads across the hybrid 11–13 chromosome.
Figure 4—figure supplement 1
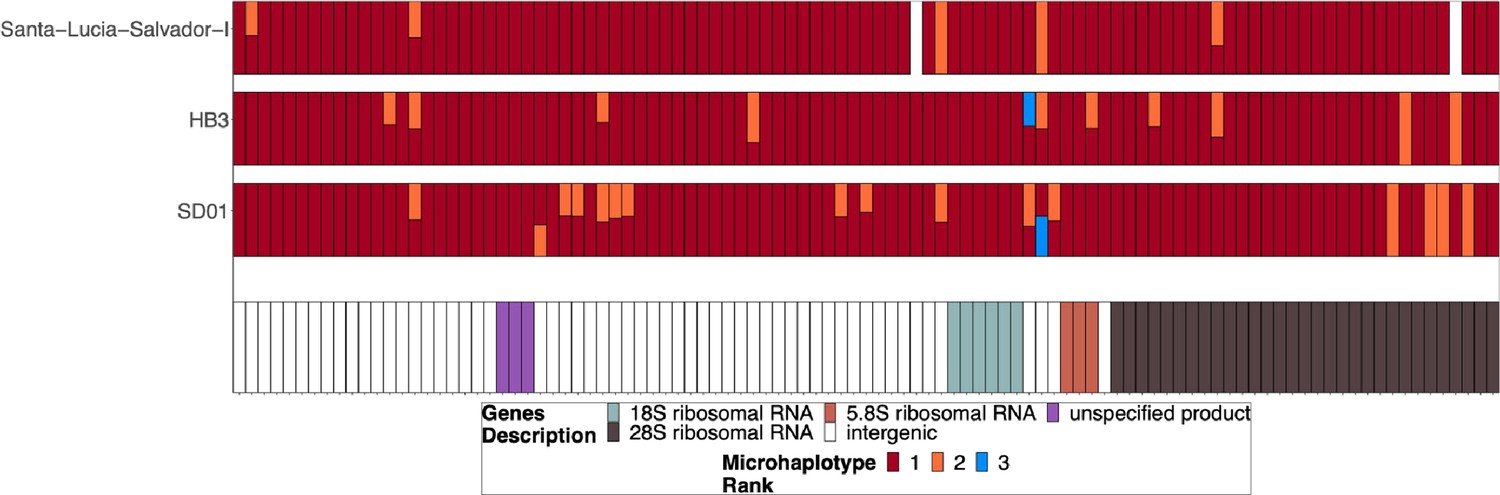
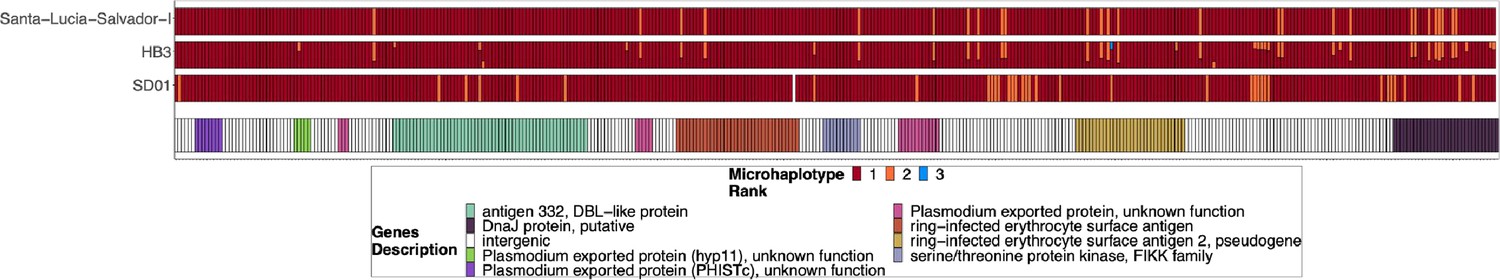
Chromosome 11/13 15.2 kb duplicated region for parasites SD01, HB3, and Salvador 1.
Subset of the parasites from Figure 3—figure supplement 2 but for SD01 and HB3, which were sequenced in this paper, and for Santa-Luca-Salvador-1, another lab isolate that shows similar pfhrp3 deletion pattern 13-11++. SD01 and Santa-Luca-Salvador-1 have perfect copies, but Santa-Luca-Salvador-1 has variation at 3 loci within the duplicated region, and SD01 has variation at 13 loci within this region. HB3 has divergent copies of the duplicated chromosome 11 segment and contains variation within this region.
Figure 4—figure supplement 2
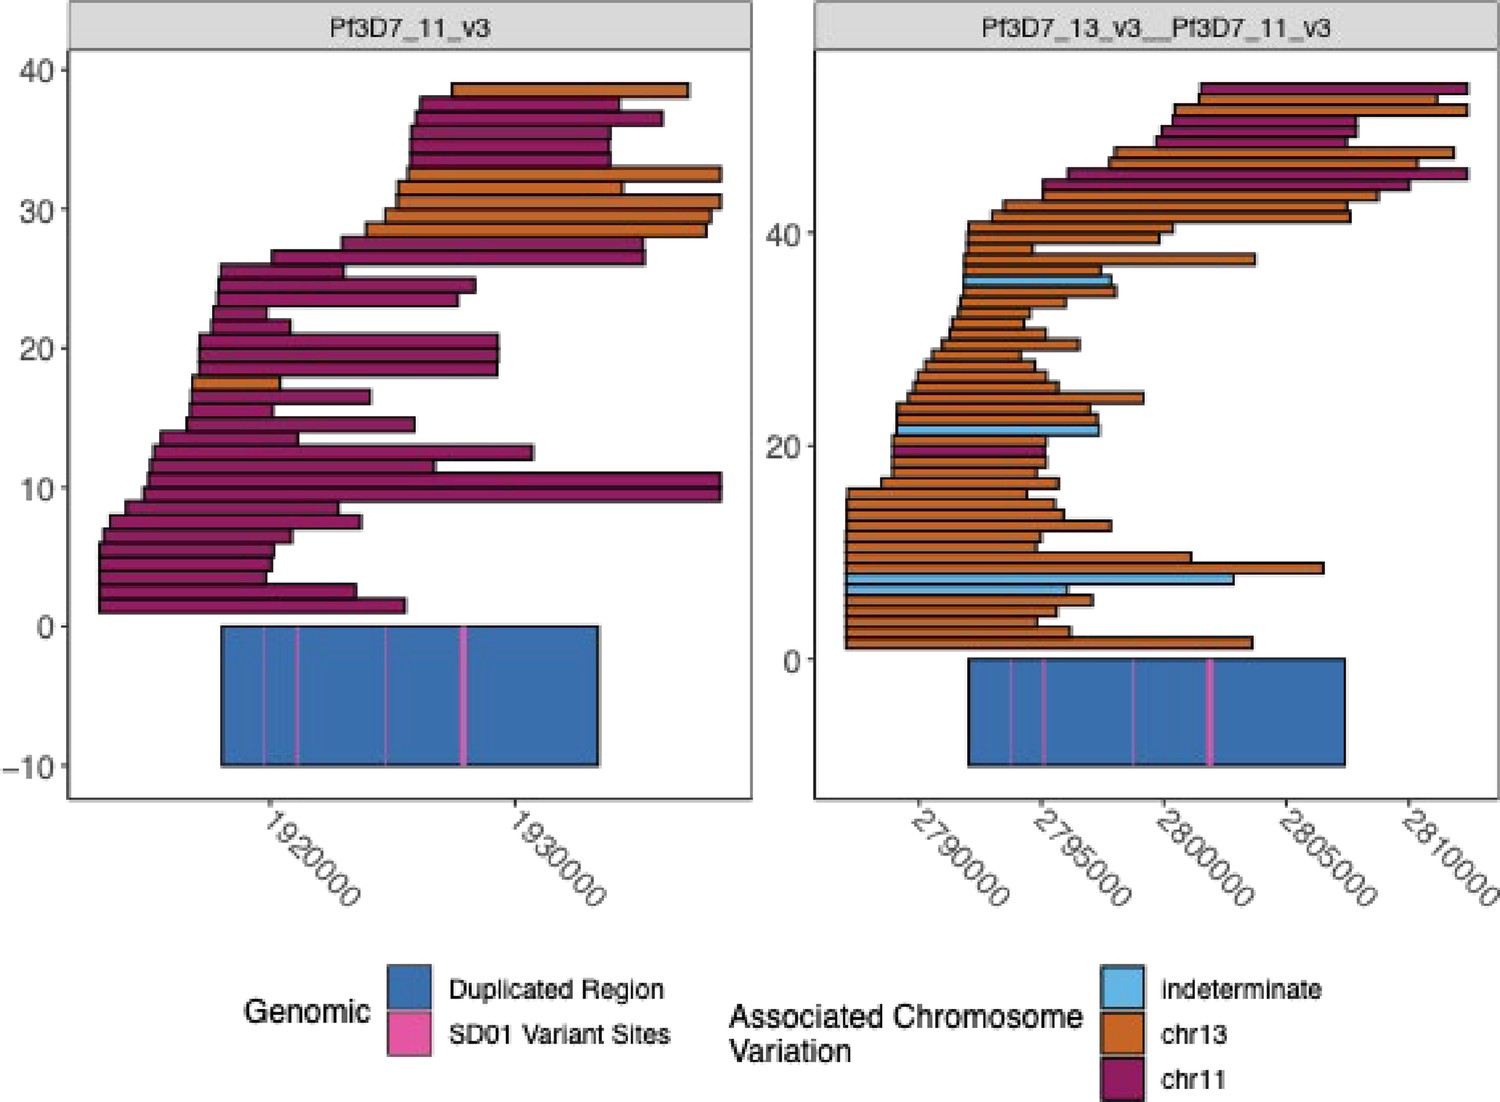
Spanning PacBio and Nanopore Reads across the duplicated region for SD01.
The spanning Nanopore and PacBio reads across chromosomes chr11 and chr13 duplicated regions for isolate SD01. The visualization truncates the reads if they span outside of the range shown. The left panel is chromosome 11, and the right panel is the hybrid chromosome 13–11. The chr11/13 duplicated region is colored in dark blue on the bottom of the plot, and the four loci where the isolate SD01 has key variation within this region, which can be used to optimize bridging across this duplicated region, are colored pink. The reads are colored by the chromosome associated with the variation seen in each read. The association was made by linking the variation found within each of the four loci and looking at the reads spanning from each chromosome to see which variants were associated with which chromosome. Each locus had two variants and had a strong association with each chromosome.
Figure 5 with 10 supplements
A comparison of long-read assemblies of chromosomes 11 and 13 of HB3 and SD01 with the reference genome 3D7 confirms hybridized chromosomes 13–11.
On top, chromosome 11 of HB3 and SD01 mapped entirely to the reference chromosome 11 of 3D7, with the segmental duplication region in dark blue mapped to both 11 and 13. The assembly of chromosome 13 of HB3 and SD01 maps to the reference chromosome 13 of 3D7 up through the segmentally duplicated region, but after the duplication (where pfhrp3 (green) should be found), it maps to chromosome 11 of 3D7 instead of chromosome 13. Red blocks mark telomere-associated repetitive elements (TARE) sequence. Displaying only from 50 kb upstream from the duplicated region to the end of the chromosomes. Chromosome 11 on 3D7 spans 1,918,029–2,038,340 (120,311bp in length) and chromosome 13 on 3D7 spans 2,792,022–2,925,236 (133,214bp in length).
Figure 5—figure supplement 1
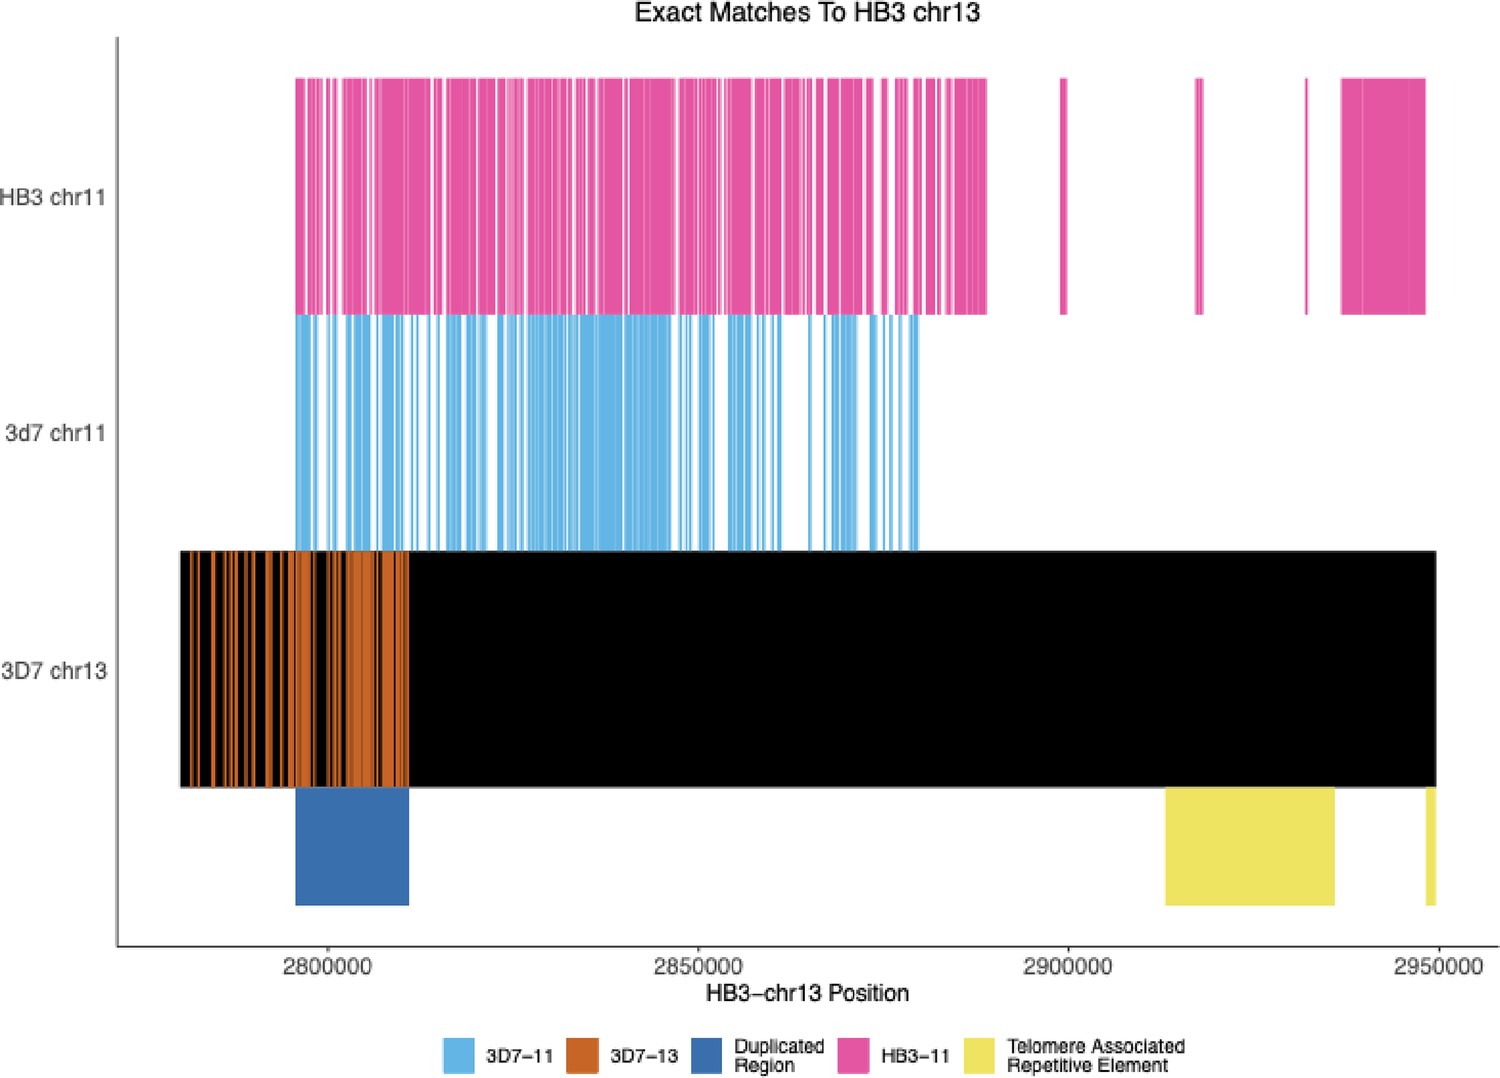
Exact Matches between nanopore-assembled HB3 chromosome 13 with HB3 chromosome 11, 3D7 chromosomes 11, 13.
The locations of exact matches between the Nanopore-assembled HB3 chromosome 13 and between the assembled chromosome 11 and the 3D7 11 and 13 chromosomes. The dark blue shaded region shows the location of the duplicated region between chromosomes 11 and 13. The assembled chromosome 13 matches the 3D7 chromosome 13 until this duplicated region and then more closely matches 3D7 chromosome 11 and its own chromosome 11. The figure begins at 50,000 bp before the duplicated region, but the new HB3 chromosome 11 matches 3D7 chromosome 11 for the rest of the beginning of the contig.
Figure 5—figure supplement 2
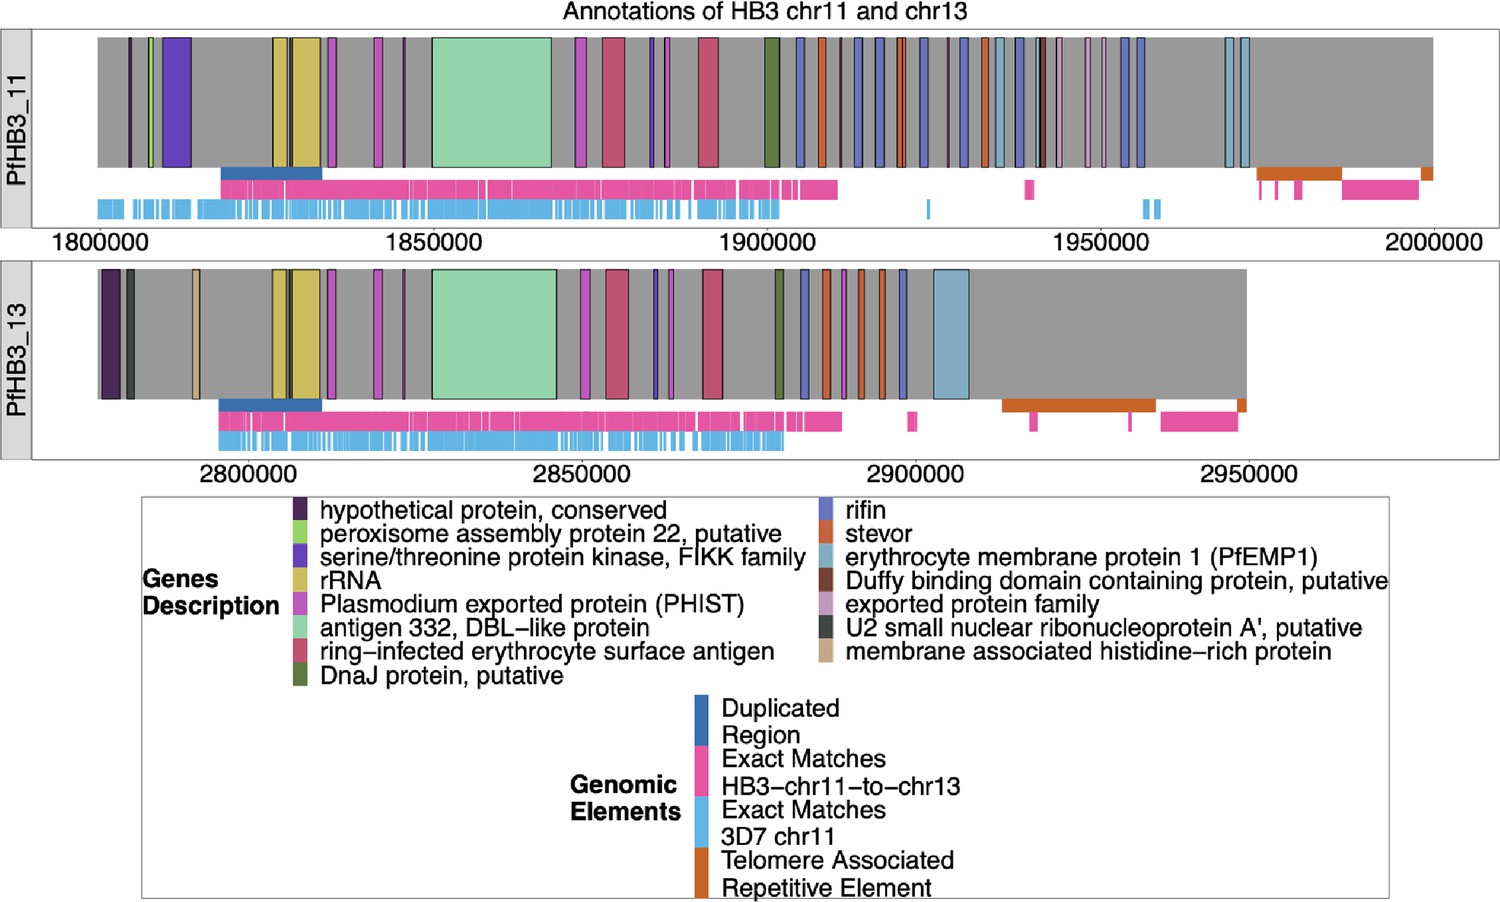
Annotation of HB3 chromosomes 11 and 13–11.
The new Nanopore assembly of HB3 was annotated by Companion (Steinbiss et al., 2016), and the ends of chromosomes 11 and 13 are shown above. The duplicated region between chromosomes 11 and 13–11 is shown in blue under each chromosome, and the areas where HB3 chromosomes 11 and 13 have exact matches of at least 31 bp are labeled in red underneath. Exact matches of at least 31 bp to 3D7 chromosome 11 are shown in light blue. Both chromosomes end with telomere-associated repetitive elements (TARE), and both end with telomere-associated tandem repeat 1 (TARE1), which indicates that both assembled chromosomes reached the end of the telomere.
Figure 5—figure supplement 3
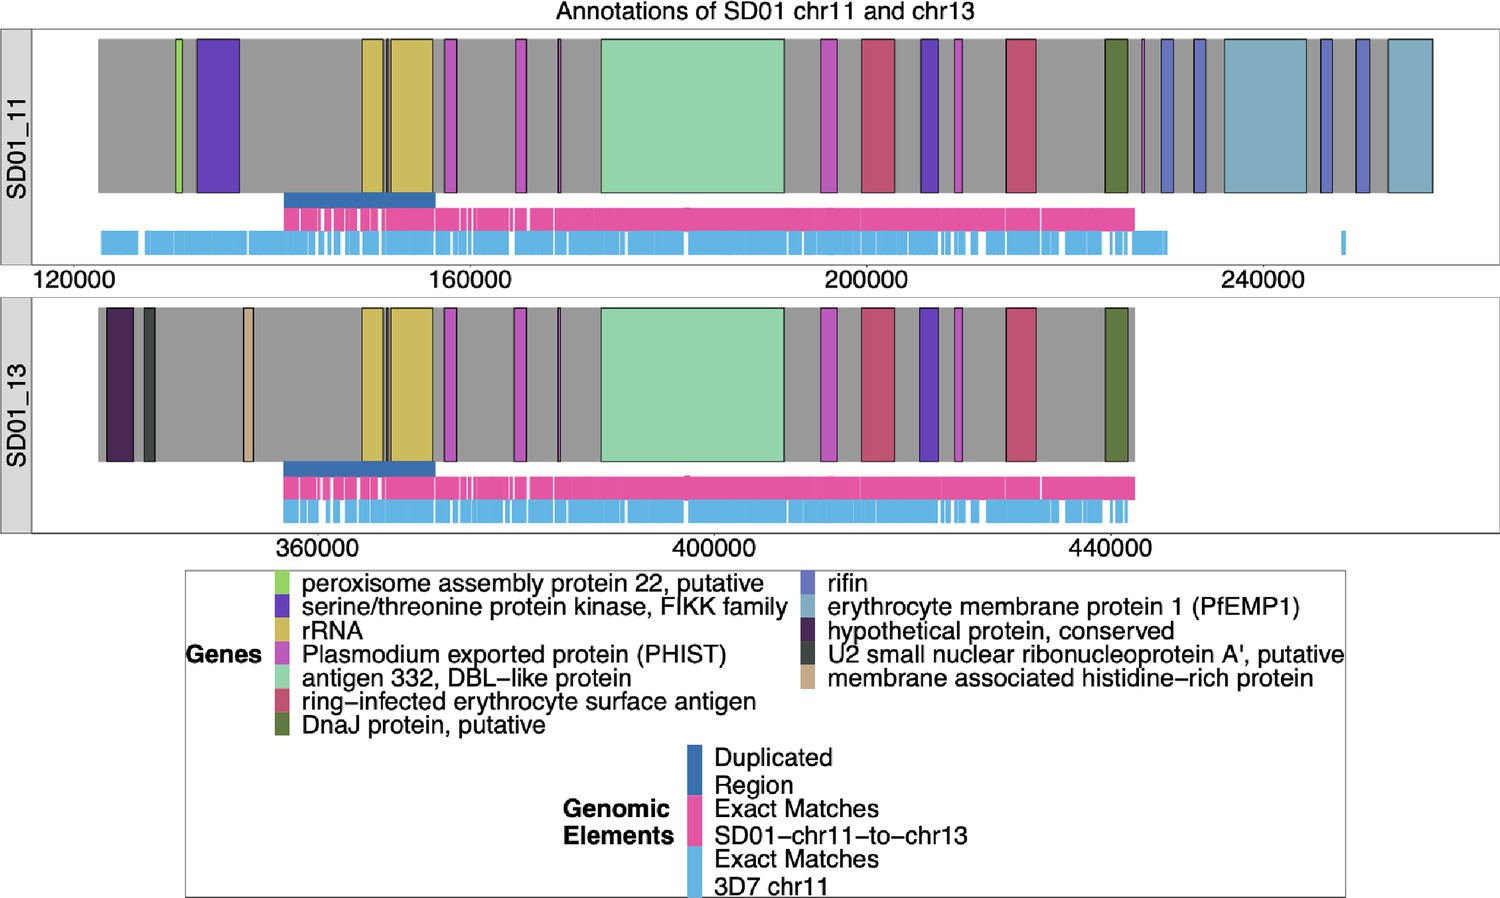
Annotation of SD01 chromosomes 11 and 13.
The Nanopore assembly of SD01 was annotated by Companion (Steinbiss et al., 2016), and the ends of chromosomes 11 and 13 are shown above. The duplicated region between chromosomes 11 and 13 is shown in dark blue, and the areas where SD01 chromosomes 11 and 13 have exact matches of at least 31 bp are marked out in pink underneath. Exact matches of at least 31 bp to 3D7 chromosome 11 are shown in light blue. Due to the low quality of the input DNA of the SD01 parasite, the assembly of these chromosomes did not reach the end of the telomere, given that these assembled contigs did not contain telomere-associated repetitive elements (TARE). The assembly of these two chromosomes shows a high degree of similarity from the duplicated region to the end of the 13 associated contig (98.4% similarity with only 1428 difference over the 89,733 base region).
Figure 5—figure supplement 4
Chromosome 11/13 15.2 kb duplicated region for pfhrp3 deletion pattern 13-11++ parasites with identical chromosome 11 segment haplotypes.
A subset of parasites from Figure 3—figure supplement 2 for the chromosome 11/13 duplicated region for the parasites with identical chromosome 11 segments based on their microhaplotypes. The leftmost column contains the groupings based on the microhaplotypes on chromosome 11. Several parasites have divergent copies of the 15.2 kb duplicated region despite the downstream chromosome 11 segments being a perfect copy. This would be consistent with the breakpoint for the duplication event within this region, where recombination occurred between nonidentical copies. The parasites are organized by the downstream duplicated chromosome 11 segment. For the 01, 03, 04, and 05 clusters, there are clear sub-clusters of haplotypes within this region consistent with separate duplication events creating the same downstream duplicated segment.
Figure 5—figure supplement 5
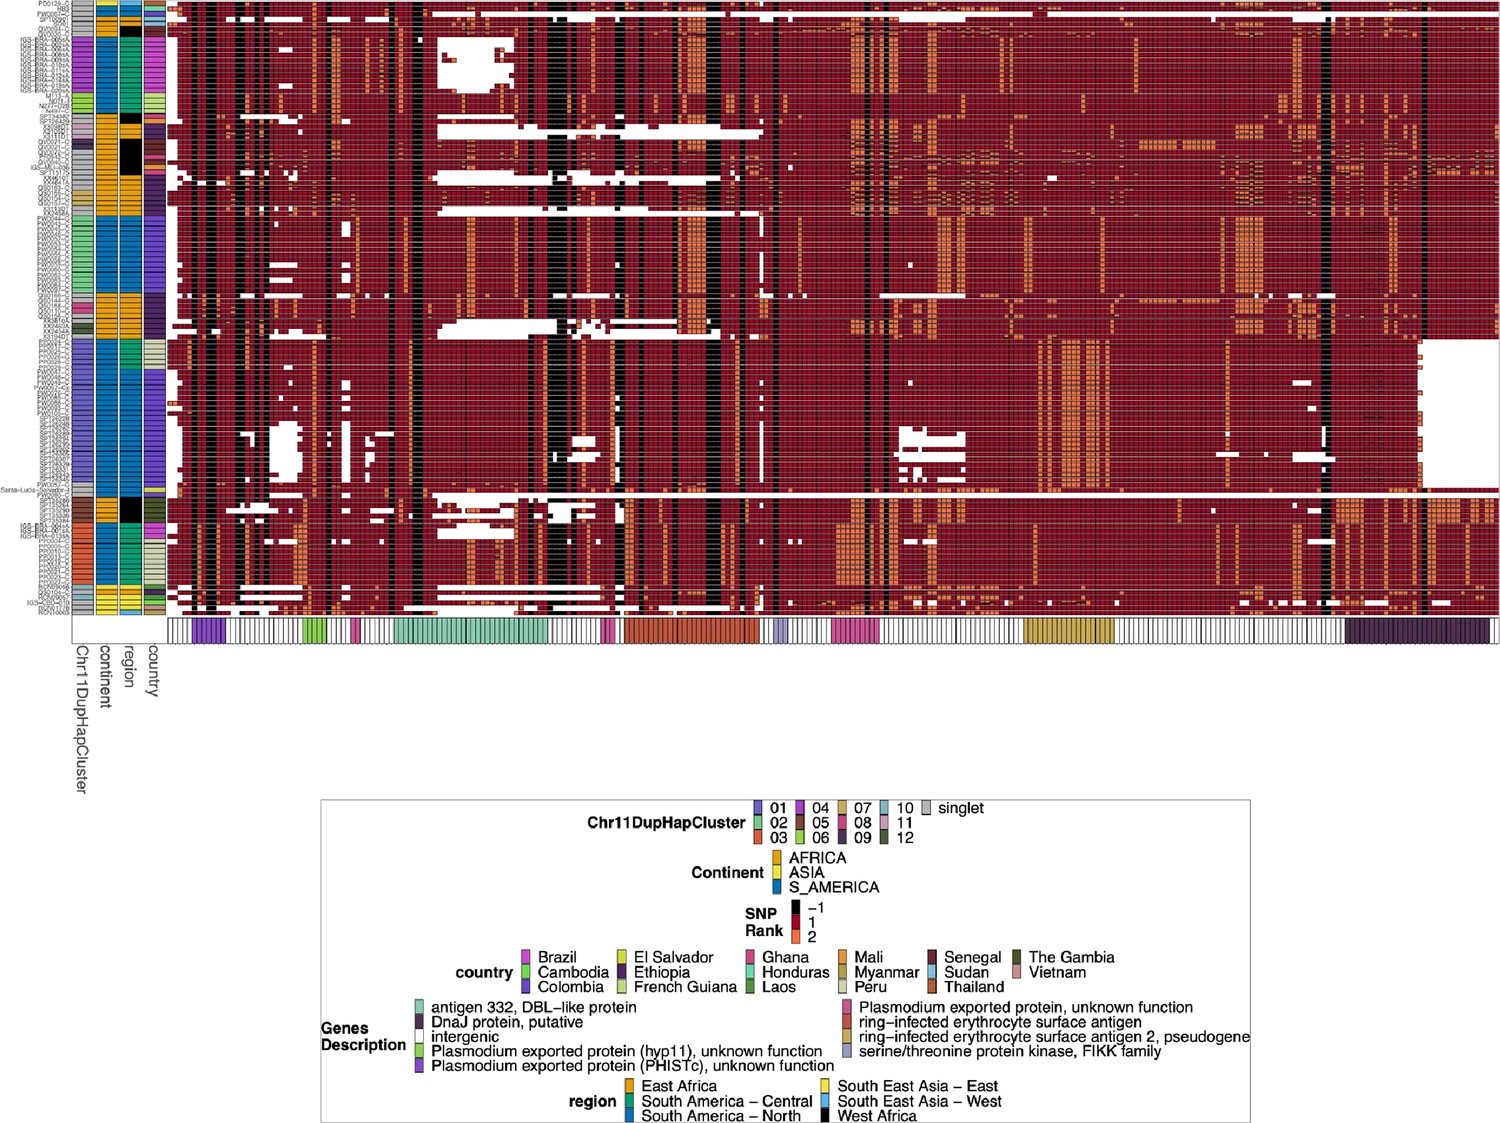
Whole genome IBD between pfhrp3 deletion pattern 13-11++ parasites.
Whole genome identity by descent (IBD) was calculated between pfhrp3 deletion pattern 13-11++ parasites using hmmIBD using whole genome biallelic single nucleotide polymorphisms (SNPs). The fraction of sites in IBD between parasites was plotted above. The top and left side annotations are the same and contain the parasite’s country, region, and continent of origin. The annotation also has the deletion calls for pfhrp2/3 and which chromosome 11 haplotype cluster the parasite belongs to. Parasites clustered per continent of origin as expected, but there are different haplotype clusters per chromosome 11 duplicated clusters. When comparing the whole genome fraction of IBD sites, there are distinctive haplotype groups within the chromosome 11 haplotype cluster within the biggest clusters 01 (n=28) and 03 (n=12). The 01 cluster has three distinct groups, 03 cluster has five distinct groups. These groups are consistent with the distinct differences in the 15.2 kb duplicated region (the region with the breakpoint for the duplication) (see Figure 5—figure supplement 4), which would be consistent with different translocation events creating the same duplication segment of chromosome 11.
Figure 5—figure supplement 6
Genome coverage chromosome 8, 11, and 13 regions of isolates with subtelomere deletion of chromosome 11.
Sequence coverage heatmap showing involved regions of chromosomes 11 (1,897,151–2,003,328 bp), 13 (2,769,916–2,844,785 bp), and 5 (944,389–988,747 bp) in the subset of the 19,313 parasites along with key lab isolates showing evidence of deletion of putative chromosome 11 subtelomere deletions. There are 41 parasites with evidence of chromosome 11 core genomic deletions. Each row is a parasite. The top annotation along chromosomes depicts the location of genes, and the second row delineates the duplicated region (dark blue) and subtelomere region (orange). The left parasite annotation includes the deletion pattern, continent of origin, and pfhrp2/3 deletion calls. There were 41 parasites with evidence of sub-telomeric chromosome 11 deletions, 38 of which contained TARE1 sequence where coverage drops to zero, which would be consistent with telomere healing. Only one parasite (lab isolate FCR3) had deletion up and through pf332 to the ribosomal duplicated region with subsequent duplication of chromosome 13 that would be consistent with the reciprocal of 13-11++. No field parasites had this pattern. The related clone of FCR3, IT, did not contain this pattern and would suggest that FCR3 duplicated this segment of chromosome 13 via translocation within the culture and not in the field. The top two parasites show evidence of both deleting chromosome 13 with duplication of chromosome 11 consistent with the 13-11++ pattern and have deleted a portion of the chromosome 11 genome with evidence of telomere-associated tandem repeat 1 (TARE1) healing on chromosome 11. An unusual pattern that is only observed for these two parasites and not for the other 13-11++ pattern parasites.
Figure 5—figure supplement 7
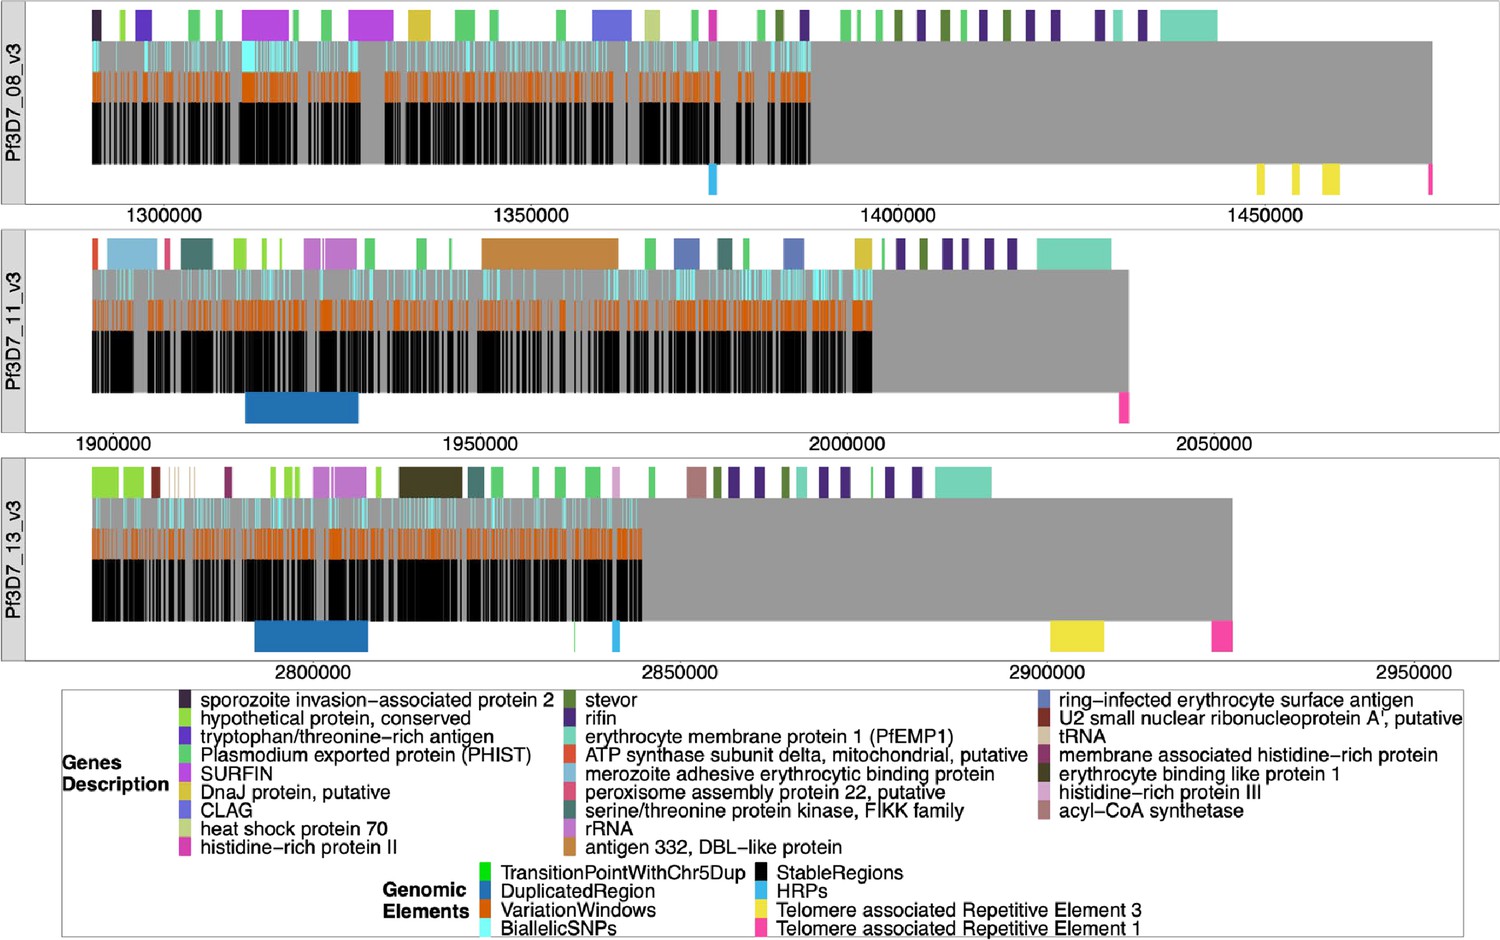
Windows of interest chromosomes 8, 11, 13.
The chromosomes are mapped from the beginning of the regions of interest to the chromosomes’ ends, with all genes/pseudogenes annotations shown as colored on top of the gray bars representing the chromosomes. From top to bottom, the regions are from 3D7 chromosomes 8 (1290239–1387982), 11 (1897151–2003328), and 13 (2769916–2844785), and each span to the end of their chromosome. The black bars on the bottom half of each chromosome are non-paralogous regions present in all strains, as described in the Methods section. The last black bar to the end of the gray bar represents the sub-telomeric regions that are not homologous between strains. The orange bars on top of the black bars are sub-regions where there is a variation that can be used to type the chromosomes. The light blue bars on top of the orange bars are the presence of biallelic single nucleotide polymorphisms (SNPs). The duplicated region between chromosomes 11 and 13 is shown (dark blue bars below chromosomes 11 and 13), as are the regions containing the pfhrp genes (lighter blue bars below chromosomes 8 and 13). The yellow (TARE3) and pink (telomere-associated tandem repeat 1, TARE1) bars on the bottom of the chromosomes represent the telomere-associated repetitive elements found at the end of chromosomes.
Figure 5—figure supplement 8
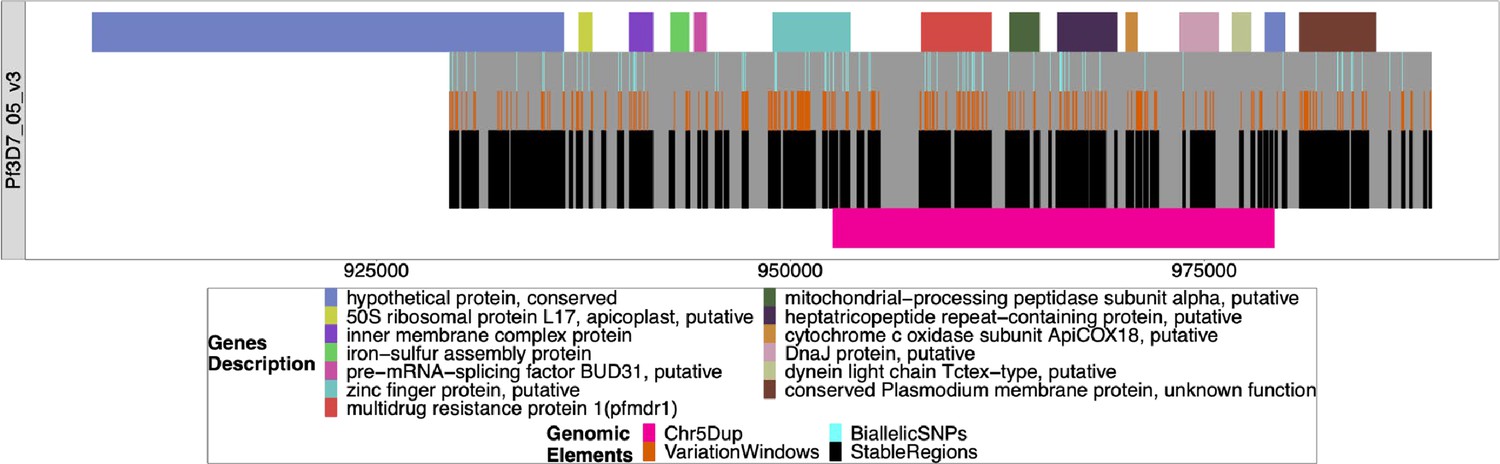
Windows of interest chromosome 05 around pfmdr1.
The windows used to investigate the duplication around pfmdr1 on chromosome 5 associated with the deletion of pfhrp3. All genes/pseudogenes annotations are shown on top of the gray bars representing the chromosome region investigated (929384–988747). The first gene spans outside of this region and was shown to overhang this region, but the content underneath was not investigated. The black bars on the bottom half of each chromosome are non-paralogous regions present in all strains, as described in the Methods section. The orange bars on top of the black bars are sub-regions with variations that can be used to type the chromosome. The light blue bars on top of the orange bars are the presence of biallelic single nucleotide polymorphisms (SNPs). The pink bar shows the region that is duplicated in pattern 13-5++.
Figure 5—figure supplement 9
Chromosome 11 Duplicated Segment pfhrp3 deletion pattern 13-11++ parasites biallelic single nucleotide polymorphisms (SNPs).
This plot was created and annotated the same way as Figure 2—figure supplement 4, but biallelic SNPs were used instead of small windows of microhaplotypes. The Chr11DupHapCluster is the same grouping as determined in Figure 2—figure supplement 4, and these clusters group together similarly when clustered by the biallelic SNPs.
Figure 5—figure supplement 10
Jaccard similarity using biallelic single nucleotide polymorphisms (SNPs) between parasites for chromosome 11 duplicated segment for pfhrp3 deletion pattern 13-11++ parasites.
This plot was created and annotated in the same way as Figure 2—figure supplement 3, but biallelic SNPs were used instead of small windows of microhaplotypes. The Chr11DupHapCluster is the same grouping as determined in Figure 2—figure supplement 3. Using biallelic SNPs created clustering that was very similar to that based on the microhaplotype windows.
Figure 6
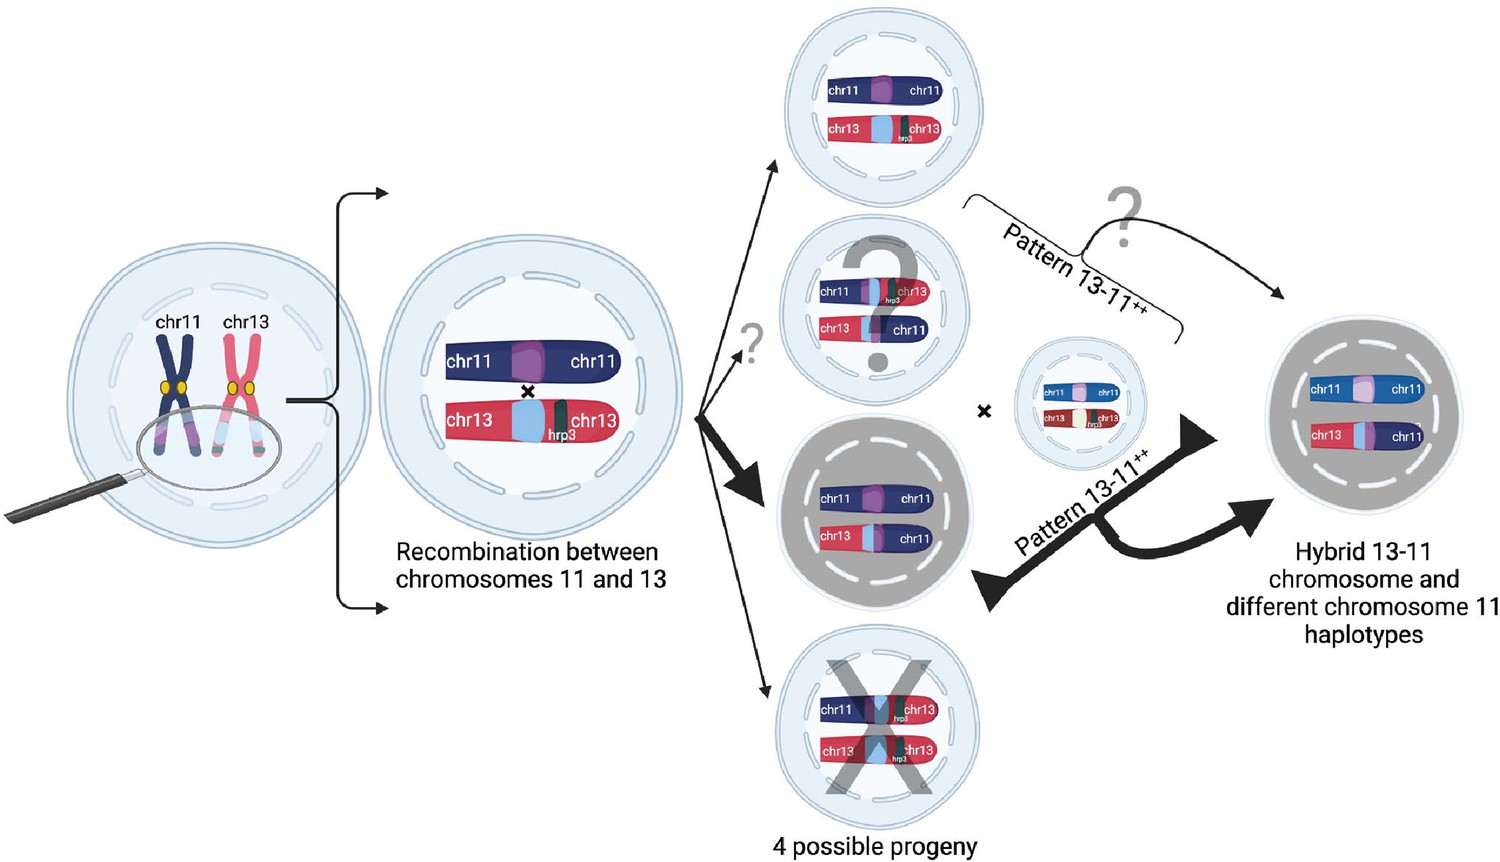
Proposed model of duplication-mediated non-allelic homologous recombination during intrastrain meiotic recombination yielding 13-11++ parasites.
Homology misalignment and non-allelic homologous recombination (NAHR) between chromosomes 11 and 13 first occur in an oocyst formed from identical parasite gametes (intrastrain), which can then segregate, resulting in potential progeny (normal and three translocated progeny). Bold lines show the most direct path to a 13-11++ parasite containing a 13–11 hybrid chromosome lacking pfhrp3 and two identical copies of duplicated chromosome 11 segments seen predominantly. Subsequent recombination with an unrelated strain yields parasites with differing chromosome 11 duplication haplotypes but this can occur with subsequent interstrain meioses. Additionally, there is potential for balanced products, occurring with subsequent recombination events leading to pfhrp3 loss and either identical haplotypes (intrastrain) or different haplotypes (unrelated strain). Figure created using Biorender.
Additional files
-
Supplementary file 1
Metadata on P. falciparum samples.
This table includes information on the publicly available, whole-genome-sequenced samples used for primary analysis including the identification number, sample name, country, collection year and date, region, and pfhrp2/3 deletion pattern.
- https://cdn.elifesciences.org/articles/93534/elife-93534-supp1-v1.xlsx
-
Supplementary file 2
Core genome windows.
This table contains information on the non-paralogous windows used for analyzing the regions of interest on chromosomes 5, 7, 8, 11, and 13. Plasmodium falciparum samples. Information includes the window’s chromosome name in 3D7, starting base position, ending base position, length, which strand the window is in respect to (positive or negative DNA strand), and description of the window region’s functionality.
- https://cdn.elifesciences.org/articles/93534/elife-93534-supp2-v1.xlsx
-
Supplementary file 3
Variations in core genome windows.
This table contains information on the windows contianing variations in the non-paralogous windows used for analyzing the regions of interest on chromosomes 5, 7, 8, 11, and 13. These variable regions can be found completely within the windows of Supplementary file 1. Metadata on P. falciparum samples.
- https://cdn.elifesciences.org/articles/93534/elife-93534-supp3-v1.xlsx
-
Supplementary file 4
Biallelic SNPs.
This table contains information on the biallelic SNPS from within the non-paralogous windows used for analyzing the regions of interest on chromosomes 5, 7, 8, 11, and 13. These variable regions can be found completely within the windows of Supplementary file 2. Core genome windows and Supplementary file 3. Variations in core genome windows.
- https://cdn.elifesciences.org/articles/93534/elife-93534-supp4-v1.xlsx
-
Supplementary file 5
Nucmer Results.
This table contains the results of the nucmer analysis looking for inter-chromosomal exact sequence sharing. Majority of the shared sequence is within the sub-telomere regions with the largest ‘core’ genomic region of a shared sequence is the 11–13 rRNA loci.
- https://cdn.elifesciences.org/articles/93534/elife-93534-supp5-v1.xlsx
-
Supplementary file 6
Study Accession IDs.
- https://cdn.elifesciences.org/articles/93534/elife-93534-supp6-v1.txt
-
MDAR checklist
- https://cdn.elifesciences.org/articles/93534/elife-93534-mdarchecklist1-v1.docx
Download links
A two-part list of links to download the article, or parts of the article, in various formats.
Downloads (link to download the article as PDF)
Open citations (links to open the citations from this article in various online reference manager services)
Cite this article (links to download the citations from this article in formats compatible with various reference manager tools)
Interchromosomal segmental duplication drives translocation and loss of P. falciparum histidine-rich protein 3
eLife 13:RP93534.
https://doi.org/10.7554/eLife.93534.3


