Glial ferritin maintains neural stem cells via transporting iron required for self-renewal in Drosophila
- School of Life Science and Technology, Department of Neurosurgery, Zhongda Hospital, The Key Laboratory of Developmental Genes and Human Disease, Ministry of Education, Southeast University, China
- Co-innovation Center of Neuroregeneration, Nantong University, China
Figures
Figure 1 with 3 supplements
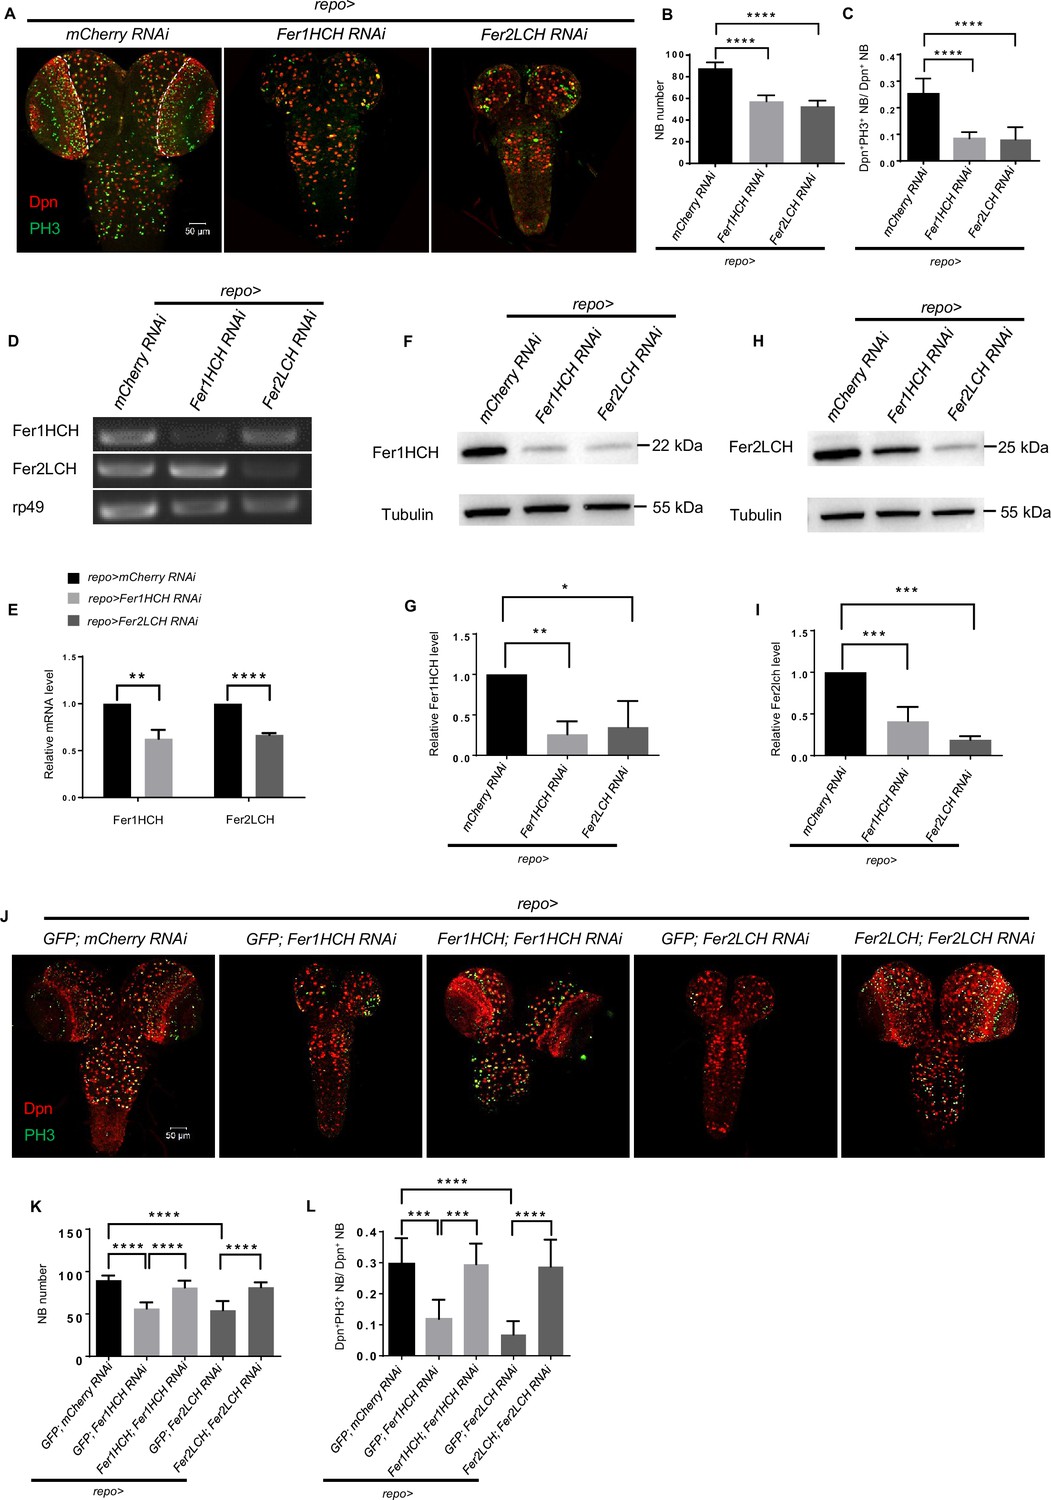
Ferritin in the glia is required for neuroblast (NB) maintenance and proliferation.
(A) NB number and proliferation rate after Fer1HCH or Fer2LCH RNAi in glia. (B) Quantification of NB number in central brain (CB) (A). (C) Quantification of NB proliferation rate in CB (A). (D and E) RT-PCR analysis of Fer1HCH and Fer2LCH mRNA levels (D) and normalized quantification (E) after glial ferritin knockdown. (F and H) Western blot of Fer1HCH (F) and Fer2LCH (H) after ferritin knockdown in glia. Tubulin was used as a loading control. (G and I) Quantification of normalized Fer1HCH intensity in (G) and Fer2LCH intensity in (I). (J) Rescue of NB number and proliferation when simultaneously overexpressing RNAi-resistant Fer1HCH and Fer1HCH RNAi (or Fer2LCH and Fer2LCH RNAi) in glia. (K and L) Quantification of NB number and proliferation rate in (J). (B, n=11; C, n=10; E, G and I, n=3; K, n=8, 8, 9, 7, 9; L, n=9, 8, 8, 7, 12; Statistical results were presented as means ± SD, p values in E were performed by unpaired two-sided Student’s t test, other p values were performed by one-way ANOVA with a Bonferroni test; ns, not significant; *p<0.05; **p<0.01; ***p<0.001; ****p<0.0001; Dpn, NB nuclei, red; PH3, green; DAPI, nuclei, blue).
Figure 1—figure supplement 1
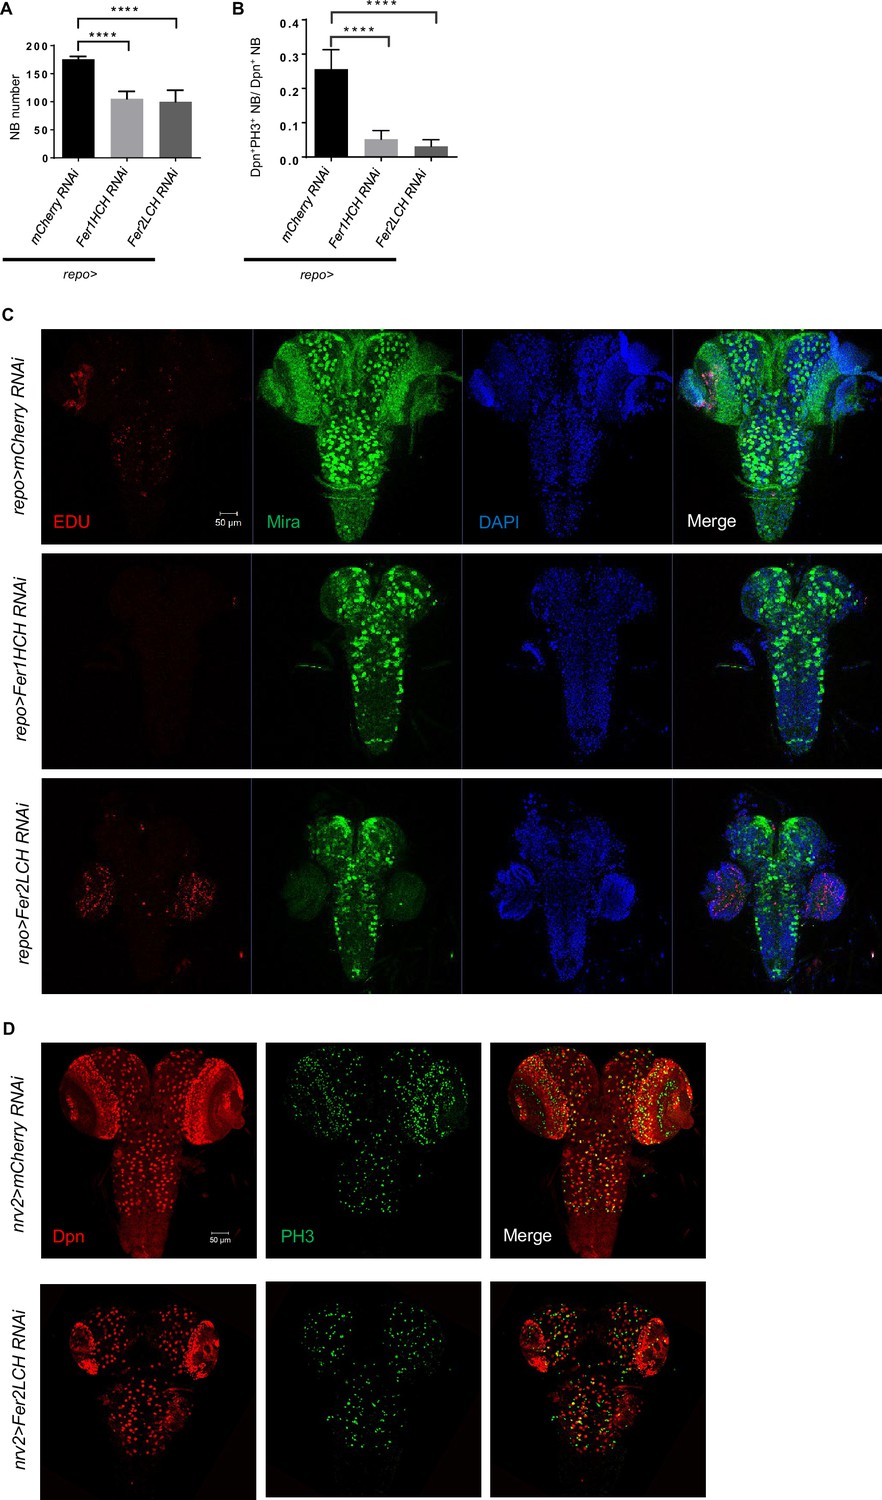
Glial ferritin knockdown leads to low neuroblast (NB) proliferation and number.
(A) Quantification of NB number in ventral nerve cord (VNC). (B) Quantification of NB proliferation rate in VNC. (C) 5-ethynyl-2’-deoxyuridine (EdU) incorporation in central nervous system (CNS) after knocking down glial ferritin. (D) Knocking down Fer2LCH by nrv2-GAL4 led to a similar but weaker phenotype in the brain in comparison with pan-glial ferritin knockdown. (A, n=11; B, n=10; Statistical results were presented as means ± SD, p values were performed by one-way ANOVA with a Bonferroni test; ****p<0.0001).
Figure 1—figure supplement 2
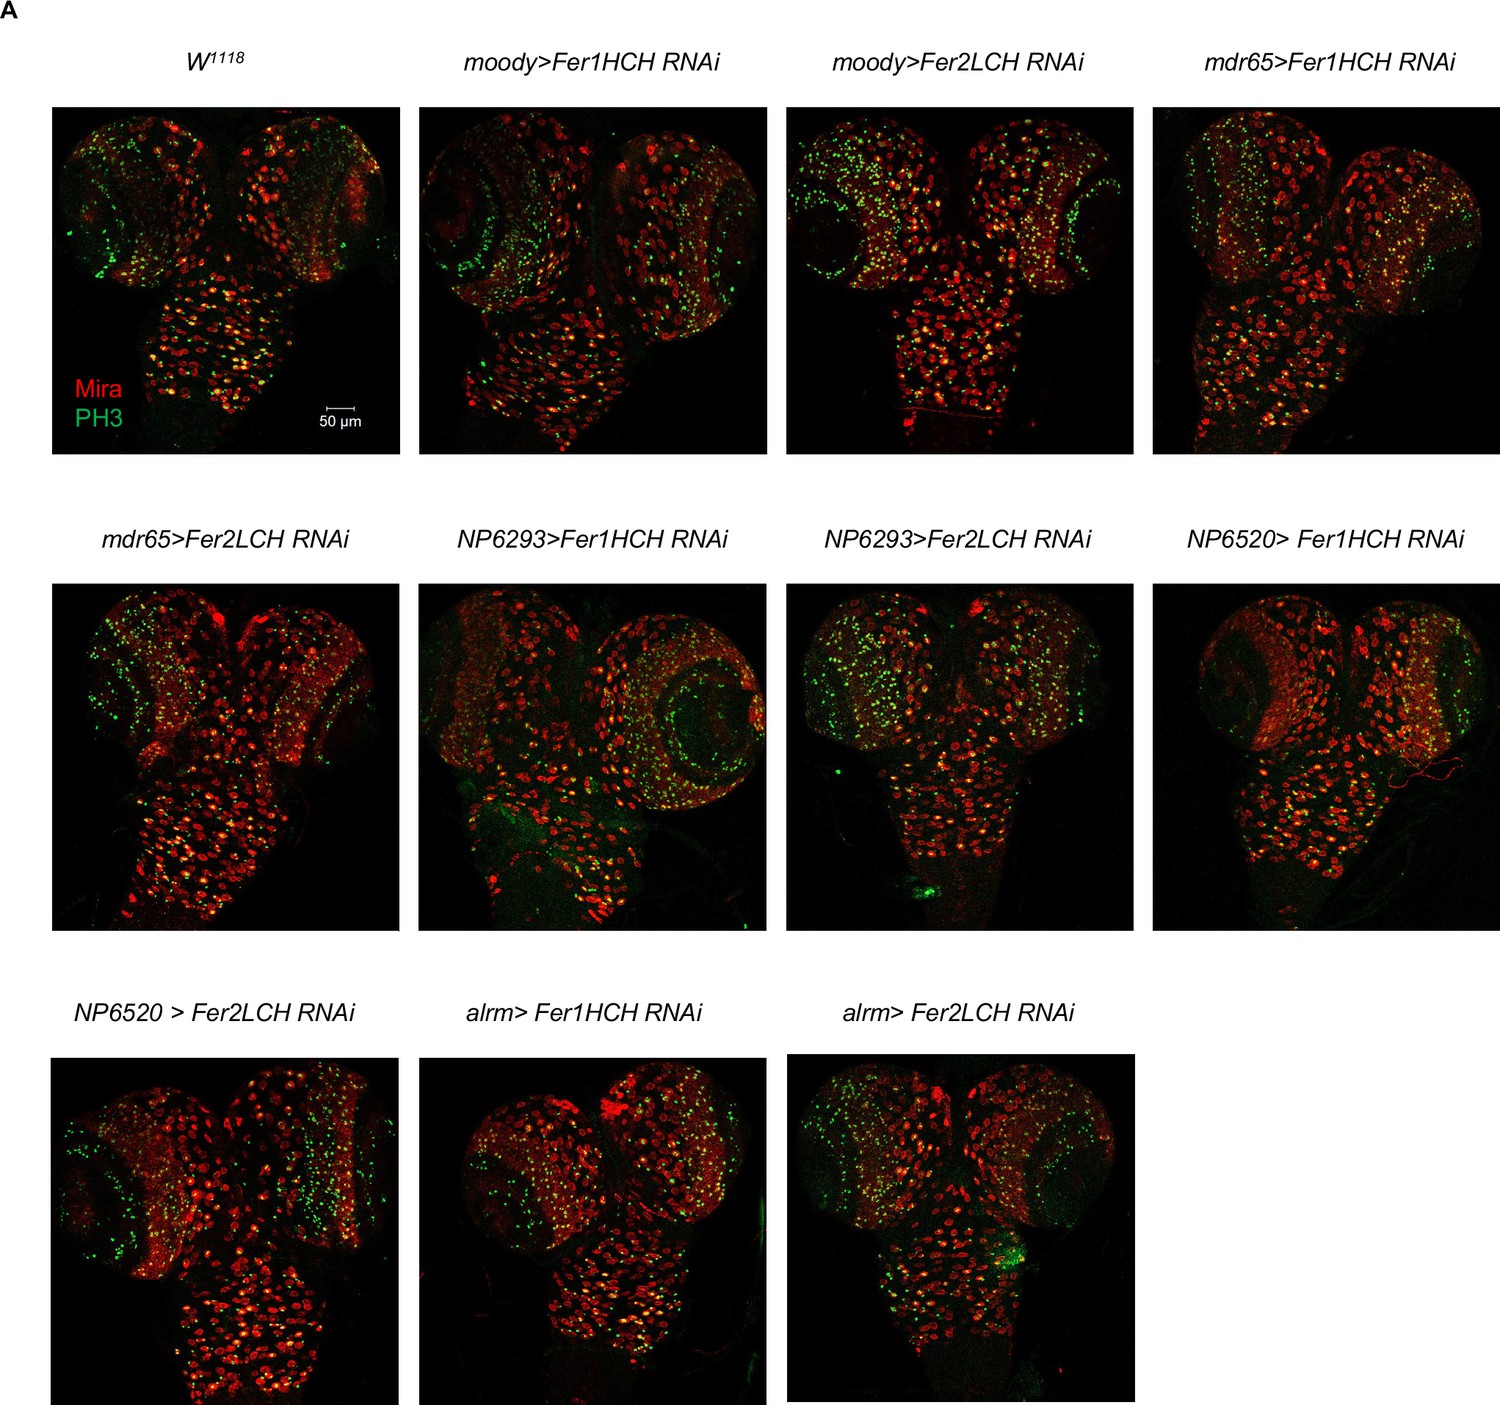
Ferritin knockdown in different glial subpopulations did not induce any discernible phenotype.
(A) Knocking down ferritin genes in subperineurial glia, perineurial glia, ensheathing glia, and astrocyte-like glia, respectively.
Figure 1—figure supplement 3
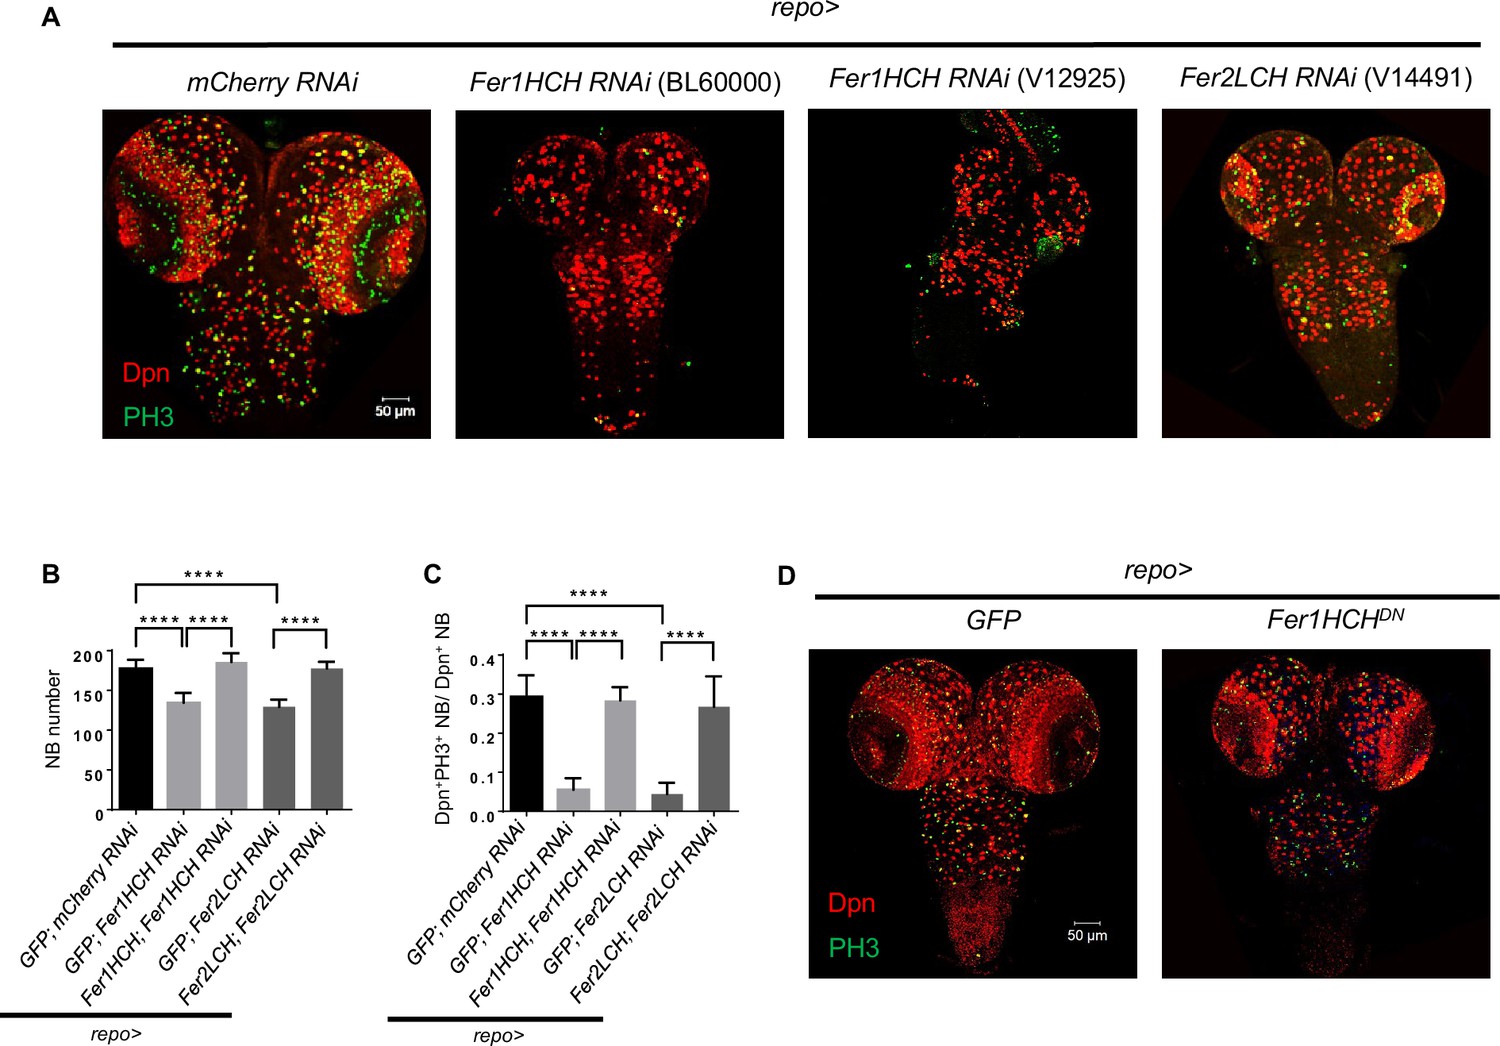
Verify the phenotype induced by glial ferritin knockdown using different manipulations.
(A) Neuroblast (NB) number and proliferation in other RNAi lines targeting on ferritin. (B) Rescue of NB number in ventral nerve cord (VNC) when simultaneously overexpressed RNAi-resistant Fer1HCH and Fer1HCH RNAi (or Fer2LCH and Fer2LCH RNAi) in glia. (C) Rescue of NB proliferation rate in VNC when simultaneously overexpressed RNAi-resistant Fer1HCH and Fer1HCH RNAi (or Fer2LCH and Fer2LCH RNAi) in glia. (D) NB number and proliferation in Fer1HCHDN. (B, n=8, 7, 9, 7, 8; C, n=9, 8, 8, 7, 12; Statistical results were presented as means ± SD, p values were performed by one-way ANOVA with a Bonferroni test; ****p<0.0001).
Figure 2 with 1 supplement
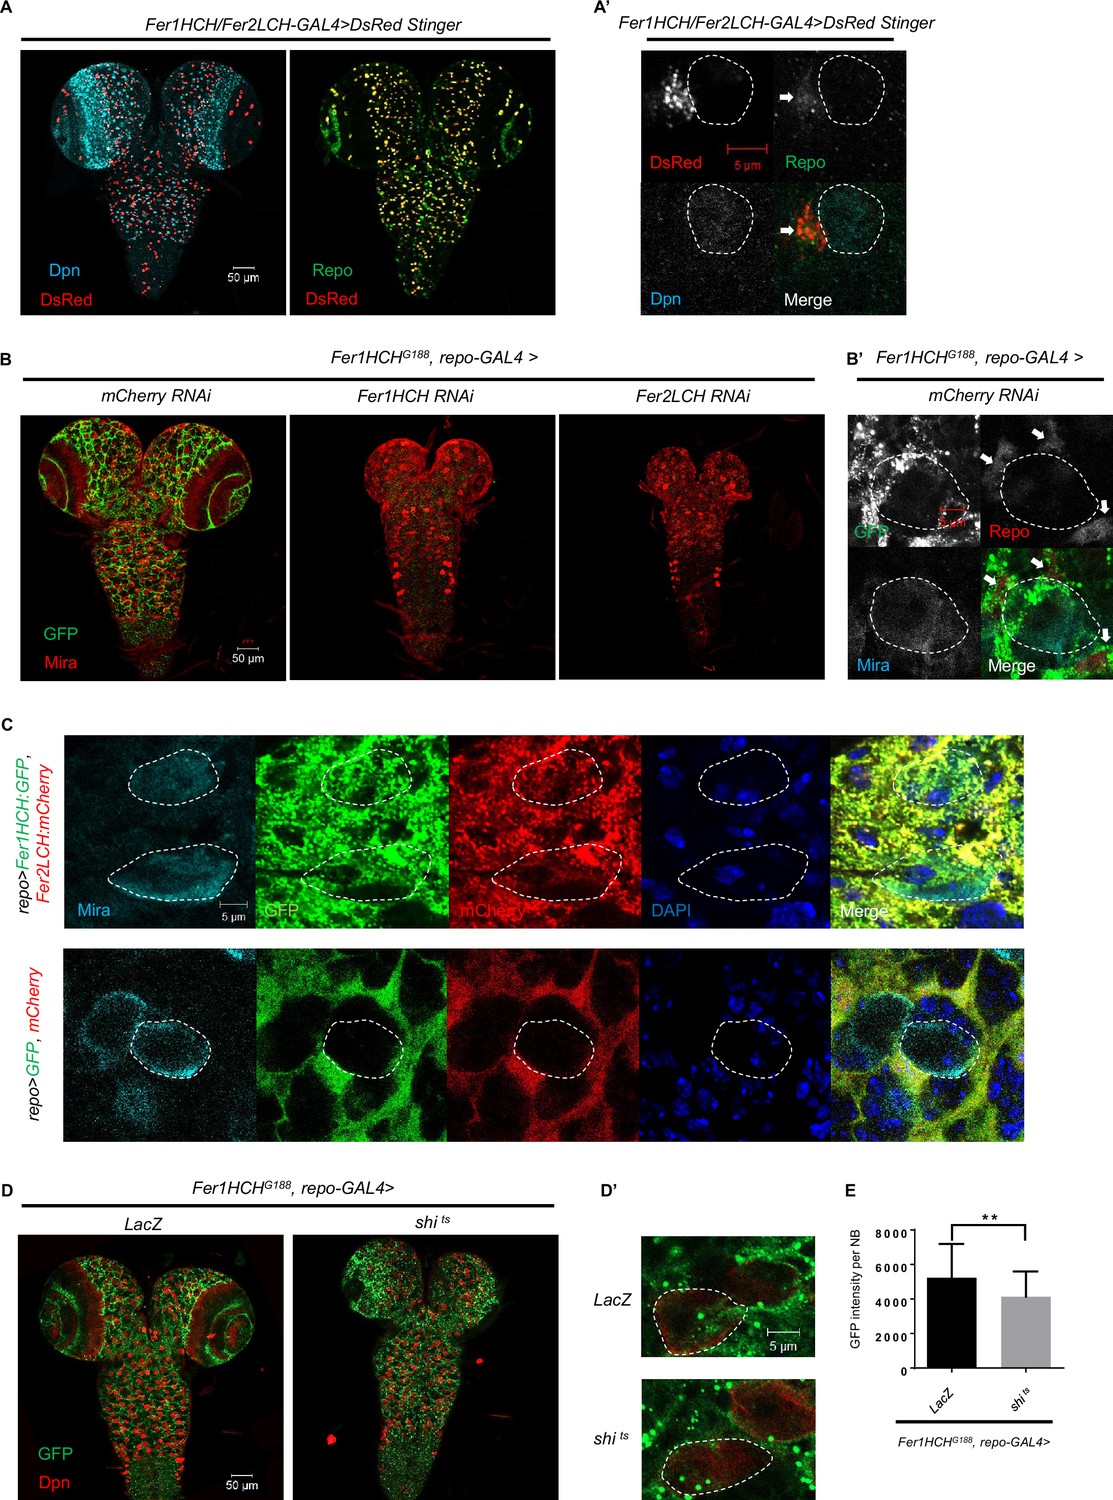
Ferritin is produced mainly in glial cells in the Drosophila central nervous system (CNS) and secreted into neuroblasts (NBs) through a vesicle-dependent pathway.
(A) The pattern of DsRed Stinger driven by Fer1HCH/Fer2LCH-GAL4 in CNS. (A’) The magnification of (A). (B) The distribution of ferritin labeled by Fer1HCHG188 in CNS of control and glial ferritin knockdown. (B’) The magnification of the left panel in (B). (C) Overexpressed ferritin tagged with GFP and mCherry in glia secreted into NBs. (D) The distribution of Fer1HCHG188 when blocking glial vesicular trafficking via overexpressing dominant-negative dynamin. (D’) The magnification of (D). (E) Quantification of (D), GFP signal in NBs when overexpressing shi ts in glia. (All white circles indicate NB position and white arrows point to glial cell; E, n=50, 48; Statistical results were presented as means ± SD, p value was performed by unpaired two-sided Student’s t test; **p<0.01).
Figure 2—figure supplement 1

Fer2LCH-GAL4 was used to validate the pattern of Fer1HCH/Fer2LCH-GAL4.
(A) Most DsRed driven by Fer2LCH-GAL4 was colocalized with glial marker Repo.
Figure 3 with 3 supplements
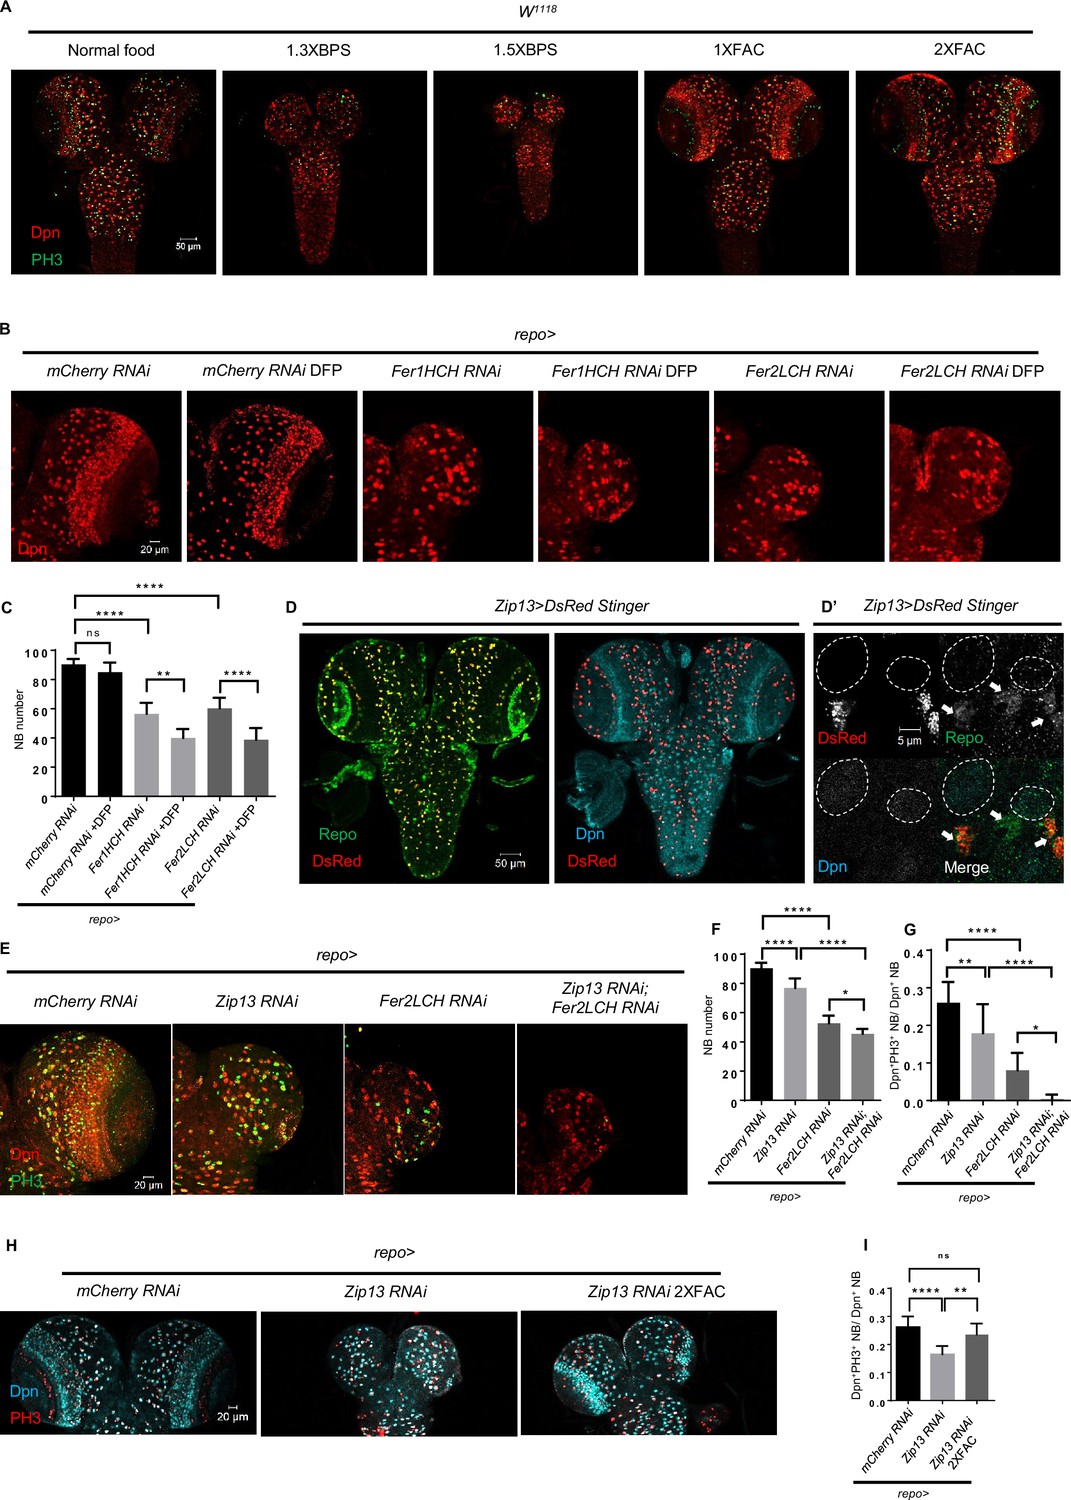
Glial ferritin defects lead to iron deficiency in neuroblasts (NBs).
(A) The conditions of brain development in Drosophila with feeding iron chelator bathophenanthrolinedisulfonic acid disodium (BPS) or supplementary iron ferric ammonium citrate (FAC). (B) Iron depletion by adding deferiprone (DFP) to food exacerbated the phenotype of NB loss induced by glial ferritin knockdown. (C) Quantification of NB number in (B). (D) Zip13 in central nervous system (CNS) is produced mainly by glial cells, but not NBs. (D’) The magnification of (D). (All white circles indicate NB position and white arrows point to glial cells). (E) Brain defects in Zip13 knockdown or double knockdown of Zip13 and Fer2LCH. (F and G) Quantification of NB number and proliferation rate in (E). (H) Iron supplements can rescue the NB proliferation in Zip13 RNAi driven by repo-GAL4. (I) Quantification of NB proliferation in (H). (C, n=6; F, n=6, 10, 11, 8; G, n=13, 10, 10, 8; I, n=8; Statistical results were presented as means ± SD, p values were performed by one-way ANOVA with a Bonferroni test; ns, not significant; *p<0.05; **p<0.01; ****p<0.0001).
Figure 3—figure supplement 1
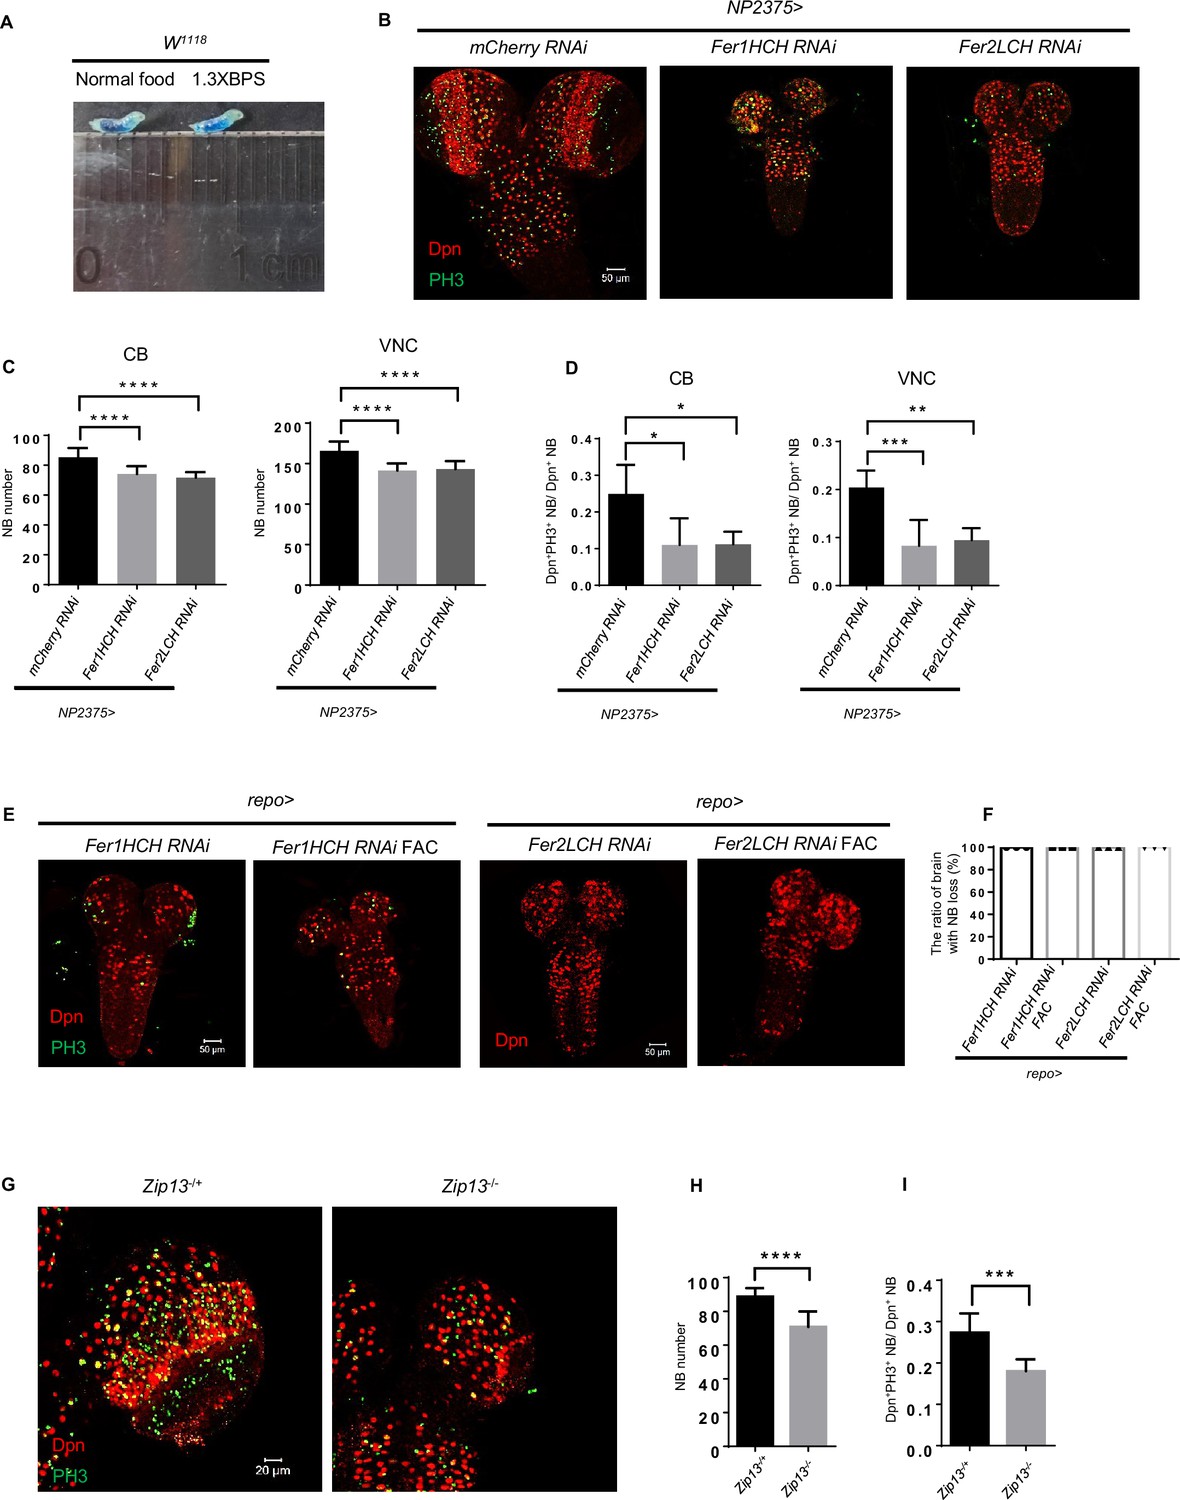
Brain defects induced by glial ferritin knockdown were caused by iron deficiency.
(A) Test the feeding behavior by adding Brilliant Blue to normal food or bathophenanthrolinedisulfonic acid disodium (BPS) food. (B) Iron deficiency by blocking iron absorption in gut also induced similar brain defects caused by BPS addition. (C) Quantification of neuroblast (NB) number in (B). (D) Quantification of NB proliferation in (B). (E) Brain development of glial ferritin knockdown after feeding ferric ammonium citrate (FAC). (F) The ratio of the brain with NB loss after adding FAC. (G) NB number and proliferation of Zip13 mutant. (H and I) Quantification of NB number and proliferation rate in (G). (C, n=10; D, n=5; F, n=3; H, n=10, 9; I, n=9, 8; Statistical results were presented as means ± SD, p values in C and D were performed by one-way ANOVA with a Bonferroni test, p values in H and I were performed by unpaired two-sided Student’s t test; *p<0.05; **p<0.01; ***p<0.001; ****p<0.0001).
Figure 3—figure supplement 2
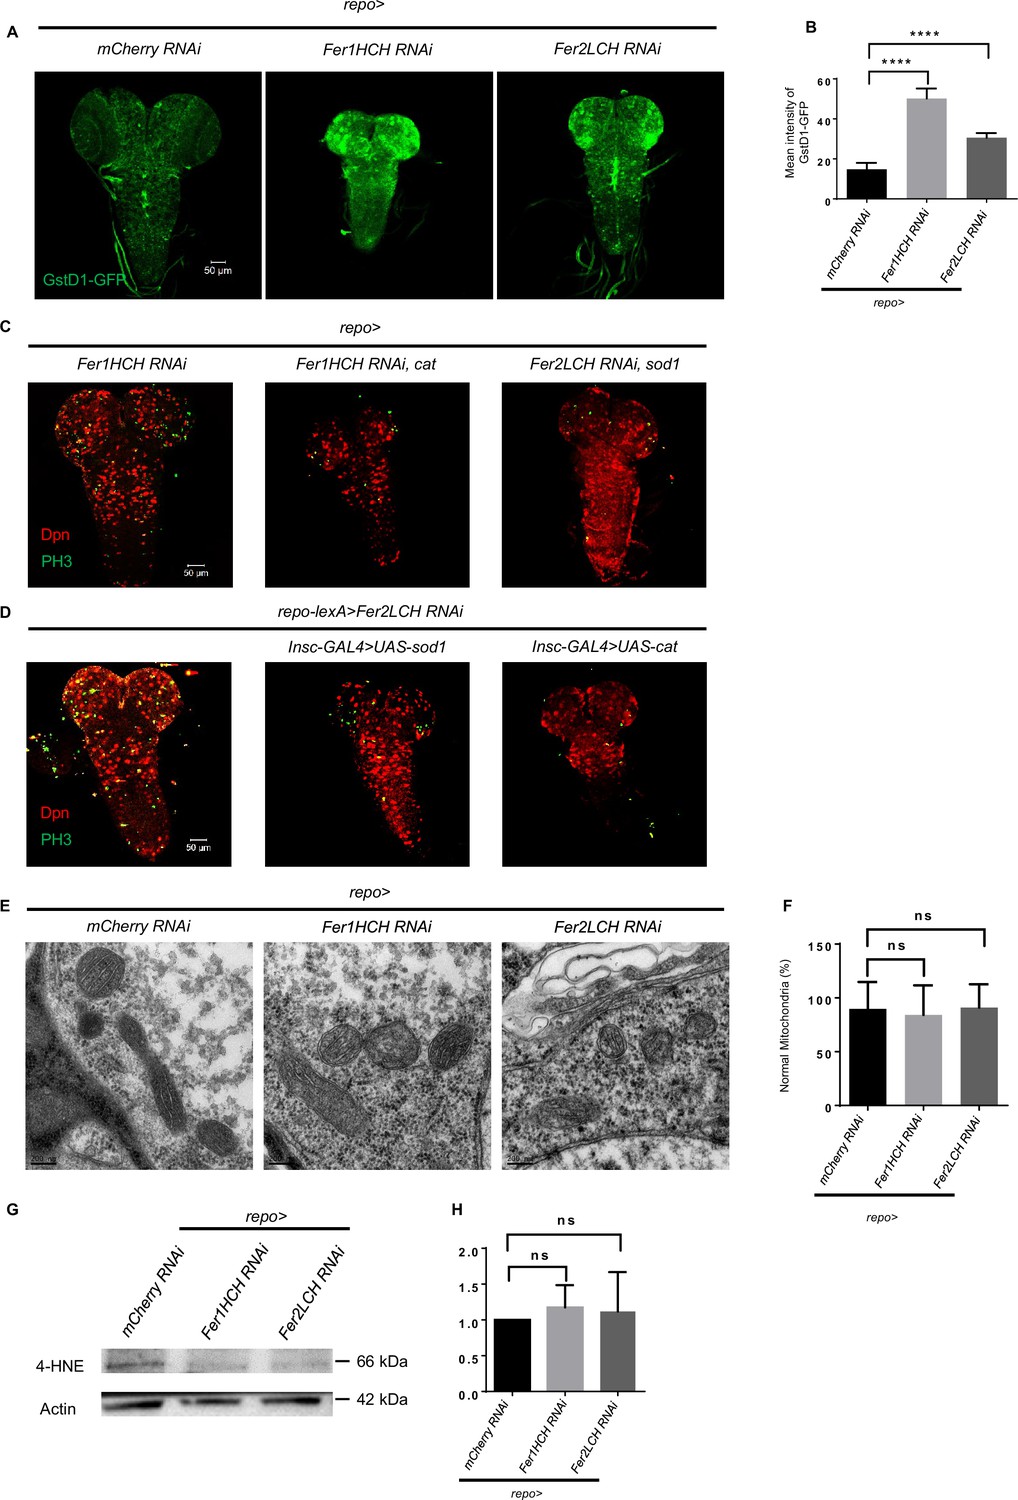
Reactive oxygen species (ROS) accumulates in central nervous system (CNS) after glial ferritin knockdown, but inhibiting ROS cannot restore neuroblast (NB) number and proliferation.
(A) ROS level marked by Gstd-GFP after knocking down ferritin in glia. (B) Quantification of ROS level in (A). (C) Overexpress antioxidant sod1 or cat in glial cells. (D) Overexpress antioxidant sod1 or cat in NBs. (E) Mitochondrial morphology by transmission electron microscopy (TEM) upon glial ferritin knockdown. (F) Quantification of normal mitochondria in (E). Intact mitochondria with their cristae visible were considered normal. (G) Western blot of 4-HNE after ferritin knockdown in glia. Actin was used as a loading control. (H) Quantification of normalized 4-HNE intensity in (G). (B, n=5, 4, 5; F, n=23, 27, 28; H, n=3; Statistical results were presented as means ± SD, p values were performed by one-way ANOVA with a Bonferroni test; ****p<0.0001; ns, not significant).
Figure 3—figure supplement 3
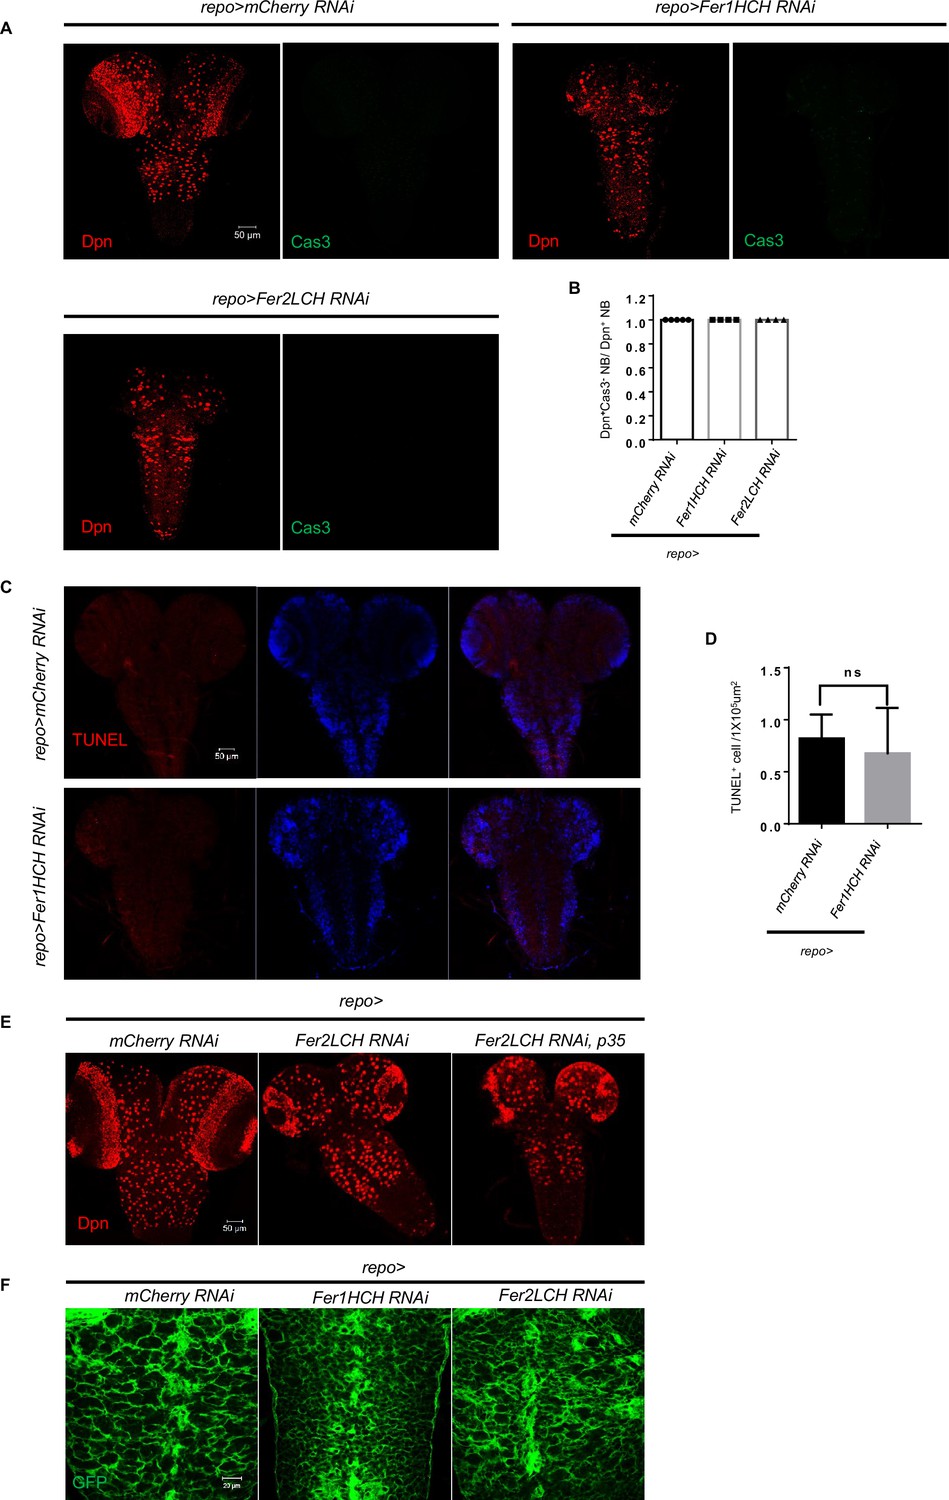
Glial ferritin knockdown does not induce apoptosis in the central nervous system (CNS).
(A) Apoptotic signal labeled by Caspase-3 of glial ferritin knockdown. (B) Quantification of Caspase-3 negative neuroblast (NB) ratio. (C) TUNEL staining of Fer1HCH RNAi driven by repo-GAL4. (D) Quantification of TUNEL positive cell per 1×105 μm2. (E) P35 overexpression in the glia could not rescue brain defects of ferritin knockdown. (F) Glial morphology was intact when knocking down glial ferritin. (B, n=5, 4, 4; D, n=3; Statistical results were presented as means ± SD, p value was performed by unpaired two-sided Student’s t test; ns, not significant).
Figure 4 with 1 supplement
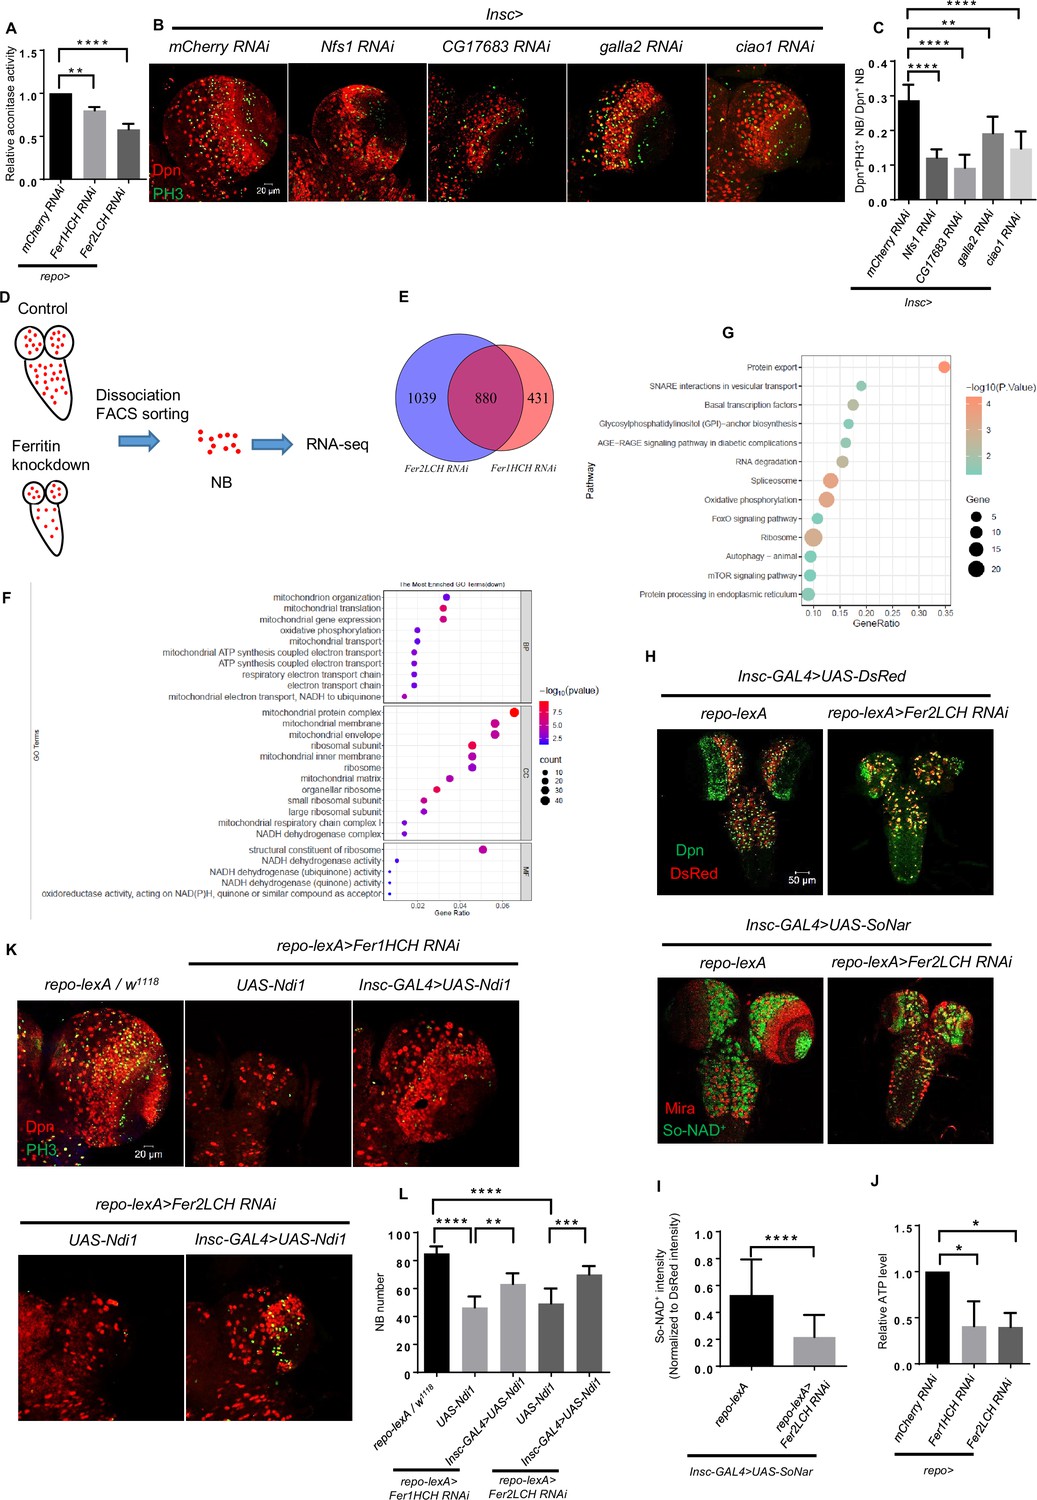
Glial ferritin defects result in impaired iron-sulfur (Fe-S) cluster activity and ATP production.
(A) The determination of cytosolic aconitase activity. (B) Knockdown of mitochondrial iron-sulfur protein Nfs1 and cytosolic iron-sulfur protein assembly (CIA) complex in neuroblasts (NBs). (C) Quantification of NB proliferation in (B). (D) The schematic diagram of the NB sorting procedure. (E) Venn diagram of downregulated genes after glial ferritin knockdown. (F) Gene Ontolog (GO) enrichment of down-regulated genes in glial ferritin knockdown compared with control. (G) Kyoto Encyclopedia of Genes and Genomes (KEGG) pathway enrichment of down-regulated genes after glial ferritin knockdown. (H) NAD+ level was indicated by SoNar. (I) Quantification of normalized SoNar signal in (H). (J) The determination of ATP level in central nervous system (CNS). (K) NB number in glial ferritin knockdown was rescued by Ndi1 overexpression in NBs. (L) Quantification of NB number in (K). (A and J, n=3; C, n=5, 7, 6, 6, 9; I, n=37,42; L, n=7, 7, 6, 6, 7; Statistical results were presented as means ± SD, p value in I was performed by unpaired two-sided Student’s t test, other p values were performed by one-way ANOVA with a Bonferroni test; *p<0.05; **p<0.01; ***p<0.001; ****p<0.0001).
Figure 4—figure supplement 1
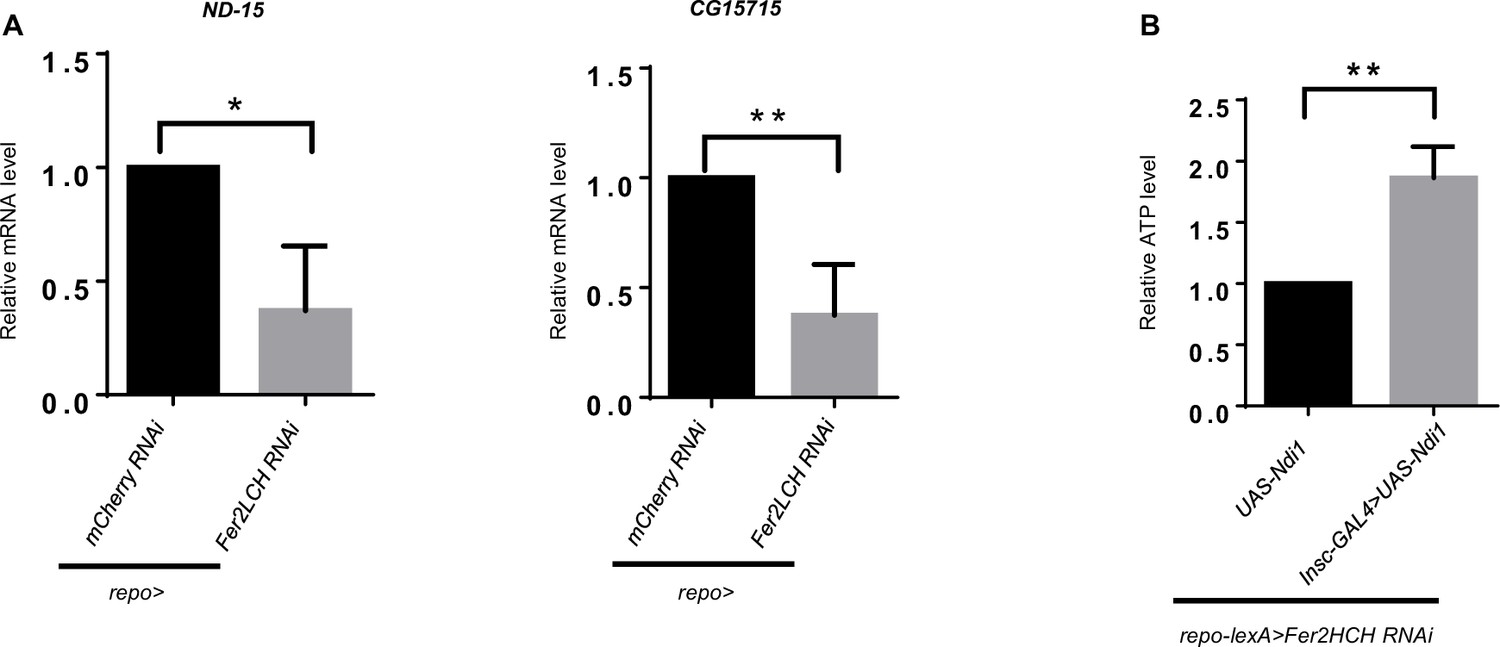
Validation of RNA-seq data by qRT-PCR using sorted neuroblast (NB) lineages and Ndi1 overexpression.
(A) qRT-PCR analysis of ND-15 and CG15715 to validate the enrichment result. (B) Ndi1 overexpression could restore ATP production. (A and B, n=3; Statistical results were presented as means ± SD, p values were performed by unpaired two-sided Student’s t test; *p<0.05; **p<0.01).
Figure 5 with 3 supplements
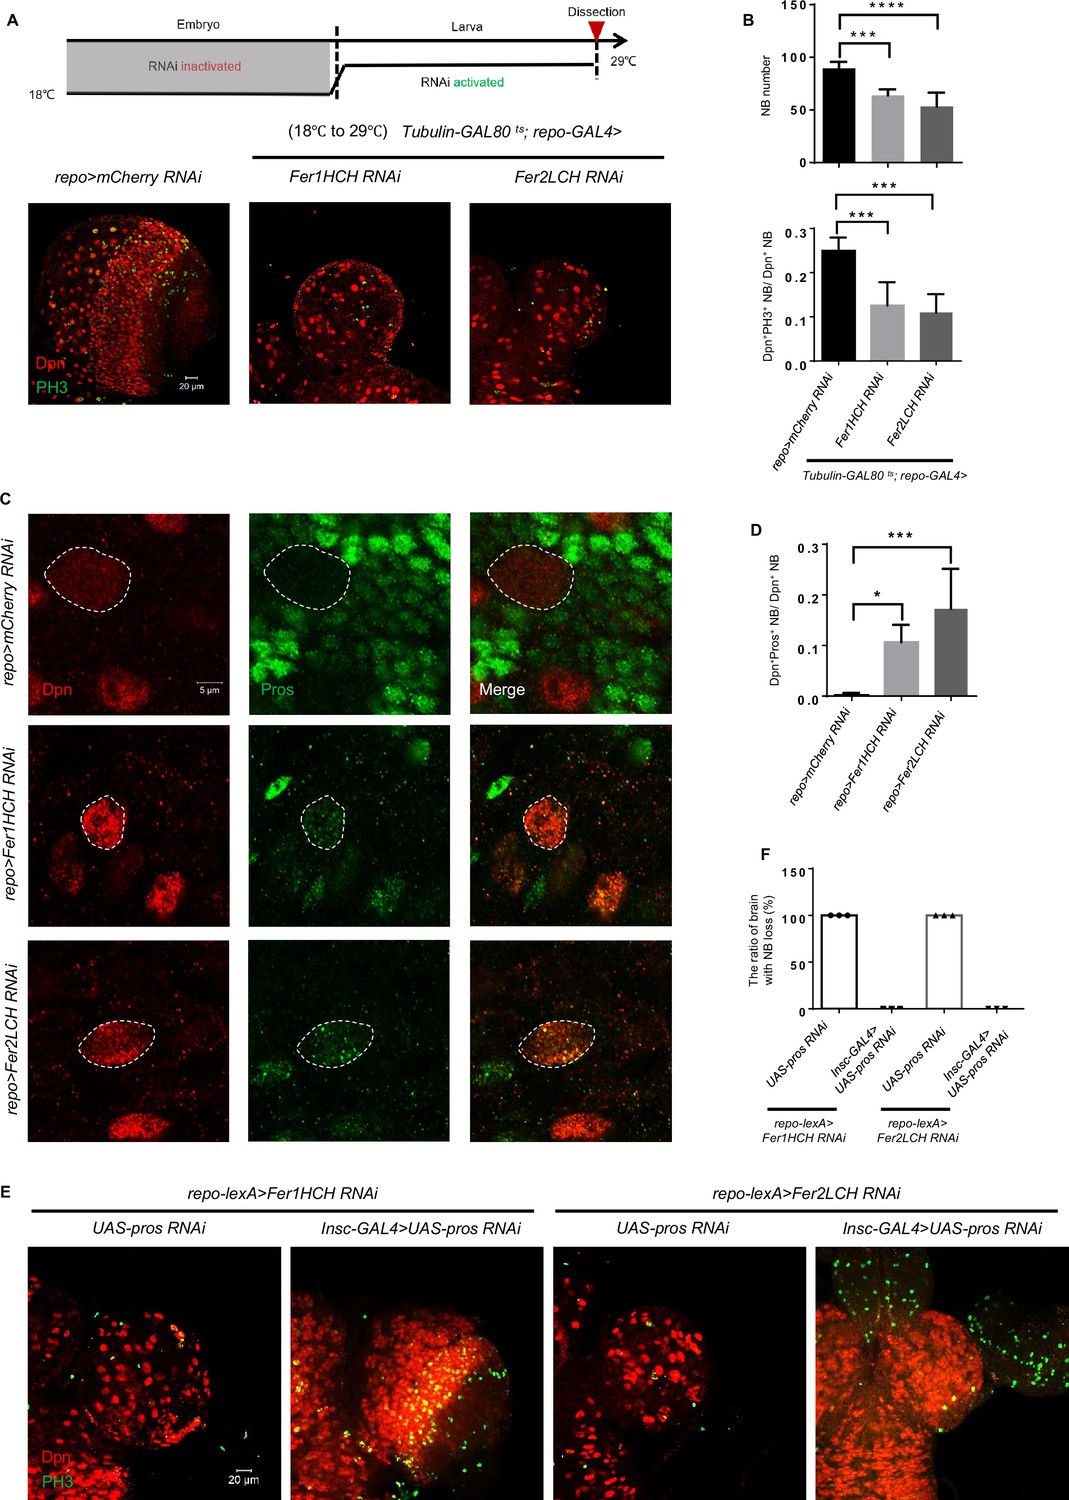
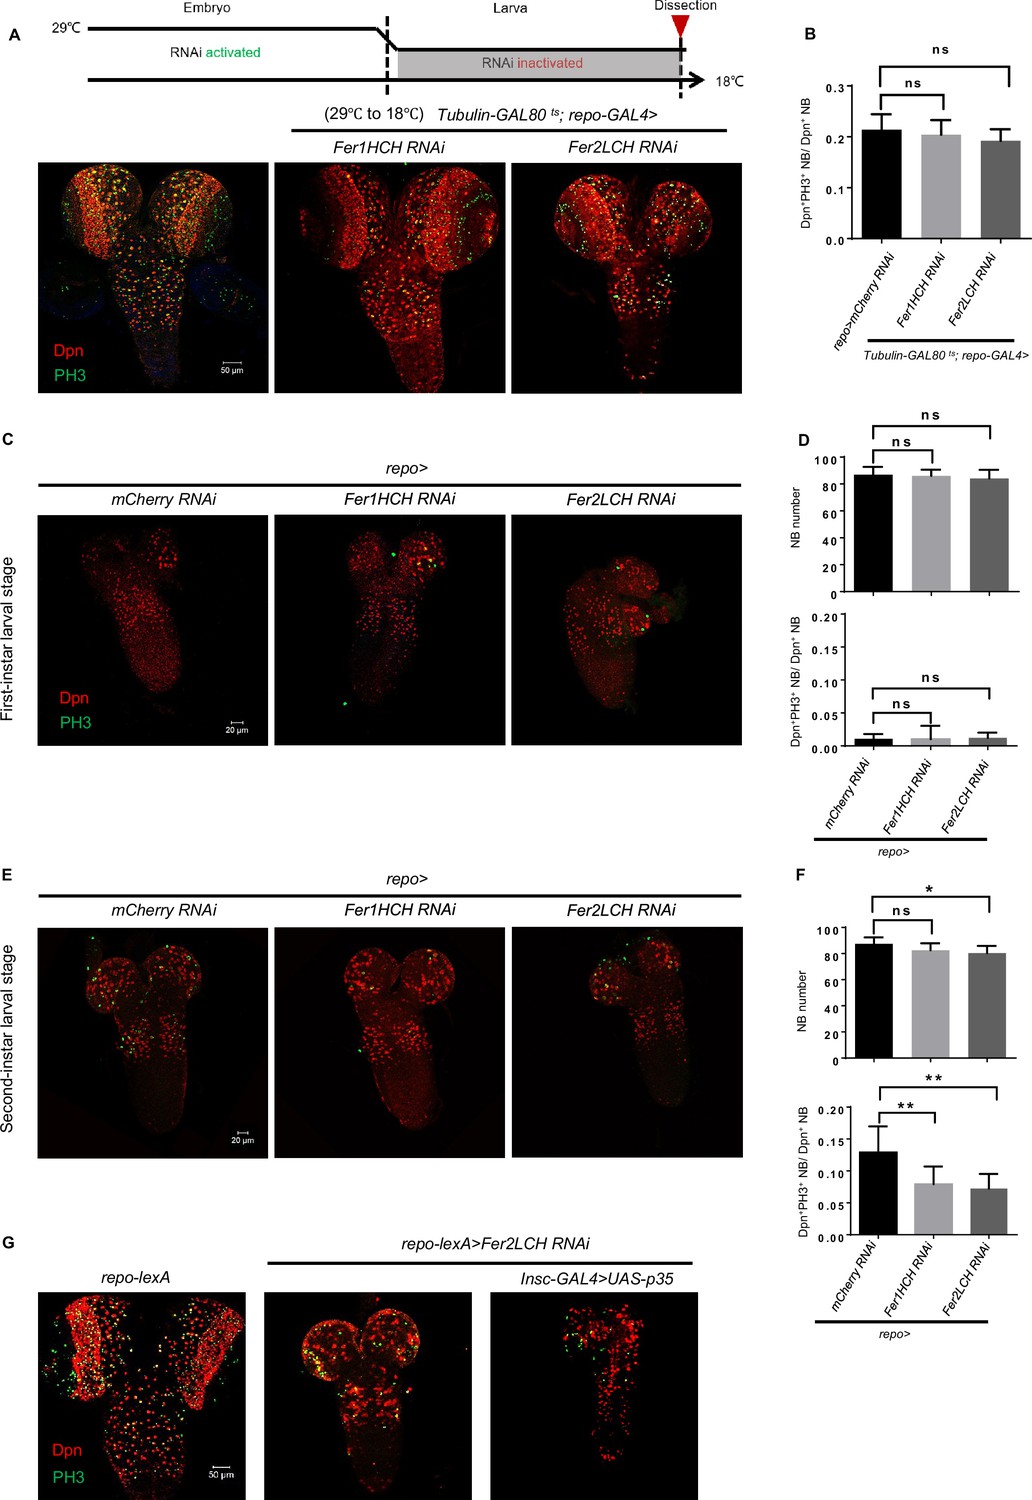
Glial ferritin defects lead to the premature differentiation of neuroblasts (NBs).
(A) Temporal window of glial ferritin maintaining NBs. The temperature shift of flies with glial ferritin knockdown from the permissive temperature (18℃) to the restrictive temperature (29℃). (B) Quantification of NB number and proliferation in (A). (C) Pros staining of knocking down glial ferritin. (D) Quantification of the ratio of Pros+Dpn+ NBs to Dpn+ NBs. (E) Knockdown of pros in NBs rescues the NB number. (F) The ratio of the brain with NB loss in (E). (B, n=6, 5, 6; n=6, 5, 4; D, n=5; F, n=3; Statistical results were presented as means ± SD, p values were performed by one-way ANOVA with a Bonferroni test;*p<0.05; ***p<0.001; ****p<0.0001).
Figure 5—figure supplement 1
Neuroblast (NB) loss upon glial ferritin knockdown is not due to NB origin and apoptosis.
(A) Temporal window of glial ferritin maintaining NBs. The temperature shift of flies with glial ferritin knockdown from the restrictive temperature (29℃) to the permissive temperature (18℃). (B) Quantification of NB proliferation in (A). (C) The central nervous system (CNS) of the first-instar larvae with glial ferritin knockdown. (D) Quantification of NB number and proliferation in (C). (E) The CNS of the second-instar larvae with glial ferritin knockdown. (F) Quantification of NB number and proliferation in (E). (G) P35 overexpression in NBs could not rescue the brain defects induced by glial ferritin knockdown. (B, n=5; D, n=6; 8, 9, 8; F, n=11, 9, 9; 8, 9, 8; Statistical results were presented as means ± SD, p values were performed by one-way ANOVA with a Bonferroni test;*p<0.05; **p<0.01; ns, not significant).
Figure 5—figure supplement 2
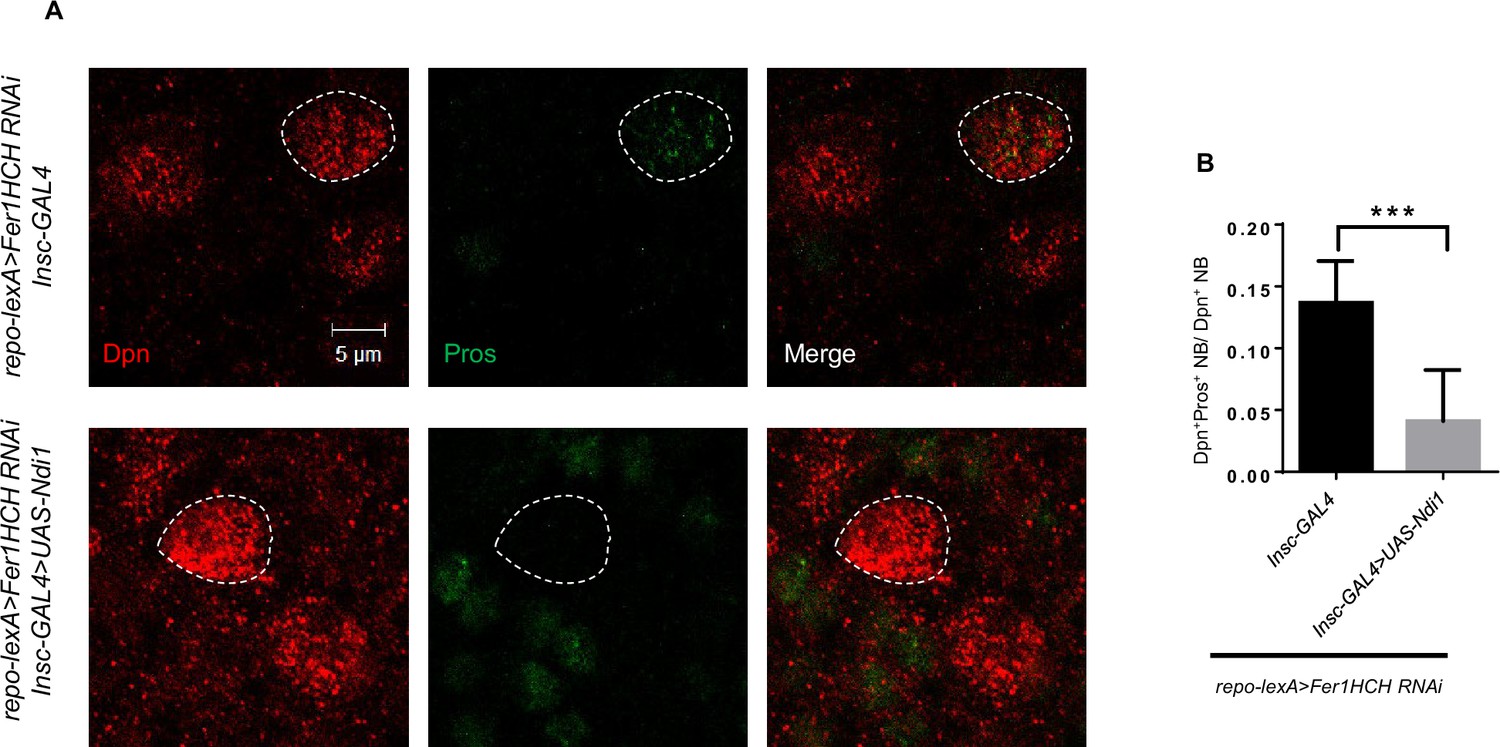
Ndi1 overexpression can restore Pros localization.
(A) Pros staining of Ndi1 overexpression upon glial ferritin knockdown. (B) Quantification of the ratio of Pros+ Dpn+ NBs to Dpn+ NBs in (A). (B, n=6, 9; Statistical results were presented as means ± SD, p value was performed by unpaired two-sided Student’s t test; ***p<0.001).
Figure 5—figure supplement 3
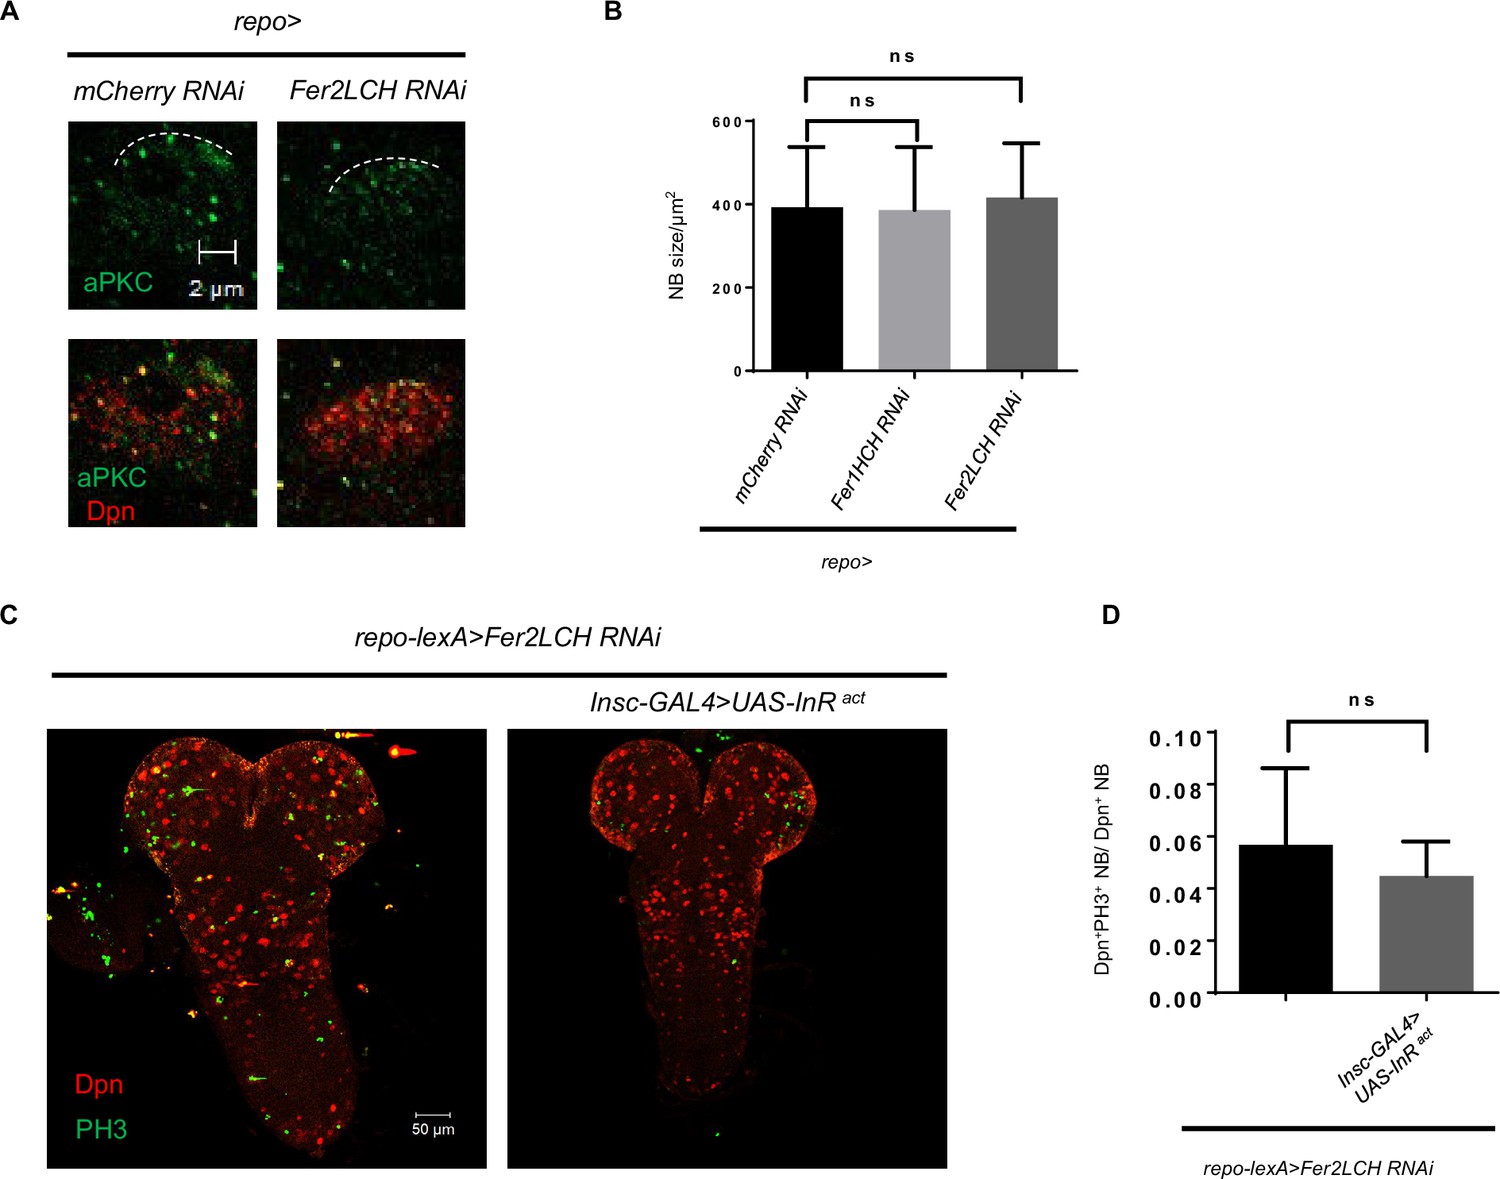
Glial ferritin defects do not affect neuroblast (NB) reactivation and asymmetric division.
(A) aPKC localization in NB after knocking down Fer2LCH. (B) NB size upon glial ferritin knockdown was not changed. (C) Activation of Insulin signaling could not restore NB number and proliferation. (D) Quantification of NB proliferation in (B). (B, n=100; D, n=8, 5; Statistical results were presented as means ± SD, p values in B were performed by one-way ANOVA with a Bonferroni test, p value in D was performed by unpaired two-sided Student’s t test; ns, not significant).
Figure 6 with 1 supplement
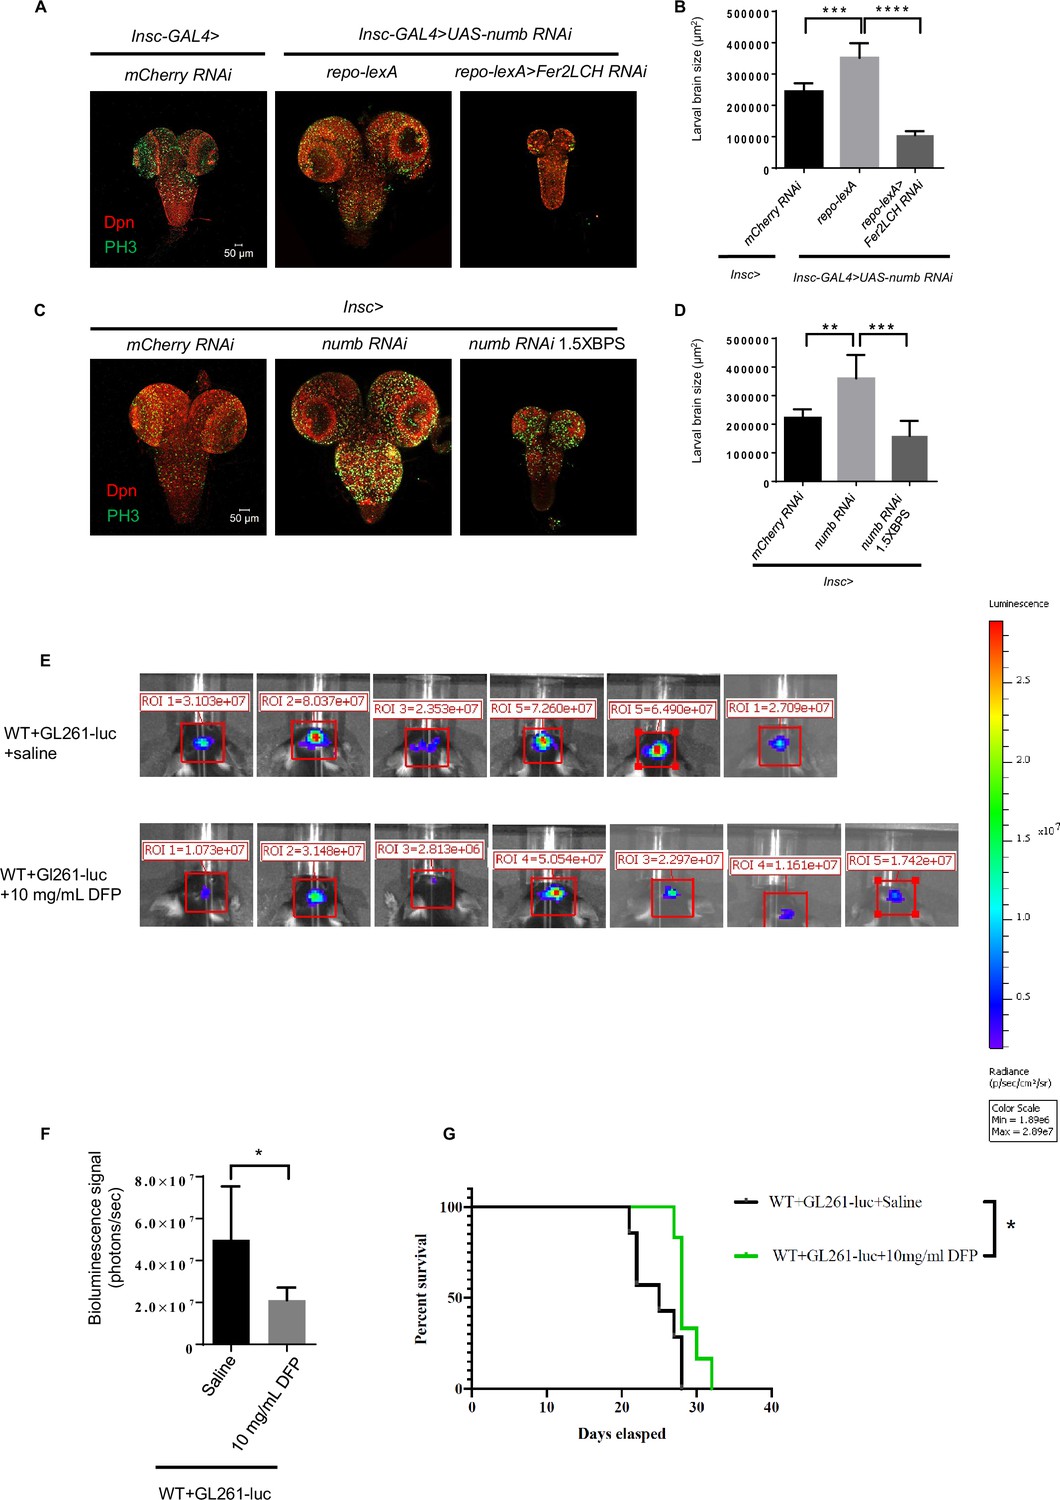
Ferritin functions as a potential target for tumor suppression.
(A) Knockdown of ferritin in glia could inhibit the tumor induced by numb RNAi. (B) Quantification of larval brain size in (A). (C) Iron chelator bathophenanthrolinedisulfonic acid disodium (BPS) supplemented in the food suppressed brain tumor growth. (D) Quantification of larval brain size in (C). (E) Bioluminescence signal in mice with glioma on day 14. (F) Quantification of bioluminescence signal in (E). (G) Kaplan-Meier survival curve of mice treated with deferiprone (DFP). (B, n=6, 7, 5; D, n=5, 6, 6; F, n=6, 7; G, n=7, 6; Statistical results were presented as means ± SD, p values in B and D were performed by one-way ANOVA with a Bonferroni test, p value in F was performed by unpaired two-sided Student’s t test, p value in G was performed by log-rank test; *p<0.05; **p<0.01 ***p<0.001; ****p<0.0001).
Figure 6—figure supplement 1
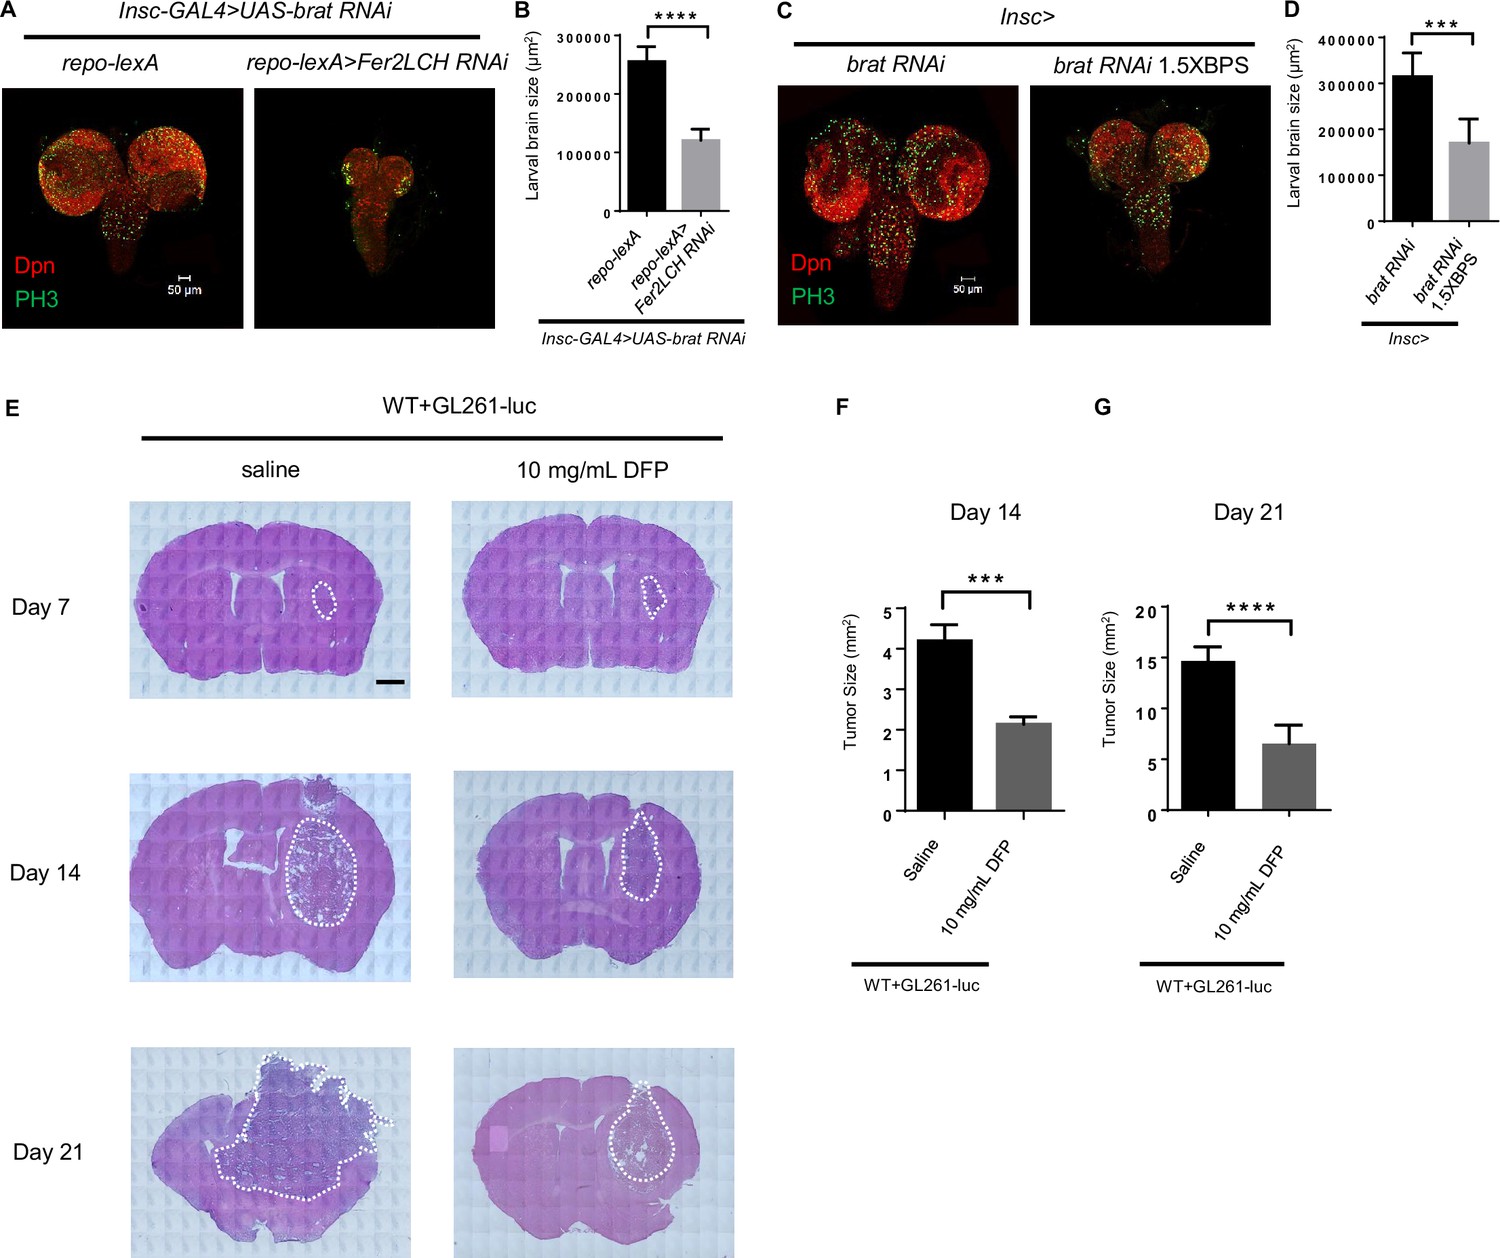
Iron chelator inhibits tumor progression in Drosophila and mice.
(A) Knockdown of ferritin in glia could inhibit the tumor induced by brat RNAi. (B) Quantification of larval brain size in (A). (C) Iron chelator bathophenanthrolinedisulfonic acid disodium (BPS) suppressed brain tumor growth of brat RNAi. (D) Quantification of larval brain size in (C). (E) The appearance and Hematoxylin and Eosin (HE) staining of brains in mice with deferiprone (DFP) injection on days 7, 14, and 21. Scar bar: 1000 μm. (F and G) Quantification of HE staining in murine brains on day 14 (F) and 21 (G). (B, n=10,7; D, n=8, 6; F, n=6; G, n=9, 8; Statistical results were presented as means ± SD, p values were performed by unpaired two-sided Student’s t test; ***p<0.001; ****p<0.0001.).
Figure 7
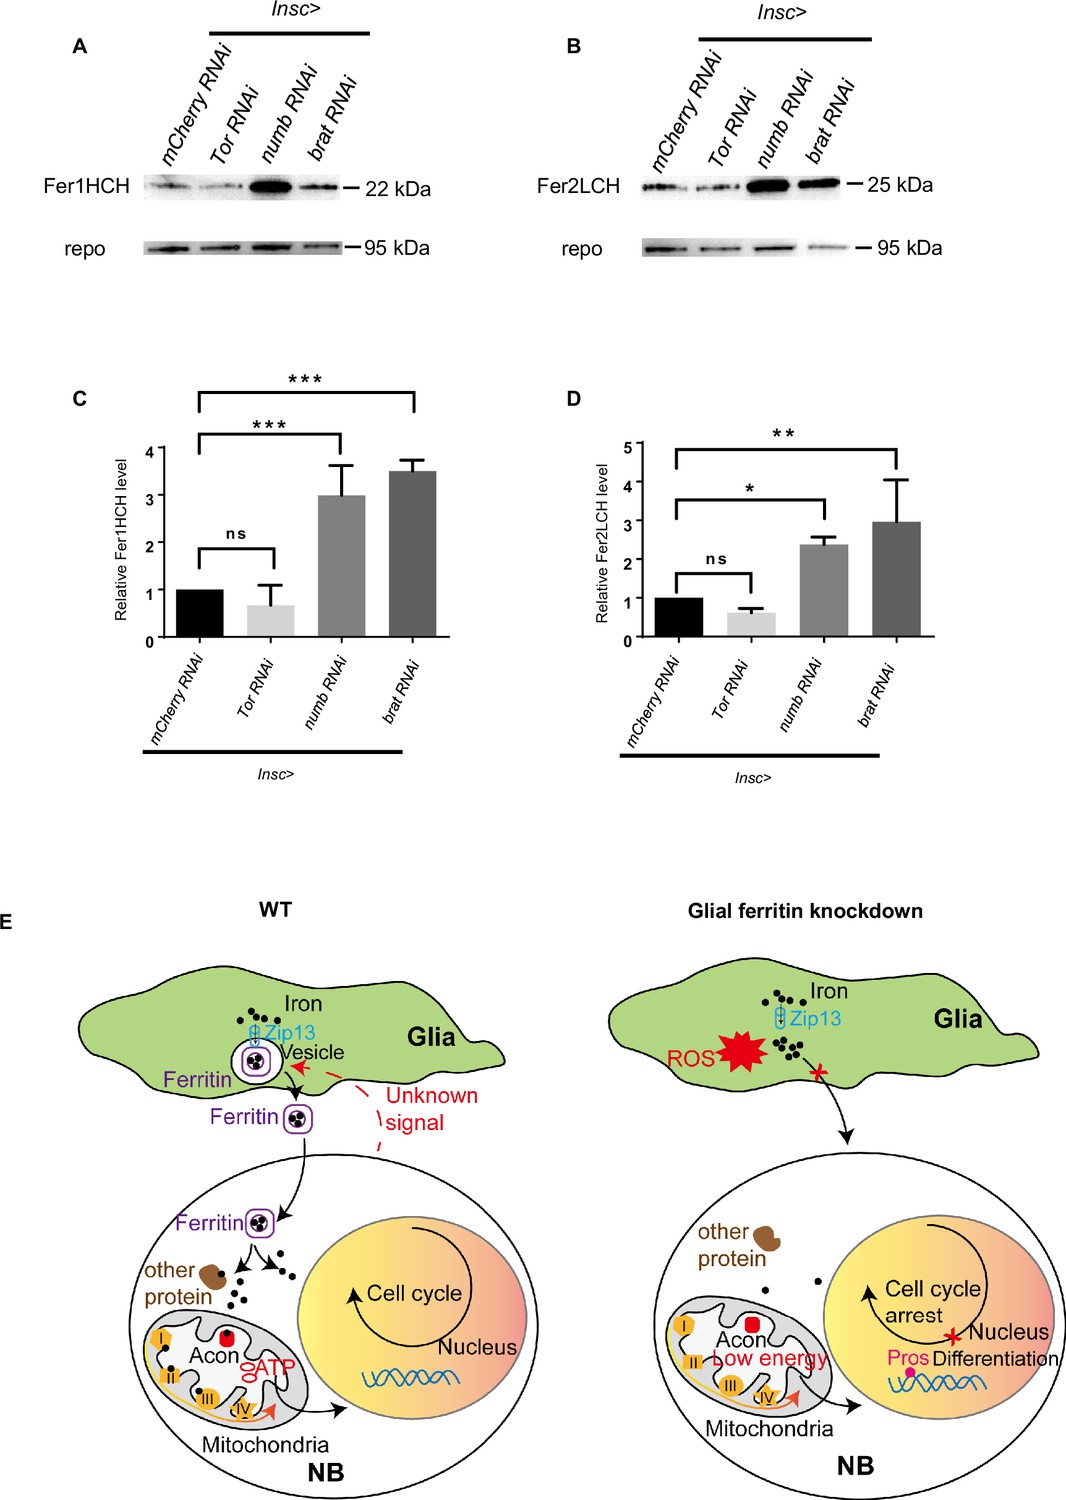
The level of ferritin is controlled by neuroblast (NB) proliferation.
(A) Fer1HCH subunit level in Drosophila central nervous system (CNS) after manipulating proliferation. (B) Fer2LCH subunit level in Drosophila CNS after manipulating proliferation. (C) Quantification of Fer1HCH level in (A). (D) Quantification of Fer2LCH level in (B). (E) The model of glial ferritin regulating NBs. (C and D, n=3; Statistical results were presented as means ± SD, p values were performed by one-way ANOVA with a Bonferroni test; ns, not significant; *p<0.05; **p<0.01; ***p<0.001).
Author response image 1

The schematic diagram of relationship between energy and NB function in different groups.
“T” represents total energy for NB maintenance and proliferation. “N” represents the energy for NB maintenance. “P” represents the energy for NB proliferation. T=N+P
Author response image 2
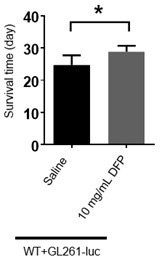
The bar graph of survival time of mice treated with DFP.
(The unpaired two-sided Student’s t test was employed to assess statistical significance. Statistical results were presented as means ± SD. n=7,6; *: p<0.05)
Tables
Table 1
The phenotype of ferritin knockdown in different glial subpopulations.
BDSC: Bloomington Drosophila Stock Center; DGRC: Drosophila Genetic Resource Center; +++: strong phenotype; ++: weak phenotype; -: no phenotype.
| GAL4 driver | Stock center | Stock number | Expression pattern | Fer1HCH RNAi | Fer2LCH RNAi |
|---|---|---|---|---|---|
| repo-GAL4 | BDSC | 7415 | all glia | +++ | +++ |
| nrv2-GAL4 | BDSC | 6799 | cortex glia | + | + |
| mdr65-GAL4 | BDSC | 50472 | subperineurial glia | - | - |
| moody-GAL4 | BDSC | 90883 | subperineurial glia | - | - |
| NP6293-GAL4 | DGRC | 105188 | perineurial glia | - | - |
| alrm-GAL4 | BDSC | 67032 | astrocyte-like glia | - | - |
| NP6520-GAL4 | DGRC | 105240 | ensheathing glia | - | - |
Additional files
-
Supplementary file 1
- https://cdn.elifesciences.org/articles/93604/elife-93604-supp1-v1.xlsx
-
Supplementary file 2
The phenotype of iron-related genes driven by repo-GAL4 or Insc-GAL4.
- https://cdn.elifesciences.org/articles/93604/elife-93604-supp2-v1.xlsx
-
MDAR checklist
- https://cdn.elifesciences.org/articles/93604/elife-93604-mdarchecklist1-v1.pdf
Download links
A two-part list of links to download the article, or parts of the article, in various formats.
Downloads (link to download the article as PDF)
Open citations (links to open the citations from this article in various online reference manager services)
Cite this article (links to download the citations from this article in formats compatible with various reference manager tools)
Glial ferritin maintains neural stem cells via transporting iron required for self-renewal in Drosophila
eLife 13:RP93604.
https://doi.org/10.7554/eLife.93604.3


