CaBP1 and 2 enable sustained CaV1.3 calcium currents and synaptic transmission in inner hair cells
- Experimental Otology Group, InnerEarLab, Department of Otolaryngology, University Medical Center Göttingen, Germany
- Auditory Neuroscience Group, Max Planck Institute for Multidisciplinary Sciences, Germany
- Auditory Systems Physiology Group, Institute for Auditory Neuroscience, InnerEarLab, University Medical Center Göttingen, Germany
- Collaborative Research Center 889, University of Göttingen, Germany
- Functional Auditory Genomics, Institute for Auditory Neuroscience, University Medical Center Göttingen, Germany
- Institute for Auditory Neuroscience and InnerEarLab, University Medical Center Göttingen, Germany
- Restorative Cochlear Genomics Group, Auditory Neuroscience and Optogenetics Laboratory, German Primate Cente, Germany
- Multiscale Bioimaging Cluster of Excellence (MBExC), University of Göttingen, Germany
Figures
Figure 1 with 1 supplement
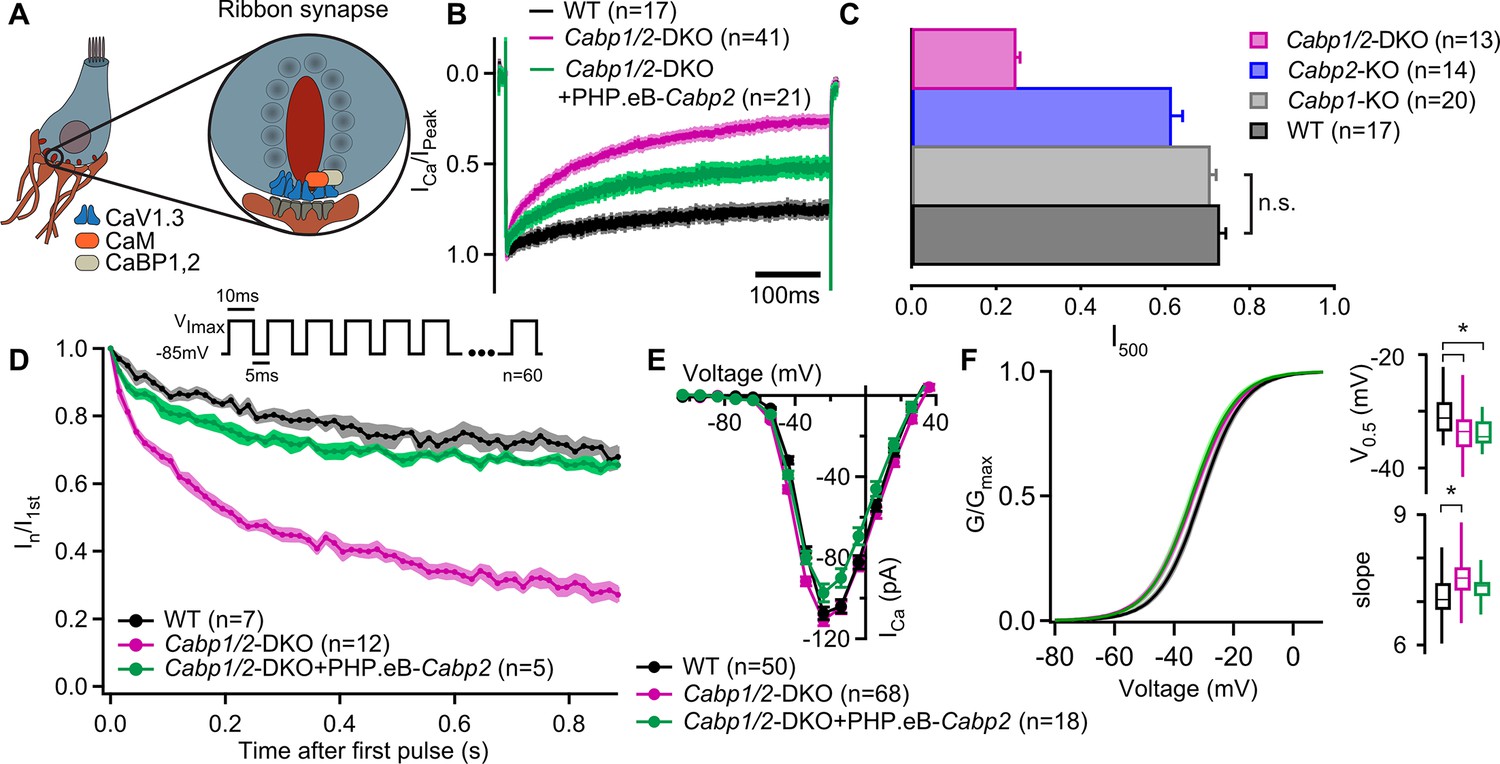
Strong inactivation of inner hair cell (IHC) CaV1.3 channels upon deletion of Cabp1 and Cabp2.
(A) Schematic of the IHC and one of its several ribbon synapses. CaBPs and CaM modulate voltage-gated calcium channels at the IHC ribbon synapses to shape the presynaptic Ca2+ signal. (B) Peak normalized Ca2+ currents after a 500-ms depolarization step to the maximum current potential in the apical IHCs of WT and Cabp1/2-DKO animals. Note a pronounced inactivation of the Ca2+ current in the absence of CaBP1 and 2 and partial recovery upon Cabp2 gene replacement. (C) The fraction of the remaining Ca2+ current after a 500-ms depolarization step is depicted for different mouse models acquired at comparable conditions (room temperature, 2 mM extracellular [Ca2+]). The histogram combines the results of this study (Cabp1/2-DKO) with previously published data on CaBP1 (Yang et al., 2018) and CaBP2 (Picher, 2017). The WT data combines pooled data from the current study and controls as obtained previously (Yang et al., 2018). Note that the recordings from Cabp2-KO animals were acquired at the lower apex to mid-cochlear tonotopic positions as the phenotype in the apex (low-frequency positions investigated otherwise) is mild (Picher, 2017). (D) Ca2+ currents upon a train of 10-ms long depolarization steps normalized to the amplitude of the first pulse. (E) Ca2+-current–voltage relationships show slightly reduced amplitudes in the IHCs of the Cabp1/2-DKO animals transduced with the PHP.eB-Cabp2. (F) Activation curves were calculated with Boltzmann fits. Note a significant difference (asterisks,p < 0.0001, Student’s t-test) in the half-voltage activation (V0.5) and slope in the CaBP1/2-deficient IHCs and the persistence of the voltage shift upon re-expression of CaBP2 (inserts). See main text for the p values. Data in B and D–F was acquired in 1.3 mM, data in C in 2 mM [Ca]2+.
-
Figure 1—source data 1
Traces and values obtained from patch-clamp recordings and custom-written macros that were used for analyses in Figure 1B–D, Figure 2, and Figure 1—figure supplement 1.
- https://cdn.elifesciences.org/articles/93646/elife-93646-fig1-data1-v1.zip
-
Figure 1—source data 2
Traces and values obtained from patch-clamp recordings and custom-written macros that were used for analyses in Figure 1E, F.
- https://cdn.elifesciences.org/articles/93646/elife-93646-fig1-data2-v1.zip
Figure 1—figure supplement 1
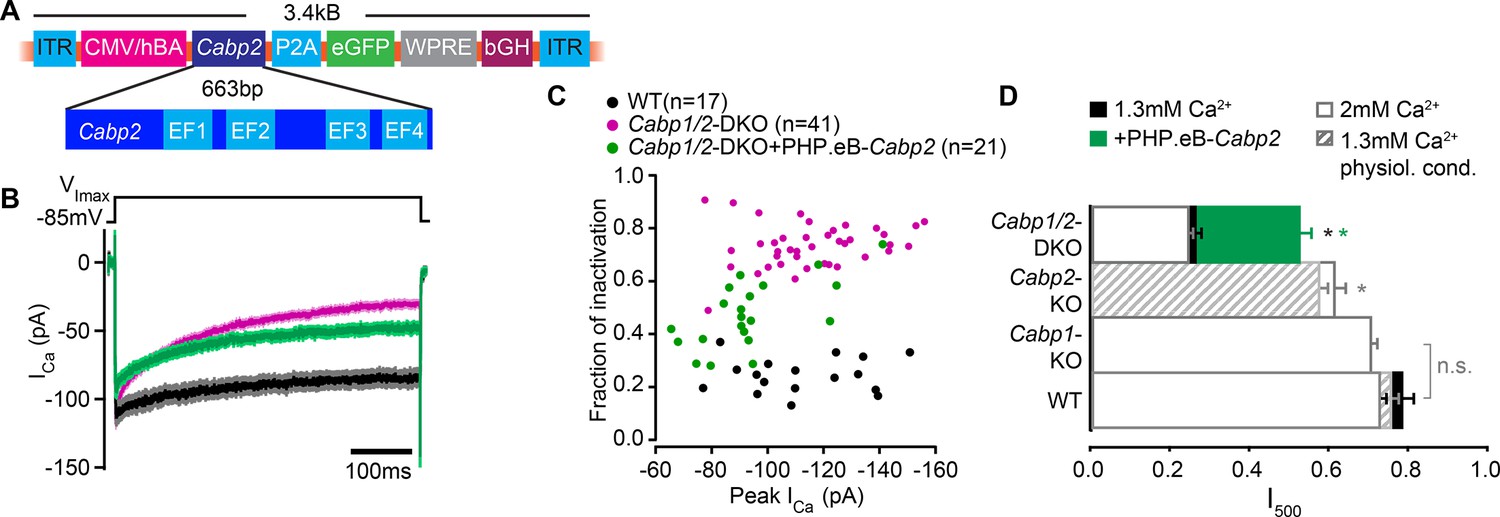
Partial rescue of CaV1.3 channel inactivation properties upon transgenic expression of CaBP2.
(A) The viral vector contains a hCMV/HBA (human cytomegalovirus immediate early enhancer, human beta actin promotor) hybrid promotor to drive strong expression of CaBP2 and a P2A sequence for bicistronic expression of the reporter gene eGFP. The Woodchuck Hepatitis Virus Posttranslational Regulatory Element (WPRE) and the bovine growth hormone (bGH) polyadenylation sequence were included in the construct to enhance transcription and improve the stability of the transcript. (B) Absolute Ca2+ currents after a 500-ms depolarization step to the maximum current potential in the apical inner hair cells (IHCs) of WT and Cabp1/2-DKO animals. (C) Peak calcium current and the corresponding fraction of inactivation after a 500-ms depolarization to the maximum current potential. Note no correlation between peak calcium current and fraction of inactivation, as is typically observed for large enough current amplitudes. (D) The fraction of the remaining Ca2+ current after a 500-ms depolarization step is depicted for different mouse models and conditions. The histogram combines the results of this study (Cabp1/2-DKO; 1.3 mM [Ca2+]: n = 41, 2 mM [Ca2+]: n = 13) with previously published data on CaBP1 (n = 20), CaBP2 acquired at physiological conditions (n = 14) and at room temperature (n = 14). The WT data in 2 mM extracellular [Ca2+] (white bars) combines pooled data from the current study and controls as obtained previously (n = 17). For WT data acquired at RT and 1.3 mM [Ca2+] n = 17 and for physiological conditions n = 8. Note that the recordings from Cabp2-KO animals were acquired at the lower apex to mid-cochlear tonotopic positions as the phenotype in the apex (low-frequency positions investigated otherwise) is mild. Asterisks represent statistical significance as compared to the corresponding controls (the results taken from the afore-mentioned publications and current analysis).
Figure 2
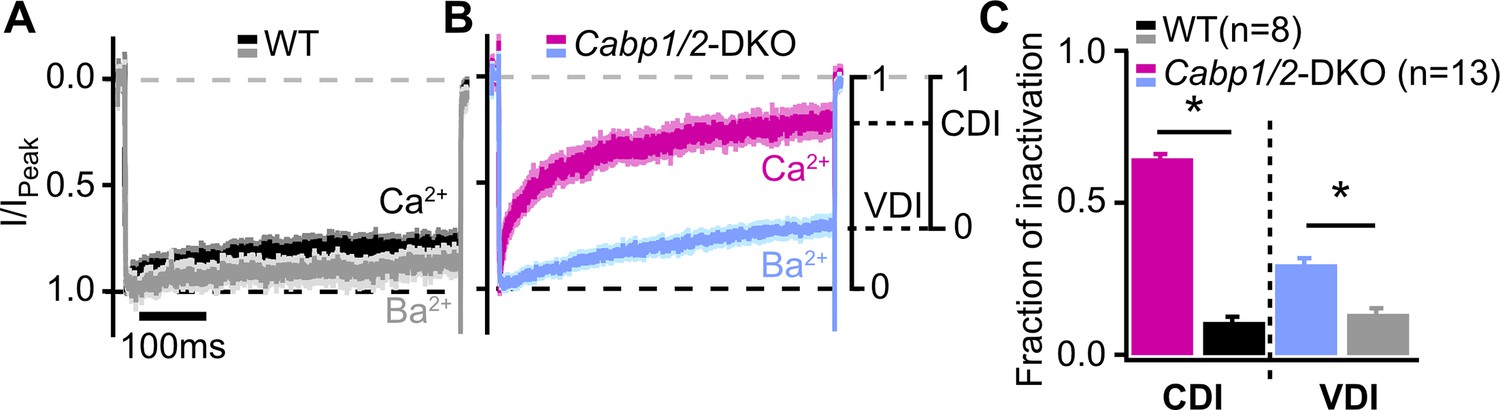
Voltage- and Ca2+-dependent inactivation (VDI and CDI) are enhanced after deletion of Cabp1 and Cabp2.
(A, B) Peak normalized Ca2+ and Ba2+ currents in WT and CaBP1/2-deficient inner hair cells (IHCs) recorded in the extracellular solution containing 2 mM of the respective divalent cation. The two types of inactivation were calculated as depicted. (C) VDI and CDI were both significantly enhanced in the IHCs of Cabp1/2-DKO animals (asterisks; Student’s t-test, p < 0.0001).
Figure 3
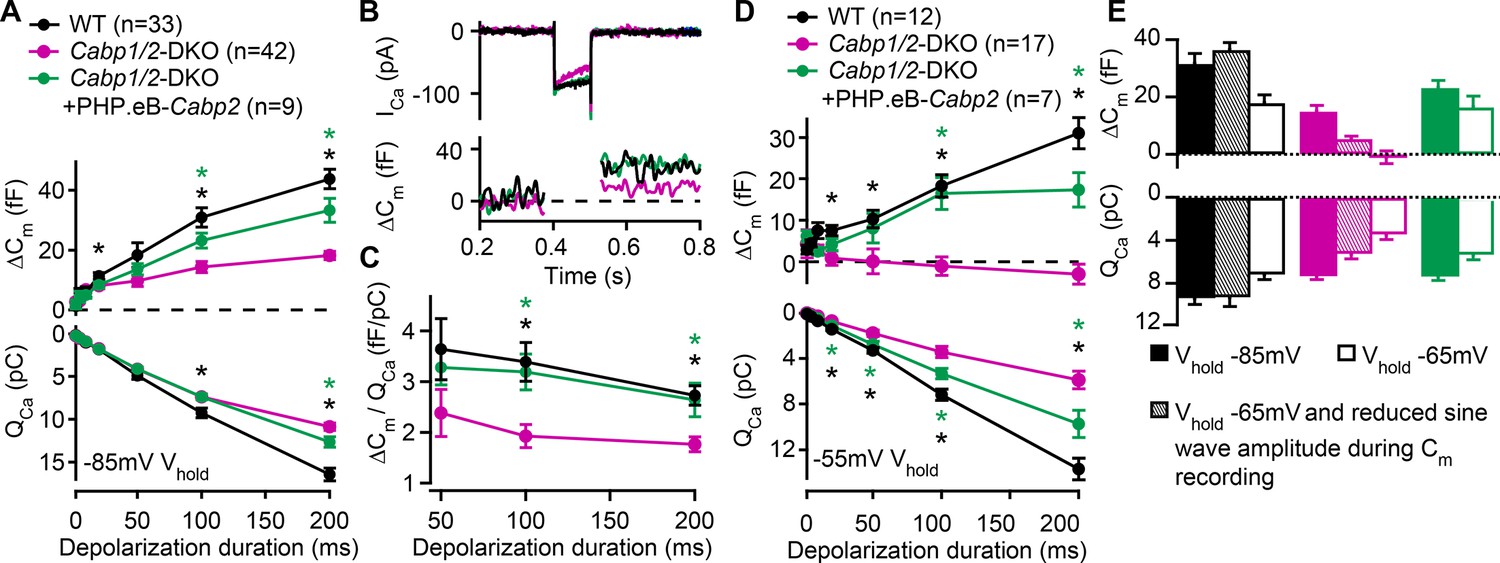
Reduced sustained component of exocytosis and calcium charge transfer (QCa) can be partially rescued by Cabp2-transgene expression.
(A) Capacitance increments with the corresponding QCa were probed by different depolarization durations from a holding potential of –85 mV (unpaired t-tests with Welch correction). CaBP1/2-deficient inner hair cells (IHCs) showed significant impairment of the sustained exocytosis (p < 0.05 for 20 ms, and <0.001 for 100- and 200-ms step, respectively) and reduced cumulative Ca2+ influx (p < 0.005 for the longest two pulses) as compared to WT controls (black asterisks). AAV-mediated delivery of Cabp2 improved IHC synaptic function as compared to non-injected Cabp1/2-DKO controls (p < 0.01 for ΔCm upon 100- and 200-ms step, and p < 0.05 for QCa upon 200-ms step; green asterisks). (B) Representative Ca2+-current traces and corresponding membrane capacitance changes upon 100-ms long depolarization steps to the peak Ca2+-current potential. (C) Note a reduced efficiency of Ca2+-dependent exocytosis (p < 0.005 for the two longest test pulses; black asterisks), which can be efficiently rescued by intracochlear delivery of PHP.eB-Cabp2 (p < 0.01 and 0.05 for 100- and 200-ms pulse, respectively; green asterisks). (D) Capacitance measurements at a holding potential of –55 mV reveal an aggravation of the phenotype by additional activation of calcium channels between the test pulses (p < 0.01 for 50 ms, and p < 0.005 for 20-, 100-, and 200-ms pulse) and a further discrepancy between the QCa of WT and CaBP1/2-deficient IHCs (2–10 ms: p < 0.05; 20–200 ms: p < 0.001). Also in these recording conditions, the IHCs from Cabp2-injected Cabp1/2-DKO animals showed increased QCa (20–200 ms: p < 0.05) and exocytosis (100–200 ms: p < 0.005) as compared to non-injected controls. (E) Capacitance increments and the corresponding QCa upon 100-ms depolarization steps as recorded in different conditions. Note worsening of the phenotype with increasing IHC activation between the test pulses.
-
Figure 3—source data 1
Values obtained from patch-clamp exocytosis experiments that were used in Figure 3.
- https://cdn.elifesciences.org/articles/93646/elife-93646-fig3-data1-v1.xlsx
-
Figure 3—source data 2
Representative traces and values obtained from patch-clamp exocytosis experiments and custom-written macros that were used for analyses in Figure 3.
- https://cdn.elifesciences.org/articles/93646/elife-93646-fig3-data2-v1.zip
Figure 4
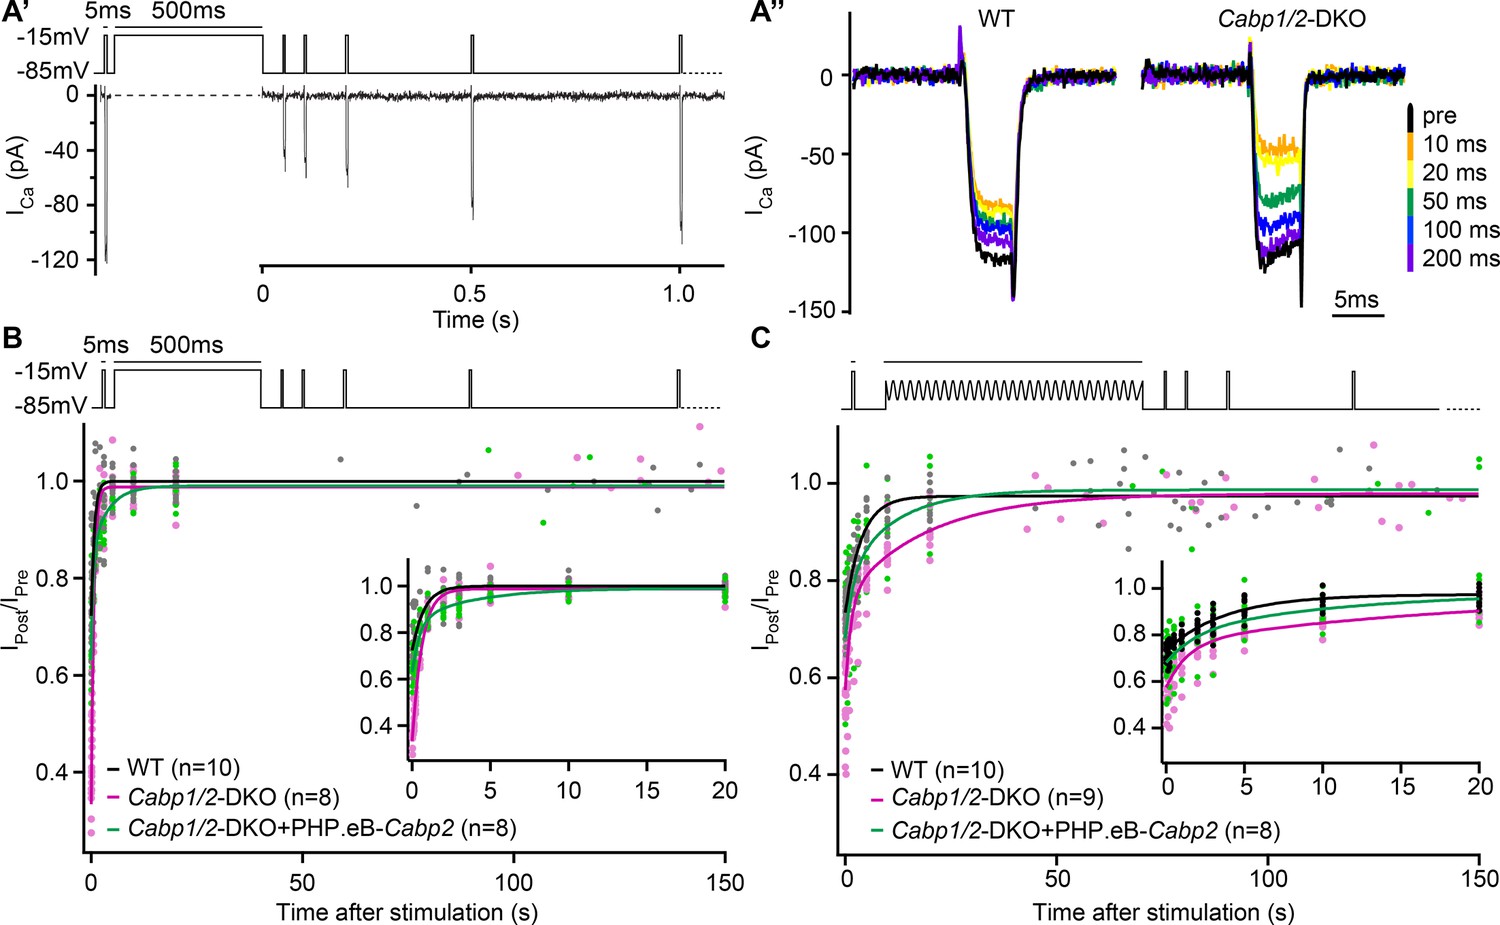
The speed of recovery of Ca2+ currents is affected in CaBP1/2-deficient inner hair cells (IHCs).
(A) Ca2+ currents were probed by 5-ms long depolarization steps to the maximum current potential. An initial test pulse was followed by a conditioning stimulus (a 500-ms depolarization step or a 120-s long sine wave). Subsequently, Ca2+ currents were tested at various time points to assess the recovery of Ca2+-current amplitudes. (A') Example Ca2+-current recording using a 500-ms long depolarization step as a conditioning stimulus. (A'') Representative Ca2+-current traces in WT and CaBP1/2-deficient IHCs at different time points after a 500-ms long conditioning stimulus. Ca2+-current amplitudes normalized to the amplitude of the pre-conditioning test pulse up to 150 s after a 500-ms depolarization step (B) or a 2-min long sine wave stimulus (C). The inserts show the initial 20 s after the conditioning stimulus. The data were fitted by a single or double exponential function (fit parameters in Table 1). Note stronger inactivation in the Cabp1/2-DKO IHCs and delayed recovery of Ca2+ currents after the presentation of a long sine wave and a partial recovery upon viral gene transfer of Cabp2. Recovery upon a 500-ms pulse compared to the 2-min long sine wave stimulus was much faster. Surprisingly, in these conditions recovery of calcium currents was slowest in hair cells with virus-mediated re-expression of CaBP2.
-
Figure 4—source data 1
Traces and values obtained from patch-clamp recovery experiments and custom-written macros that were used for analyses in Figure 4.
- https://cdn.elifesciences.org/articles/93646/elife-93646-fig4-data1-v1.zip
Figure 5
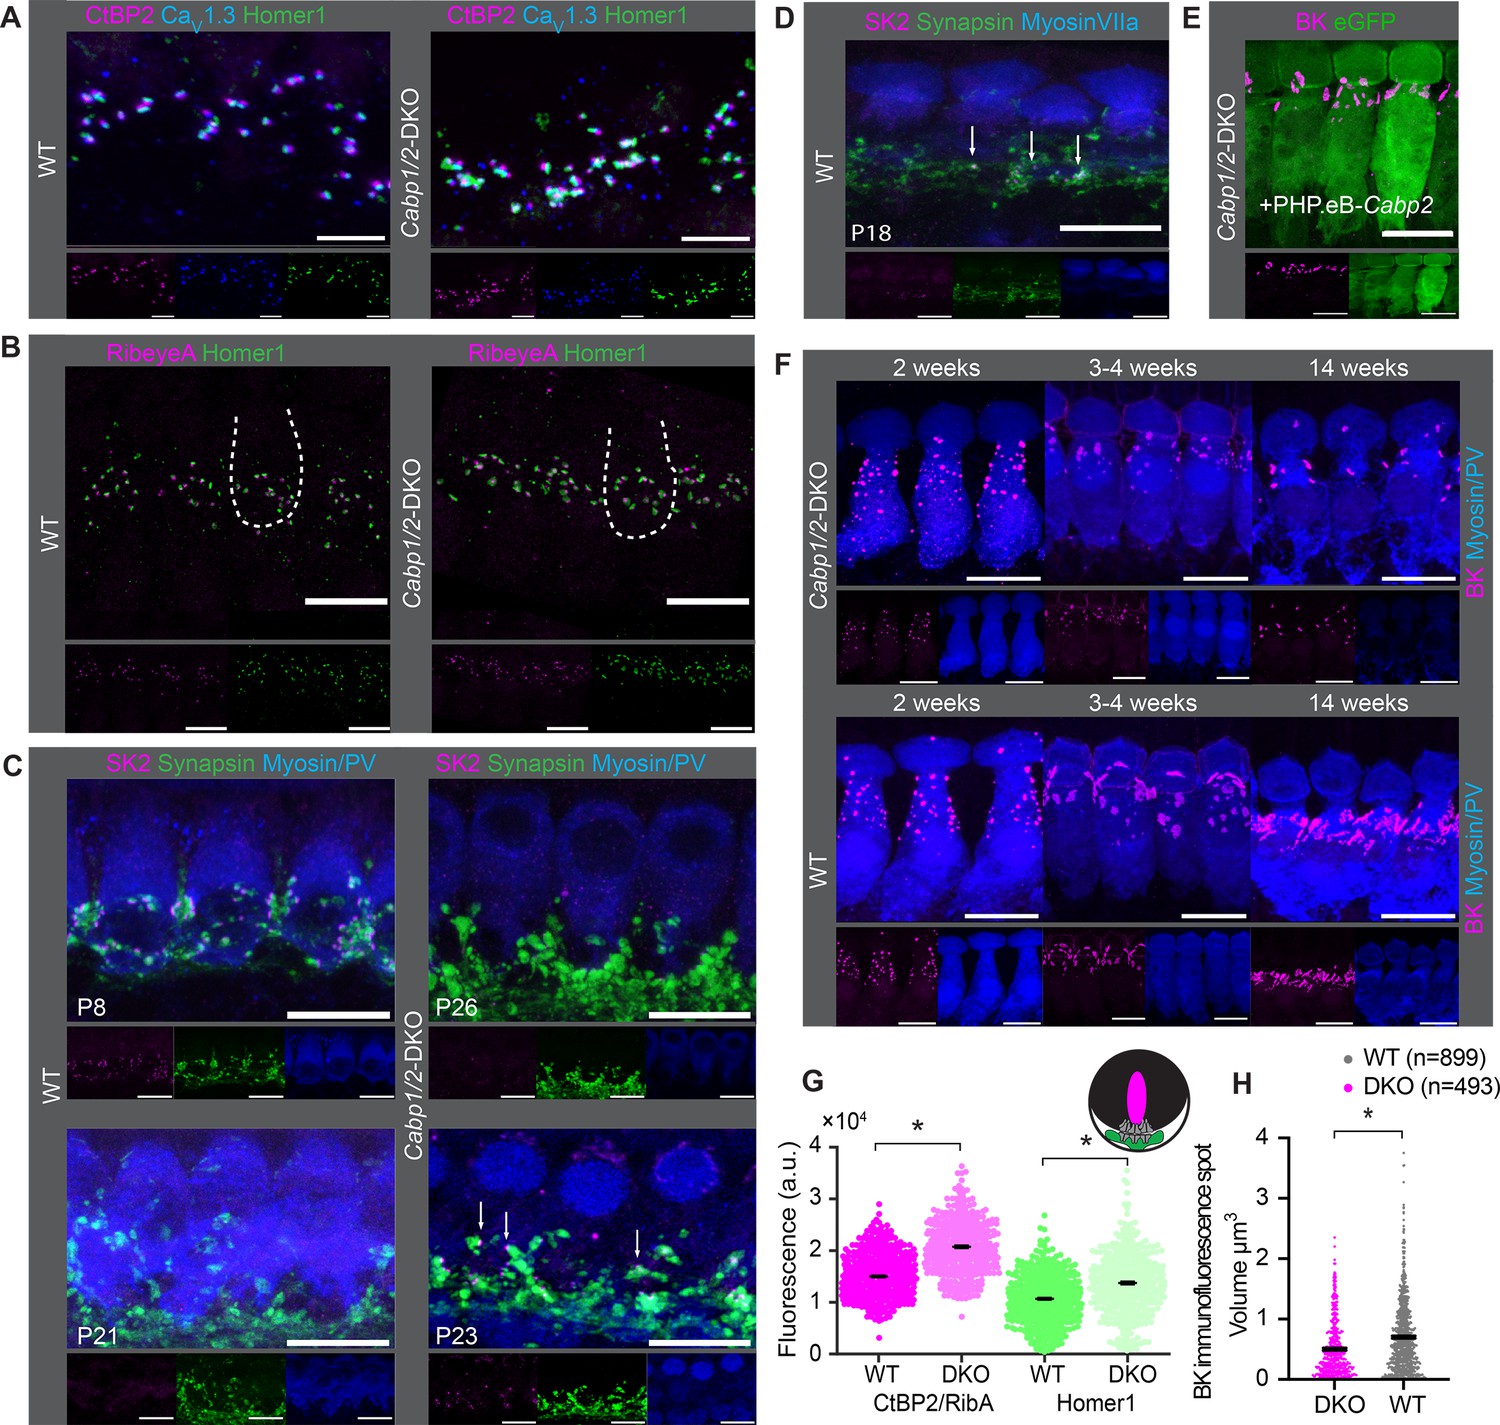
Comparable synapse density with changed morphology in Cabp1/2-DKO inner hair cells (IHCs).
(A) CaV1.3-immunofluorescence appeared normal in Cabp1/2-DKO-mice. Scale bars: 5 µm. (B) Ribbon synapse immunostainings using RibeyeA as a presynaptic and Homer1 as a postsynaptic marker. Ribbon synapses were identified as juxtaposed pre- (RibeyeA/CtBP2) and postsynaptic (Homer1 or, in some organs, GluA3) immunofluorescent spots. (C) SK2-immunofluorescence was absent from the majority of IHCs in 3-week-old animals, but prominent in immature cochleae of 1-week-old animals and together with synapsin 1 labeled direct synaptic contacts from the efferent fibers to the IHCs. Occasionally, however rarely, isolated SK2 immunofluorescent spots were still detected in close proximity to the synapsin marker in the IHCs of 3-week-old DKO animals (arrows). (D) Expression of SK2 beyond the second postnatal week was also observed in some WT IHCs (arrows). (E, F) BK clusters at 3 weeks of age appeared smaller in the non-treated animals, and less so in the ears of PHP.eB-Cabp2-injected Cabp1/2-DKO animals. This difference became even stronger at 14 weeks of age. Scale bars are 10 µm if not stated otherwise. Note that myosin VIIa or parvalbumin-alpha (PV) were used as IHC markers. (G) A significantly higher immunofluorescence intensity was observed for pre- (RibeyeA or CtBP2) and postsynaptic (Homer1) markers in Cabp1/2-DKO mice (analysis of 614 and 441 immunospots from WT and Cabp1/2-DKO organs of Corti, respectively; N = 5 for both genotypes; asterisks; Wilcoxon rank-sum test, p < 0.005). (H) The volume of BK-channel immunofluorescent spots around the neck of the IHCs was significantly smaller in DKO IHCs (asterisk, Student’s t-test p < 0.0001, N = 6 organs per genotype).
-
Figure 5—source data 1
Values obtained from inner hair cell (IHC) ribbon synapse images that were used for analyses in Figure 5G.
- https://cdn.elifesciences.org/articles/93646/elife-93646-fig5-data1-v1.xlsx
-
Figure 5—source data 2
Values obtained from inner hair cell (IHC) BK channel images that were used for analyses in Figure 5H.
- https://cdn.elifesciences.org/articles/93646/elife-93646-fig5-data2-v1.xlsx
Figure 6 with 2 supplements
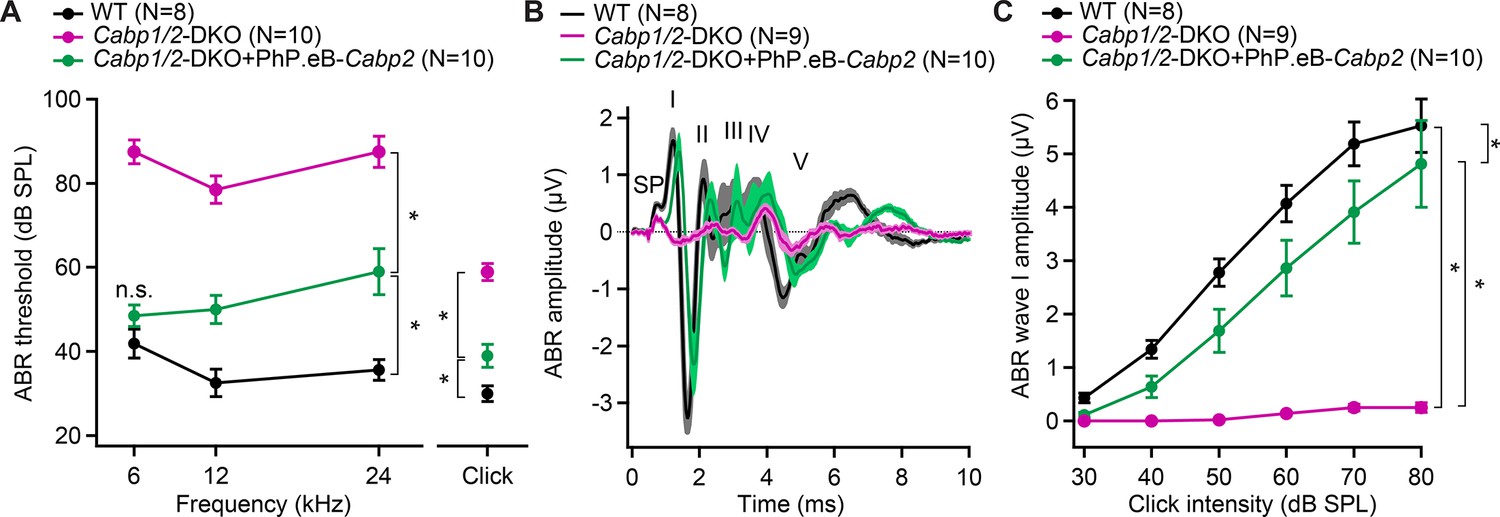
AAV-mediated transgene-expression of Cabp2 ameliorates hearing loss and recovers auditory brainstem response (ABR) amplitude responses in Cabp1/2-DKO mice.
(A) Significant improvement of ABR thresholds in the injected ears of 3- to 4-week-old Cabp1/2-DKO animals for all tone burst frequencies tested as well as 20-Hz-click stimulus (asterisks, see Table in Supplementary file 1 for the p values). (B) Average click-evoked responses to an 80-dB 20-Hz-click stimulus. (C) A strong recovery of the amplitude of the ABR wave I (asterisks, Tukey’s multicomparison test; p ≤ 0.0001 for DKO vs WT or vs injected DKO) upon Cabp2-transgene expression.
-
Figure 6—source data 1
Values obtained from auditory brainstem response (ABR) recordings that were used for analyses in Figure 6A–C, Figure 6—figure supplement 1A, B, and Figure 6—figure supplement 2C, D.
- https://cdn.elifesciences.org/articles/93646/elife-93646-fig6-data1-v1.xls
Figure 6—figure supplement 1
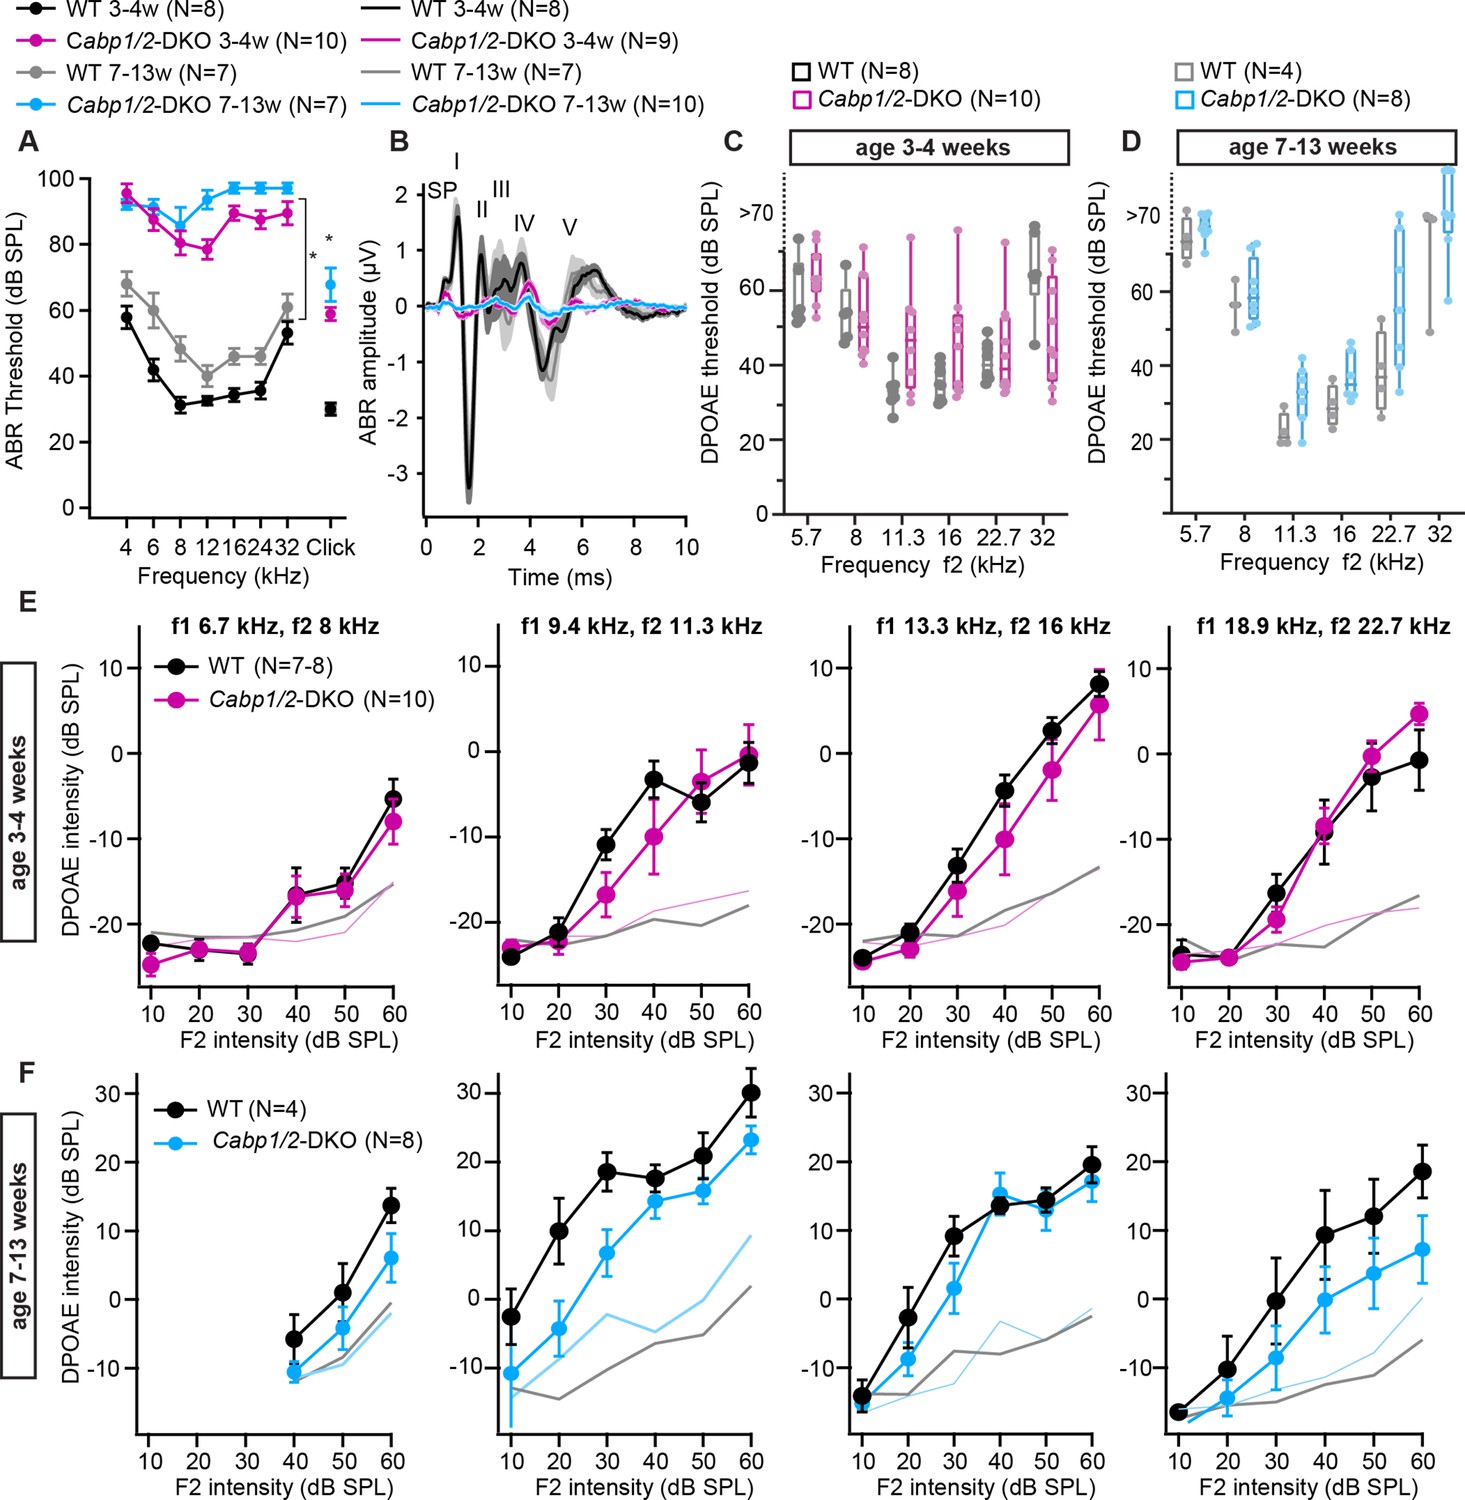
Auditory brainstem response (ABR) amplitudes are strongly decreased while distortion product otoacoustic emission (DPOAE) are mostly preserved in the Cabp1/2-DKO animals.
(A) ABR thresholds to tone burst and click stimulation show an age-progressive pantonal severe hearing loss in Cabp1/2-DKO mice (asterisks: Šidak’s multicomparison tests for tone burst, Student’s t tests for clicks; p ≤ 0.0001). When thresholds exceeded 90 dB for the tone burst stimulation, they were assigned a value of 100 dB for calculation of the mean and SEM. (B) Grand averages of ABR waveforms to 80 dB click stimuli presented at a rate of 20 Hz show a strong decrease in ABR amplitudes in Cabp1/2-DKO mice at 3–4 weeks of age. At age 7–13 weeks, there are only minimal responses remaining, which are dominated by a delayed wave IV. The ABR wave peaks are labeled by roman numbers. Wave I is preceded by the summating potential (SP). (C, D) An increase in DPOAE thresholds was observed in some Cabp1/2-DKO mice, and was significant at the age of 7–13 weeks (p < 0.002, two-way ANOVA). However, note that even at 7–13 weeks of age some Cabp1/2-DKO mutants retained seemingly normal DPOAE thresholds. DPOAE thresholds exceeding 70 dB were extrapolated from amplitude growth functions. DPOAE amplitude growth functions for different primary tone frequency combinations at the age of 3–4 weeks (E) and 7–13 weeks (F). The two datasets (E, F) were acquired at different setups calibrated with different artificial mouse ear couplers, resulting in different absolute amplitudes. Light colored lines depict average noise floor level.
-
Figure 6—figure supplement 1—source code 1
Matlab codes used to analyse DPOAE data.
- https://cdn.elifesciences.org/articles/93646/elife-93646-fig6-figsupp1-code1-v1.zip
-
Figure 6—figure supplement 1—source data 1
Values obtained from DPOAE recordings that were used for analyses in Figure 6—figure supplement 1C and E.
- https://cdn.elifesciences.org/articles/93646/elife-93646-fig6-figsupp1-data1-v1.xlsx
-
Figure 6—figure supplement 1—source data 2
Values obtained from DPOAE recordings that were used for analyses in Figure 6—figure supplement 1D and F.
- https://cdn.elifesciences.org/articles/93646/elife-93646-fig6-figsupp1-data2-v1.xlsx
Figure 6—figure supplement 2
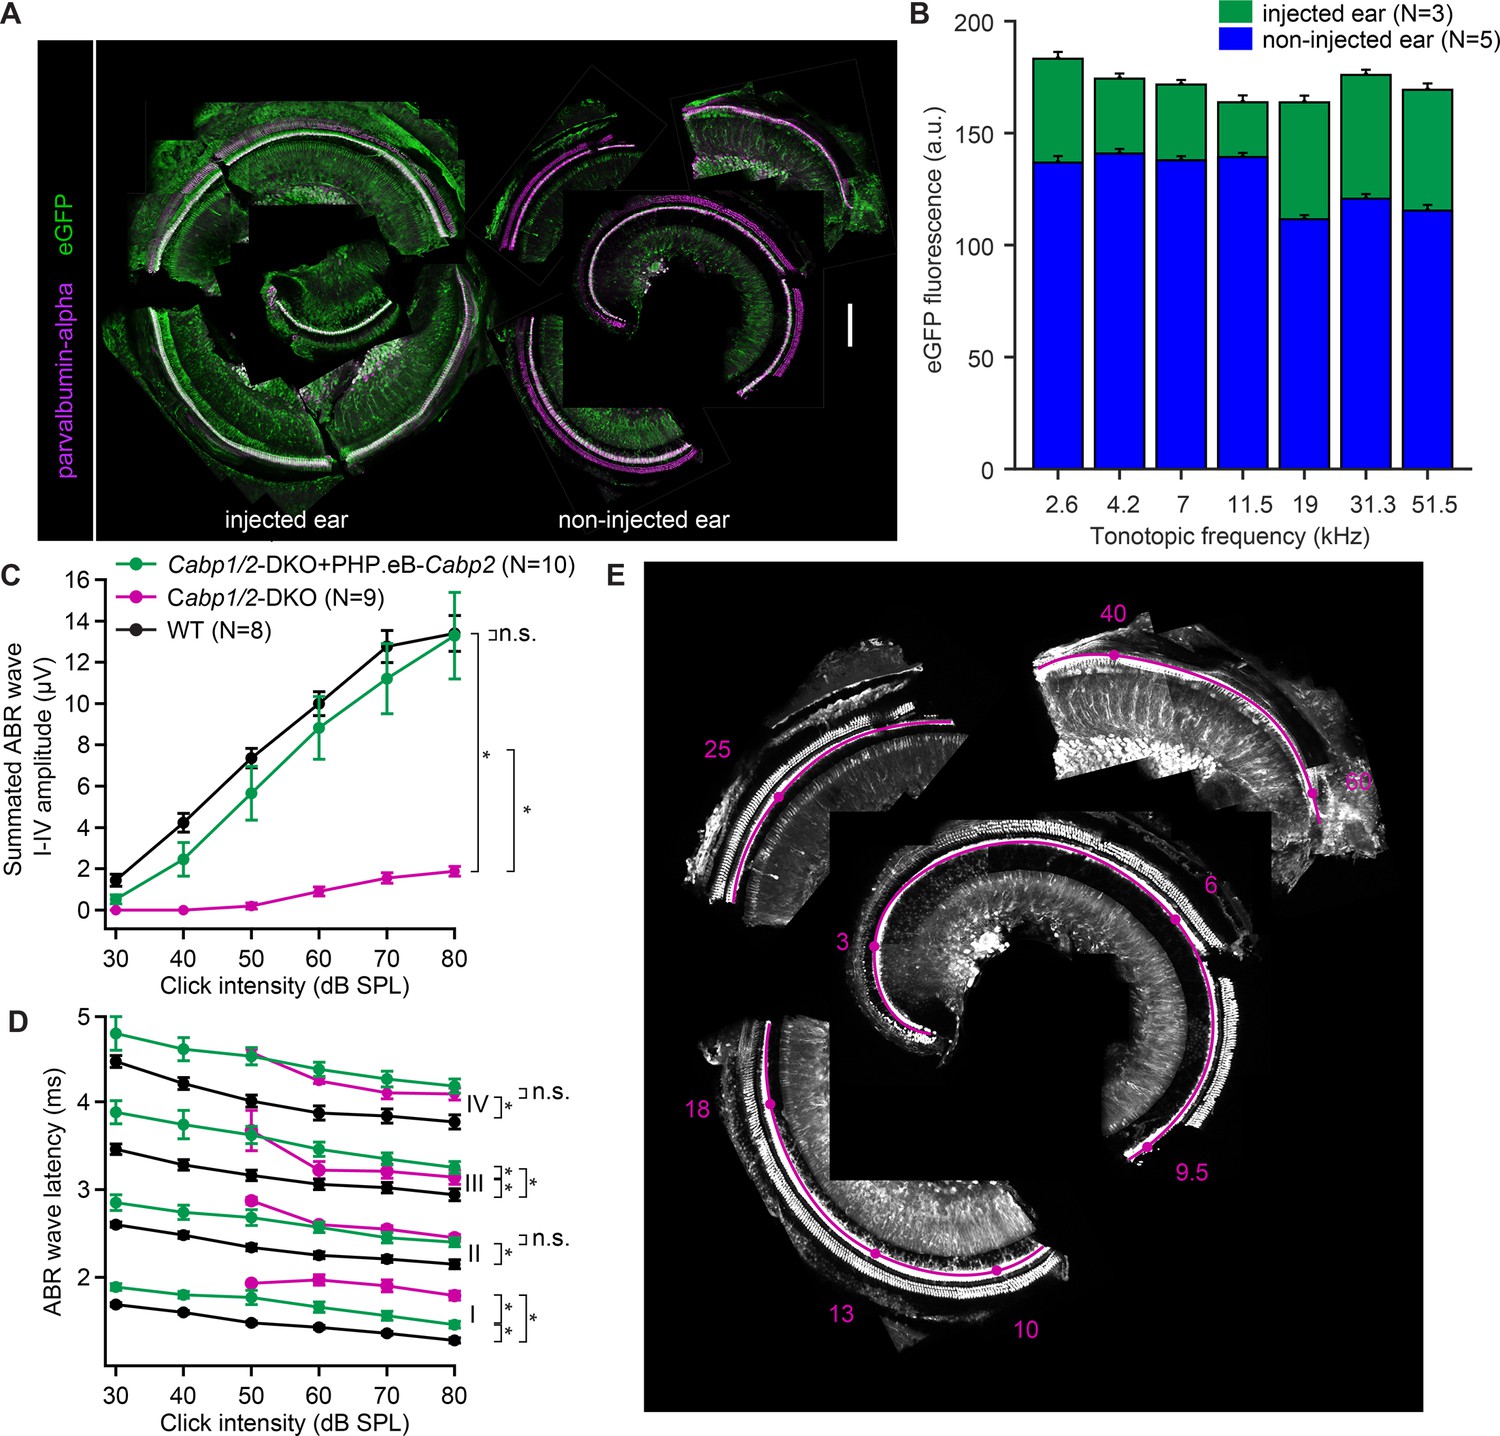
Efficient transgene expression of Cabp2 recovers cumulative auditory brainstem response (ABR) amplitude responses and ABR wave I latencies in Cabp1/2-DKO mice.
(A) Representative images of the organ of Corti of the cochlea immunostained with antibodies against parvalbumin-alpha as a hair cell marker and eGFP. Note a strong eGFP immunofluorescence detected along the entire tonotopic length of the injected and, to a lesser degree, contralateral non-injected cochlea. Scale bar: 200 µm. (B) eGFP immunofluorescence at each tonotopic position in the injected and contralateral non-injected ears. In both ears, but particularly on the contralateral side, lower eGFP expression in inner hair cells (IHCs) was observed toward the cochlear base. (C) A strong recovery of the summated ABR waves I–IV (asterisks, Tukey’s multicomparison test; p < 0.0001 for DKO vs WT or vs injected DKO) upon Cabp2-transgene expression. (D) ABR waves in the Cabp1/2-DKO animals are delayed. Intracochlear injection of PHP.eB-Cabp2 leads to partial recovery of the wave I latency (asterisks demonstrate significant differences, for statistical comparisons, see Table in Supplementary file 1). (E) A representative image of a dissected organ of Corti and the corresponding frequency map (tonotopic frequencies in kHz, magenta).
-
Figure 6—figure supplement 2—source code 1
Matlab source code for GFP fluorescence analysis.
- https://cdn.elifesciences.org/articles/93646/elife-93646-fig6-figsupp2-code1-v1.zip
-
Figure 6—figure supplement 2—source data 1
Values obtained from eGFP immunostainings that were used for analyses in Figure 6—figure supplement 2B.
- https://cdn.elifesciences.org/articles/93646/elife-93646-fig6-figsupp2-data1-v1.zip
Figure 7
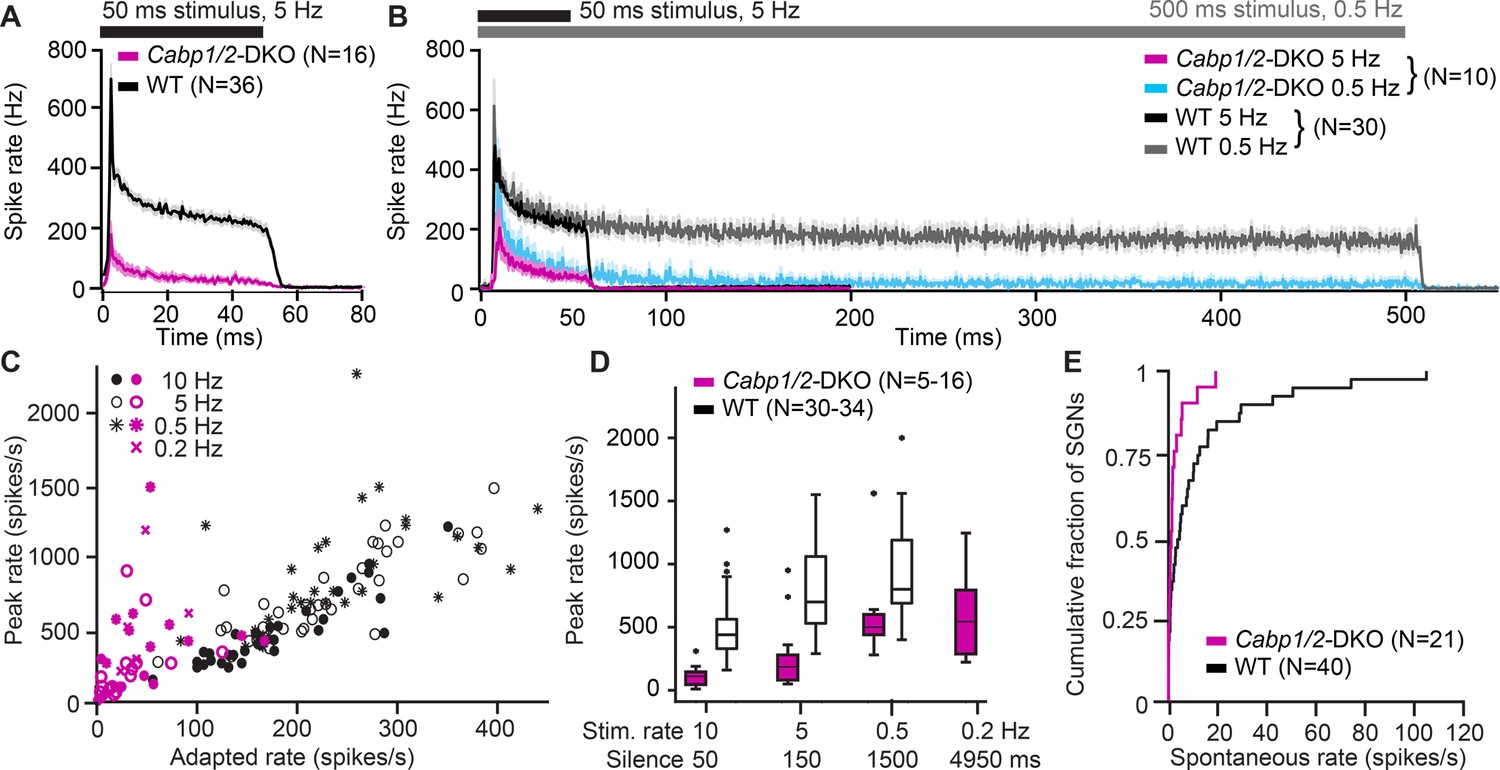
Impaired sound encoding in Cabp1/2-DKO mice.
Single neuron responses to sound stimulation in vivo in the region of the auditory nerve of Cabp1/2-DKO mice were extremely scarce. (A) WT poststimulus time histograms of spiral ganglion neurons (SGNs) to 50 ms suprathreshold tone or noise burst stimuli presented at a rate of 5 Hz showed a very high sound onset rate gradually adapting to a sustained rate persisting throughout the stimulus duration. Spike rates were much lower in the mutants. (B) Applying a lower stimulus rate of 0.5 Hz partially restored sound onset responses in Cabp1/2-DKOs, highlighting the enhanced strength of adaptation. WT and mutant neurons sustained their adapted spiking response throughout the longer 500 ms stimulus used in these recordings. For direct comparison, the average 5 Hz poststimulus time histograms from the same neurons are shown. (C) Correlations of peak and adapted rates for different stimulus rates. (D) Peak rates for different stimulus rates/interstimulus intervals in WT SGNs strongly increase between 10 and 5 Hz, while in DKOs a longer period of silence is required to observe such difference. (E) Cabp1/2-DKO neurons had lower spontaneous spike rates than WT SGNs.
-
Figure 7—source code 1
Matlab source codes for analysis of SU data.
- https://cdn.elifesciences.org/articles/93646/elife-93646-fig7-code1-v1.zip
Tables
Table 1
Ca2+-current recovery fit parameters.
The data was fitted with the single or the double exponential with the following equations: y(t) = y0 − A1 × exp(−(t/τ1)) and y(t) = y0 − A1 × exp(−(t/τ1)) − A2 × exp(−(t/τ2)), where y(t) represents the peak current amplitude at the time t after the end of conditioning pulse (either 500-ms depolarization or 2-min sine wave) given in % of the initial pre-conditioning peak current amplitude (100 × Ipost/Ipre). While current recovery upon 500-ms depolarization in the inner hair cells (IHCs) of WT and DKO animals could be well fitted by a single exponential, the data obtained in the injected DKO animals required a double exponential fitting. Upon 2-min sine wave, the current recovery in DKO IHCs (both, injected and non-injected group) also required fitting with a double exponential function.
| 500-ms depolarization | 2-min sine wave | |||||||||
|---|---|---|---|---|---|---|---|---|---|---|
| Test group | A1 (%) | τ1 (s) | A2 (%) | τ2 (s) | y0 (%) | A1 (%) | τ1 (s) | A2 (%) | τ2 (s) | y0 (%) |
| DKO | 65 | 0.62 | - | - | 99 | 19 | 1.36 | 21 | 19.41 | 98 |
| WT | 28 | 0.75 | - | - | 100 | 24 | 3.83 | - | - | 97 |
| DKO + PHP.eB-Cabp2 | 22 | 0.47 | 14 | 3.87 | 99 | 13 | 1.88 | 18 | 11.56 | 99 |
Key resources table
| Reagent type (species) or resource | Designation | Source or reference | Identifiers | Additional information |
|---|---|---|---|---|
| Strain, strain background (Mus musculus) | Cabp1-KO | Kim et al., 2014 | RRID:MGI:5780462 | A KO of Cabp1 used for cross-breeding to obtain Cabp1/2-DKO animals |
| Strain, strain background (Mus musculus) | Cabp2LacZ/LacZ | Picher, 2017 | RRID:MGI:6155766 | A KO of Cabp2 used for cross-breeding to obtain Cabp1/2-DKO animals |
| Other | PHP.eB viral capsid | Addgene plasmid | #103005 | Gift of V. Gradinaru |
| Recombinant DNA reagent | Encoding CaBP2-L | NCBI Reference Sequence | NP_038906.2 | Long isoform of mouse CaBP2 |
| Antibody | anti-Myosin VIIa (Mouse monoclonal) | Santa Cruz Biotechnology | Cat#: sc-74516, RRID:AB_2148626 | 1:200 |
| Antibody | anti-Kca1.1 (Rabbit polyclonal) | Alomone Labs | Cat#: APC-021, RRID:AB_2313725 | 1:200 |
| Antibody | anti-SK2 (Rabbit polyclonal) | Sigma-Aldrich | Cat#: P0483, RRID:AB_260860 | 1:200 |
| Antibody | anti-CaV1.3 (Rabbit polyclonal) | Alomone Labs | Cat#: ACC-005 RRID:AB_2039775 | 1:100 |
| Antibody | anti-CtBP2 (Mouse monoclonal) | BD Biosciences | Cat#: 612044, RRID:AB_399431 | 1:200 |
| Antibody | anti-Homer1 (Chicken polyclonal) | Synaptic Systems | Cat#: 160006, RRID:AB_2631222 | 1:200 |
| Antibody | anti-Synapsin1/2 (Guinea pig polyclonal) | Synaptic Systems | Cat#: 106004, RRID:AB_1106784 | 1:200 |
| Antibody | anti-RibeyeA (Rabbit polyclonal) | Synaptic Systems | Cat#: 192103, RRID:AB_2086775 | 1:200 |
| Antibody | anti-parvalbumin-α (Guinea pig polyclonal) | Synaptic Systems | Cat#: 195004, RRID:AB_2156476 | 1:200 |
| Antibody | anti-GluA3 (Goat polyclonal) | Santa Cruz Biotechnology | Cat#: sc-7612, RRID:AB_2113895 | 1:200 |
| Antibody | anti-GFP (Chicken polyclonal) | Abcam | Cat#: ab13970, RRID:AB_300798 | 1:200 |
| Antibody | anti-chicken Alexa Fluor 488 (Goat polyclonal) | Thermo Fisher Scientific | Cat#: A-11039, RRID:AB_2534096 | 1:200 |
| Antibody | anti-rabbit Alexa Fluor 488 (Goat polyclonal) | Thermo Fisher Scientific | Cat#: A-11008, RRID:AB_143165 | 1:200 |
| Antibody | anti-guinea pig Alexa Fluor 488 (Goat polyclonal) | Thermo Fisher Scientific | Cat#: A-11073, RRID:AB_2534117 | 1:200 |
| Antibody | anti-rabbit Alexa Fluor 568 (Goat polyclonal) | Thermo Fisher Scientific | Cat#: A-11011, RRID:AB_143157 | 1:200 |
| Antibody | anti-chicken Alexa Fluor 568 (Goat polyclonal) | Abcam | Cat#: ab175711, RRID:AB_2827757 | 1:200 |
| Antibody | anti-mouse Alexa Fluor 647 (Goat polyclonal) | Thermo Fisher Scientific | Cat#: A-21236, RRID:AB_2535805 | 1:200 |
| Antibody | anti-mouse Alexa Fluor 633 (Goat polyclonal) | Thermo Fisher Scientific | Cat#: A-21136, RRID:AB_2535775 | 1:200 |
| Antibody | anti-guinea pig Alexa Fluor 633 (Goat polyclonal) | Thermo Fisher Scientific | Cat#: A-21105, RRID:AB_2535757 | 1:200 |
| Antibody | anti-mouse Alexa Fluor 488 (Donkey polyclonal) | Thermo Fisher Scientific | Cat#: A-21202, RRID:AB_141607 | 1:200 |
| Antibody | anti-goat Alexa Fluor 568 (Donkey polyclonal) | Thermo Fisher Scientific | Cat#: A-11057, RRID:AB_2534104 | 1:200 |
| Antibody | anti-rabbit Alexa Fluor 647 (Donkey polyclonal) | Thermo Fisher Scientific | Cat#: A-31573, RRID:AB_2536183 | 1:200 |
| Software, algorithm | Patchers Power Tools | Igor Pro XOP (http://www3.mpibpc.mpg.de/groups/neher/index.php?page=software) | RRID:SCR_001950SCR_001950 | Analysis of patch-clamp data |
| Software, algorithm | ImageJ | http://imagej.nih.gov/ij/ | RRID:SCR_003070 | Image assembly |
| Software, algorithm | Imaris, Bitplane | http://www.bitplane. com/imaris/imaris | RRID:SCR_007370 | Image assembly and analysis |
| Software, algorithm | Microsoft Excel | https://www.microsoft.com/en-gb/ | RRID:SCR_016137 | Data overviews, algorithm |
| Software, algorithm | Fiji | http://fiji.sc | RRID:SCR_002285 | Image assembly |
| Software, algorithm | GraphPad Prism, GraphPad Software | https://graphpad.com | RRID:SCR_002798 | Statistical analyses and graphs |
| Software, algorithm | IgorPro 6, Wavemetrics | http://www.wavemetrics.com/products/igorpro/igorpro.htm | RRID:SCR_000325 | Data analyses, statistical analyses, and graphs |
| Software, algorithm | MATLAB, Mathworks | http://www.mathworks.com/products/matlab/ | RRID:SCR_001622SCR_001622 | Data analyses, statistical analyses, and graphs |
| Software, algorithm | Patchmaster, HEKA, Harvard Bioscience | https://www.heka.com/index.html | - | Data acquisition |
| Software, algorithm | BioSig, TDT | https://www.tdt.com/components/software/ | RRID:SCR_008428 | Data acquisition |
| Software, algorithm | iMSPECTOR, Abberrior Instruments | https://abberior.rocks/superresolution-confocal-systems/software/ | RRID:SCR_015249 | Data acquisition |
Additional files
-
Supplementary file 1
Statistical analysis of ABR thresholds and ABR wave I–V latencies.
The table lists the adjusted p-values of the Tukey’s multicomparisons tests upon one-way (20 Hz clicks) or two-way ANOVA (otherwise) for the ABR thresholds and the click-evoked ABR wave I–V latencies. Very low p-values are represented by asterisks: p < 0.001 (***), p < 0.0001 (****).
- https://cdn.elifesciences.org/articles/93646/elife-93646-supp1-v1.docx
-
MDAR checklist
- https://cdn.elifesciences.org/articles/93646/elife-93646-mdarchecklist1-v1.pdf
Download links
A two-part list of links to download the article, or parts of the article, in various formats.
Downloads (link to download the article as PDF)
Open citations (links to open the citations from this article in various online reference manager services)
Cite this article (links to download the citations from this article in formats compatible with various reference manager tools)
CaBP1 and 2 enable sustained CaV1.3 calcium currents and synaptic transmission in inner hair cells
eLife 13:RP93646.
https://doi.org/10.7554/eLife.93646.3


