Structures of wild-type and a constitutively closed mutant of connexin26 shed light on channel regulation by CO2
- School of Life Sciences, University of Warwick, United Kingdom
- Leicester Institute of Structural and Chemical Biology, Department of Molecular and Cell Biology, University of Leicester, United Kingdom
Figures
Figure 1 with 4 supplements
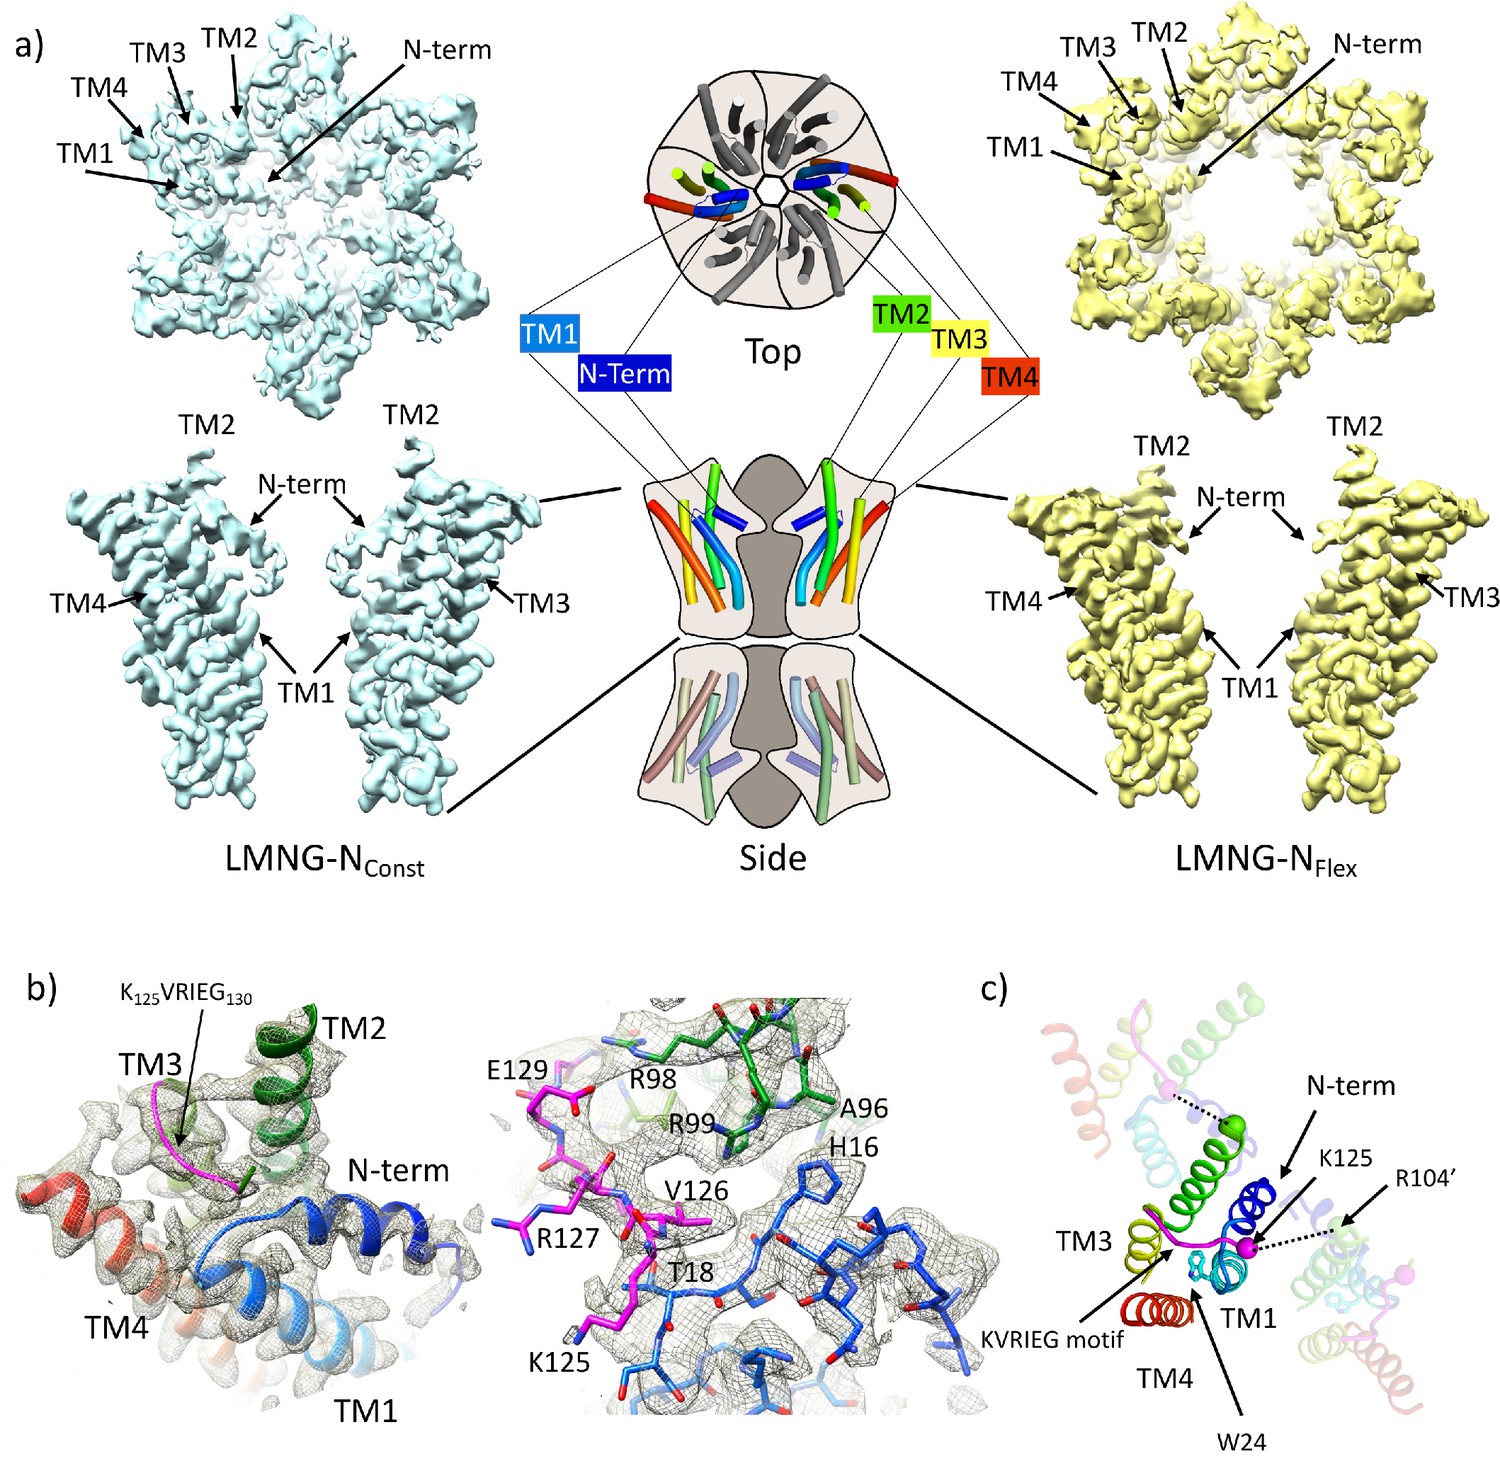
Distinct classes from classification of connexin26 (Cx26) solubilised in lauryl maltose neopentyl glycol (LMNG).
(a) Overall density associated with LMNG-NConst (left) and LMNG-NFlex (right) viewed from the cytoplasmic face (top) and from the side (bottom; for clarity only two subunits are shown). To orientate the reader a schematic of the full connexin gap junction channel (GJC) is shown in the centre. The cartoon showing the N-terminal helix and the transmembrane helices (TMs) has been coloured through the colours of the rainbow with blue at the N-terminus to red at the C-terminus. (b) As (a) focussed on the KVRIEG motif and the link between the N-terminus and TM1. Left: The cartoon has been coloured as in (a) except for the KVRIEG motif, which is shown in magenta. Right: Stick representation with the same colouring showing the interactions between the residues on the link between the N-terminus and TM1 (blue), residues on TM2 (green) and the KVRIEG motif (magenta). (c) Cartoon representation of the cytoplasmic region of the LMNG-NConst structure. The two neighbouring subunits to the central subunit in the figure have been made semi-transparent. The dotted lines show the proximity of K125 of one subunit to R104 of the neighbouring subunit. Trp24 on TM1 is in the region of TM1 that adopts an altered conformation with respect to the previously solved structures of Cx26.
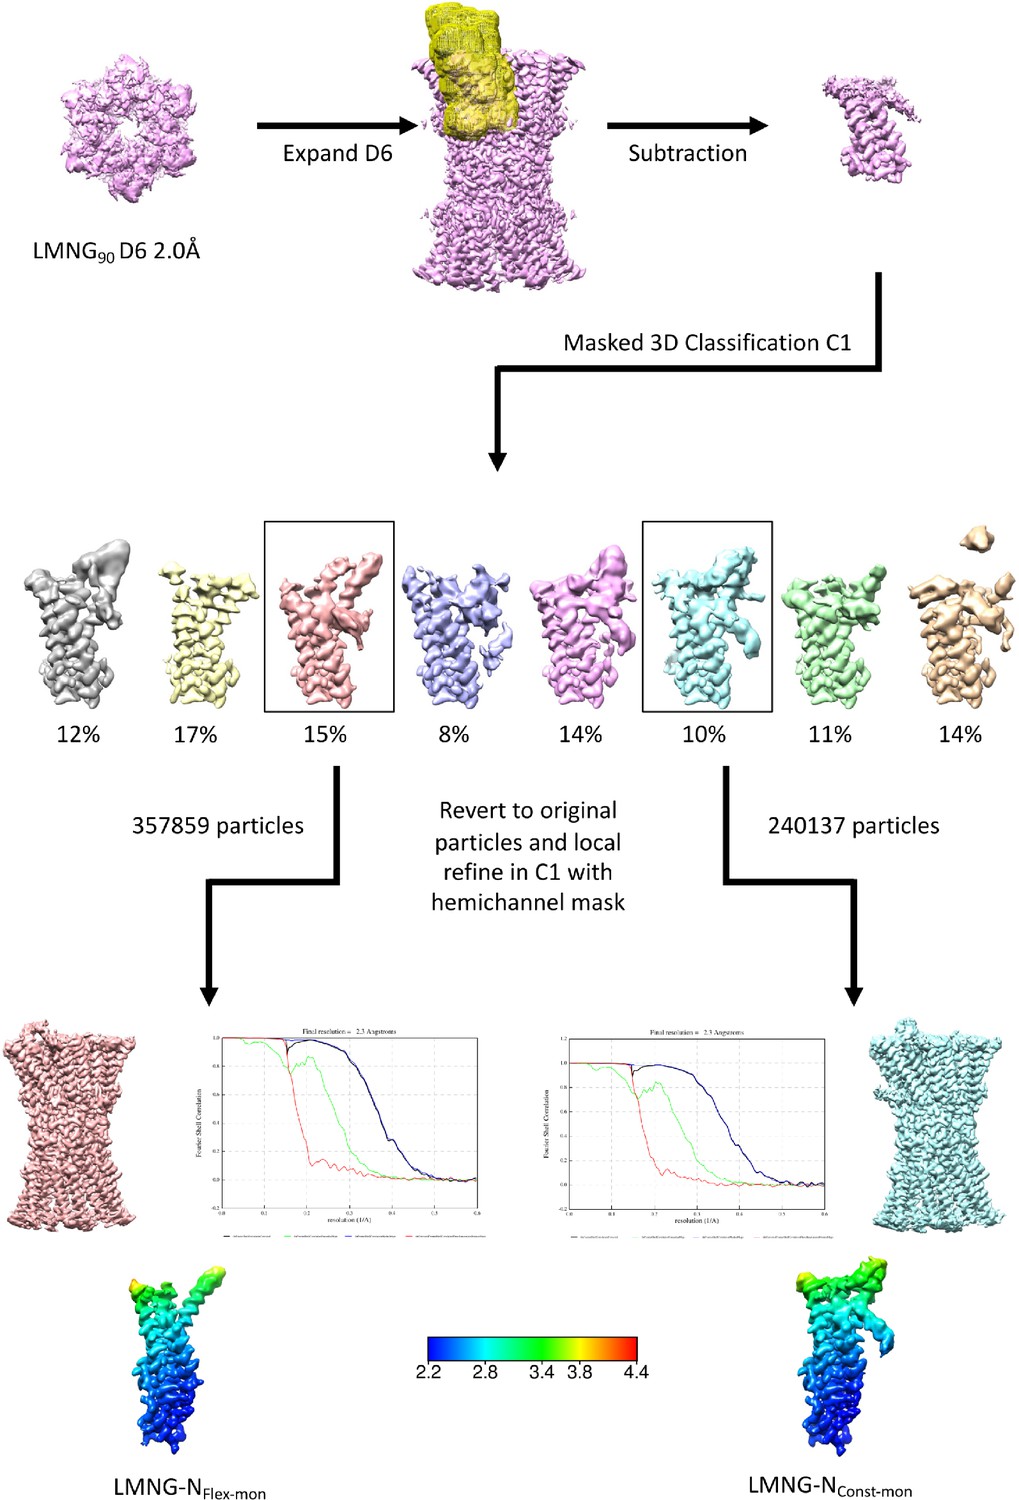
Figure 1—figure supplement 1
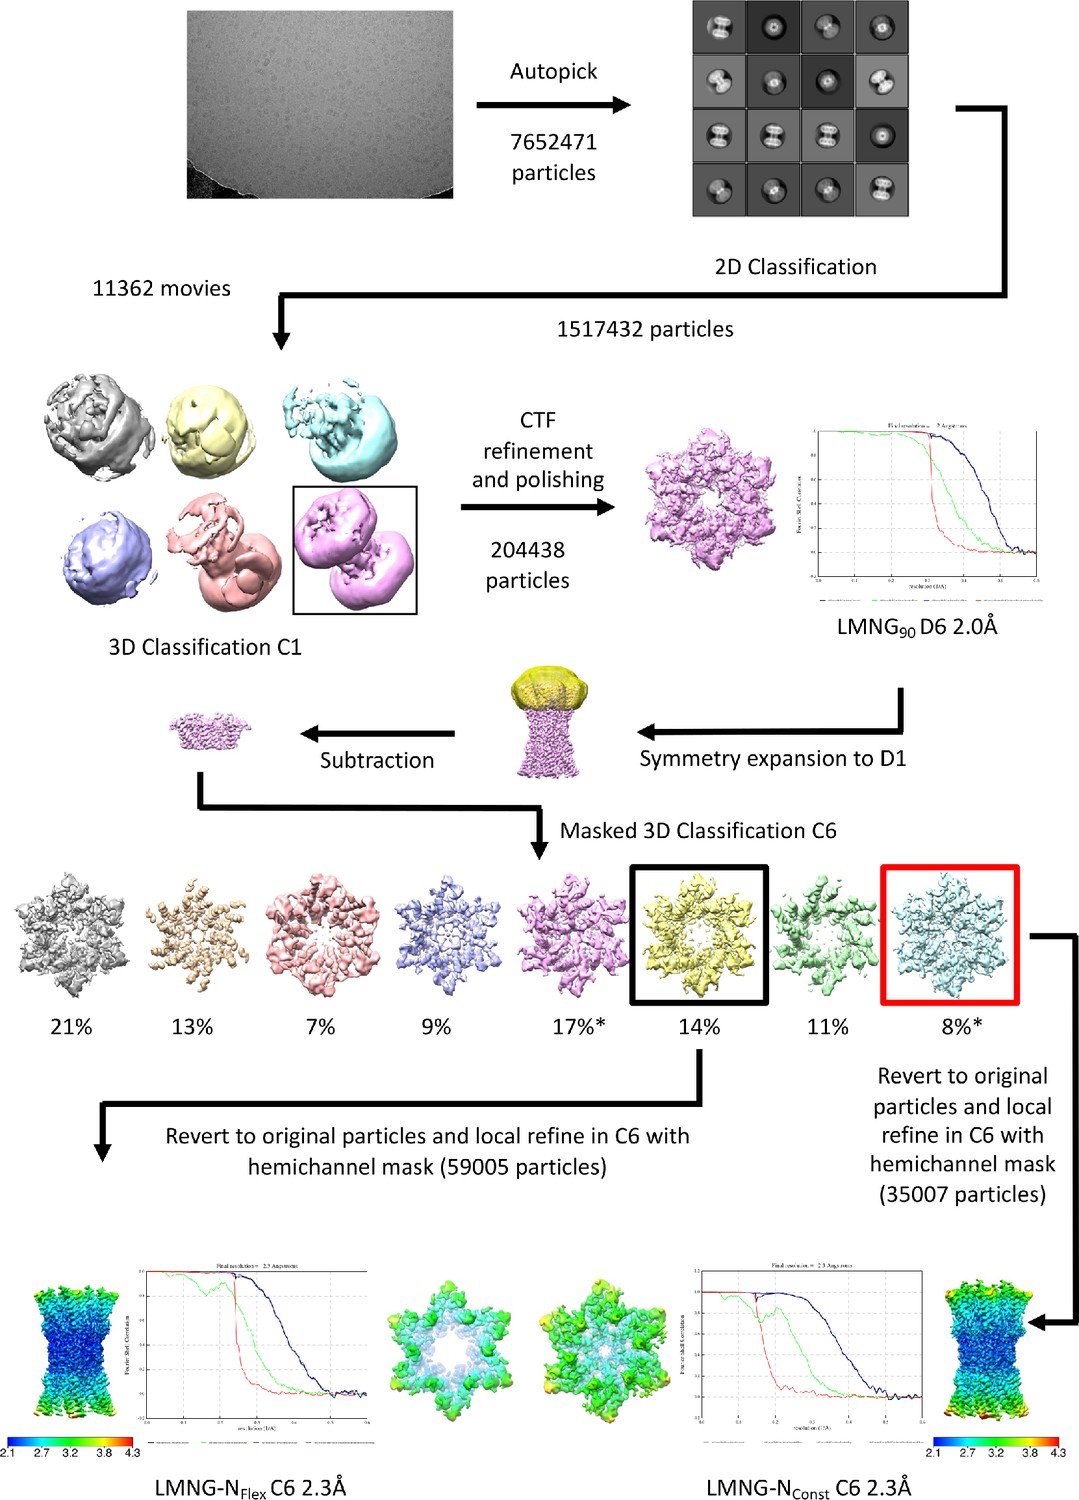
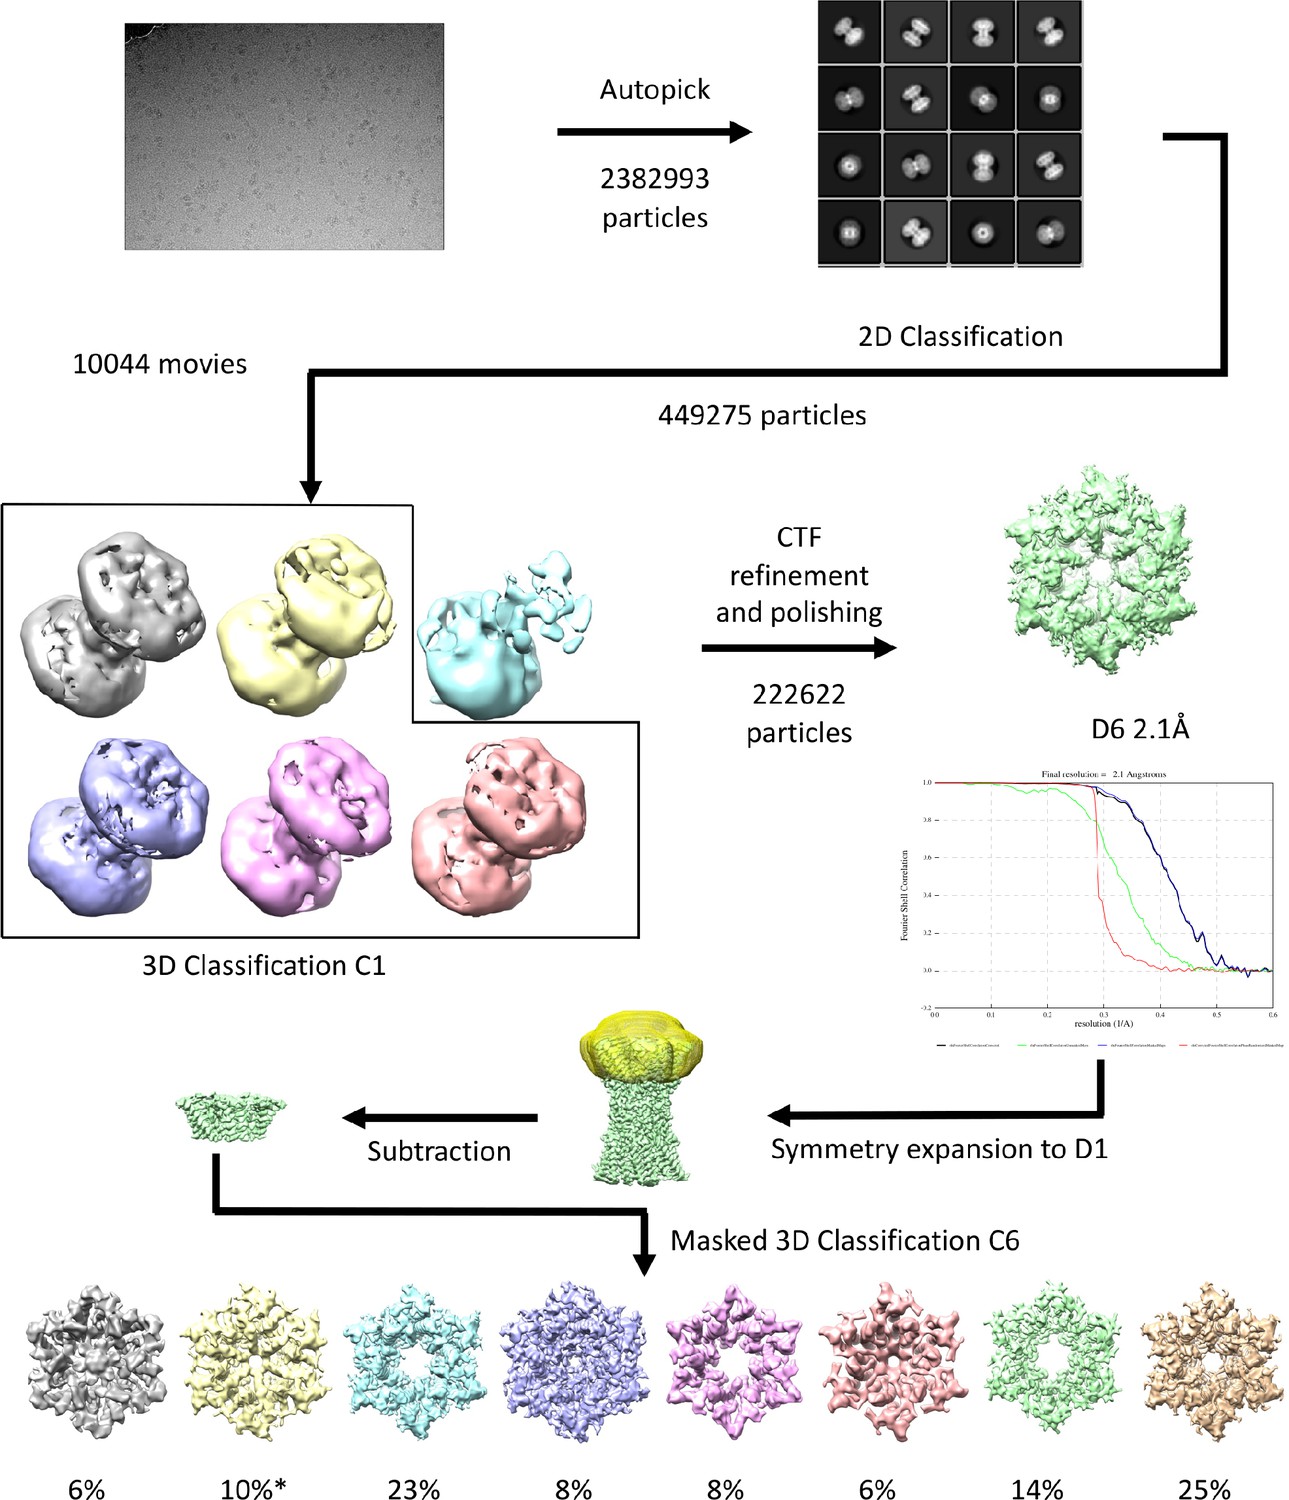
Workflow for initial processing of cryo-EM data for wild-type (WT) sample, solubilised in lauryl maltose neopentyl glycol (LMNG) in CO2/HCO3- buffer.
The star denotes the classifications with the appearance of the NConst conformation that refine to a resolution greater than 4 Å. The maps in the lower panel are coloured according to resolution as estimated in Relion 4.
Figure 1—figure supplement 2
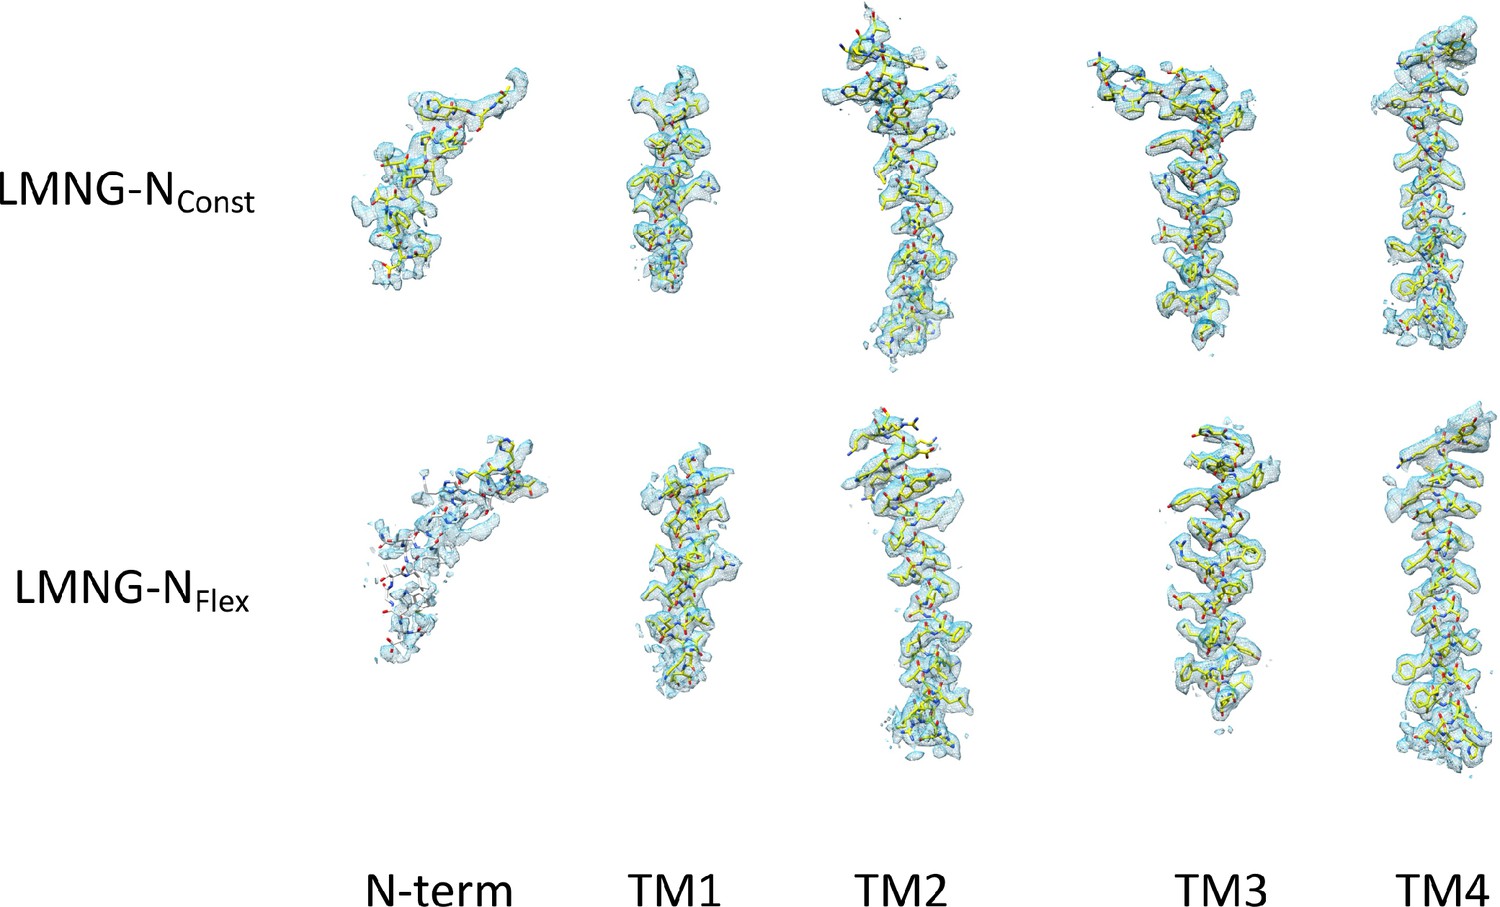
Density for the transmembrane helices and the N-terminal helix associated with each the lauryl maltose neopentyl glycol (LMNG)-NConst and LMNG-NFlex structures.
The residues with white carbon atoms are not included in the final structure.
Figure 1—figure supplement 3
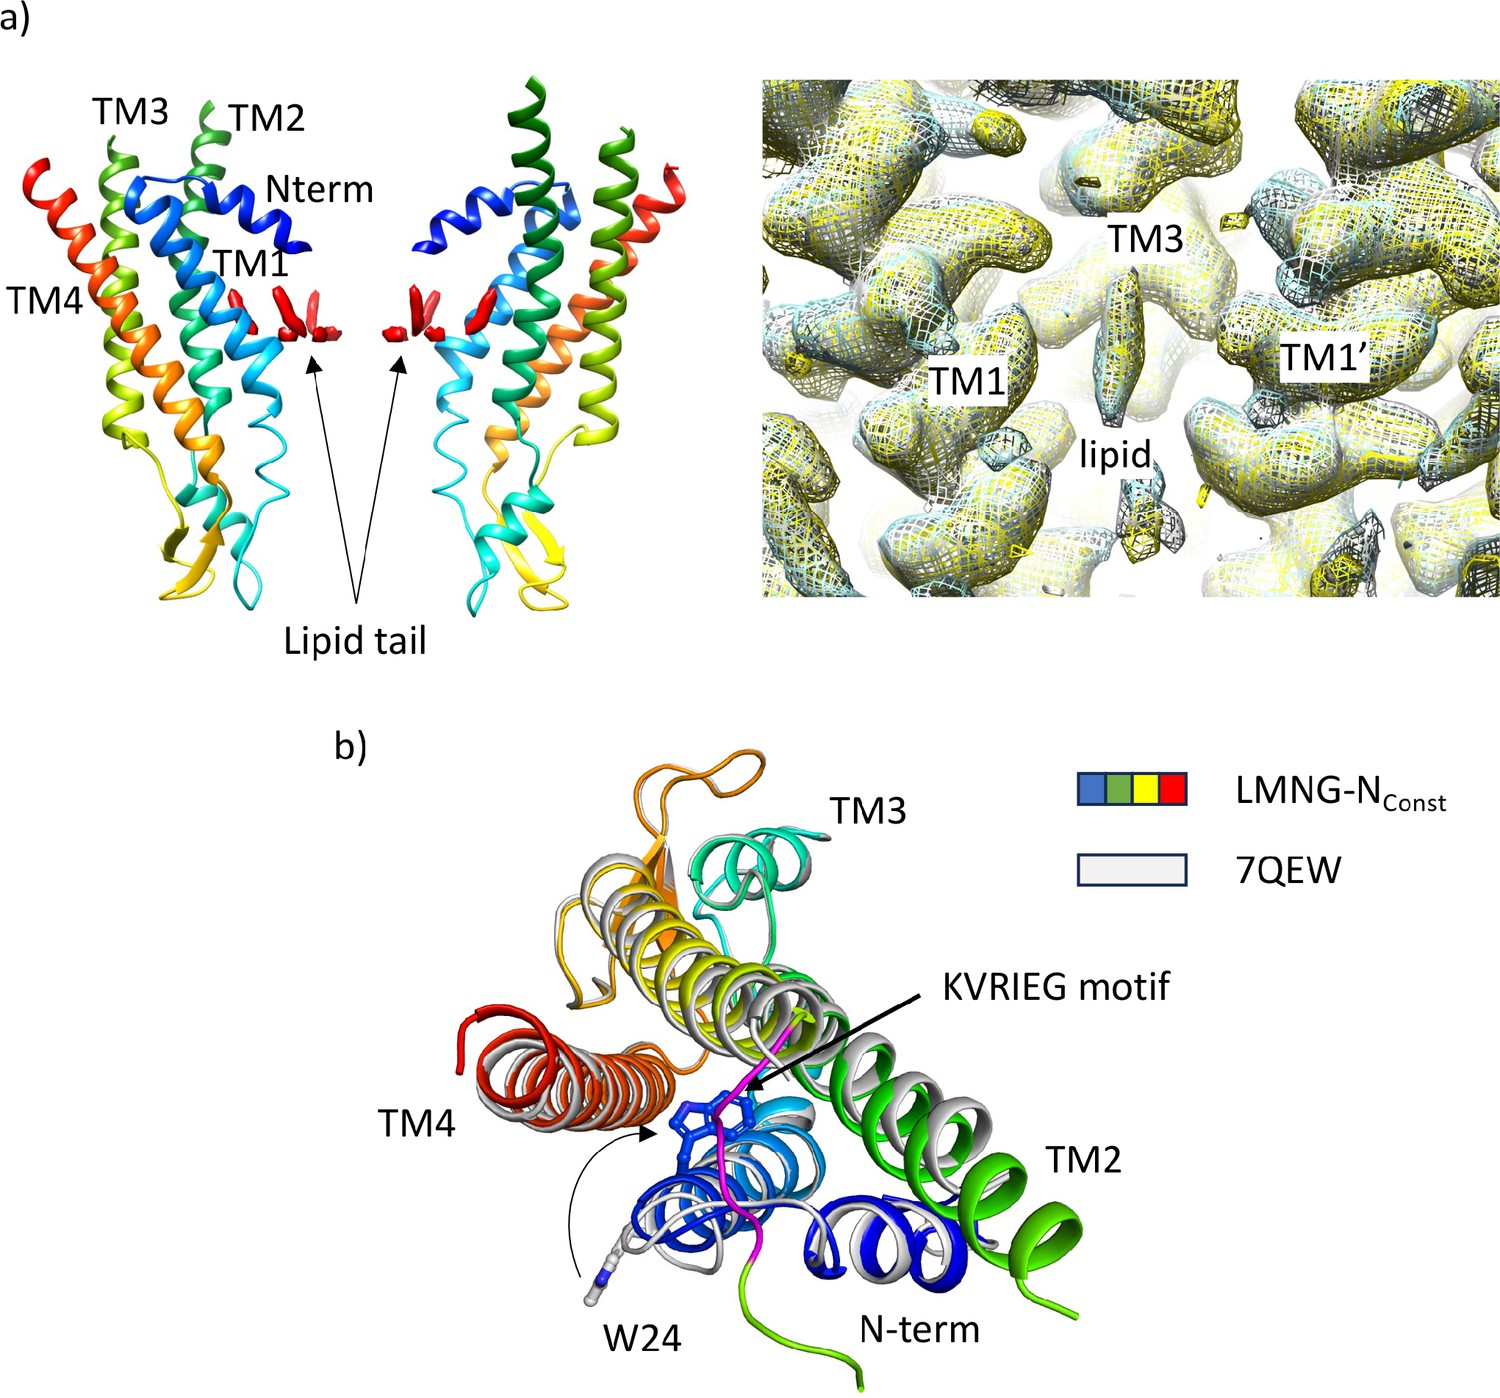
Comparison of structures derived from lauryl maltose neopentyl glycol (LMNG) solubilised protein with the structure derived from the dodecyl β-D-maltoside (DDM) solubilised protein.
(a) Density for lipid-like molecule. Left: Lipid-like density (red surface) in the pore of the protein seen in wil-type (WT) connexin26 (Cx26) solubilised in DDM (PDB 7QEQ, EMD-13937). Right: Maps associated with the LMNG solubilised protein superposed on that of the DDM solubilised protein (LMNG-NConst (cyan) and LMNG-NFlex (yellow)), EMD-13937 (white) showing that the density remains irrespective of which of the two detergents is used to solubilise the protein. (b) Superposition of the LMNG-NConst structure on the similar conformation of the protein derived from DDM solubilised protein (7QEW). The conformation of TM1 differs between the two structures, as shown by the position of W24. We attribute the difference to incomplete particle separation of the DDM-derived protein during the classification procedure.
Figure 1—video 1
Morph showing the conformational differences between reconstructions of lauryl maltose neopentyl glycol (LMNG)-NConst and LMNG-NFlex.
LMNG-NConst (pale blue) LMNG-NFlex (yellow).
Figure 2 with 2 supplements
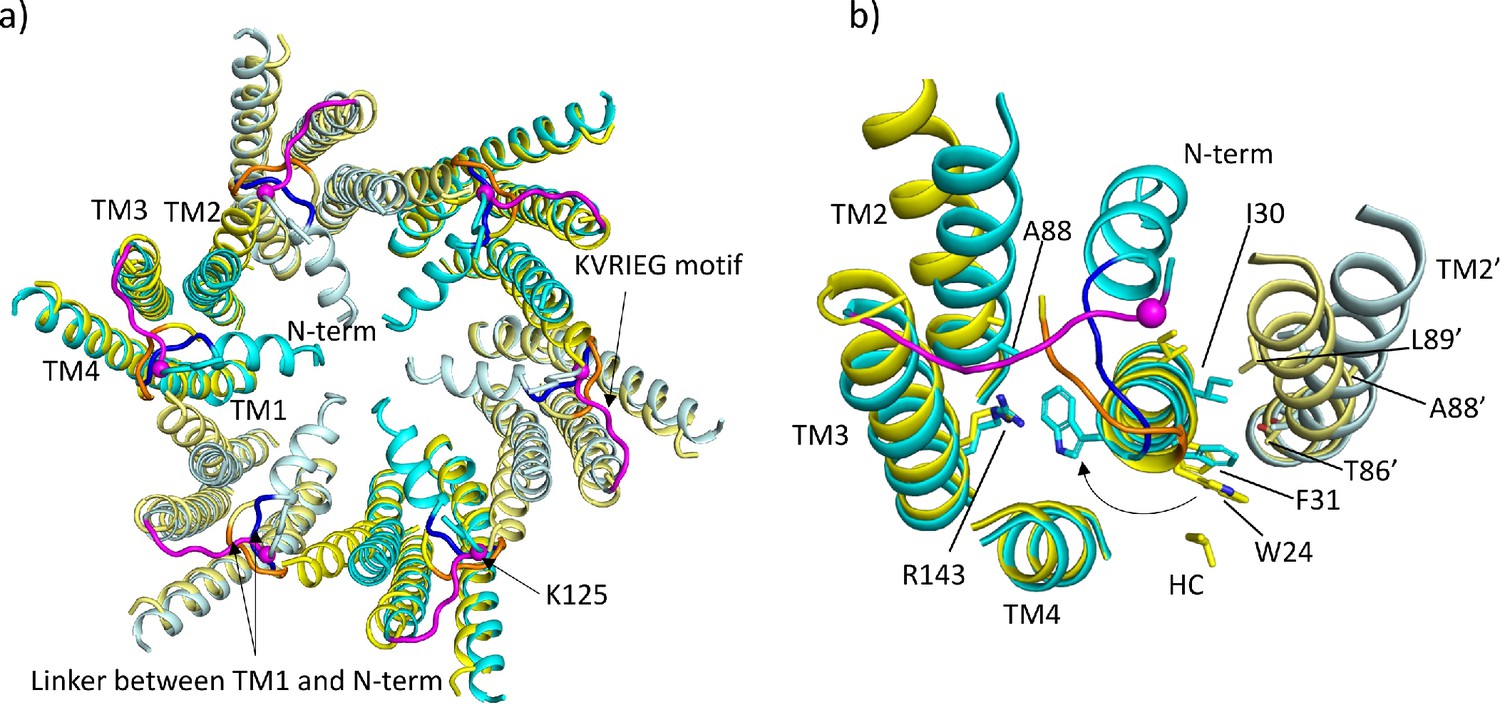
Comparison of lauryl maltose neopentyl glycol (LMNG)-NConst and LMNG-NFlex structures.
(a) Overall superposition showing the movement of TM2 and the link between the N-terminus and TM1. LMNG-NConst in cyan and LMNG-NFlex in yellow (alternate subunits have been coloured in lighter shades). The KVRIEG motif has been coloured magenta with a sphere indicating the position of K125. The residues between the N-terminus and TM1 for the LMNG-NConst structure have been coloured blue. (b) As (a) but focussed on TM1. The conformation of TM1 differs between the two structures as seen by the change in position of Trp24. TM2’ is from the neighbouring subunit. HC denotes the hydrocarbon chain from a lipid. The positions of T86’ and L89’ of TM2 in the NFlex conformation are not compatible with F31 and I30 TM1 in the NConst conformation.
Figure 2—video 1
Morph showing the conformational differences between structures of lauryl maltose neopentyl glycol (LMNG)-NConst and LMNG-NFlex.
As the N-terminus and KVRIEG motif are not visible in the LMNG-NFlex structure, these residues are not present in the morph. Residues linking the N-terminal helix to TM1 are shown in blue. Trp24 is depicted by pink sticks.
Figure 2—video 2
Morph showing the conformational differences between structures of lauryl maltose neopentyl glycol (LMNG)-NConst and LMNG-NFlex.
Focussed on TM1 with TM1, 2, 3, 4 of one subunit depicted in cyan, green, yellow, and red respectively and TM2 of a second subunit in darker green. The movement of TM2 stems from the region around Phe 83 so that the position of the Cα atom of Lys103 near the top of TM2 of the respective structures differs by ~8.5 Å.
Figure 3 with 2 supplements
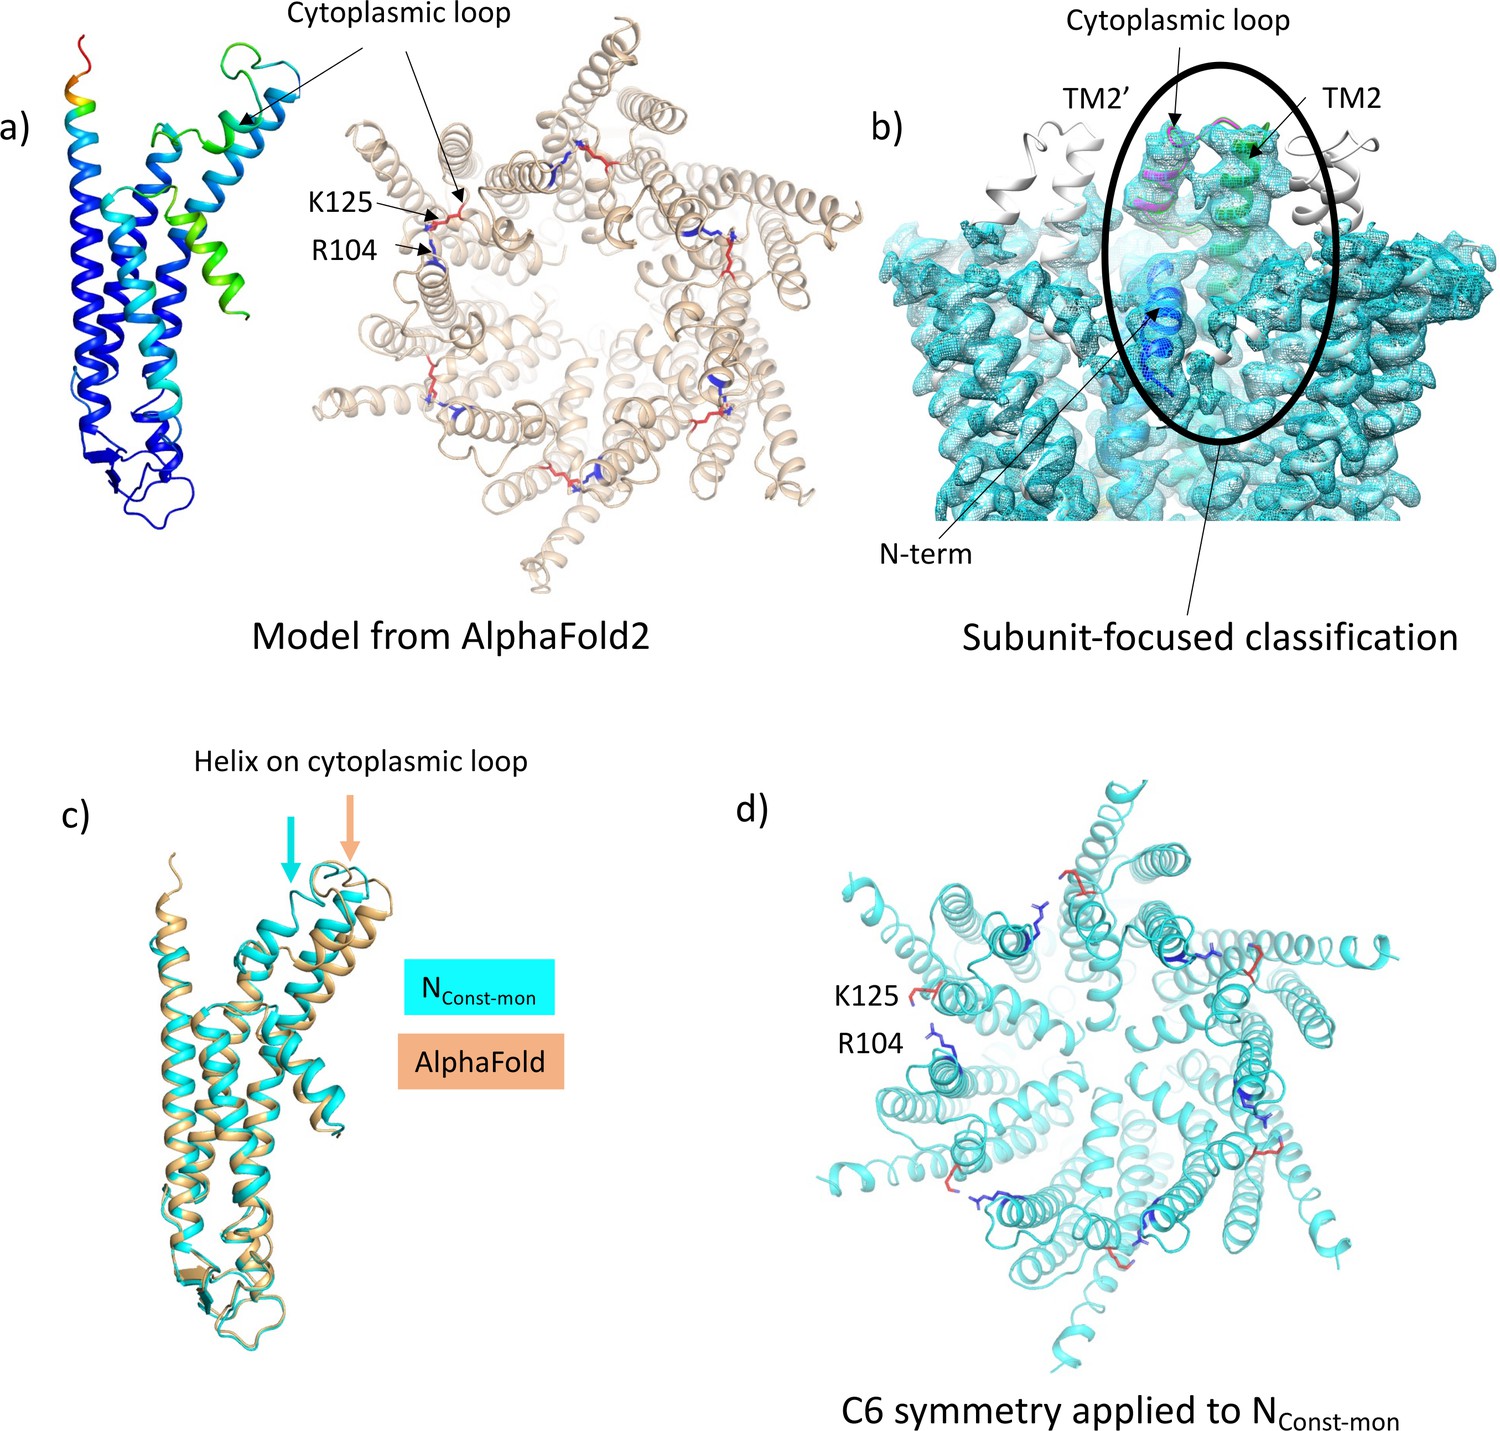
Focussed classification of a single subunit results in density for the cytoplasmic loop consistent with models from AlphaFold2.
(a) Models generated by AlphaFold2 for a single subunit (left; coloured according to confidence level) and for the hexamer (right; in wheat with the position of K125 depicted by red sticks and the position of R104 in blue). (b) Focussed classification of a single subunit (highlighted by an oval and coloured as in Figure 1c with the cytoplasmic loop in magenta) resulted in clear density for part of the cytoplasmic loop in a conformation consistent with the models from AlphaFold2. This does not extend to the neighbouring subunits (the conformation of the subunit is replicated in grey for the neighbouring subunits). (c) Superposition of the single subunit built into the density (cyan) on the AlphaFold2 model (wheat). Showing the change in position of the helix in the cytoplasmic loop (highlighted by an arrow in the relevant colour). (d) Reconstituting a hexamer by replicating the conformation of the subunit seen in (b) to all six subunits of the hexamer results in an apparently more closed conformation of the hemichannel, though there are also residue clashes, especially at the N-terminus. Lys 125 and Arg 104 are depicted with red and blue sticks, respectively.
Figure 3—figure supplement 1
Workflow for single subunit classification for lauryl maltose neopentyl glycol (LMNG) solubilised sample.
The maps in the lower panel are coloured according to resolution as estimated in Relion 4.
Figure 3—figure supplement 2
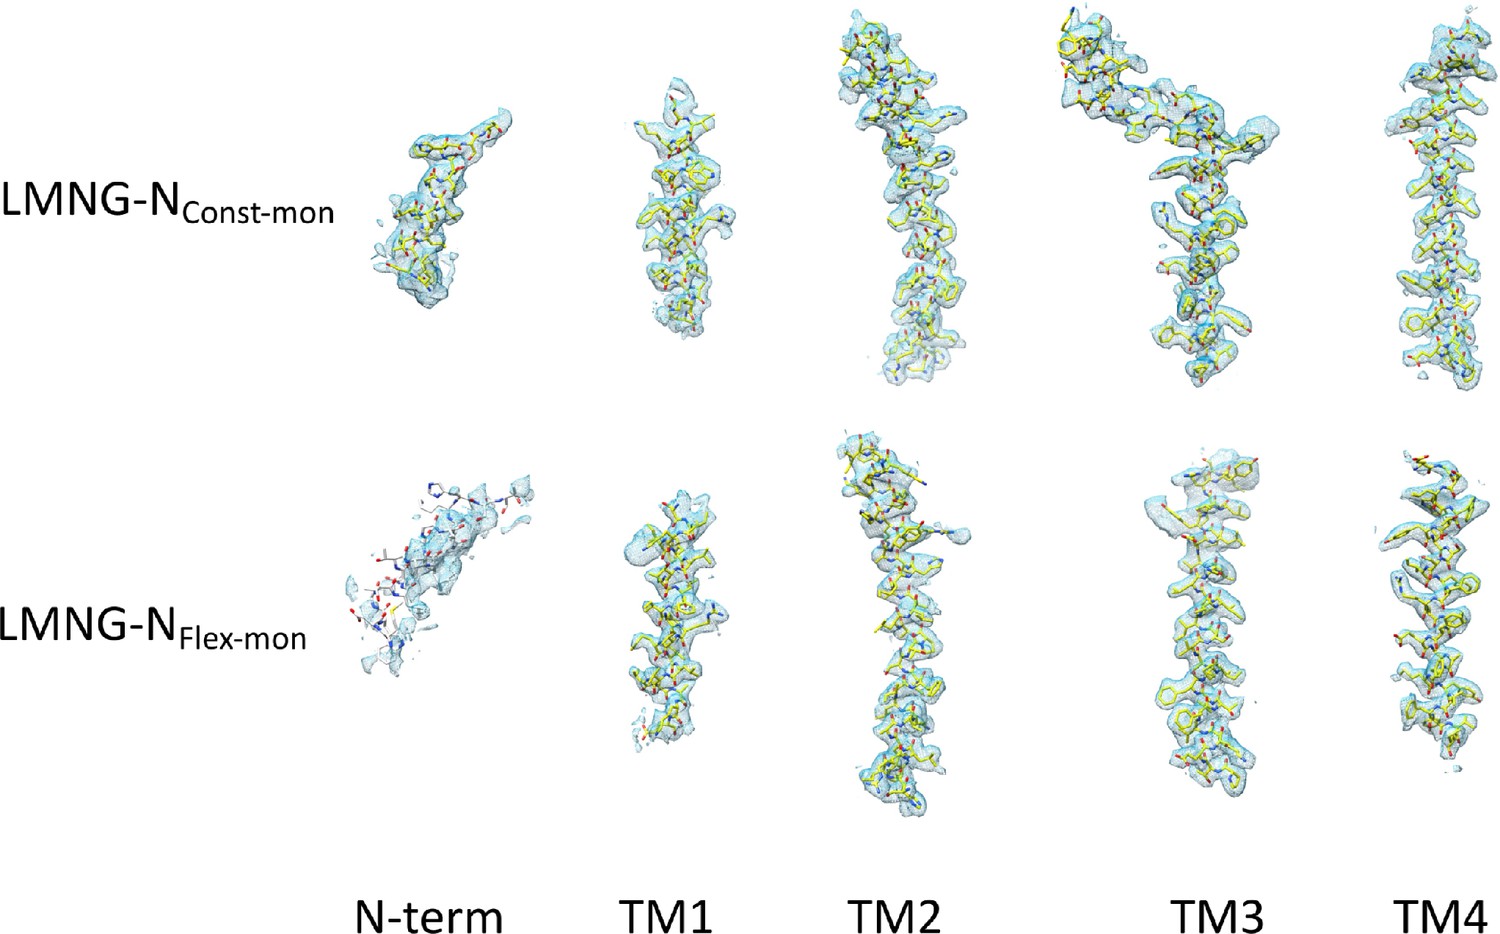
Density for the transmembrane helices and the N-terminal helix associated with each the lauryl maltose neopentyl glycol (LMNG)-NConst-mon and LMNG-NFlex-mon structures.
The residues with white carbon atoms are not included in the final structure.
Figure 4
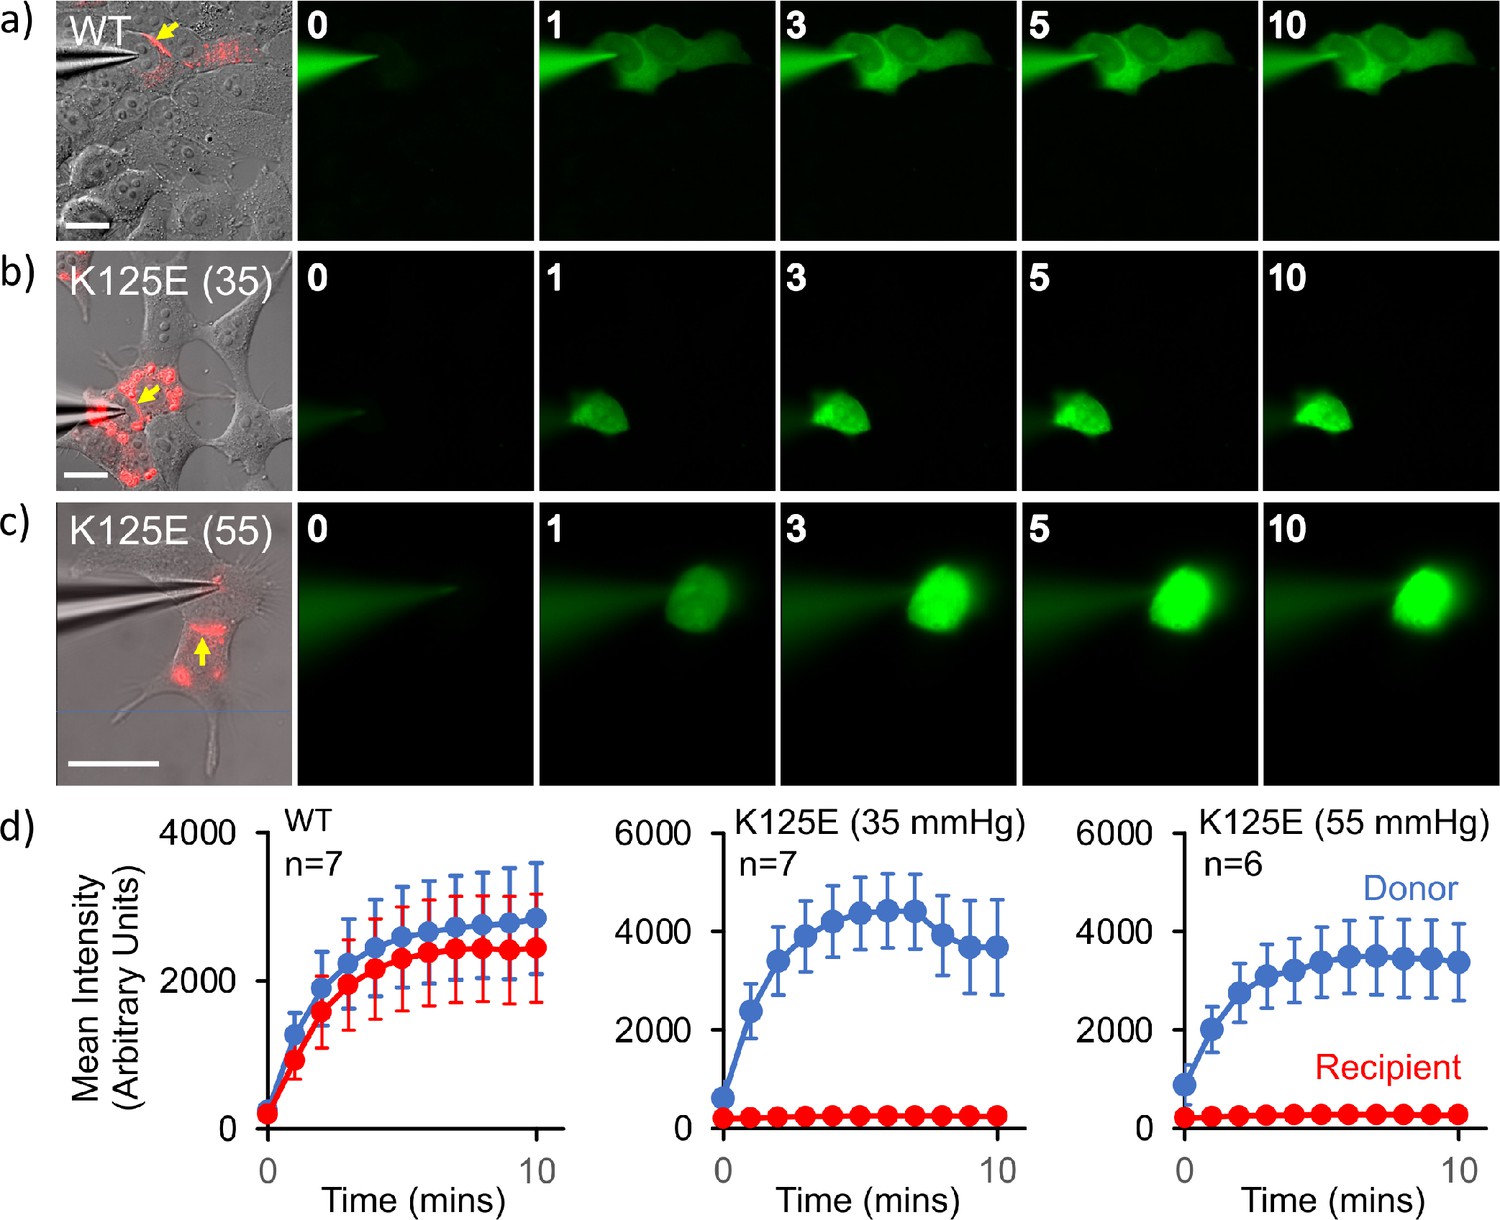
Cx26K125E gap junctions are constitutively closed at a partial pressure of CO2 (PCO2) of 35 mmHg.
(a–c) Montages each showing bright-field DIC image of HeLa cells with mCherry fluorescence corresponding to the Cx26K125E-mCherry fusion superimposed (leftmost image) and the permeation of 2-Deoxy-2-[(7-nitro-2,1,3-benzoxadiazol-4-yl)amino]-D-glucose (NBDG) from the recorded cell to coupled cells. Yellow arrow indicates the presence of a gap junction between the cells; scale bars, 20 µm. The numbers are the time in minutes following the establishment of the whole-cell recording. In Cx26WT expressing cells (a), dye rapidly permeates into the coupled cell. For Cx26K125E expressing cells, no dye permeates into the neighbouring cell even after 10 min of recording at either 35 (b) or 55 mmHg (c) PCO2 despite the presence of morphological gap junctions. (d) Quantification of fluorescence intensity in the recorded cell (donor) and the potentially coupled cell (recipient) for both Cx26WT and Cx26K125E (seven pairs of cells recorded for WT and K125E at 35 mmHg and six pairs of cells for K125E at 55 mmHg, data presented as mean ± SEM). While dye permeation to the recipient cell follows the entry of dye into the donor for Cx26WT, no dye permeates to the acceptor cell for Cx26K125E. Note that the fluorescence intensity in the donor cell for Cx26K125E at both levels of PCO2 is higher than for Cx26WT at 35 mmHg, presumably because the dye remains trapped in the donor cell rather than diffusing to the recipient cell.
-
Figure 4—source data 1
Quantification of fluorescence intensity in the recorded cell (donor) and the potentially coupled cell (recipient) for both Cx26WT and Cx26K125E.
- https://cdn.elifesciences.org/articles/93686/elife-93686-fig4-data1-v1.xlsx
Figure 5 with 7 supplements
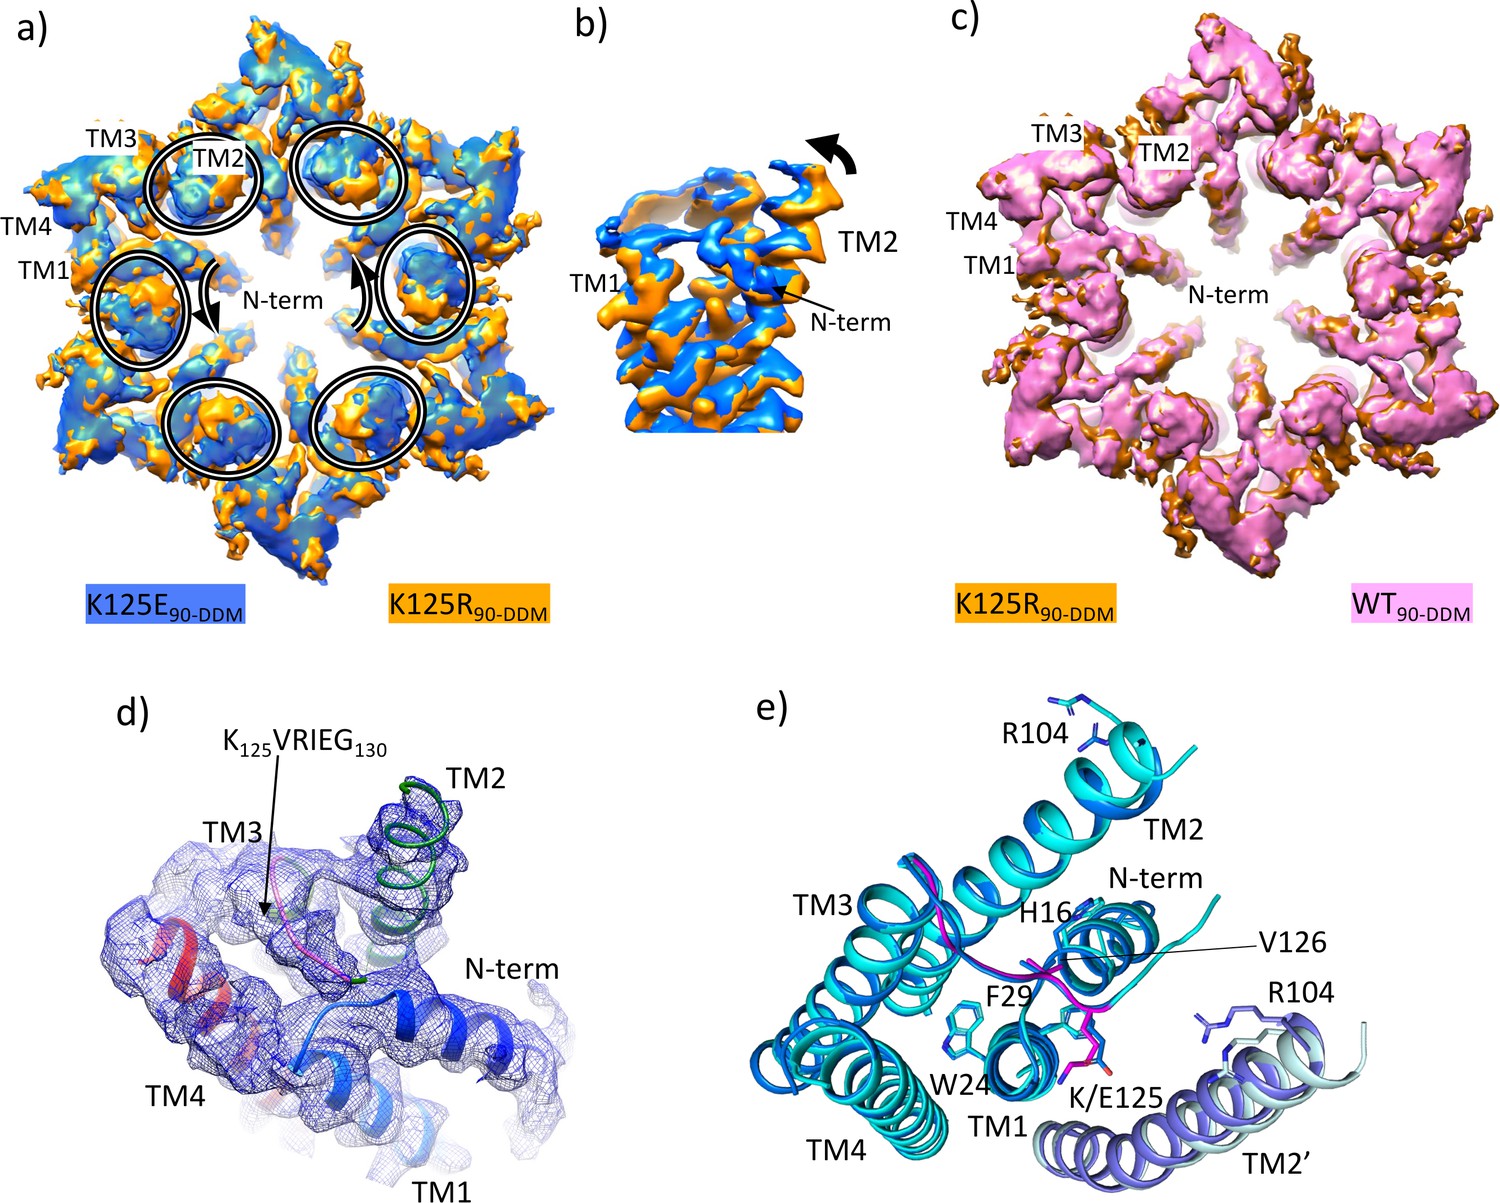
Density associated with the K125E mutant.
(a) Superposition of density for K125E90 D6 averaged map (blue) on the density for the K125R90 D6 averaged maps (orange). The ovals show the position of TM2 from each subunit and the arrows show the direction of the difference between TM2 in the two structures. (b) As (a) but focussed on TM2 in a view approximately perpendicular to the membrane. (c) Superposition of density for WT90 connexin26 (Cx26) (PDB ID 7QEQ; pink) D6 averaged maps on the density for R125E90 (orange). (d) Density associated with one subunit of the K125E90 structure (unsharpened map). The structure has been coloured as in Figure 1c. (e) Superposition of K125E90 structure (light blue) on the structure of lauryl maltose neopentyl glycol (LMNG)-NConst (cyan) showing the similarity between the two structures.
Figure 5—figure supplement 1
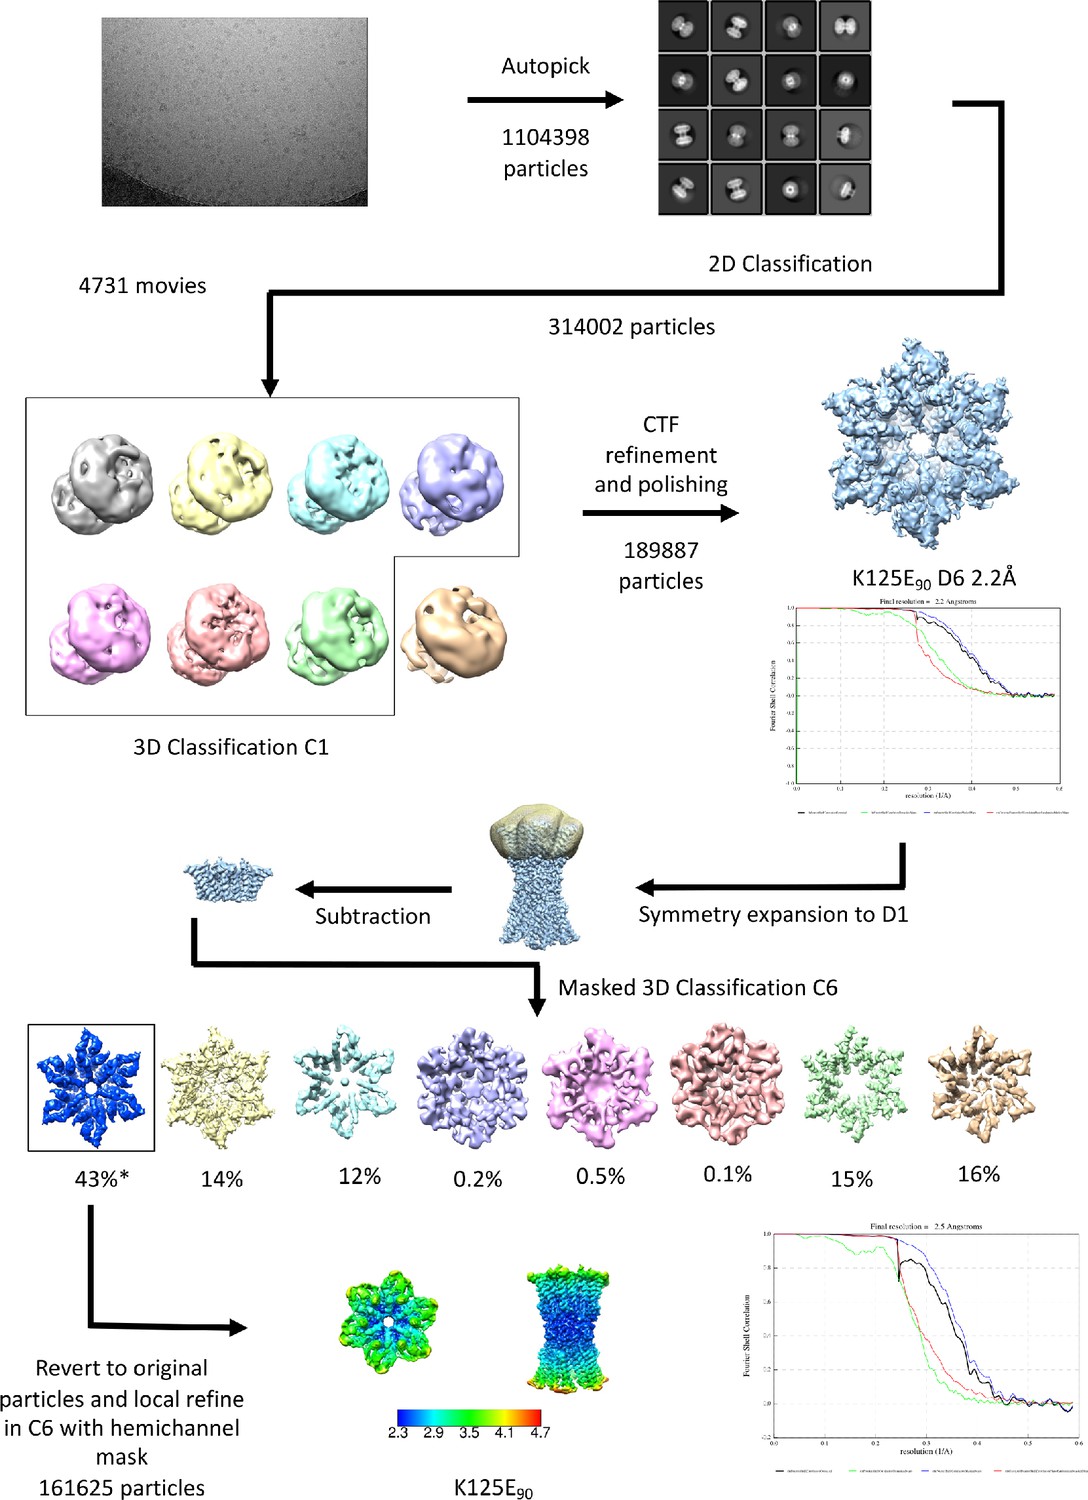
Workflow for processing of cryo-EM data for K125E sample in CO2/HCO3- buffer.
The star denotes the classifications with the appearance of the NConst conformation that refine to a resolution greater than 4 Å. The maps in the lower panel are coloured according to resolution as estimated in Relion 4.
Figure 5—figure supplement 2
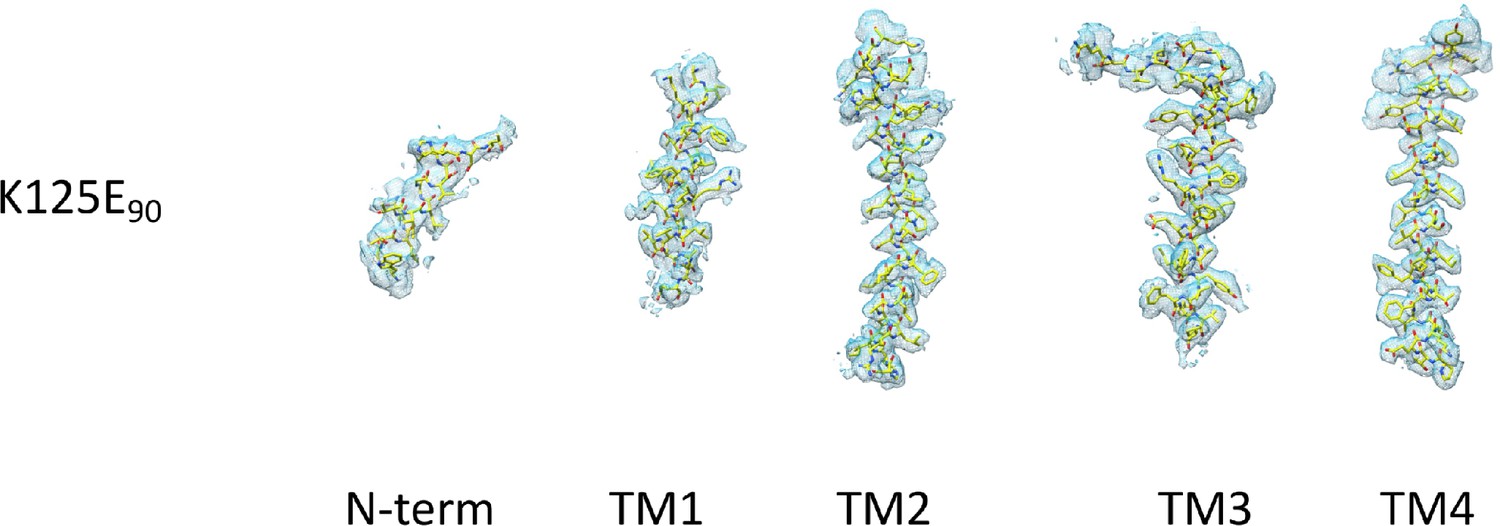
Density for the transmembrane and N-terminal helix associated with the K125E structure.
Figure 5—figure supplement 3
Workflow for processing of cryo-EM data for K125R sample in CO2/HCO3- buffer.
The star denotes the classifications with the appearance of the NConst conformation that refine to a resolution greater than 4 Å.
Figure 5—figure supplement 4
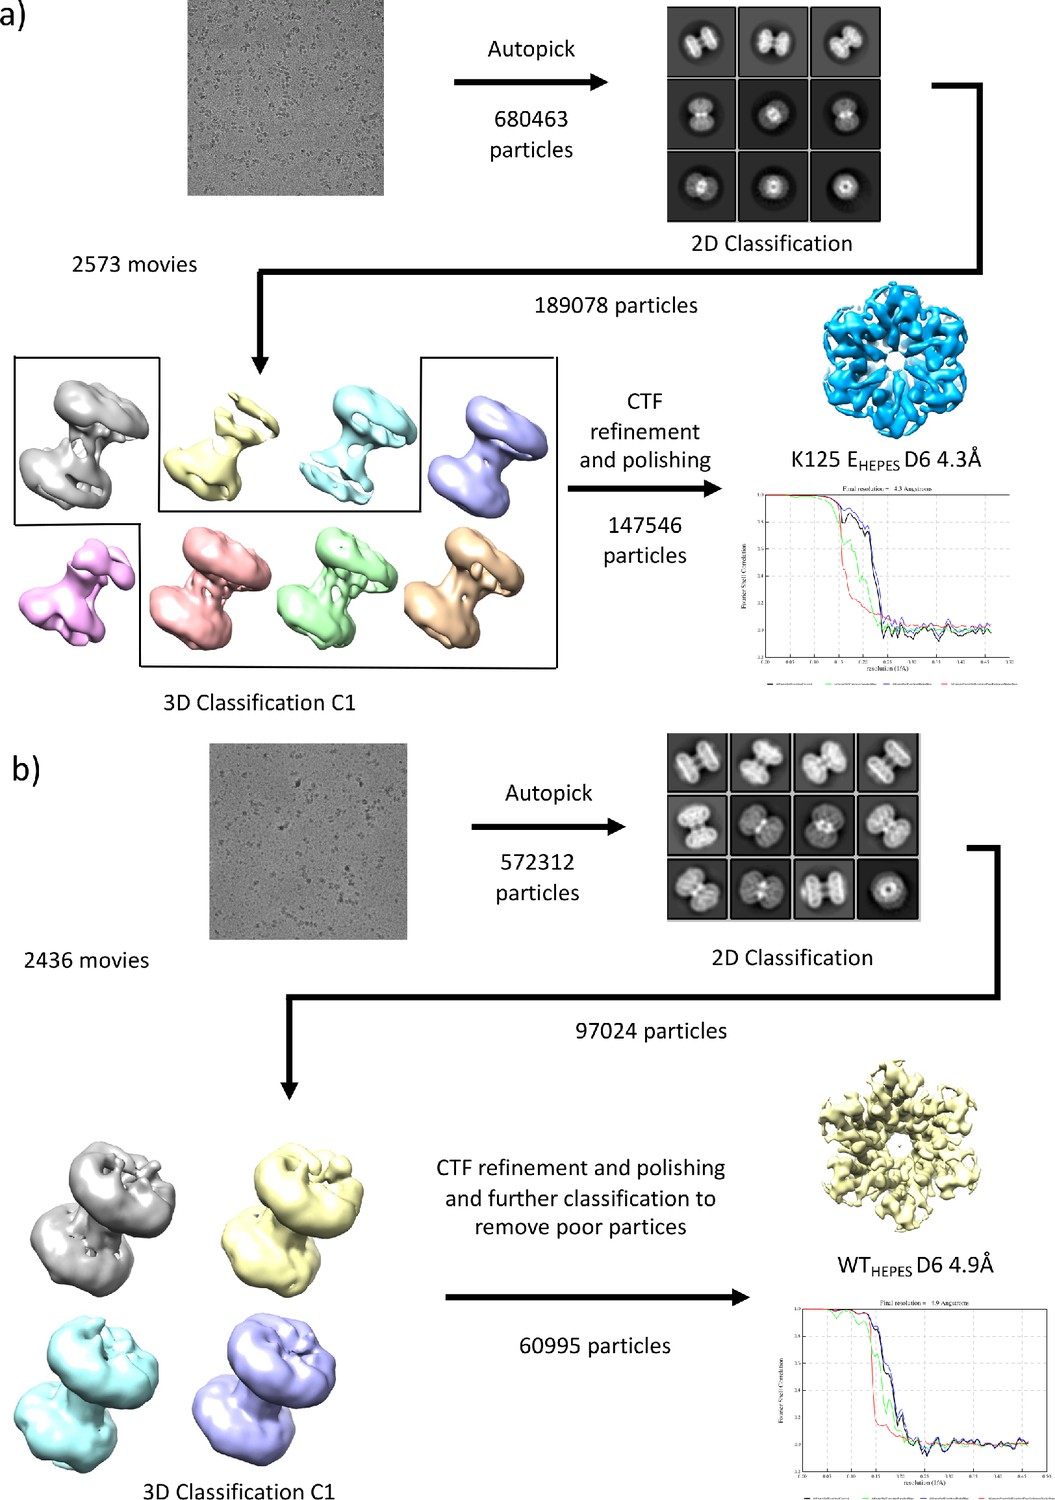
Workflows for processing of cryo-EM data for samples in HEPES buffer.
(a) K125EHEPES (b) WTHEPES.
Figure 5—figure supplement 5
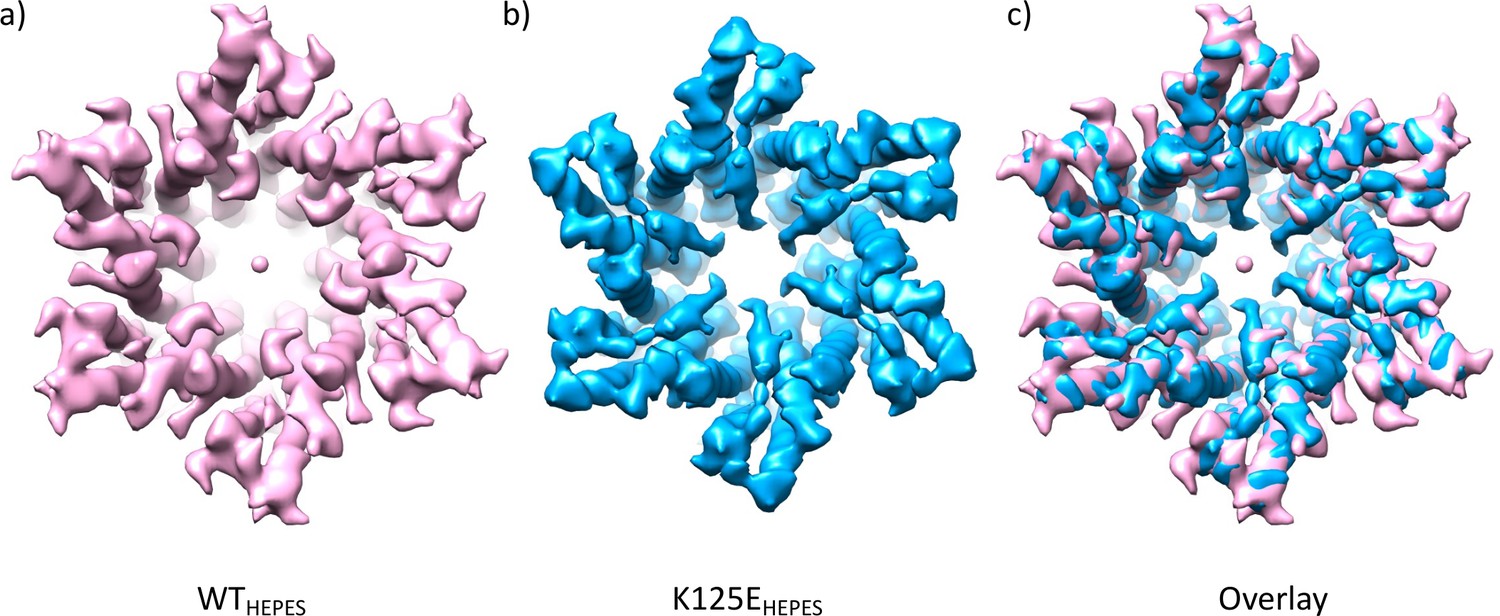
Comparison of density maps from wild-type (WT) and K125E connexin26 (Cx26) purified in HEPES buffer at pH 7.4.
(a) WT Cx26 at 4.9 Å resolution sharpened with a B-factor of –100. (b) K125E sharpened with B-factor of –273 and low pass filtered to 5 Å. (c) Superposition of the two maps.
Figure 5—video 1
Morph showing the conformational difference between D6 refined reconstructions of K125E and K125R.
K125E is coloured blue and K125R orange. The position of TM2 is highlighted by an oval in one of the subunits.
Figure 5—video 2
Morph showing the conformational differences between D6 refined reconstructions of wild-type (WT) and K125E in HEPES buffer.
WT (pink) K125E (blue). The position of TM2 is highlighted by an oval in one of the subunits.
Figure 6
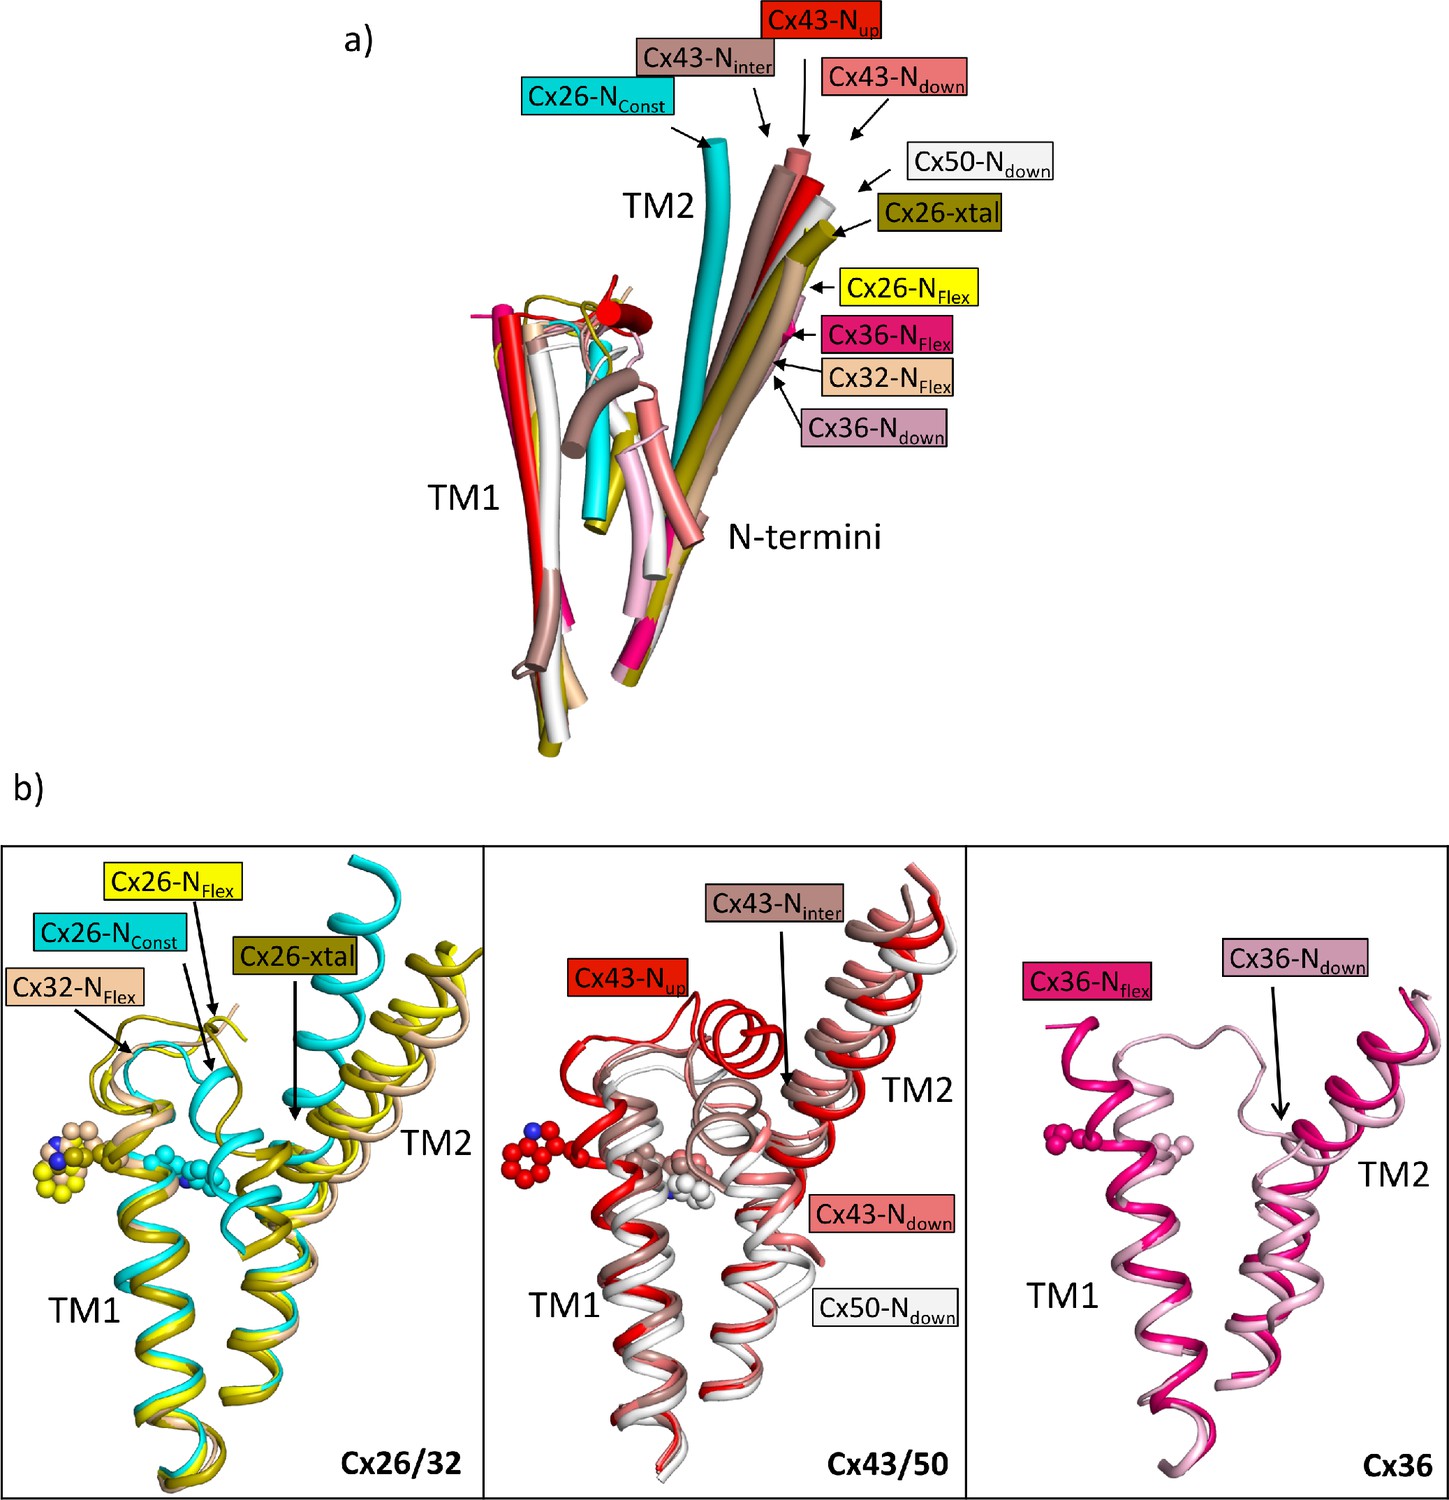
Comparison of the two structures derived from the lauryl maltose neopentyl glycol (LMNG) classification with other structures of connexins.
(a) Superposition of a single subunit from the LMNG-NConst (cyan) and LMNG-NFlex (yellow) structures on: connexin26 (Cx26) crystal structure (chartreuse, PDB ID 2ZW3); Cx32 (wheat, 7zxm) Cx50 (white, 7JJP); Cx43 in up (red, 7XQF), intermediate (chocolate, 7XQI), and down (salmon, 7F94) conformations; Cx36 in down (pink, 7XNH) and flexible (raspberry, 7XKT) conformations. The structures were superposed based on all chains of the hexamer. For clarity, only TM1, TM2, and the N-terminal helices are shown for each structure. (b) As (a) for the beta connexins Cx26 and Cx32 (left), alpha connexins Cx43 and Cx50 (middle), and the gamma connexin Cx36 (right) structures separately. Trp24 in each of the Cx26 and Cx43 structures has been depicted with a sphere representation. The isoleucine in the corresponding position is shown for Cx36. The sequence identities for common residues to Cx26 are 63% for Cx32, 49% for Cx50, 43% for Cx43, and 35% for Cx36.
Figure 7
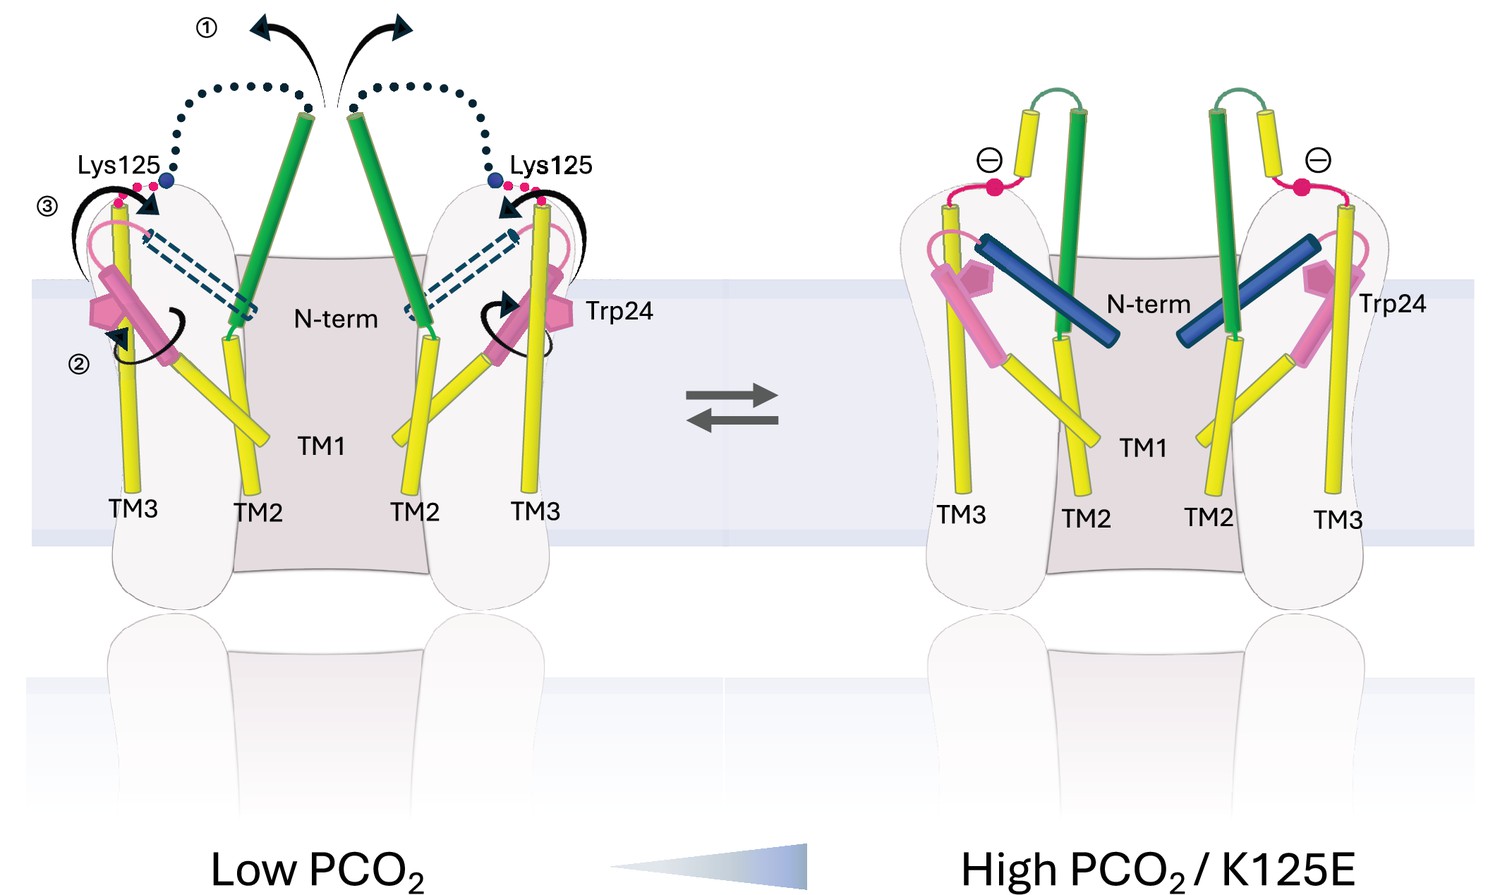
Schematic representation of conformational changes.
Schematic view of the cytoplasmic region of two opposing subunits within one hemichannel of the gap junction. The open structure on the left and the constricted structure on the right are in a dynamic equilibrium. Increase in partial pressure of CO2 (PCO2) and the introduction of a negative charge on Lys125 of the KVRIEG motif (magenta) pushes the equilibrium to the right. In going from one conformation to the other: ① the cytoplasmic region of TM2 (green) flexes around Phe83 and the cytoplasmic loop adopts a more defined conformation; ② the cytoplasmic region of TM1 (pink) rotates, illustrated here by the movement of Trp24; ③ the N-terminal helix (blue), which will be affected by both ① and ②, adopts a position within the pore that constricts the entrance to the channel.
Tables
Table 1
Cryo-EM data collection and processing statistics.
| K125E90 | K125R90 | LMNG90 | K125EHEPES | WTHEPES | |
|---|---|---|---|---|---|
| Voltage (kV) | 300 | 300 | 300 | 300 | 300 |
| Magnification (×1000) | 105 | 105 | 105 | 75 | 75 |
| Camera | K3 | K3 | K3 | Falcon 3 | Falcon 3 |
| Frame alignment on Falcon 3 | – | – | Yes | Yes | |
| Camera mode | Super-resolution | Counting bin 1 | Super-resolution bin 2 | Counting | Counting |
| Energy filter (eV) | 20 | 20 | 20 | 20 | 20 |
| Defocus range (μm) | –0.8 to –2.0 | –0.8 to –2.0 | –0.8 to –2.3 | –0.3 to –1.7 | –0.5 with Volta phase-plate |
| Pixel size (Å/pix) | 0.85 | 0.835 | 0.835 | 1.08 | 1.08 |
| Dose on detector (e–/pix/s) | 10 | 15 | 18.77 | 0.7 | |
| Dose on sample (e–/pix/s) | 11.4 | 18 | 1.06 | 0.69 | |
| Exposure time (s) | 3 | 2 | 2 | 44.01 | 60 |
| No. of images | 4731 | 10,044 | 11,362 | 2573 | 2436 |
| Frames per image | 45 | 50 | 50 | 40 | 75 |
| Final particle number | 189,887 | 222,622 | 204,438 | 147,546 | 60,995 |
| Resolution* | |||||
| Masked D6 (Å) | 2.2 | 2.1 | 2.0 | 4.3 | 4.9 |
-
*
From Relion_postprocess (Scheres, 2012).
Table 2
Cryo-EM refinement and validation statistics.
| K125E90 | LMNG90 | ||||
|---|---|---|---|---|---|
| NFlex | NConst | NConst-mon | NFlex-mon | ||
| Deposited structure PDB ID | 8Q9Z | 8QA1 | 8QA0 | 8QA2 | 8QA3 |
| Final particle number | 161,625 | 59,005 | 35,007 | 357,859 | 240,137 |
| Map resolution | |||||
| FSC threshold | 0.143 | 0.143 | 0.143 | 0.143 | 0.143 |
| Symmetry imposed | C6 | C6 | C6 | C1 | C1 |
| Unmasked (Å) | 2.3 | 2.2 | 2.4 | 2.6 | 2.4 |
| Masked (Å) (masked) | 2.4 | 2.0 | 2.1 | 2.3 | 2.2 |
| Refinement | |||||
| Initial model (PDB code) | 7QEQ | 7QEQ | K125E90 | AlphaFold2 | NConst-mon |
| Resolution (Å; FSC = 0.5) model | 2.6 | 2.4 | 2.6 | 2.6 | 2.6 |
| Sharpening B factor (Å2) | Local | Local | Local | Local | Local |
| Model composition | 12 chains | 12 chains | 12 chains | 12 chains | 12 chains |
| Non-hydrogen atoms | 19,704 | 18,720 | 19,878 | 18,945 | 18,580 |
| Protein residues | 2316 | 2190 | 2340 | 2260 | 2226 |
| Water | 348 | 318 | 342 | 322 | 254 |
| Ligand: lipid/detergent | 48 | 24 | 24 | 13 | 12 |
| B factor (Å2) | |||||
| Protein | 66 | 54 | 77 | 68 | 73 |
| Water | 42 | 33 | 56 | 45 | 44 |
| Lipid/detergent | 56 | 60 | 85 | 69 | 70 |
| R.m.s. deviations | |||||
| Bond lengths (Å) | 0.004 | 0.002 | 0.004 | 0.002 | 0.003 |
| Bond angles (°) | 0.516 | 0.484 | 0.593 | 0.450 | 0.544 |
| Validation | |||||
| MolProbity score | 1.54 | 1.25 | 1.55 | 1.53 | 1.74 |
| Clashscore | 5.66 | 3.46 | 6.50 | 4.90 | 5.20 |
| Rotamer outliers (%) | 1.83 | 1.42 | 1.05 | 2.32 | 3.71 |
| Ramachandran plot | |||||
| Favoured (%) | 97.84 | 98.97 | 96.99 | 98.5 | 97.89 |
| Allowed (%) | 2.16 | 1.03 | 3.01 | 1.49 | 2.11 |
| Disallowed (%) | 0 | 0 | 0 | 0 | 0 |
| CaBlam outliers (%) | 1.53 | 1.24 | 1.6 | 0.83 | 1.08 |
| Correlation coefficients | |||||
| CC (mask) | 0.86 | 0.87 | 0.85 | 0.86 | 0.87 |
| CC (box) | 0.7 | 0.71 | 0.66 | 0.68 | 0.70 |
| CC (peaks) | 0.68 | 0.70 | 0.63 | 0.66 | 0.68 |
| CC (volume) | 0.84 | 0.85 | 0.84 | 0.85 | 0.85 |
| Mean CC for ligands | 0.71 | 0.73 | 0.61 | 0.68 | 0.70 |
Key resources table
| Reagent type (species) or resource | Designation | Source or reference | Identifiers | Additional information |
|---|---|---|---|---|
| Gene (Homo sapiens) | GBJ2 | Uniprot | P29033 | |
| Recombinant DNA reagent | pFastbac-human connexin 26 | Gift from Prof. Tomitake Tsukihara and Prof. A Atsunori | ||
| Cell line (Spodoptera frugiperda) | Sf9 | Fisher Scientific | CAT# 10500343 | |
| Recombinant DNA reagent | Cx26WT | Meigh et al., 2013 | ||
| Recombinant DNA reagent | Cx26K125E | Meigh et al., 2013 | ||
| Cell line (Homo sapiens) | HeLa DH (ECACC) | ECACC | CAT# 96112022 RRID:CVCL_2483 | |
| Chemical compound, drug | Insect Xpress | Scientific Laboratory Supplies/Lonza | CAT# LZBELN12-730Q | |
| Chemical compound, drug | DMEM | Merck Life Sciences UK Ltd | CAT# D6046 | |
| Chemical compound, drug | Fetal bovine serum | Labtech.com | CAT# FCS-SA | |
| Chemical compound, drug | GeneJuice Transfection Reagent | Merck Life Sciences UK Ltd | CAT# 70967-3 | |
| Chemical compound, drug | 2-Deoxy-2-[(7-nitro-2,1,3-benzoxadiazol-4-yl)amino]-D-glucose | AAT Bioquest | CAT# 36702 | |
| Chemical compound, drug | K-gluconate | Merck Life Sciences UK Ltd | CAT# G4500 | |
| Chemical compound, drug | Histidine | Merck/Sigma | CAT# H6034-100G | |
| Chemical compound, drug | n-Dodecyl β-maltoside (DDM-C) | Glycon Biochemicals GMBH | CAT# D97002-C-50g | |
| Chemical compound, drug | cOmplete, EDTA-free Protease Inhibitor Cocktail | Merck/Roche | CAT# 4693132001 | |
| Chemical compound, drug | AEBSF hydrochloride | Fisher Scientific/Acros | CAT# 10742885 | |
| Chemical compound, drug | Dithiothreitol | Fisher Scientific | CAT# 10592945 | |
| Chemical compound, drug | DNAse I | Merck/Roche | CAT# 10104159001 | |
| Chemical compound, drug | HisPur Ni-NTA Resin | Thermo Scientific/ Pierce | CAT# 88221 | |
| Chemical compound, drug | 5/150 Superose 6 column | GE Healthcare Lifescience | CAT# 15383224 | |
| Other | Quantifoil 0.6/1 300 mesh Au holey carbon | Quantifoil Micro Tools GMBH | CAT# N1-C11nAu30-01 | Grid onto which sample is vitrified: See Methods |
| Other | UltrAuFoil 1.2/1.3 300 mesh Holey gold | Quantifoil Micro Tools GMBH | CAT# N1-A14nAu30-50 | Grid onto which sample is vitrified: See Methods |
| Other | UltrAuFoil 0.6/1 300 mesh Holey gold | Quantifoil Micro Tools GMBH | CAT# N1-A11nAu30-01 | Grid onto which sample is vitrified: See Methods |
| Commercial assay or kit | QuikChange II mutagenesis kit | Agilent | CAT# 200523 | |
| Sequence-based reagent | K125R-forward | This paper | PCR primers | 5'-tcgaggagatcaaaacccagagggtccgcatcg-3' |
| Sequence-based reagent | K125R-reverse | This paper | PCR primers | 5'-cgatgcggaccctctgggttttgatctcctcga-3' |
| Sequence-based reagent | K125E forward | This paper | PCR primers | 5’-gagatcaaaacccaggaggtccgcatcgaa-3’ |
| Sequence-based reagent | K125E reverse | This paper | PCR primers | 5’-ttcgatgcggacctcctgggttttgatctc-3’ |
| Software, algorithm | Relion | Scheres, 2012 | https://www3.mrc-lmb.cam.ac.uk/relion | |
| Software, algorithm | UCSF Chimera | Goddard et al., 2007 | https://www.cgl.ucsf.edu/chimera/ | |
| Software, algorithm | ModelAngelo | Jamali et al., 2024; 3dem, 2023 | https://github.com/3dem/model-angelo | |
| Software, algorithm | Coot | Emsley and Cowtan, 2004 | https://www2.mrc-lmb.cam.ac.uk/personal/pemsley/coot/ | |
| Software, algorithm | PyMol | Delano, 2002 | https://pymol.org/ | |
| Software, algorithm | Colabfold v 1.5. | Mirdita et al., 2022 | https://colab.research.google.com/github/sokrypton/ColabFold/blob/main/AlphaFold2.ipynb | |
| Software, algorithm | CTFFIND4 | Rohou and Grigorieff, 2015 | https://grigoriefflab.umassmed.edu/ctffind4 |
Additional files
Download links
A two-part list of links to download the article, or parts of the article, in various formats.
Downloads (link to download the article as PDF)
Open citations (links to open the citations from this article in various online reference manager services)
Cite this article (links to download the citations from this article in formats compatible with various reference manager tools)
Structures of wild-type and a constitutively closed mutant of connexin26 shed light on channel regulation by CO2
eLife 13:RP93686.
https://doi.org/10.7554/eLife.93686.3


