Macro-scale patterns in functional connectivity associated with ongoing thought patterns and dispositional traits
- Department of Neurology, Max Planck Institute for Human Cognitive and Brain Sciences, Germany
- Max Planck School of Cognition, Germany
- Department of Psychology, Queen's University, Canada
- Otto Hahn Group Cognitive Neurogenetics, Max Planck Institute for Human Cognitive and Brain Sciences, Germany
- Institute of Neuroscience and Medicine (INM-7: Brain and Behaviour), Research Centre Jülich, Germany
- Center for the Developing Brain, Child Mind Institute, United States
- Max Planck Research Group: Adaptive Memory, Max Planck Institute for Human Cognitive and Brain Sciences, Germany
- Institute of Systems Neuroscience, Heinrich Heine University Düsseldorf, Germany
- Frontlab, Institut du Cerveau et de la Moelle épinière, UPMC UMRS 1127, Inserm U 1127, CNRS UMR 7225, France
- Department of Psychiatry and Behavioral Sciences, Stanford University, United States
- Department of Brain and Cognitive Sciences, University of Rochester, United States
- McConnell Brain Imaging Centre, Montreal Neurological Institute and Hospital, McGill University, Canada
- Day Clinic of Cognitive Neurology, Universitätsklinikum Leipzig, Germany
- MindBrainBody Institute, Berlin School of Mind and Brain, Humboldt-Universität zu Berlin, Germany
- Center for Stroke Research Berlin (CSB), Charité - Universitätsmedizin Berlin, Germany
Figures
Figure 1 with 3 supplements
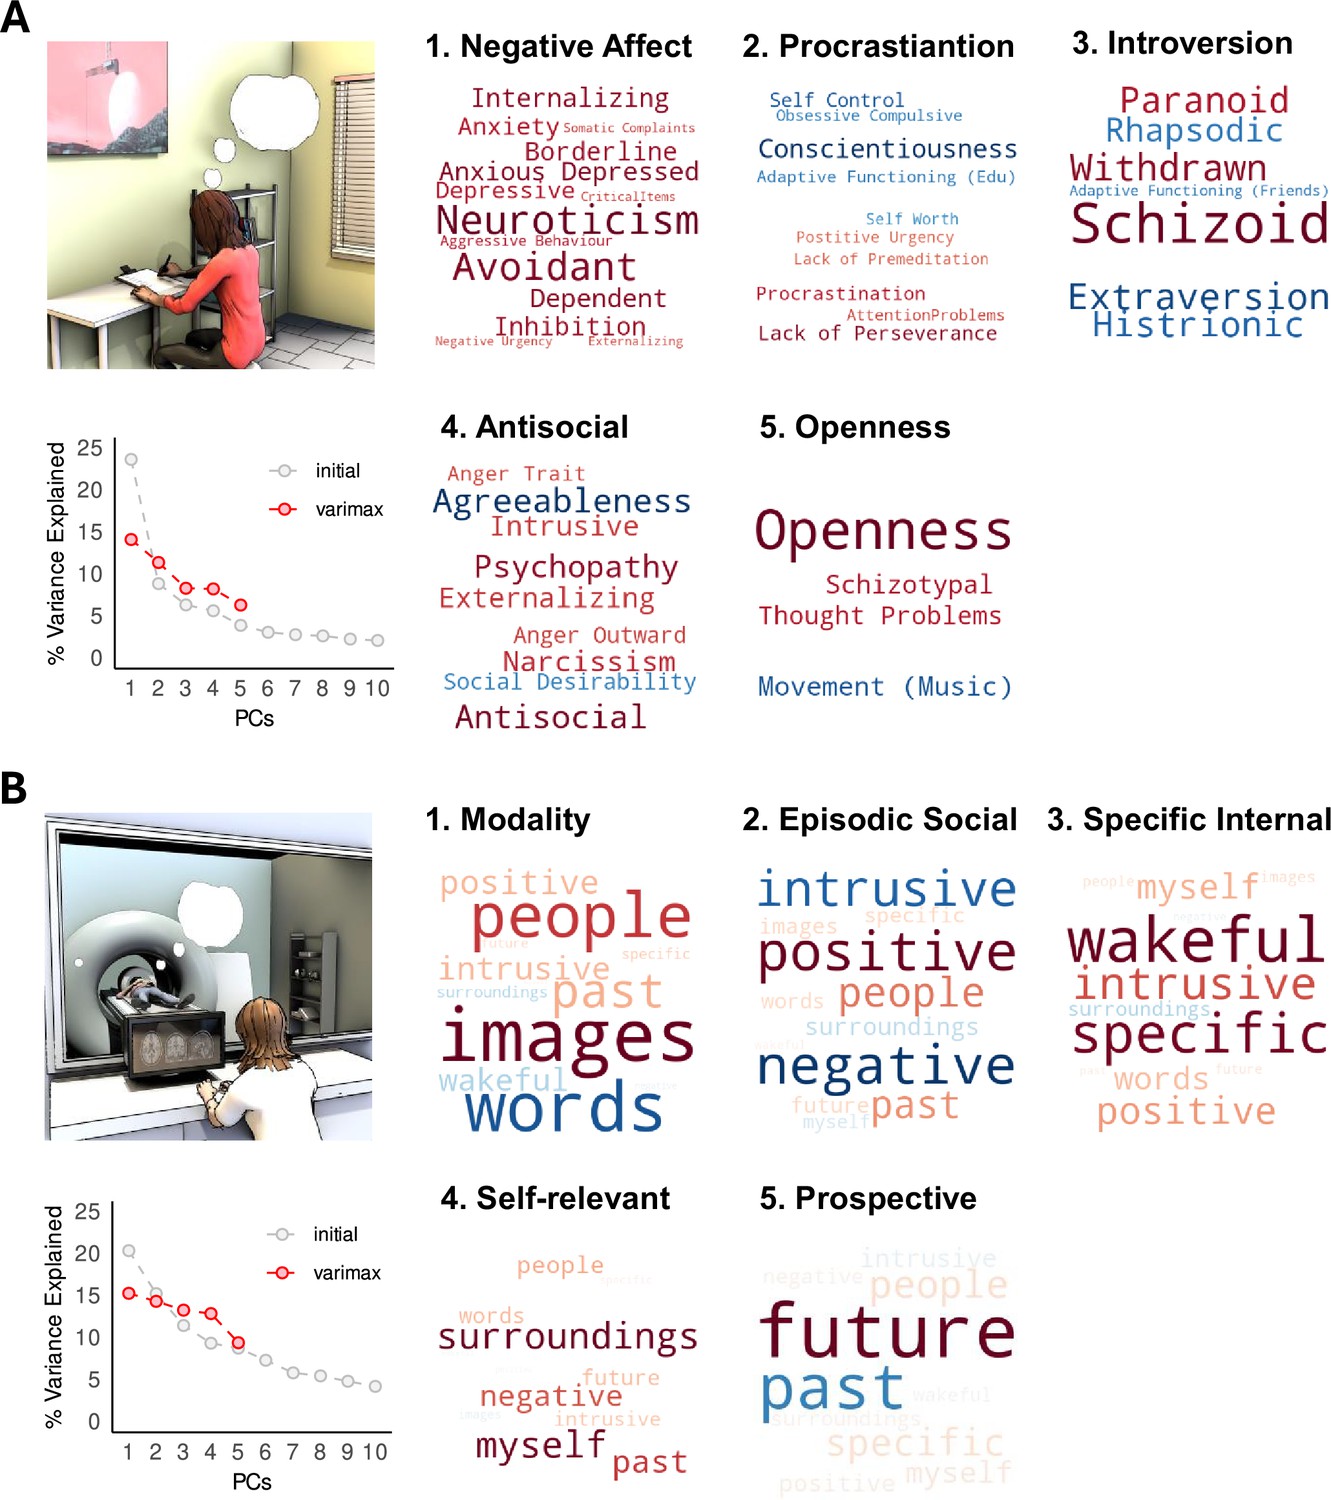
Principal components of traits and thoughts.
(A) First five trait components derived from principal component analysis (PCA) after varimax rotation are represented as word clouds with negative loadings shown in cold colours and positive loadings in warm colours; the relative loading of each variable within a component is represented by the relative font size (see Figure 1—figure supplements 1 and 2 for numerical loading values). In the bottom-left panel, scree plot showing the percentage of trait variance explained by the each of the first 10 components in grey, and the first 5 components after varimax rotation in red. (B) Results of the application of PCA to the multidimensional experience sampling (MDES) data, depicted in the same way.
Figure 1—figure supplement 1
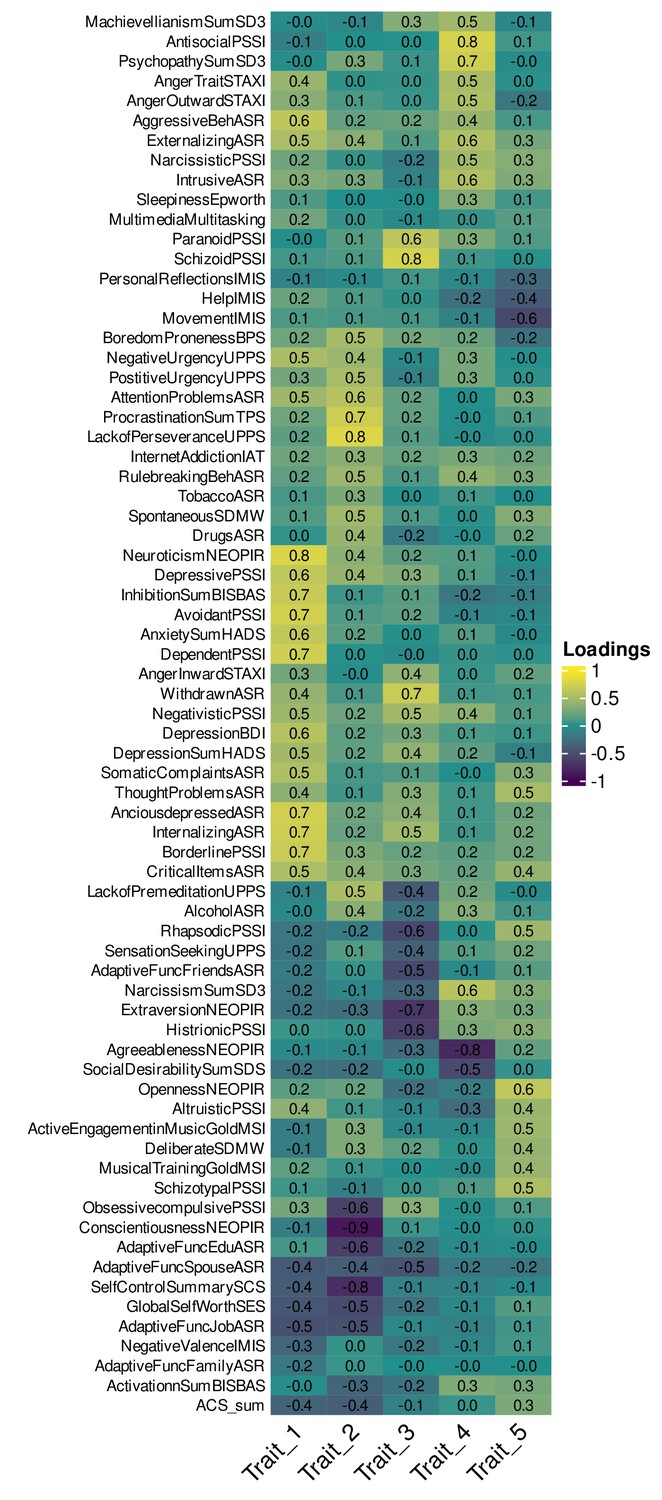
Heatmap showing variable component loadings for the first five principal components derived from trait questionnaires.
Figure 1—figure supplement 2

Heatmap showing variable component loadings for the first five principal components derived from multidimensional experience sampling (MDES).
Figure 1—figure supplement 3

Scatterplots showing the relationship between trait ‘negative affect’ and ‘positive episodic social’ and ‘self-relevant’ thought.
Figure 2 with 1 supplement
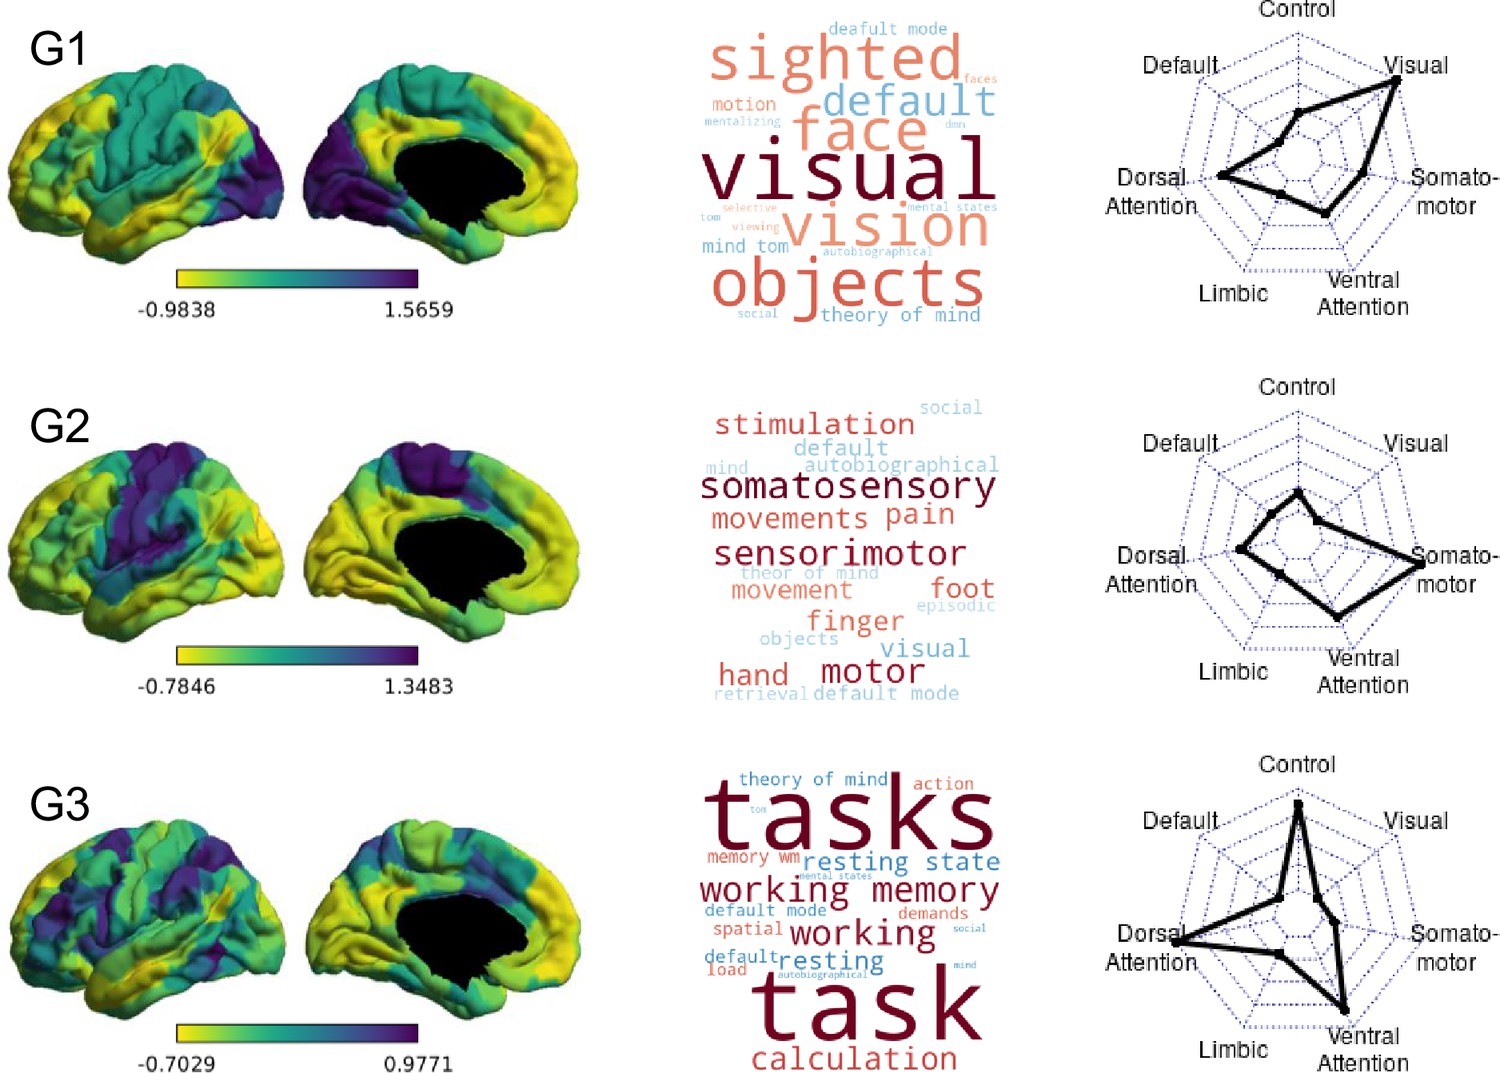
Group-level gradients of functional connectivity.
On the left are the first three group-averaged gradients, represented in left lateral and medial views. Regions with similar whole-brain connectivity profiles are shown in similar colours, with yellow and purple regions indicating most dissimilar connectivity patterns. Loading ranges and directions are arbitrary. In the middle, word clouds representing the top 10 positively (warm colours) and negatively correlated (cold colours) Neurosynth decoding topic terms for each gradient map. The relative strength of correlation is represented by the relative font size. On the right, radar plots showing the Yeo network profile of each group-level gradient depicted in the left column. Each radar plot shows the mean gradient loadings for all parcels within the seven Yeo networks.
Figure 2—figure supplement 1
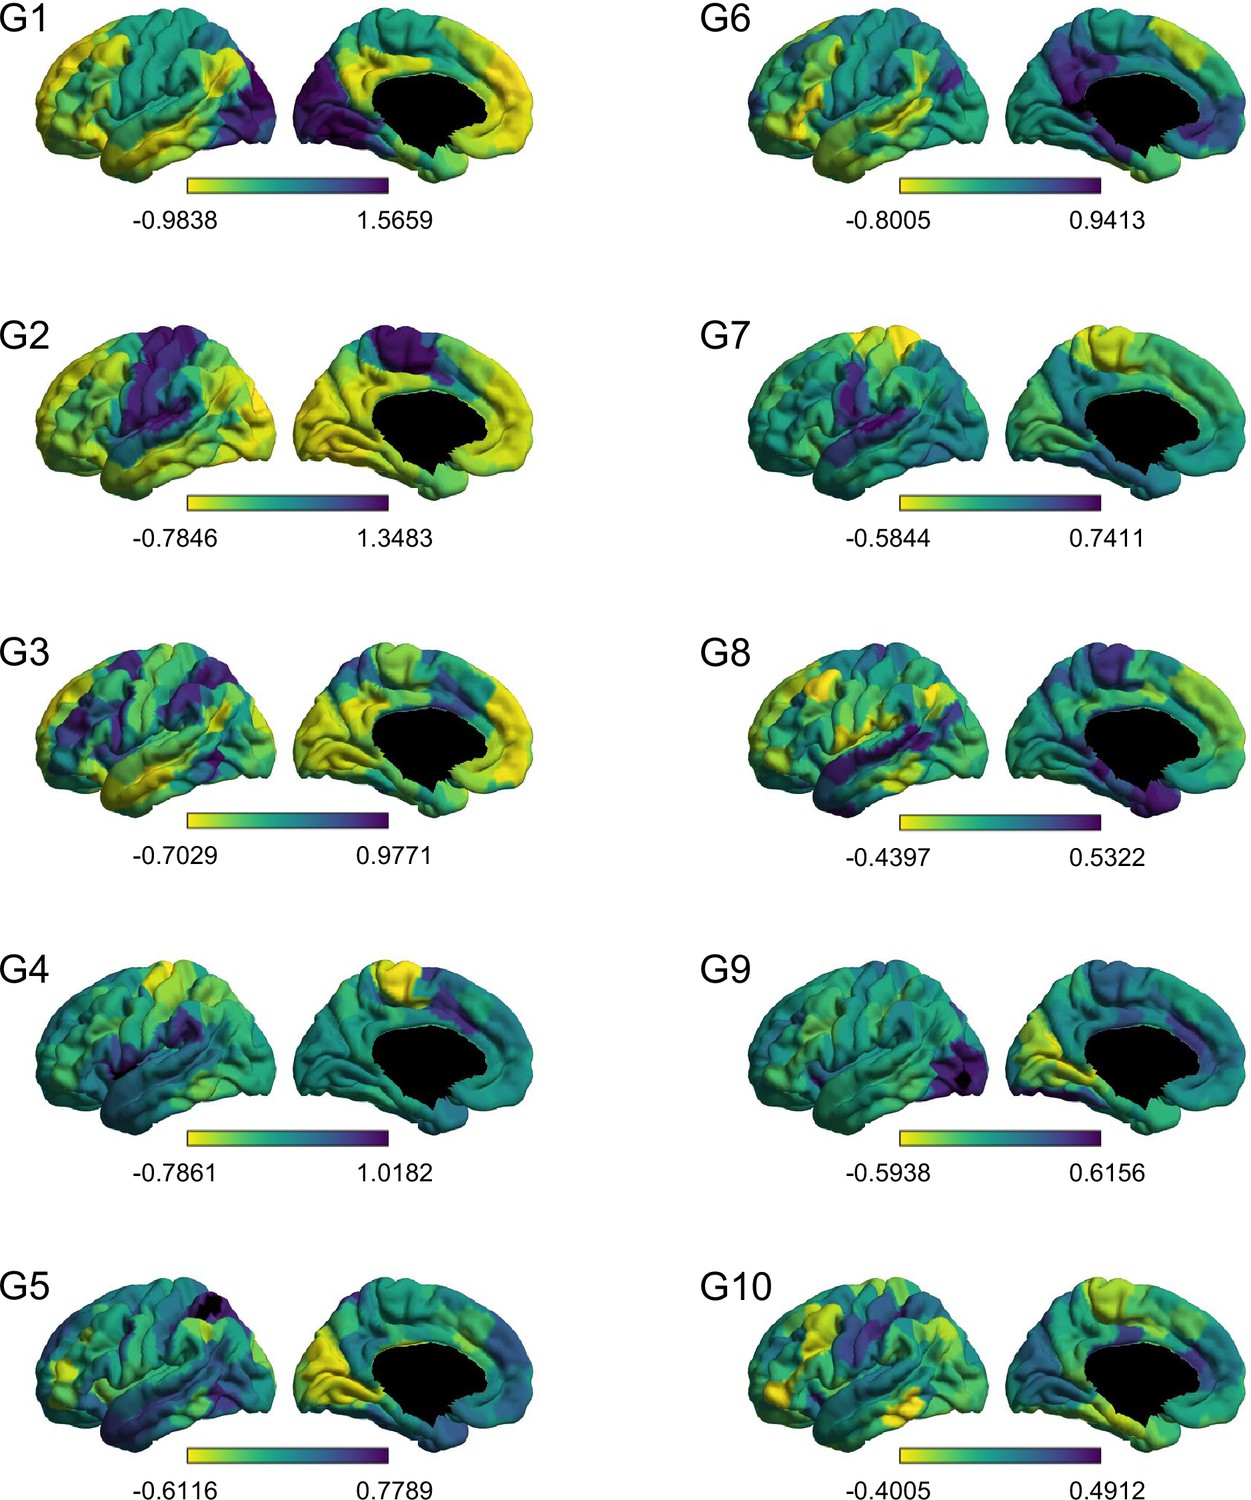
Ten group-level cortical gradients shown from the left lateral and medial views.
Figure 3
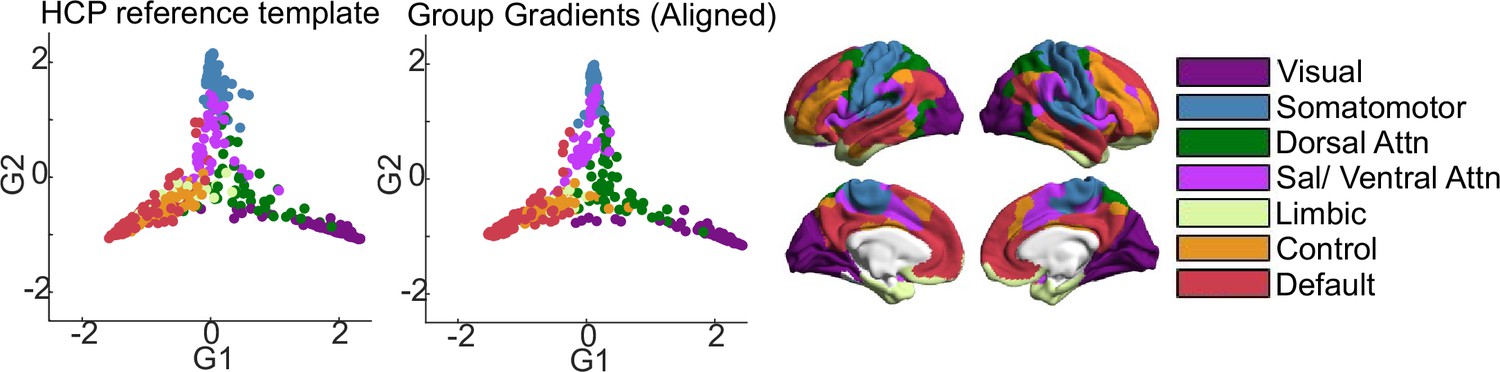
Comparison of group-level gradients to BrainSpace HCP template.
The first scatterplot shows 400 parcel positions along G1 and G2 in the template calculated from the HCP subsample included in BrainSpace toolbox (Vos de Wael et al., 2020). The second scatterplot shows parcel positions in the group-level gradients G1 and G2 after Procrustes alignment to the HCP template. Parcels are colour-coded according to their respective Yeo network. Yeo networks are shown as colour-coded brain maps on the right.
Figure 4
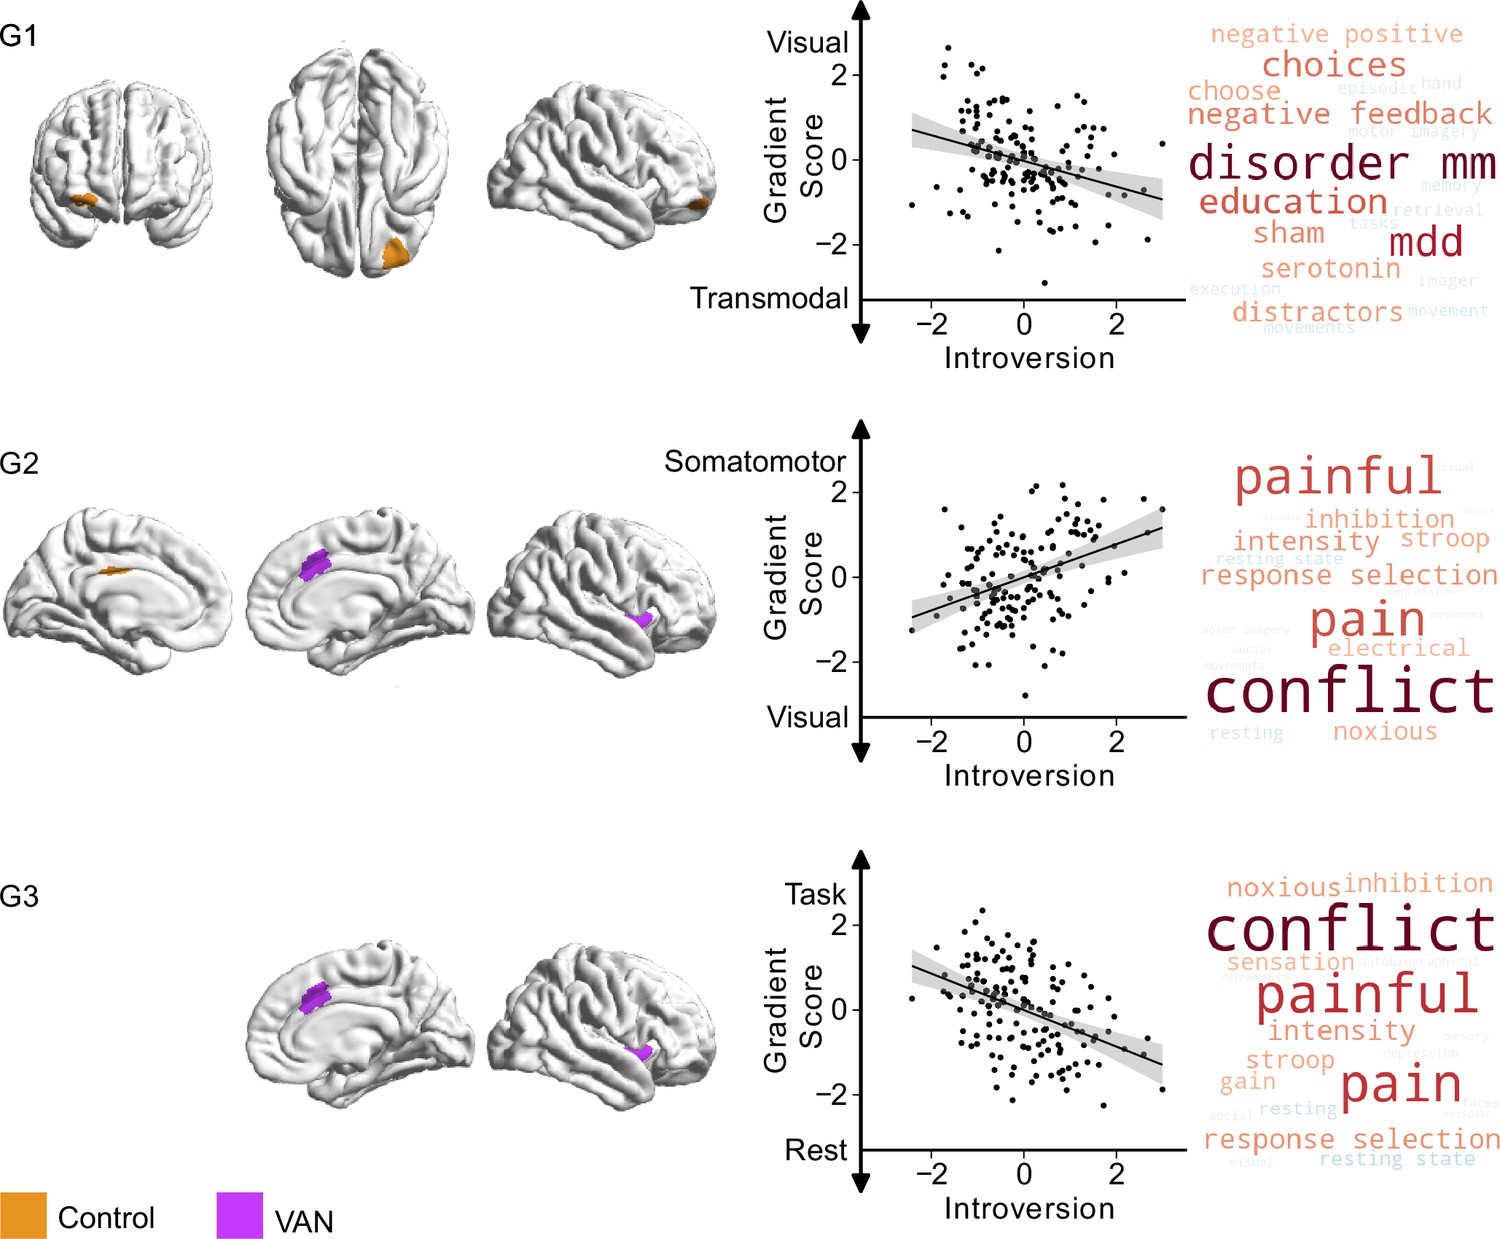
Relationship between trait ‘introversion’ on the first three connectivity gradients.
On the left, parcels within the first three gradients that show significant (pbonf<0.025) differences related to trait ‘introversion’, orange indicating regions within the ‘frontoparietal control network’, and violet indicating regions within the ‘ventral attention network (VAN)’. Scatter plots depict the relationship between individual scores for ‘introversion’ thought (x-axis) and average gradient score of all affected parcels (y-axis) within each gradient. Each datapoint is a participant. Both axes show standardised scores. Detailed results from individual parcels are reported in Table 3. The right column shows Neurosynth decoding of ROI maps of affected parcels within each gradient, showing top 10 positively correlated topic terms in warm colours, and top ten negatively associated topic terms in cold colours.
Figure 5
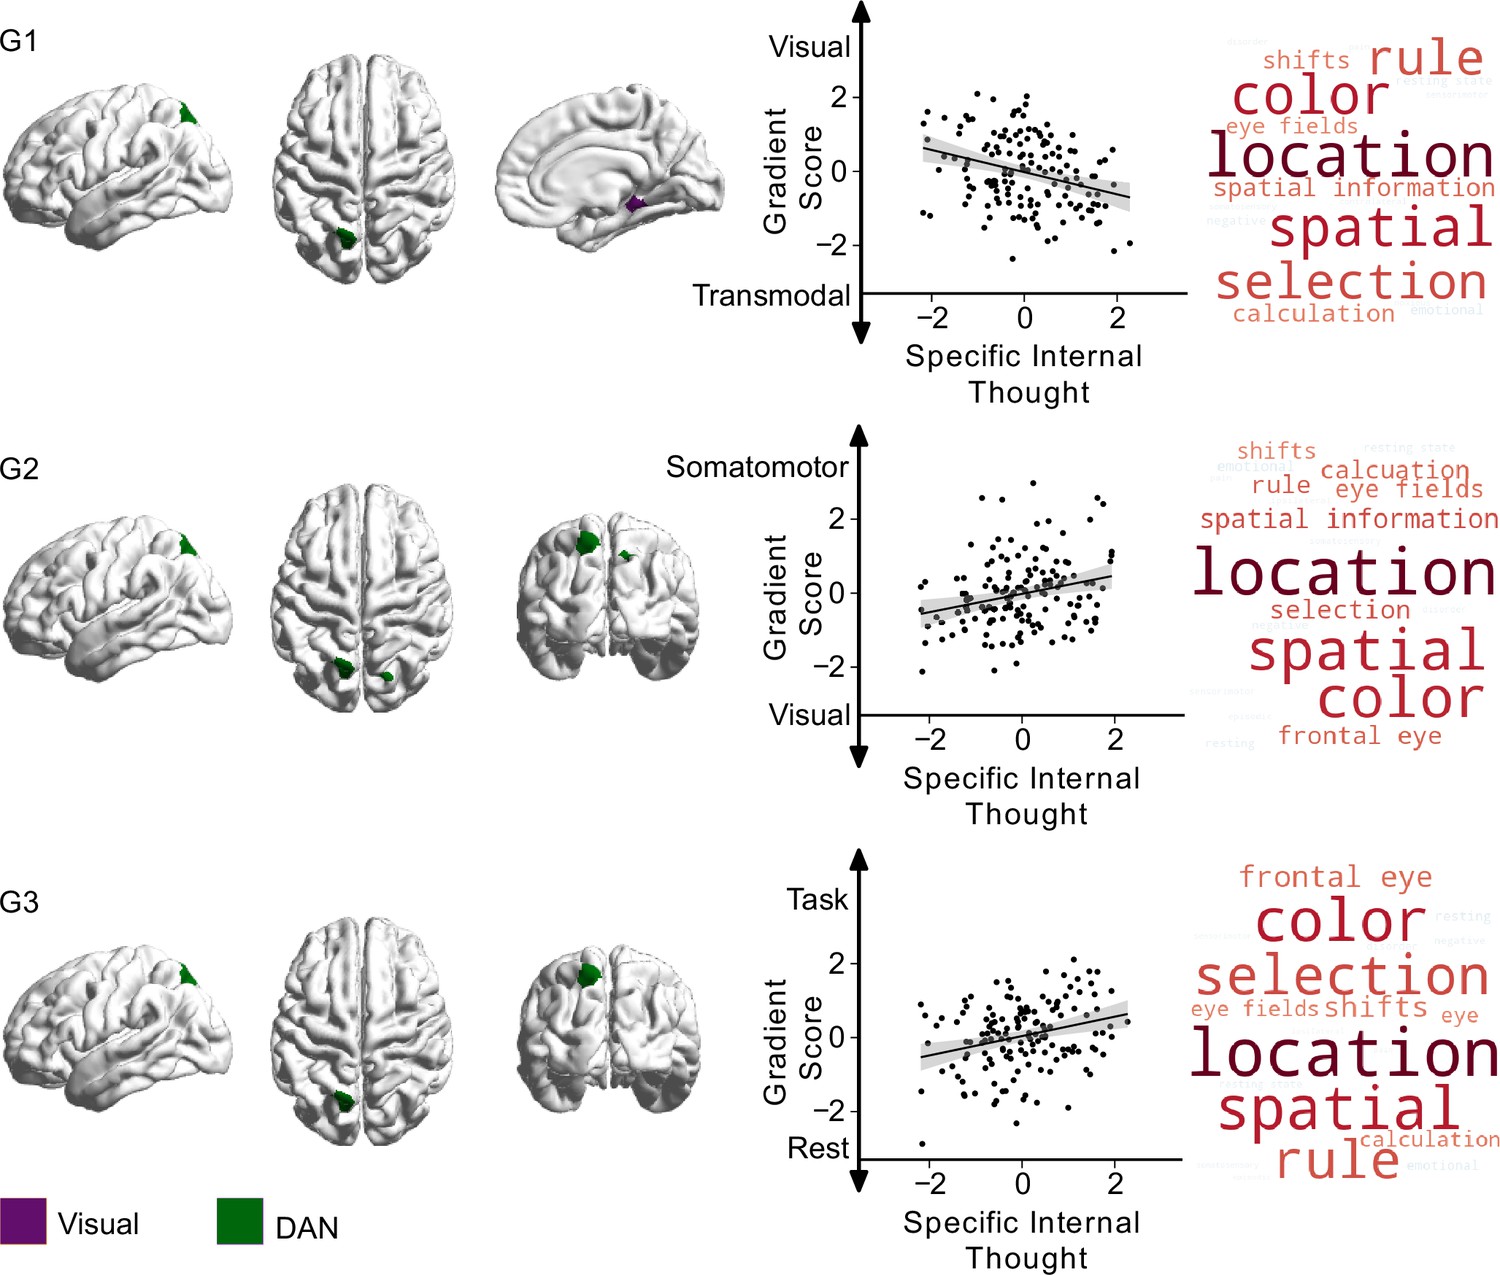
Relationship between specific internal thought and the first three connectivity gradients.
On the left, parcels within the first three gradients that show significant differences (pbonf<0.025) related to ‘specific internal’ thought, green indicating regions within ‘dorsal attention network (DAN)’, and purple indicating regions within the ‘visual network’. Scatter plots depict the relationship between individual scores for ‘specific internal’ thought (x-axis) and average gradient score of all affected parcels (y-axis) within each gradient. Each datapoint is a participant. Both axes show standardised scores. Detailed results from individual parcels are reported in Table 3. The right column shows Neurosynth decoding of ROI maps of affected parcels within each gradient, showing top ten positively correlated topic terms in red, and top 10 negatively associated topic terms in blue.
Tables
Table 1
Multidimensional experience sampling (MDES) statements.
| Dimension | Statement |
|---|---|
| Positive | “My thoughts were positive.” |
| Negative | “My thoughts were negative.” |
| Future | “I thought about future events.” |
| Past | “I thought about past events.” |
| Myself | “I thought about myself.” |
| People | “I thought about other people.” |
| Surroundings | “I thought about my present environment/surrounding.” |
| Wakeful | “I was completely awake.” |
| Images | “My thoughts were in the form of images.” |
| Words | “My thoughts were in the form of words” |
| Specific | “My thoughts were more specific than vague.” |
| Intrusive | “My thoughts were intrusive.” |
Table 2
List of personality/dispositional trait questionnaires.
| Abbreviation | Behavioural measure |
|---|---|
| ACS | Attention Control Scale (Derryberry and Reed, 2002) |
| ASR | Adult Self Report (Achenbach and Rescorla, 2003) |
| BDI-II | Beck Depression Inventory -II (Beck et al., 1993) |
| BIS/BAS | Behavioural Inhibition and Approach System (Carver and White, 1994) |
| BP | Boredom Proneness Scale (Farmer and Sundberg, 1986) |
| ESS | Epworth Sleepiness Scale (Johns, 1991) |
| Gold-MSI | Goldsmiths Musical Sophistication Index (Müllensiefen et al., 2014) |
| HADS | Hospital Anxiety and Depression Scale (Zigmond and Snaith, 1983) |
| IAT | Internet Addiction Test (Young, 1998) |
| IMIS | Involuntary Musical Imagery Scale (Floridou et al., 2015) |
| MMI | Multimedia Multitasking Index (Ophir et al., 2009) |
| NEO PI-R | NEO Personality Inventory-Revised (Costa and McCrae, 2008) |
| PSSI | Personality Style and Disorder Inventory (Kuhl and Kazén, 2009) |
| SCS | Brief Self-Control Scale (Tangney et al., 2004) |
| SDS | Social Desirability Scale-17 (Crowne and Marlowe, 1960) |
| SES | Self-Esteem Scale (O’Malley and Bachman, 1979) |
| SD3 | Short Dark Triad (Jones and Paulhus, 2014) |
| S-D-MW | Spontaneous and Deliberate Mind-Wandering (Carriere et al., 2013; Golchert et al., 2017) |
| STAXI | State-Trait Anger Expression Inventory |
| TPS | Tuckman Procrastination Scale (Tuckman, 2016) |
| UPPS-P | UPPS-P Impulsive Behaviour Scale (Lynam et al., 2006; Schmidt et al., 2008) |
Table 3
Relationships between first three connectivity gradients and introversion and specific internal thought.
| IV | DV | Yeo network | Parcel | t(130) | η2partial | puncorr | pbonf | |
|---|---|---|---|---|---|---|---|---|
| Introversion | G1 | Control | OFC (R) | –4.2214 | 0.11 | 0.00002 | <0.0012 | |
| G2 | VAN | A Ins (L) | 3.7888 | 0.10 | 0.00012 | |||
| A Ins (R) | 4.3110 | 0.12 | 0.00002 | |||||
| Fr Oper (R) | 3.8081 | 0.10 | 0.00011 | |||||
| A Cing (R) | 3.1879 | 0.06 | 0.00090 | |||||
| Control | P Cing (L) | 4.0504 | 0.07 | 0.00004 | ||||
| G3 | VAN | A Ins (L) | –3.9539 | 0.11 | 0.00006 | |||
| A Ins (L) | –3.6784 | 0.09 | 0.00017 | |||||
| A Ins (R) | –4.2031 | 0.13 | 0.00002 | |||||
| Fr Oper (R) | –4.1767 | 0.12 | 0.00003 | |||||
| A Cing (R) | –3.9732 | 0.12 | 0.00006 | |||||
| Specific | G1 | Visual | PHC/ExStr | –2.9105 | 0.05 | 0.00212 | <0.0028 | |
| internal | DAN | SPL (L) | –4.5433 | 0.12 | 0.00001 | |||
| thought | G2 | DAN | SPL (L) | 4.1217 | 0.09 | 0.00003 | ||
| SPL (R) | 3.3542 | 0.09 | 0.00052 | |||||
| G3 | DAN | SPL (L) | 4.4548 | 0.10 | 0.00001 | |||
-
Results reported in the table are from univariate (single-gradient) follow-up tests for parcels showing a significant effect for each IV at the multivariate (three-gradient) level. Univariate tests are Bonferroni corrected for the total number of parcels (all three gradients) where tests were performed (21 parcels for introversion, 9 for specific internal thought).
-
IV = independent variable; DV = dependent variable; G = gradient; VAN = ventral attention network; DAN = dorsal attention network; OFC = orbitofrontal cortex; A = anterior; P = posterior; Fr = frontal; Ins = insula; L = left; R = right; Oper = operculum; Cing = cingulate cortex; PHC = parahippocampal cortex; ExStr = extrastriate cortex; SPL = superior parietal lobule.
Additional files
Download links
A two-part list of links to download the article, or parts of the article, in various formats.
Downloads (link to download the article as PDF)
Open citations (links to open the citations from this article in various online reference manager services)
Cite this article (links to download the citations from this article in formats compatible with various reference manager tools)
Macro-scale patterns in functional connectivity associated with ongoing thought patterns and dispositional traits
eLife 13:RP93689.
https://doi.org/10.7554/eLife.93689.3


