Aberrant hippocampal Ca2+ microwaves following synapsin-dependent adeno-associated viral expression of Ca2+ indicators
- University of Bonn, Faculty of Medicine, Institute for Experimental Epileptology and Cognition Research (IEECR), Germany
- University Hospital Bonn, Germany
- Department of Epileptology, University Hospital Bonn, Germany
- Neuroimmunology and Imaging Group, German Center for Neurodegenerative Diseases (DZNE), Germany
- NeuroTechnology Center, Columbia University, United States
- Brain Research Institute, University of Zurich, Switzerland
- Neuroscience Center Zurich, University of Zurich, Switzerland
- German Center for Neurodegenerative Diseases (DZNE), Germany
Figures
Figure 1
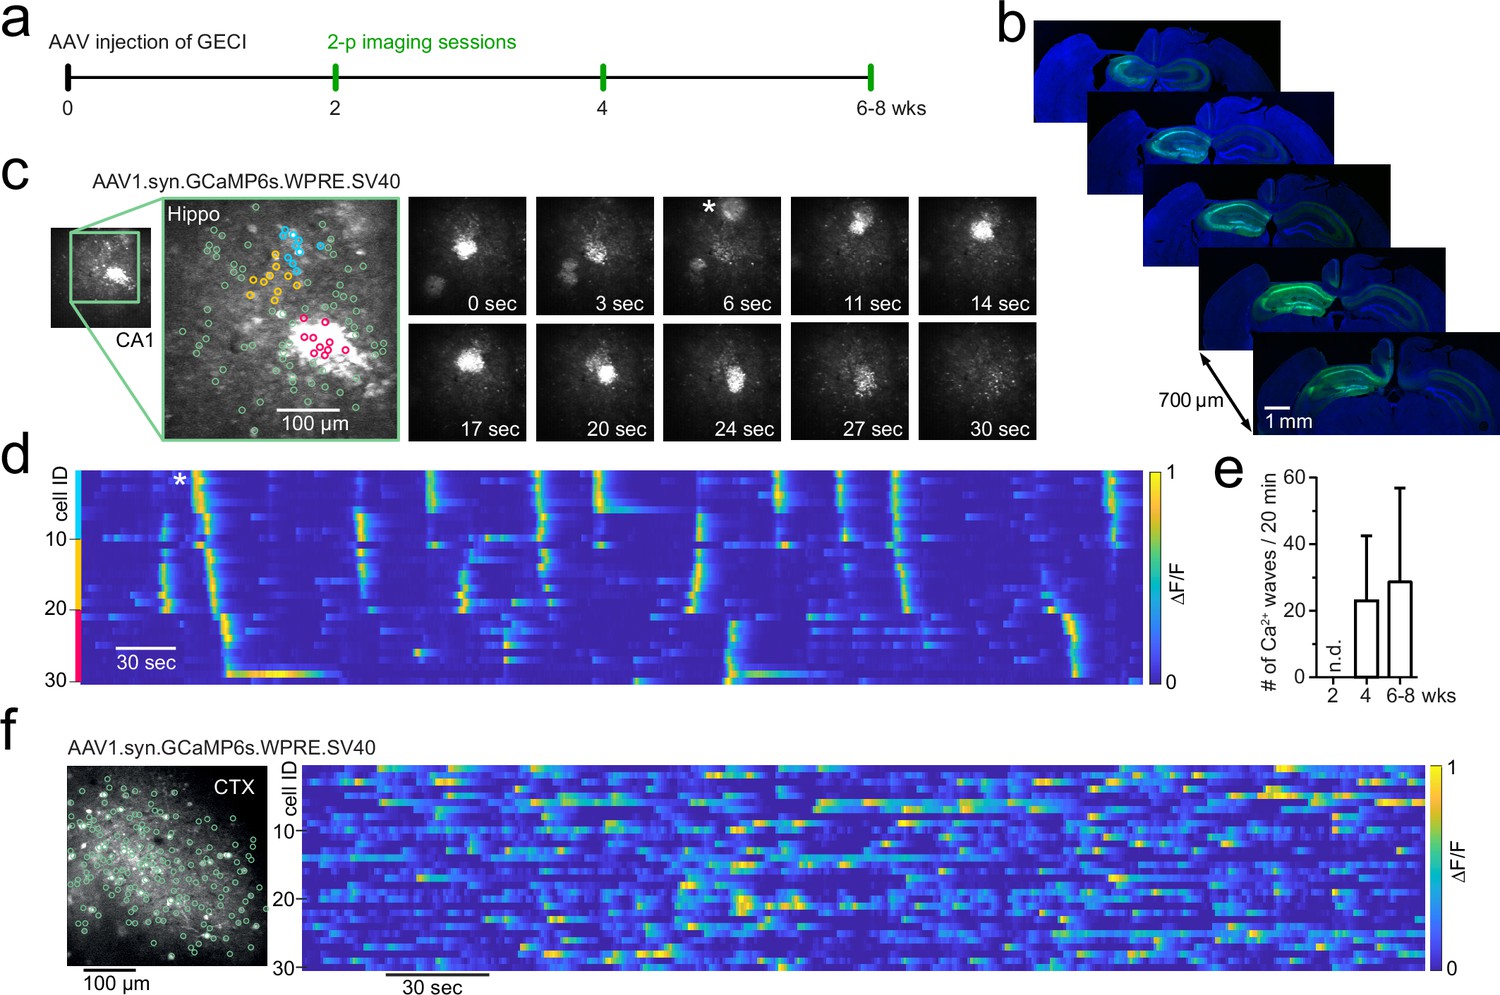
Development of Ca2+ microwaves travelling through hippocampus following GCaMP transduction.
(a) Experimental protocol to examine CA1 neuronal activity using two-photon imaging following adeno-associated viral (AAV) transduction of genetically encoded Ca2+ indicators. (b) Immunohistochemical sections following the last imaging session. GCaMP6s (AAV1.syn.GCaMP6s.SV40, Addgene #100843) expression throughout the ipsilateral hippocampus and projection pathways in the contralateral hippocampus. (c) Two-photon Ca2+ imaging of field of view (FOV) in CA1 at 4 wk post-injection (p.i.) showing aberrant Ca2+ microwaves (see also Video 1). Magnified inset shows three coloured neuronal subgroups (blue, orange, magenta) based on their spatial vicinity from a total population of 100 identified neurons (green). Right: time series of two-photon Ca2+ imaging FOVs showing two Ca2+ microwaves, the first at 0 s, the second appearing at 6 s (asterisk). The second wave progresses through FOV over dozens of seconds. (d) Raster plot of individual neuronal Ca2+ activity (ΔF/F, 1 min moving window, traces max-normalized per neuron) from neighbouring subgroups (colours correspond to c). Asterisk (same as in c): a Ca2+ microwave advances through neighbouring neuronal subgroups. (e) Occurrence rate (mean ± 95% CI) of aberrant Ca2+ microwaves with increasing expression time, following viral transduction of AAV1.syn.GCaMP6s.SV40 in mature C57BL/6 wildtype animals (n=4). n.d. = none detected. (f) Two-photon Ca2+ imaging FOV in the visual cortex at 6 wk p.i. (left) with normal sparse spontaneous Ca2+ activity and no detected Ca2+ microwaves (right; raster plot of ΔF/F, 1 min moving window, traces max-normalized per neuron).
Figure 2
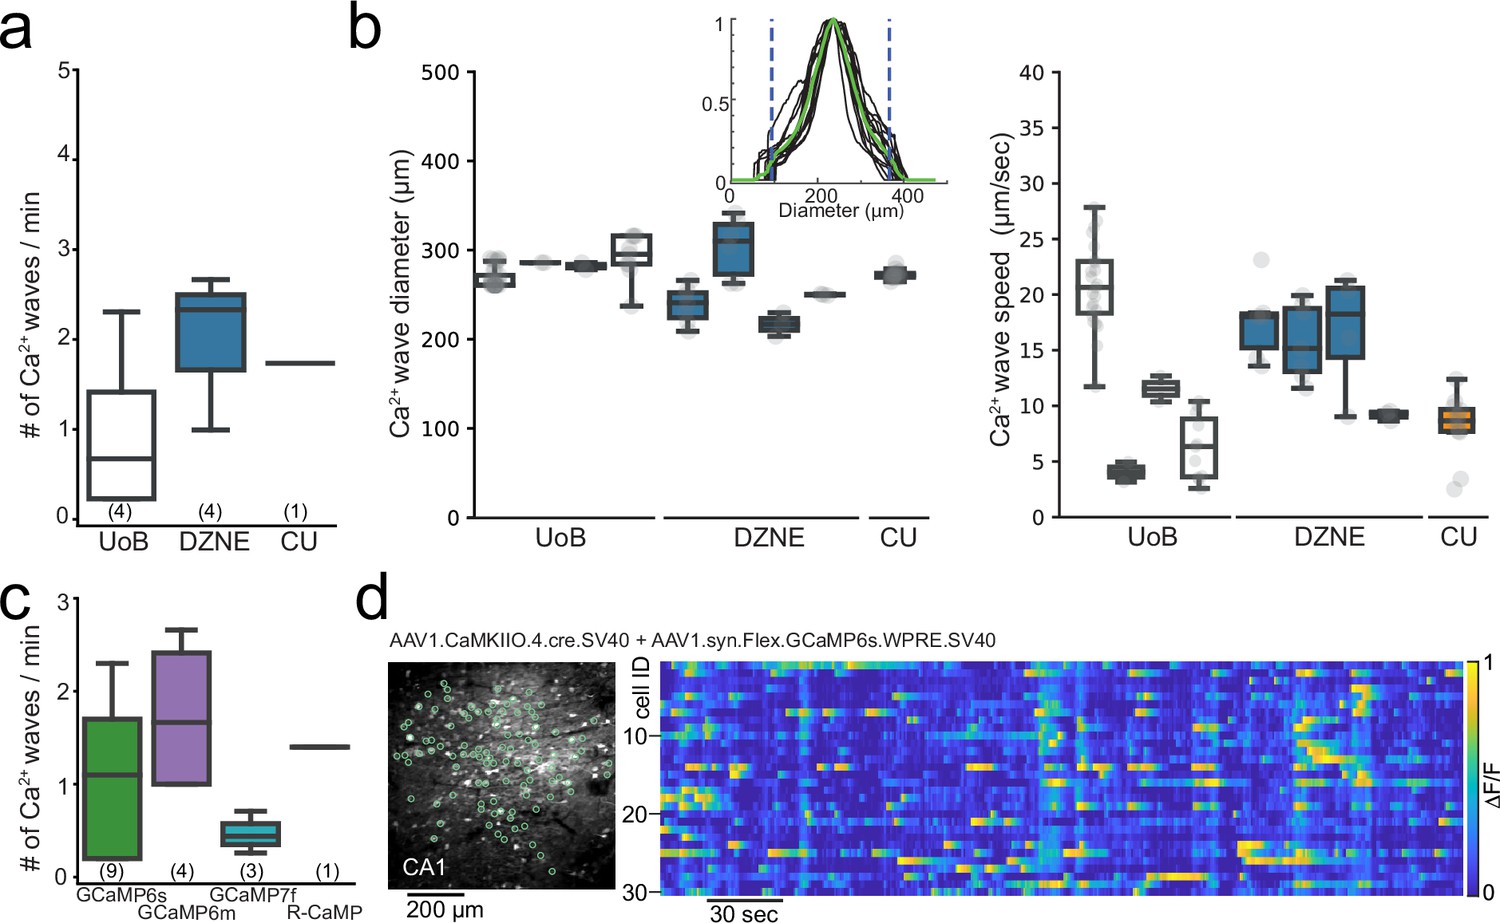
Aberrant Ca2+ microwaves are consistent across laboratories and genetically encoded calcium indicator (GECI) variant.
(a) Boxplot (median ± quartiles and range) of the occurrence rate of aberrant Ca2+ microwaves in CA1 at the different institutes at 6–8 wk after injection of GCaMP6s or GCaMP6m (number of animals in parenthesis). (b) Boxplots (median ± quartiles and range) of Ca2+ microwave diameters (left) and progression speed (right) in CA1 from each animal recorded across institutes. Inset: histogram of fluorescent intensity taken across each Ca2+-wave within an animal. Green line is the average, areas outside dashed lines mark 10% lowest fluorescence values, which were excluded from analysis. (c) Boxlot (median ± quartiles and range) of the occurrence rate of aberrant Ca2+ microwaves in CA1 following injection with commonly used GECIs (number of animals in parenthesis; see Table 1). (d) Two-photon Ca2+ imaging field of view (FOV) (left) in hippocampal CA1 following dual injection approach for conditional GCaMP6s expression (6 wk post-injection [p.i.]) with normal sparse spontaneous Ca2+ activity and no detection of Ca2+ microwaves (right; raster plot of ΔF/F, 1 min moving window, traces max-normalized per neuron).
Author response image 1

Plot of Ca2+ micro-wave frequency (left: number of Ca2+ waves/min) or occurrence (right: yes/no) against the animal age at the time of viral injection.
Blue line is linear (left) or logistic (right) fit to the data with 95% confidence level.
Videos
Video 1
GCaMP6s two-photon calcium imaging in the hippocampal CA1 region, around 100 µm beneath the hippocampal surface (stratum pyramidale), FOV ~600x600 µm, ~4 wk after transduction of AAV1 particles containing pAAV.Syn.GCaMP6s.WPRE.SV40 (Addgene plasmid #100843) in a mature bl6 wildtype mouse.
Imaging wavelength = 940 nm, acquisition speed = 15 frames/s. Movie played at ×5 acquisition speed. Imaging was performed at the IEECR/University of Bonn.
Video 2
GCaMP6s two-photon calcium imaging in the hippocampal CA1 region, around 100 µm beneath the hippocampal surface (stratum pyramidale), FOV ~450x450 µm, ~7 wk after transduction of AAV1 particles containing pAAV.Syn.GCaMP6s.WPRE.SV40 (Addgene plasmid #100843) in an ~3-month-old transgenic mouse (same as in Video 2; Scn2aA263V model of genetic epilepsy).
Imaging wave length = 940 nm, acquisition speed = 15 frames/s. Movie played at ×5 acquisition speed. Imaging was performed at the IEECR/University of Bonn.
Video 3
Same animal (Scn2aA263V model of genetic epilepsy) and time point of imaging as in Video 4.
GCaMP6s two-photon calcium imaging in the hippocampal CA1 region, around 25 µm beneath the hippocampal surface (stratum oriens), FOV ~350x350 µm, ~7 wk after transduction of AAV1 particles containing pAAV.Syn.GCaMP6s.WPRE.SV40 (Addgene plasmid #100843). Imaging wavelength = 940 nm, acquisition speed = 15 frames/s. Movie played at ×5 acquisition speed. Imaging was performed at the IEECR/University of Bonn.
Video 4
GCaMP6s two-photon calcium imaging in the hippocampal CA1 region, around 100 µm beneath the hippocampal surface (stratum pyramidale), FOV ~450x450 µm, ~2 wk after transduction of AAV1 particles containing pAAV.Syn.GCaMP6s.WPRE.SV40 (Addgene plasmid #100843) in an ~2-month-old transgenic mouse model of genetic epilepsy (heterozygous Scn2aA263V mouse).
Imaging wavelength = 940 nm, acquisition speed = 15 frames/s. Movie played at ×5 acquisition speed. Imaging was performed at the IEECR/University of Bonn.
Video 5
R-CaMP1.07 two-photon calcium imaging in the hippocampal CA1 region, around 100 µm beneath the hippocampal surface (stratum pyramidale), FOV ~200x200 µm, ~10 wk after transduction of AAV1 particles containing ssAAV-9/2-hSyn1-chI-RCaMP1.07-WPRE-SV40p(A) (Viral Vector Core UZH #V224-9) in a mature (~5 mo) bl6 wildtype mouse.
Imaging wavelength = 960 nm, acquisition speed = 30.88 frames/s. Movie played at ×5 acquisition speed. Imaging was performed at the Neuroscience Center Zurich (UZH).
Video 6
GCaMP6s two-photon calcium imaging in the hippocampal CA3 region, stratum pyramidale, FOV ~600x600 µm, ~7 wk after transduction of AAV1 particles containing pAAV.Syn.GCaMP6s.WPRE.SV40 (Addgene plasmid #100843) in a mature bl6 wildtype mouse.
Imaging wavelength = 940 nm, acquisition speed = 30.206 frames/s. Movie played at ×5 acquisition speed. Imaging was performed at Columbia University.
Tables
Table 1
Viruses used for the expression of genetically encoded calcium indicators (GECIs).
Viral titre is from Addgene documentation and was used at original concentration (dilution of 1:1) or at a dilution of 1:2. Syn.Flex.GCaMP6s and CamKII0.4.Cre were co-injected and therefore diluted to 1:2. Two-photon Ca2+ imaging was performed from 2 wk after injection in the hippocampus (CA1, CA3, or DG) or neocortex (Ctx). Ca2+ microwave incidence was determined from the number of animals exhibiting Ca2+ microwaves at the specified time point and region.
| AAV | Construct | Source(Addgene id) | Original titre(vg/ml) | Dilution | Injection volume | Post-injection(wk) | Region | Ca2+-wave incidence (%) | n | Mouse model | Institute |
|---|---|---|---|---|---|---|---|---|---|---|---|
| AAV1 | Syn.GCaMP6s | 100843 | 1 × 10¹³ | 1:1 | 0.5 | 2 | CA1 | 0 | 0/4 | wt | UoB |
| AAV1 | Syn.GCaMP6s | 100843 | 1 × 10¹³ | 1:1 | 0.5 | 4–6 | CA1 | 100 | 4/4 | wt | UoB |
| AAV1 | Syn.GCaMP6s | 100843 | 1 × 10¹³ | 1:1 | 0.5 | 2 | CA1 | 20 | 1/5 | Scn2a* | UoB |
| AAV1 | Syn.GCaMP6s | 100843 | 1 × 10¹³ | 1:1 | 0.5 | 4–8 | CA1 | 100 | 5/5 | Scn2a* | UoB |
| AAV1 | Syn.GCaMP6m | 100841 | 1 × 10¹³ | 1:1 | 1 | 8 | CA1 | 80 | 4/5 | wt | DZNE |
| AAV1 | Syn.GCaMP6m | 100841 | 1 × 10¹³ | 1:2 | 1 | 6 | CA1 | 43 | 3/7 | wt | DZNE |
| AAV1 | Syn.GCaMP6s | 100843 | 1 × 10¹³ | 1:2 | 0.5 | 4–10 | DG | 0 | 0/3 | wt | UoB |
| AAV9 | Syn.jGCaMP7f | 104488 | 2.5 × 10¹³ | 1:2 | 1 | 10–14 | CA1 | 50 | 3/6 | APPswe† | DZNE |
| AAV1 | Syn.GCaMP6s | 100843 | 1 × 10¹³ | 1:1 | 0.25 | 3–12 | CA3 | 100 (1 exp.) | 1/1 | wt | CU |
| AAV1 | Syn.GCaMP6s | 100843 | 1 × 10¹³ | 1:1 | 0.25 | 3–5 | CA1 | 100 (1 exp.) | 1/1 | wt | CU |
| AAV1 | Syn.GCaMP6s | 100843 | 1 × 10¹³ | 1:2 | 0.8 | 4–5 | Ctx | 0 | 0/>20 0/>20 | wt | CU |
| AAV1 | Syn.GCaMP6f | 100837 | 7 × 10¹² | 1:2 | 0.75 | 3–6 | Ctx | 0 | wt | CU | |
| AAV9 | hSyn1.R-CaMP1.07 | V224-9 ‡ | 4.3 × 10¹² | 1:1 | 0.2 | 8 | CA1 | 100 | 2/2 | wt | UZH |
| AAV1 | syn.Flex.GCaMPm | 100838 | 1 × 10¹³ | 1:2 | 0.5 | 34–38 | CA1 | 0 | 0/3 | wt | DZNE |
| AAV9 | CamKII0.4.Cre.SV40 | 105558 | 1 × 10¹³ | 1:2 | |||||||
| AAV1 | syn.Flex.GCaMP6s | 100845 | 1 × 10¹³ | 1:2 | 0.5 | 6 | CA1 | 0 | 0/2 | wt | UoB |
| AAV1 | CamKII0.4.Cre.SV40 | 105558 | 1 × 10¹³ | 1:2 |
-
*
In heterozygous Scn2aA263V mice.
-
†
In PV-Cre::APPswe/PS1dE9 mice.
-
‡
Sourced from the Viral Vector Facility University of Zurich (VVF/UZH).
Table 2
Viral constructs used.
| Resources table | ||||
|---|---|---|---|---|
| Genetic reagent (Mus musculus) | Recombinant DNA reagent | AAV | Source | ID |
| Syn.GCaMP6s | Syn.GCaMP6s.WPRE.SV40 | AAV1 | Addgene | 100843 |
| Syn.GCaMP6m | Syn.GCaMP6m.WPRE.SV40 | AAV1 | Addgene | 100841 |
| Syn.jGCaMP7f | Syn-jGCaMP7f-WPRE | AAV9 | Addgene | 104488 |
| Syn.GCaMP6f | Syn.GCaMP6f.WPRE.SV40 | AAV1 | Addgene | 100837 |
| hSyn1.R-CaMP1.07 | hSyn1-chI-RCaMP1.07-WPRE-SV40p(A) | AAV9 | VVF/UZH | V224-9 |
| syn.Flex.GCaMP6s | Syn.Flex.GCaMP6s.WPRE.SV40 | AAV1 | Addgene | 100845 |
| syn.Flex.GCaMP6m | Syn.Flex.GCaMP6m.WPRE.SV40 | AAV1 | Addgene | 100838 |
| CamKII0.4.Cre.SV40 | CamKII 0.4.Cre.SV40 | AAV1 or 9 | Addgene | 105558 |
Additional files
Download links
A two-part list of links to download the article, or parts of the article, in various formats.
Downloads (link to download the article as PDF)
Open citations (links to open the citations from this article in various online reference manager services)
Cite this article (links to download the citations from this article in formats compatible with various reference manager tools)
Aberrant hippocampal Ca2+ microwaves following synapsin-dependent adeno-associated viral expression of Ca2+ indicators
eLife 13:RP93804.
https://doi.org/10.7554/eLife.93804.3


