Location, location, location: Protein kinase nanoclustering for optimised signalling output
- Clem Jones Centre for Ageing Dementia Research, Queensland Brain Institute, The University of Queensland, Australia
- Frazer Institute, The University of Queensland, Australia
- School of Biomedical Sciences, The University of Queensland, Australia
Figures
Figure 1
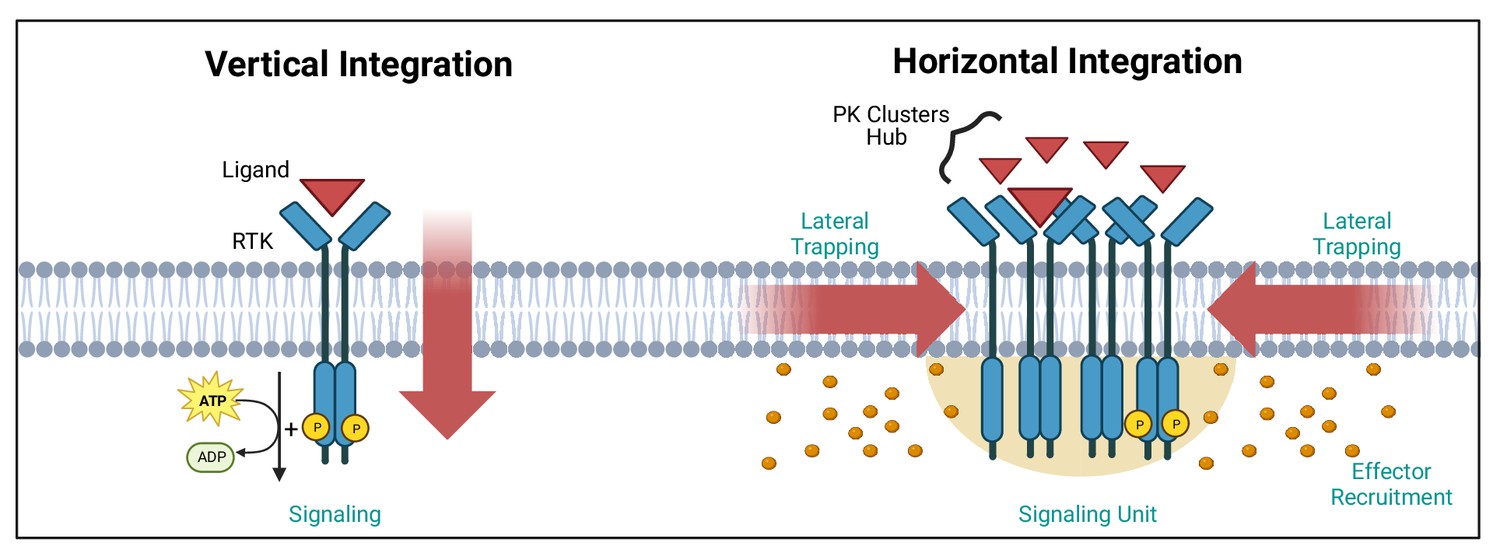
Vertical and horizontal integration of the signal.
Protein kinase (PK) activation is classically described as the result of an extracellular ligand (red triangle) binding to a plasma membrane receptor (e.g. receptor tyrosine kinase [RTK]) and activating PKs and downstream effectors (orange circles). This vertical integration of the signal has recently been refined to include horizontal integration with the realisation that some PKs organise into nanloclusters. At the plasma membrane, this horizontal integration occurs via lateral trapping and nanocluster formation of inherently diffusible receptors (and their associated PKs), which gives rise to signalling ‘hubs’ or ‘units’. We have exemplified these two concepts using RTKs. Created with https://www.biorender.com/.
Figure 2

Super-resolution microscopy techniques.
Selective labelling of proteins with antibodies or tagging with fluorescent proteins allowed their direct visualisation by light microscopy. However, the identification of small cellular structures has been limited by the diffraction limit of light. Only the implementation of super-resolution imaging efficiently solved this limitation. There are three main super-resolution approaches. In STED microscopy, the focused excitation light is combined with a depletion doughnut-shaped beam, decreasing PSF size to a volume smaller than the diffraction limit. Scanning the sample with an excitation light aligned with STED light beam allows the creation of super-resolved images. In SIM, the sample is imaged with a grid-like pattern of light. The interference patterns between the sample and the illumination grid create Moiré fringes. Multiple images are obtained with varying phase shifts of the patterned light, which are used to reconstruct a sub-diffraction image. In SMLM, the precise position of individual emitting molecules is obtained by fitting their intensity profile to a Gaussian model of the PSF. Acquisition of single localisations depends on the low density and stochastic excitation of emitters. Single localisations are then combined to reconstruct the super-resolved image. In live cells, SPT, single-molecule trajectory reconstructions can be achieved by tracking the individual detections of a single fluorophore across the acquisition window in living samples. Abbreviations: STED, stimulated emission depletion; PSF, point spread function; SIM, structured illumination microscopy; SMLM, single-molecule localisation microscopy; STP, single-particle tracking. Created with https://www.biorender.com/.
Figure 3
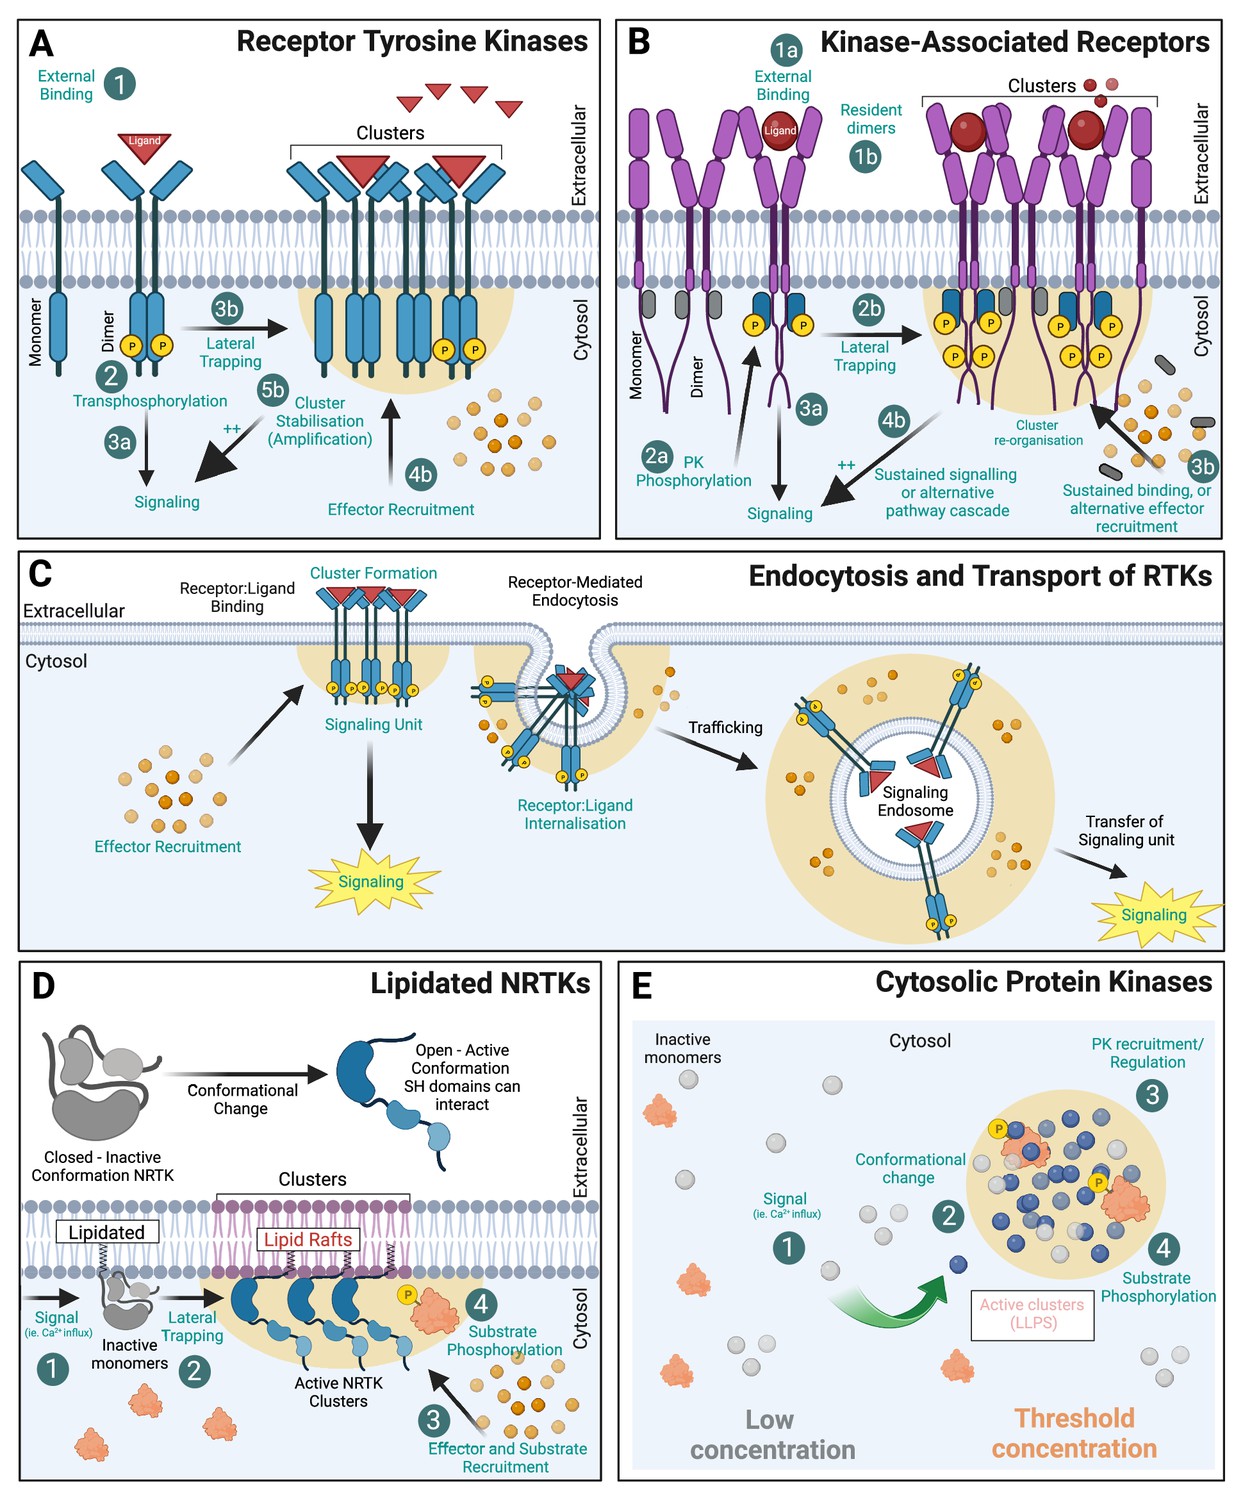
Protein kinase (PK) clustering mechanisms.
(A) Receptor tyrosine kinases (RTKs) with intrinsic kinase activity exist at the membrane as both monomers and dimers. Upon ligand binding, trans-phosphorylation of the receptor initiates downstream signalling cascades. The formation of receptor kinase clusters (by lateral trapping) also promotes associated hubs of ligands (red triangles) and effectors (orange circles) that amplify the signal. (B) Kinase-associated receptors (e.g. cytokine receptors) rely on non-receptor PKs to associate to their intracellular domains and activate signalling cascades. Many act through dimerisation (1 ligand:2 receptor) and induced conformational change within their intracellular domain (ICD) allowing PK transphosphorylation (grey 'inactive’, blue 'active’) and subsequent effector recruitment. (C) RTKs undergo receptor-mediated endocytosis and endocytic trafficking. Signalling endosomes can continue to signal during transport thereby transferring the ‘signalling hub’ to its subcellular destination. (D) Non-receptor tyrosine kinases (NRTKs) can be post-translationally modified via lipidation (myristoylated or palmitoylated) allowing association with membranes. Many of these PKs are allosteric in nature and require a signal (such as Ca2+) to alter their conformation and allow subsequent interaction with their substrates. For many, N-terminal myristylation mediates PK association to lipid rafts where they are more active. (E) Cytosolic PKs can also compartmentalise into biomolecular condensates (BMCs) which are membraneless compartments, formed via liquid–liquid phase separation (LLPS). Created with https://www.biorender.com/.
Figure 4

Examples of cellular nanoscale organisation of protein kinases.
re(A) Representative sptPALM images of growth hormone receptor tagged with mEos2 fluorescent protein (GHR-Δ1(FL)-mEos2) expressed in HEK293 cells. Cells were incubated with human growth hormone (hGH) during the imaging. The panels show the high-resolution intensity map (Intensity), the diffusion coefficient map (Diffusion coefficient), where warmer colours represent lower mobility, and the trajectory map (Trajectories) where warmer tracks appear later in the acquisition. Images modified from Figure 6R-T of Chhabra et al., 2023. (B) Representative sptPALM images of Fyn-mEos2. The panels show the low-resolution epifluorescence image of a hippocampal neuron expressing Fyn-mEos2 (green) and mCardinal (red) acquired before the photoconversion of mEos2 molecules. The inset is shown at higher magnification in the right panel, where trajectories of single Fyn-mEos2 molecules can be observed. SptPALM imaging and analysis was performed in Martínez-Mármol et al., 2023b. (C) Representative sptPALM images of Fyn-mEos2 (left panel) or Fyn-Y531F-mEos2 (right panel) forming nanoclusters in dendritic spines. NASTIC analysis was used for the spatiotemporal distribution of single Fyn-mEos2 trajectories into nanoclusters. Individual trajectories were coloured based on their instant diffusion coefficients (Deff), with more immobile trajectories depicted in light colours and more mobile trajectories in dark colours. Panel modified from Figure 3B and C in Martínez-Mármol et al., 2023b. (D) Representative sptPALM images of CamKIIα-mEos2 in neurons. Single CamKIIα-mEos2 localisations were plotted into a diffusion coefficient map (Deff) where warmer colours represent higher mobility. The inset shows a dendritic spine at higher magnification in the left panel.
© 2014, Lu et al. Panel D is reproduced with permission from Figure 3A of Lu et al., 2014 (published under a CC BY-NC-SA 3.0 license). It is not covered by the CC-BY 4.0 license and further reproduction of this panel would need permission from the copyright holder.
Figure 5

Forming protein kinase clusters.
(A) PK clustering occurs via lateral trapping in nanoclusters that restrict their diffusion. In addition, the concentration of both ligand and receptor/substrate availability and the dissociation metrics of their interaction have been described to play a key role in determining the signalling strength of this biological event. (B) The regulation of both the size and location of clusters is therefore likely to determine the signalling duration through the creation of a nano-environment (circular areas containing a higher density of slow diffusing PKs) conducive for fast re-binding of proteins with their substrates and regulated signalling amplification through the creation of hubs that allow efficient effector association.
Tables
Table 1
Lipidation types of protein kinases.
| Kinase | Type of phosphorylation | Role | Type of lipidation | Ref. |
|---|---|---|---|---|
| cAMP-dependent kinase (PKA) | Serine/threonine phosphorylation | Multiple roles in metabolism. | Myristoylation | Carr et al., 1982 |
| AMP-activated protein kinase (b subunit) (AMPK) | Serine/threonine phosphorylation | Cellular energy (regulatory subunit). | Myristoylation | Oakhill et al., 2010 |
| cGMP-dependent kinase II (PKGII) | Serine/threonine phosphorylation | Regulation of ion transport systems and nitric oxide levels. | Myristoylation | Vaandrager et al., 1996 |
| P21-activated kinase 2 (PAK2) | Serine/threonine phosphorylation | Cytoskeleton re-organisation and nuclear signalling. | Myristoylation | Vilas et al., 2006 |
| Casein kinase 1g (CK1g) | Serine/threonine phosphorylation | Antero-posterior patterning during development. | Myristoylation | Kinoshita-Kikuta et al., 2020 |
| Protein serine kinase H1 (PSKH1) | Serine/threonine phosphorylation | Compartmentalisation of splicing factors. | Myristoylation and palmitoylation | Brede et al., 2003 |
| Adenylate kinase 1 (AK1) | Adenosine diphosphate (ADP) phosphorylation | Cellular energy and homeostasis of adenine nucleotide ratios. | Myristoylation | Tomasselli et al., 1986 |
| Blk (B lymphocyte kinase) | Tyrosine phosphorylation | B-cell receptor signalling and development; insulin synthesis and secretion. | Myristoylation | Resh, 1994 |
| Fgr (Gardner-Rasheed feline sarcoma viral oncogene homolog) | Tyrosine phosphorylation | Cell migration and adhesion. | Myristoylation and palmitoylation | Resh, 1994 |
| Hck (hematopoietic cells kinase, p59) | Tyrosine phosphorylation | Inflammatory response (cell survival and neutrophil migration). | Myristoylation and palmitoylation | Resh, 1994 |
| Src | Tyrosine phosphorylation | Regulation of embryonic development and cell growth. | Myristoylation | Resh, 1994 |
| Fyn (p59) | Tyrosine phosphorylation | T-cell differentiation; oocyte maturation; neuronal migration; myelination; synaptic function. | Myristoylation and palmitoylation | Koegl et al., 1994 |
| Lck (T-cell-specific kinase, p56) | Tyrosine phosphorylation | Initiation of TCR signalling; T-cell development and homeostasis. | Myristoylation and palmitoylation | Koegl et al., 1994 |
| Lyn (lymphocytes) | Tyrosine phosphorylation | Myeloid lineage proliferation; liver regeneration; osteoclast differentiation. | Myristoylation and palmitoylation | Resh, 1994 |
| Yes (Yamaguchi sarcoma homolog, p61) | Tyrosine phosphorylation | T-cell migration; cancer cell proliferation and invasion. | Myristoylation and palmitoylation | Koegl et al., 1994 |
Download links
A two-part list of links to download the article, or parts of the article, in various formats.
Downloads (link to download the article as PDF)
Open citations (links to open the citations from this article in various online reference manager services)
Cite this article (links to download the citations from this article in formats compatible with various reference manager tools)
Location, location, location: Protein kinase nanoclustering for optimised signalling output
eLife 13:e93902.
https://doi.org/10.7554/eLife.93902


