An in vitro approach reveals molecular mechanisms underlying endocrine disruptor-induced epimutagenesis
- Department of Neuroscience, Developmental and Regenerative Biology, The University of Texas at San Antonio, United States
Figures
Figure 1 with 5 supplements
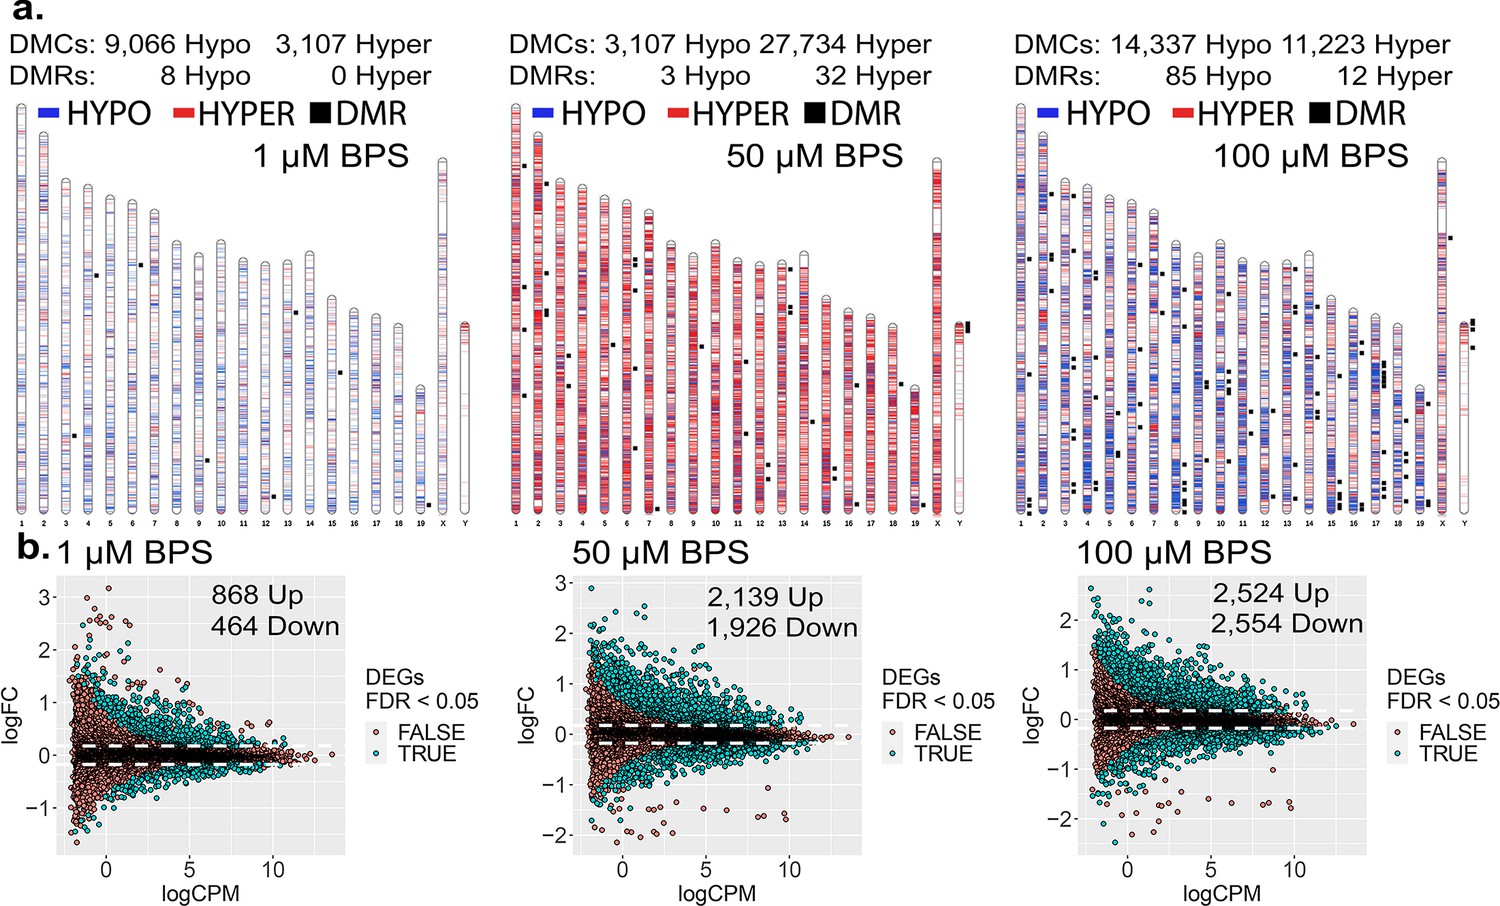
Dose-dependent impact of epimutagenesis measured in iPSCs exposed to 1, 50, and 100 μM BPS.
(a) Ideogram plots displaying chromosomal distribution of genome-wide changes in DNA methylation caused by BPS exposure. (b) Mean difference (MD) plots of changes in gene expression following exposure to increasing doses of BPS. Exposure to increasing doses of BPS induced higher, although plateauing numbers of DMCs, DMRs, and DEGs. Blue horizontal lines = hypomethylated DMCs, red horizontal lines = hypermethylated DMCs, black squares = DMRs.
Figure 1—figure supplement 1
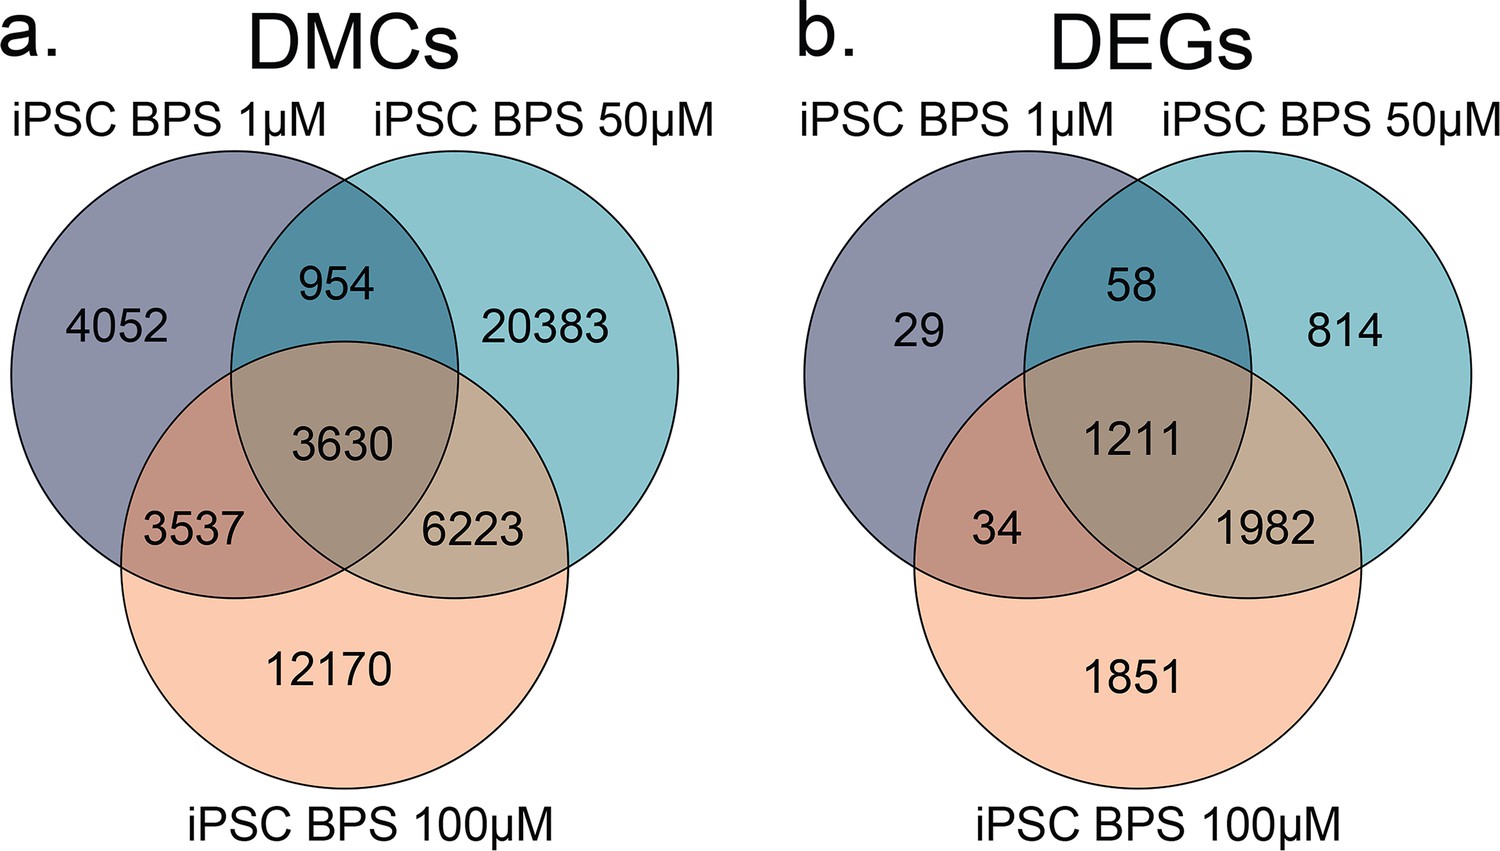
Overlapping DMCs and DEGs found among dose-dependent responses to BPS exposure.
Venn diagrams of overlapping (a) DMCs and (b) DEGs identified when comparing iPSCs exposed to increasing doses of BPS (1, 50, and 100 μM). We detected an average of 51.25% overlap among DMCs and an average of 80.45% overlap among DEGs within each respective cell type across the different doses of BPS.
Figure 1—figure supplement 2
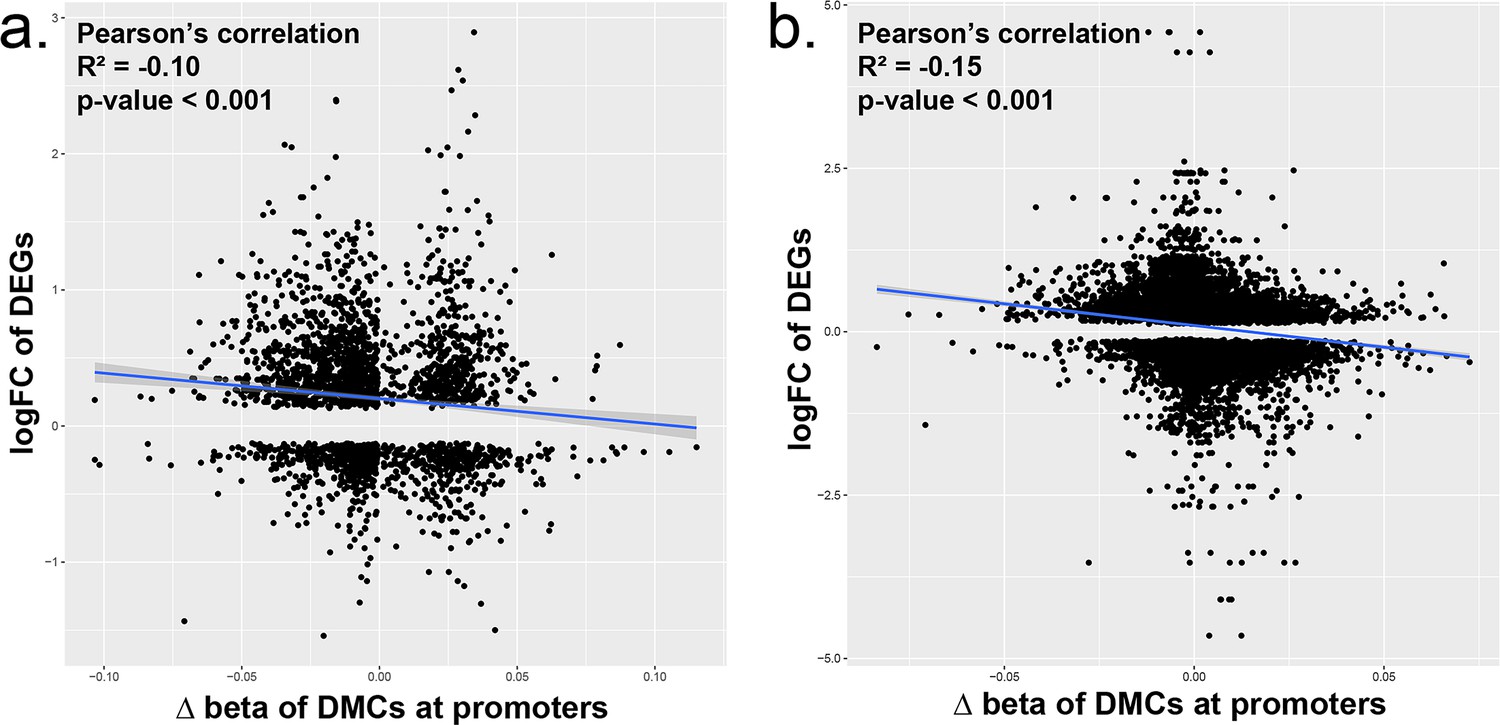
Relationship between DMCs at promoters and DEGs.
We compared the correlation between the differential expression of genes and the presence of DMCs in the promoter region of that gene in (a) iPSCs exposed to increasing doses of BPS (1, 50, and 100 μM) or (b) Sertoli, Granulosa, iPSCs, and PGCLCs. We found that there was a significant negative correlation indicating in our data that promoters that had a loss of DNA methylation tended to also have higher upregulation of gene expression and vice versa when observing hypermethylation and downregulation of gene expression.
Figure 1—figure supplement 3
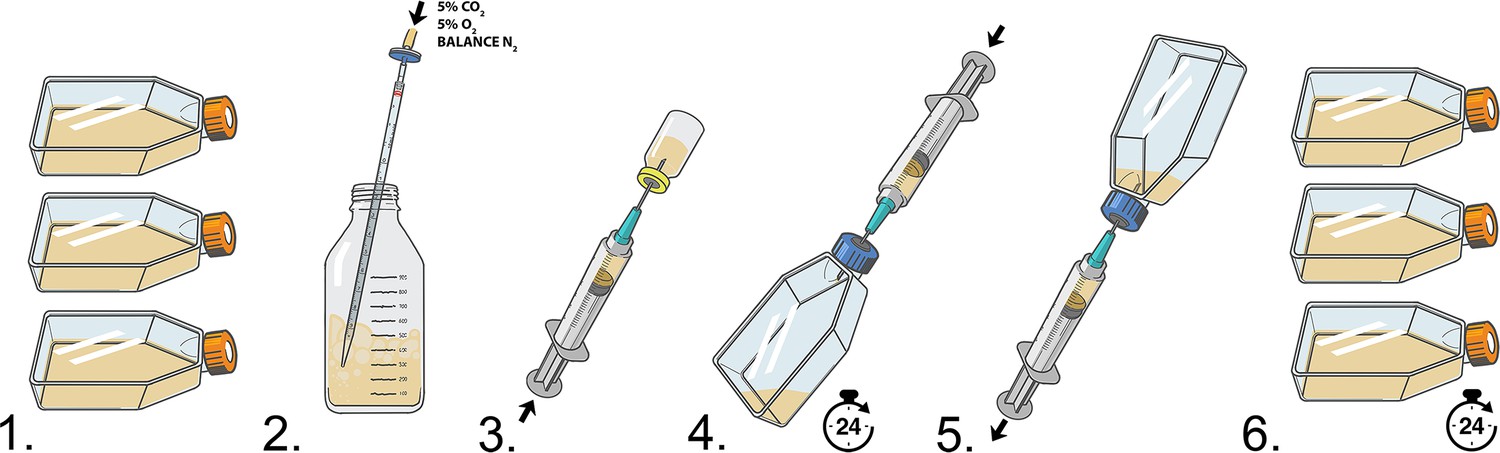
Chemical exposure experimental workflow.
(1) Cells are passaged into T-25 flasks with filter caps. (2) Mixed blood gas (carbon dioxide 5%, oxygen 5%, and balance nitrogen) is filtered and bubbled into media to prepare media to be mixed with diluted chemical treatment and added to air-tight cell culture flasks. (3) Media is transferred into glass vials and diluted chemical is added. (4) T-25 filter caps are replaced with air-tight caps with septums and cell media containing chemicals is added via syringe and left for 24 hr. (5) After 24 hr, chemical-containing media is removed and cells are washed with buffer. (6) T-25 air-tight septum caps are replaced with filter caps and cells are cultured for an additional 24 hr ‘chase’ period.
Figure 1—figure supplement 4
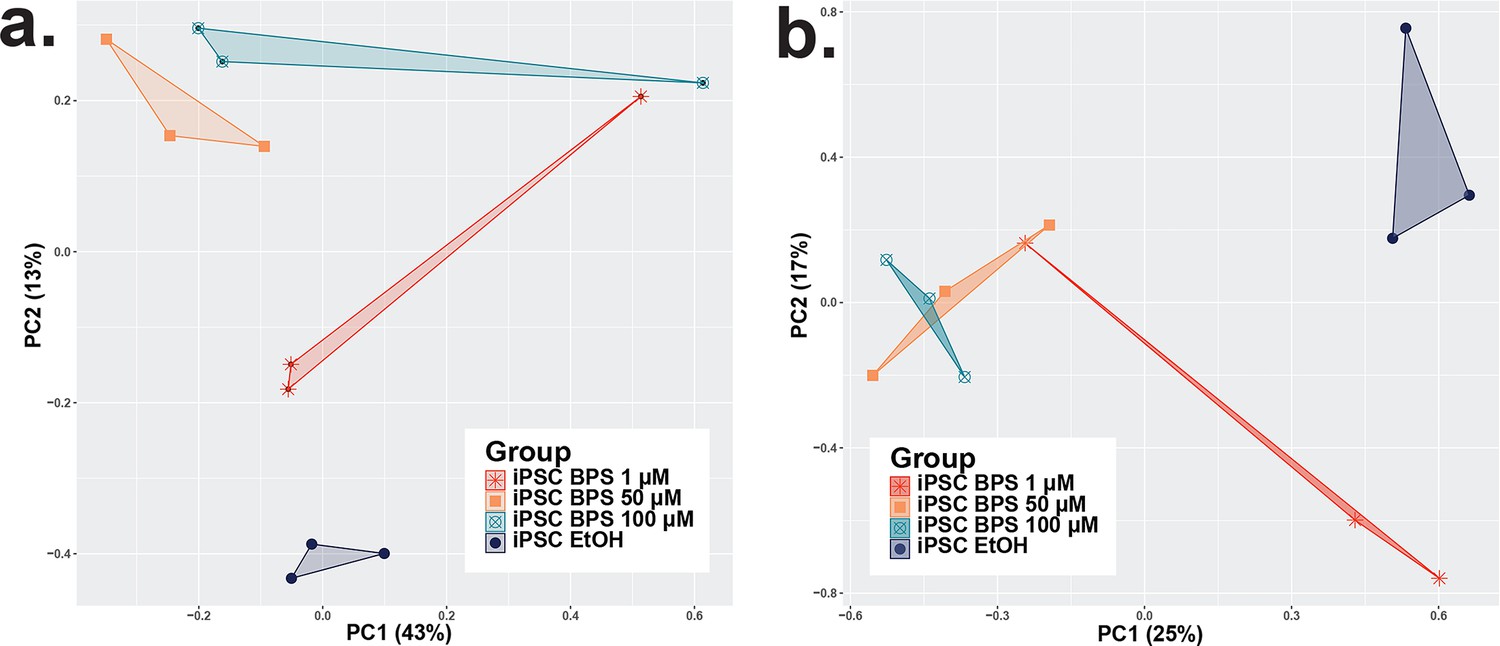
Consistency among iPSC replicates and variation between RNA-seq and DNA methylation Infinium Beadchip array experimental and control groups.
Plots displaying principle component analyses of data from the BPS dose determination experiments showing dose-dependent susceptibility to BPS in iPSCs utilizing data from (a) DNA methylation data from Infinium Beadchip array analysis and (b) gene expression data from bulk RNA-seq analysis. The dimensional reduction of the variation in plots demonstrates a partially additive dose-dependent relationship between the concentration of BPS added to the media and an increasing distinction between the control and treated samples, although this relationship plateaued at higher doses of BPS.
Figure 1—figure supplement 5
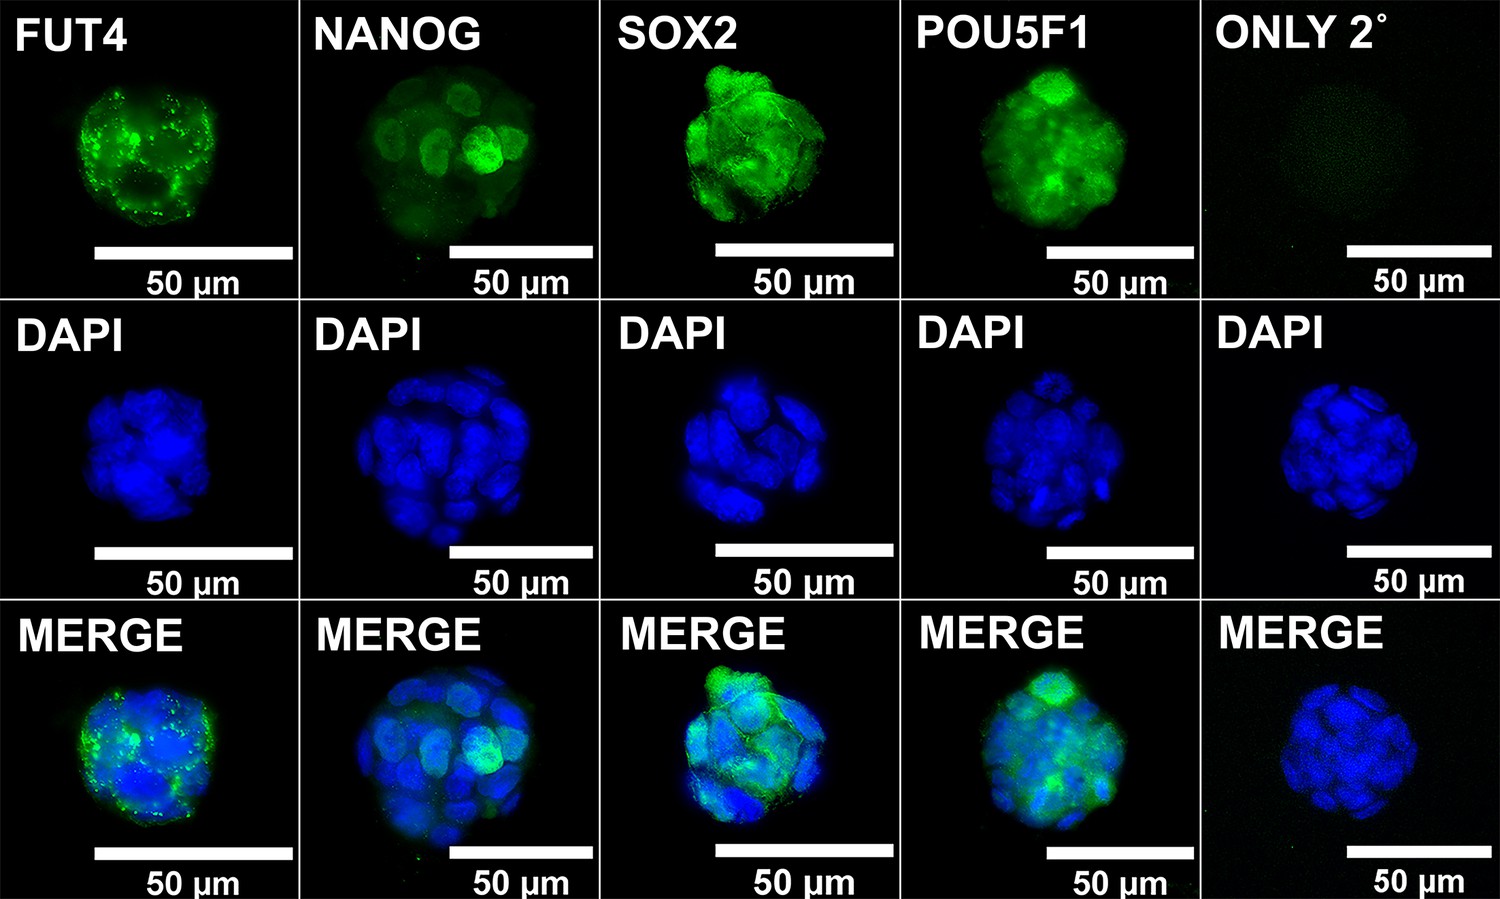
ICC validation of MF5-9-1 iPSCs.
iPSCs from reprogrammed MEFs were validated for immunolabeling with known pluripotency markers along with negative control results when labeling was conducted with the secondary antibody only (ONLY 2°).
Figure 2 with 4 supplements
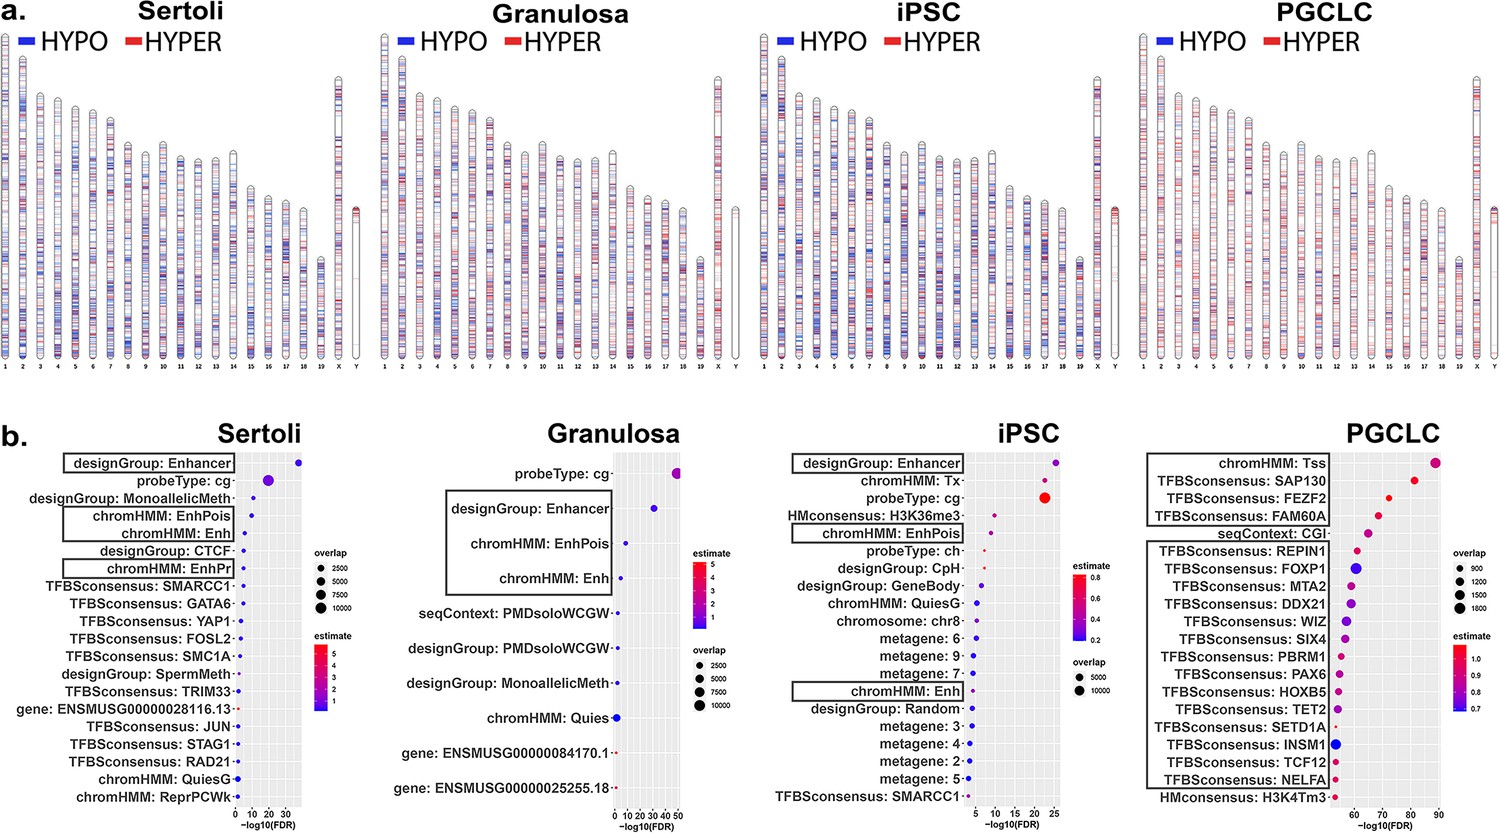
Chromosomal distributions and annotations of BPS-induced epimutations in pluripotent, somatic, and germ cell types.
(a) Ideograms illustrating chromosomal locations of DMCs induced by exposure of each cell type to 1 μM BPS. Blue horizontal lines = hypomethylated DMCs, red horizontal lines = hypermethylated DMCs. (b) Enrichment plots indicating feature annotations in genomic regions displaying prevalent BPS-induced epimutations in each cell type. Dot size = number of overlapping DMCs with specific annotation, dot color = enrichment score reflecting the relative degree to which epimutations occurring in a specific annotated class are overrepresented.
Figure 2—figure supplement 1
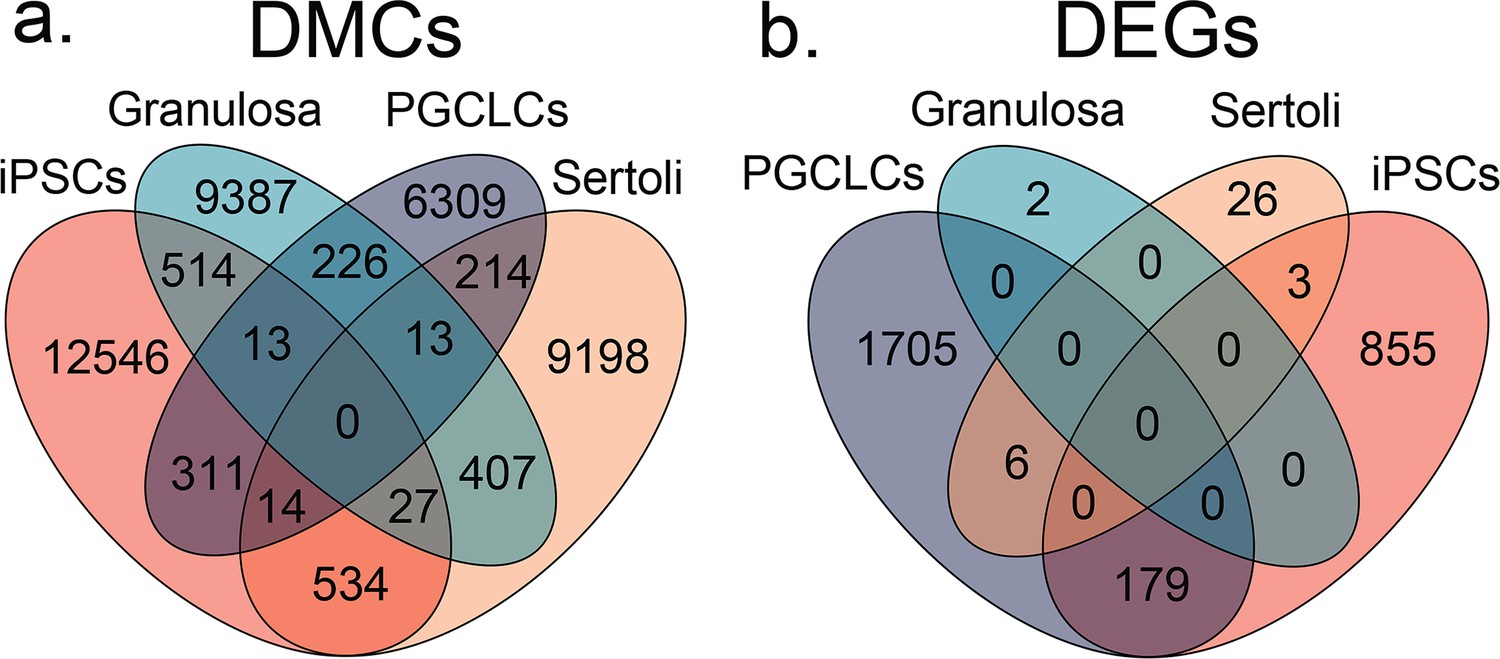
Overlapping DMCs and DEGs found among cell-type specific responses to BPS exposure.
Venn diagrams of overlapping (a) DMCs and (b) DEGs identified when comparing iPSCs, granulosa cells, Sertoli cells, and PGCLCs exposed to the established minimum dose of 1 μM of BPS. We only detected an average of 11.05% among DMCs and 13.26% among DEGs between different cell types.
Figure 2—figure supplement 2
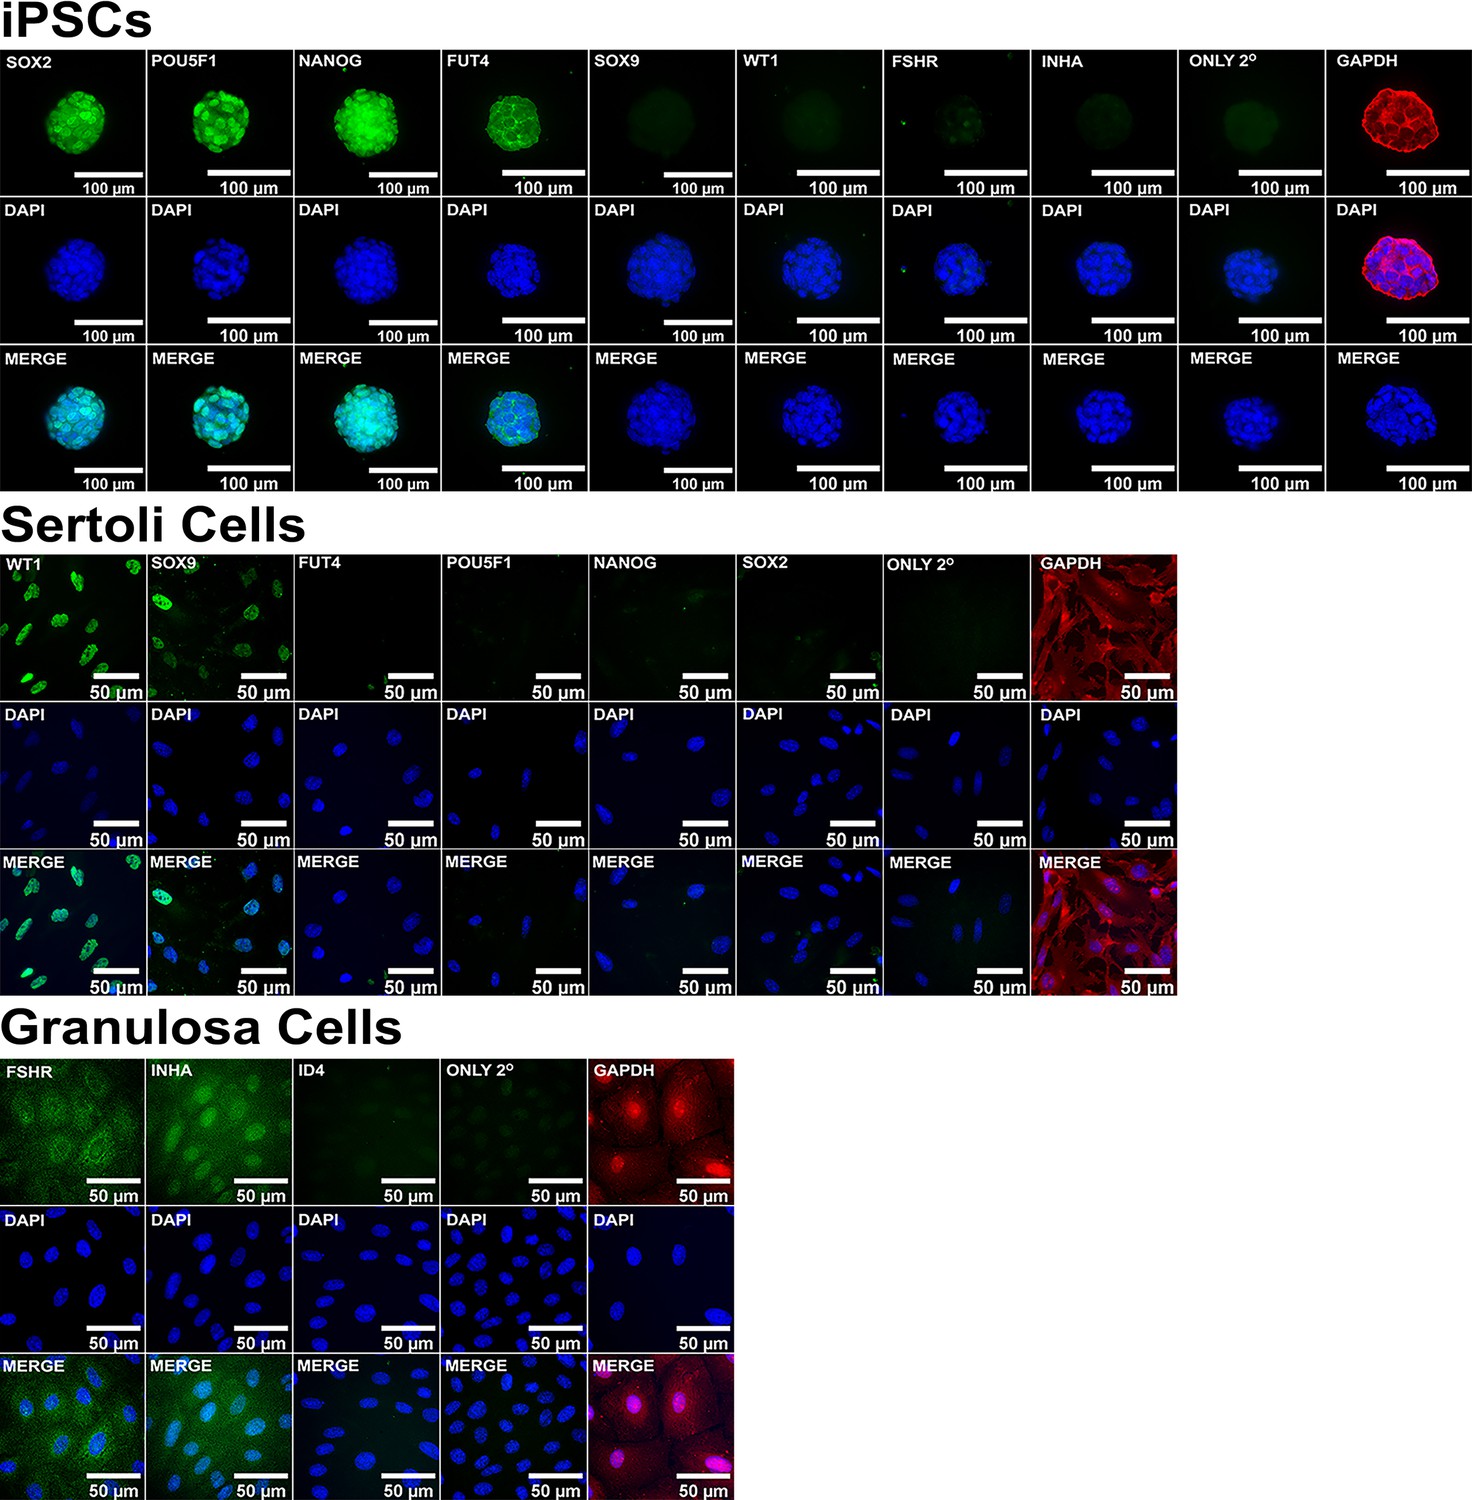
ICC control staining of cell type-specific markers.
Validation of immunolabeling for known pluripotent and somatic cell type markers in iPSCs, Sertoli Cells, and Granulosa cells along with negative secondary antibody only (ONLY 2°) and positive (GAPDH) controls.
Figure 2—figure supplement 3
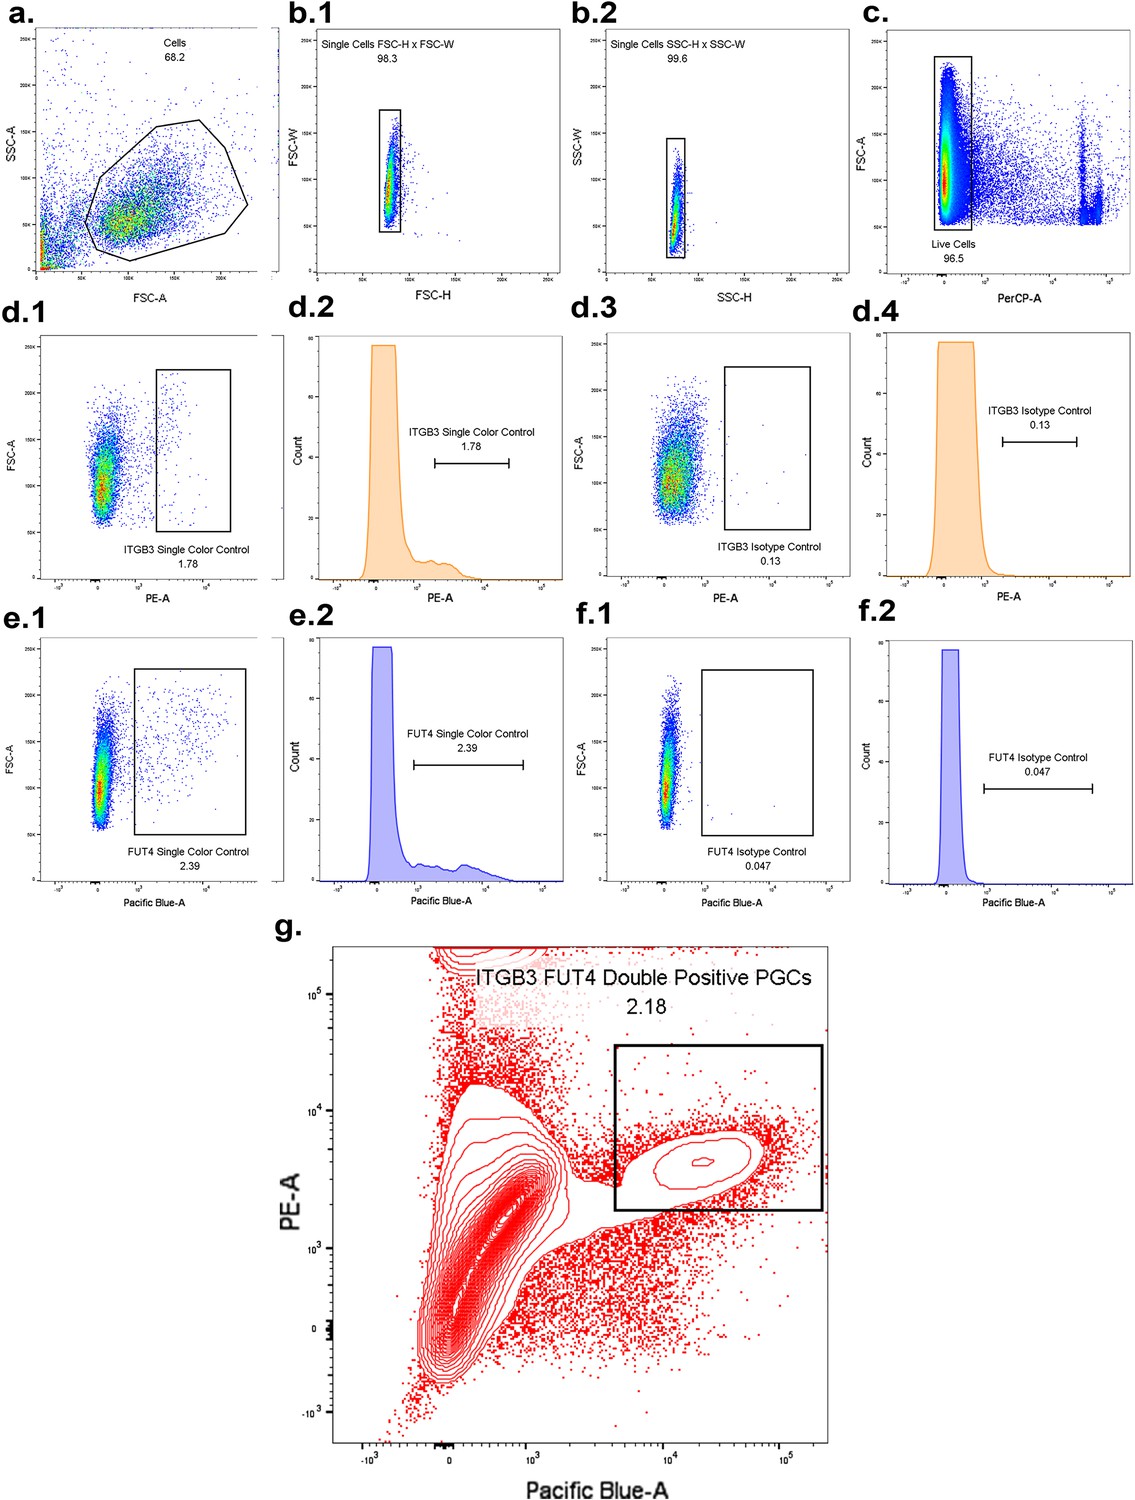
FACS sorting for ITGB3/FUT4 enriched primordial germ-cell like cells.
(a) Gating for cells. (b) (1–2) Gating for singlet cells. (c) Gating for live cells. (d) (1–2) Single color control ITGB3-positive cells. (d) (3–4) IgG isotype control. (e) (1–2) Single color control FUT4-positive cells. (f) (3–4) IgG isotype control. (g) Sorting for PGCLC-enriched ITGB3/FUT4 double positive population (2.18% of total cells).
Figure 2—figure supplement 4
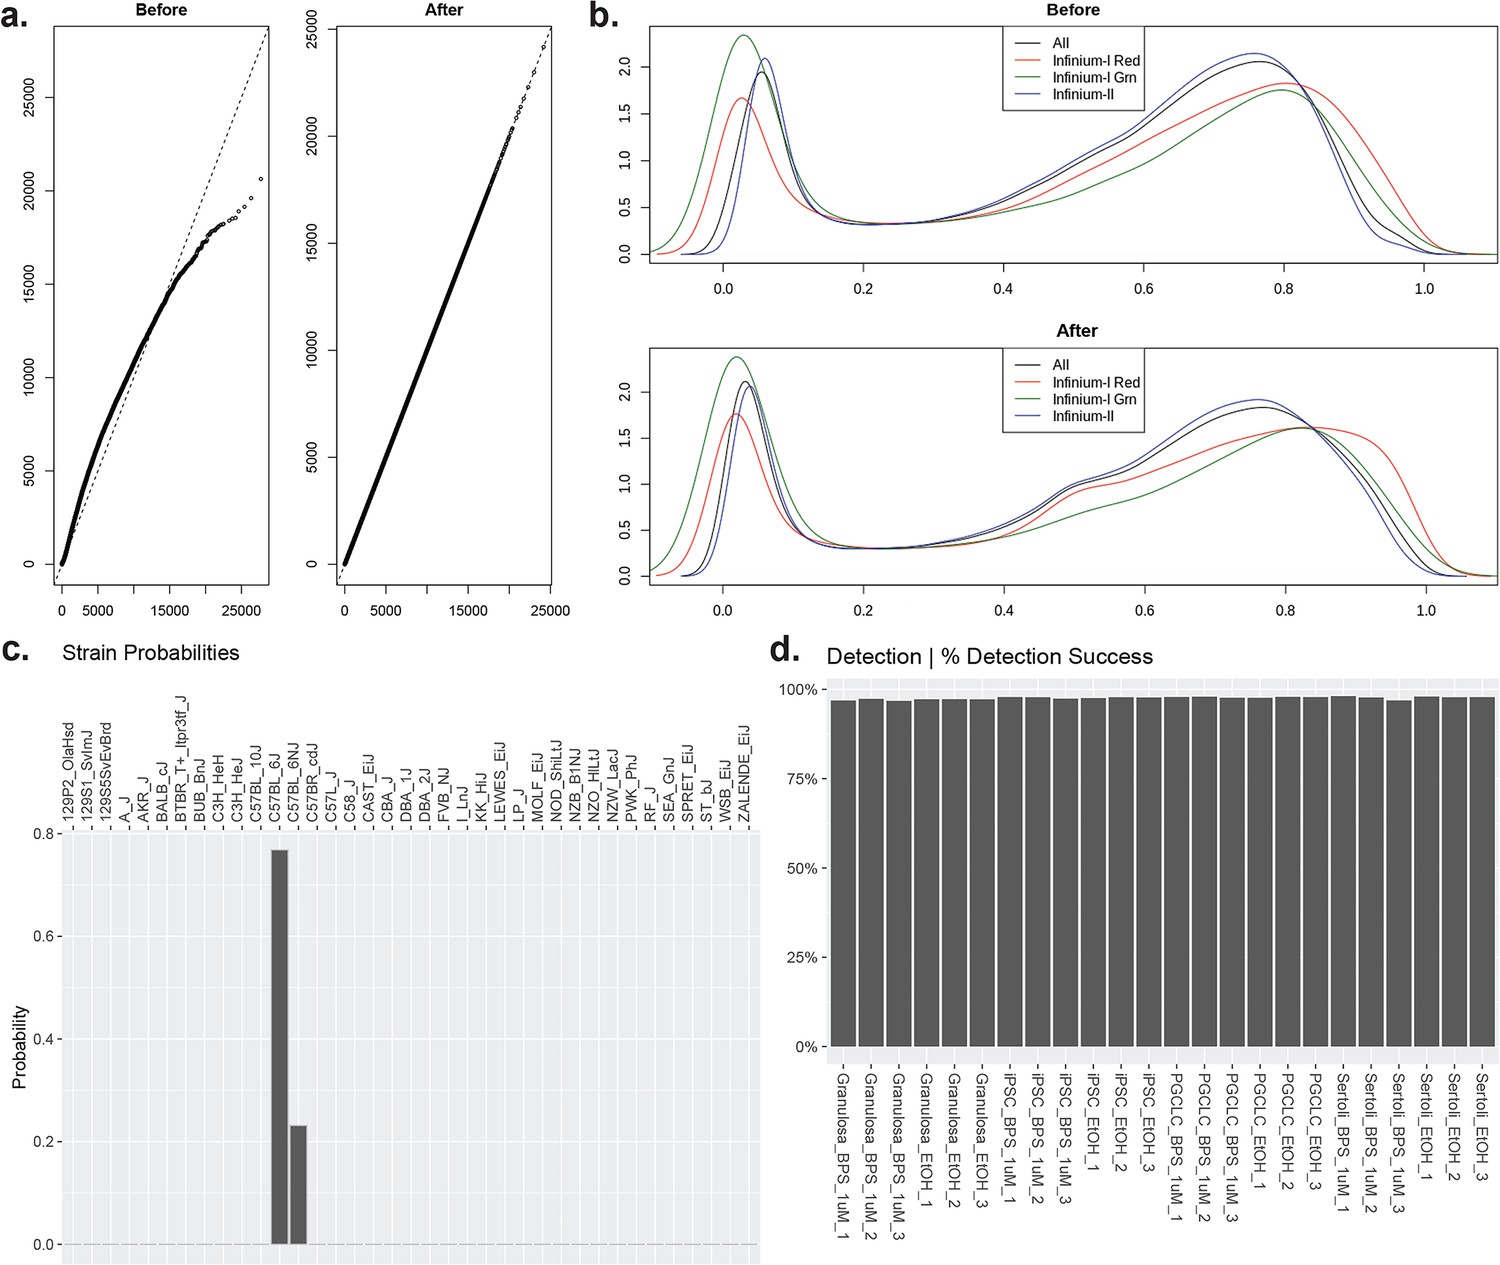
Quality control for Infinium Mouse Methylation BeadChip Array data.
(a) Non-linear correction of dye bias removal from sample data. (b) Background signal subtraction from samples to limit noise. (c) Prediction of correct C57B6 mouse strain from samples included in the study based on built-in controls on Infinium Mouse Methylation BeadChip Array. (d) Average CpG probe detection success of 97.58% across all samples indicating efficient bisulfite conversion of all samples.
Figure 3 with 4 supplements
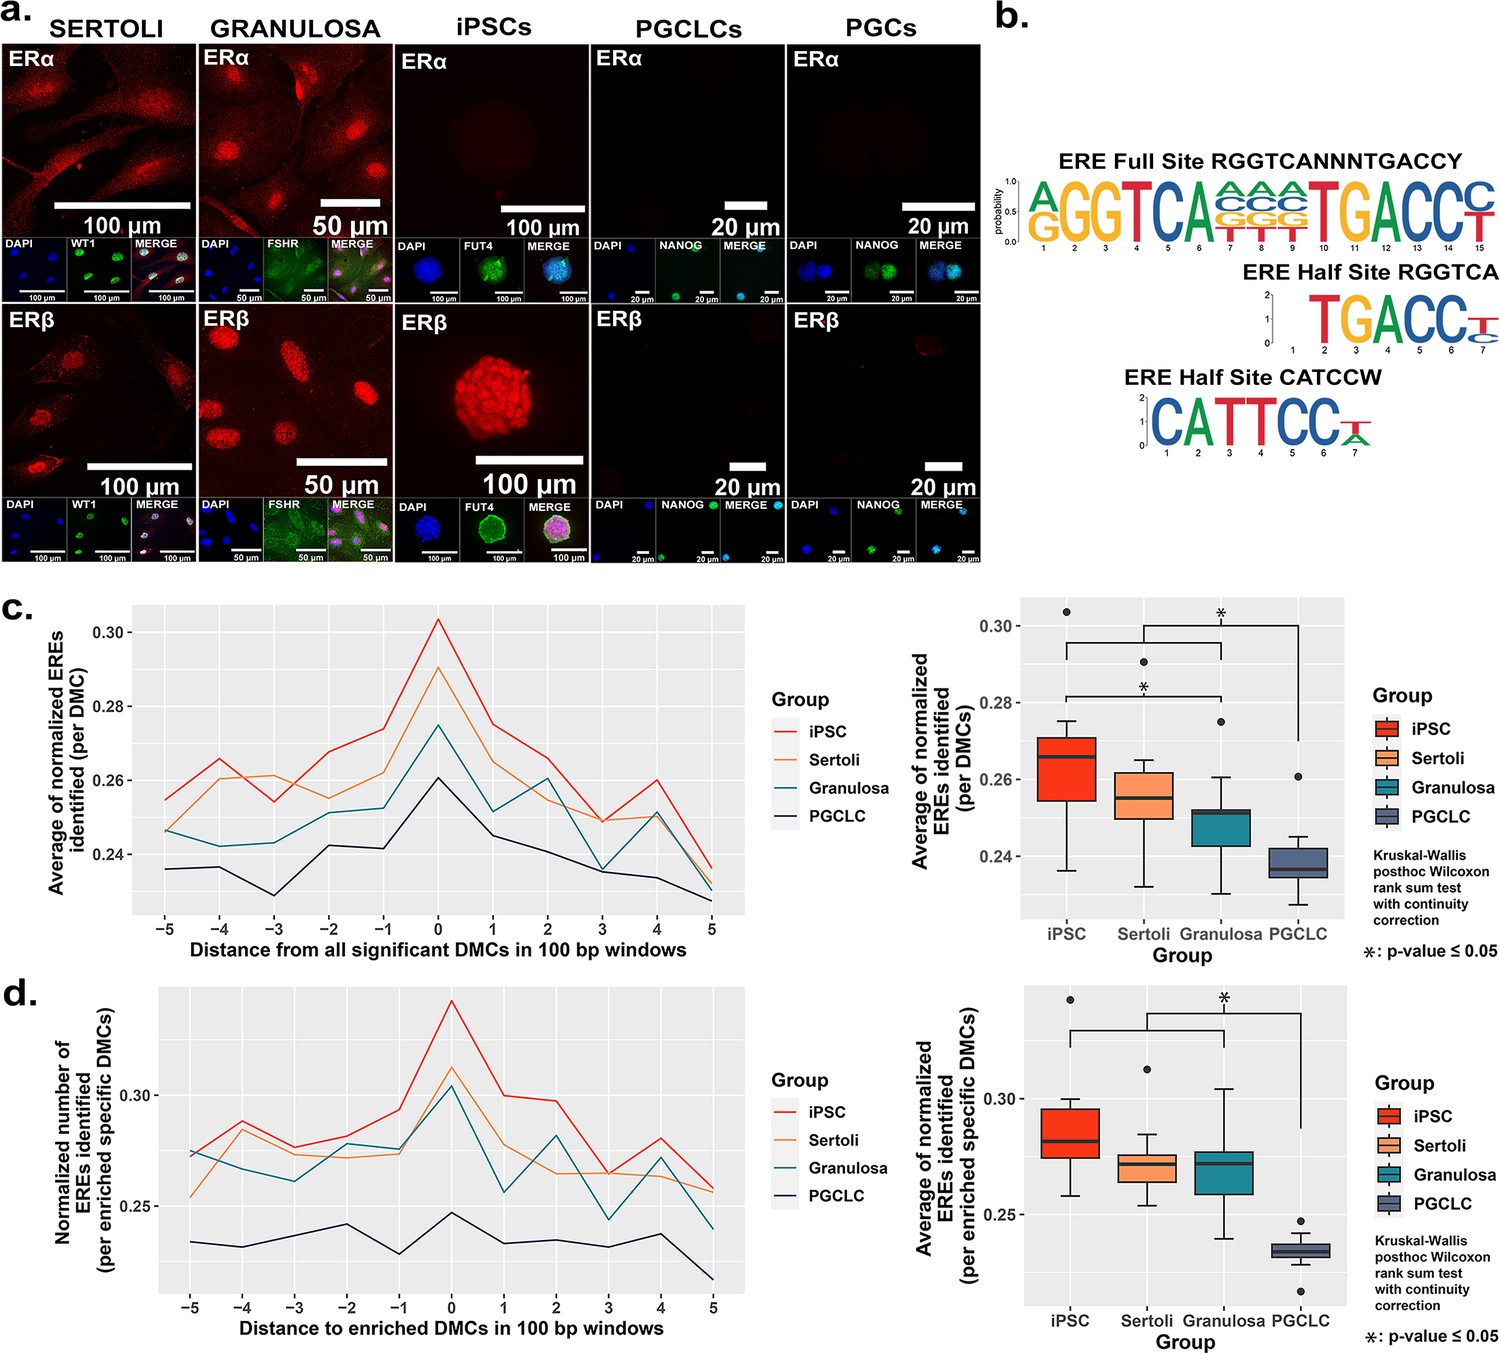
Correlation between cell-type specific expression of estrogen receptors and density of genomic EREs associated with BPS-induced epimutations.
(a) Assessment of expression of ERα and ERβ by cell types co-stained for known cell-type specific markers. Somatic cell types express both receptors, pluripotent cells express ERβ but not ERα, and germ cells do not express either estrogen receptor. (b) Motif plots displaying the full ERE consensus sequence and the more biologically relevant ERE half-site motifs found to be enriched from ERα ChIP-seq. (c,d) Normalized density plots and box plots displaying the frequency of ERE half-sites identified (c) within 500 bp of all BPS-induced DMCs genome-wide, or (d) within 500 bp of the most enriched categories of BPS-induced DMCs in each cell type (=enhancer regions for somatic and pluripotent cell types and promoter regions in the germ cell type).
Figure 3—figure supplement 1
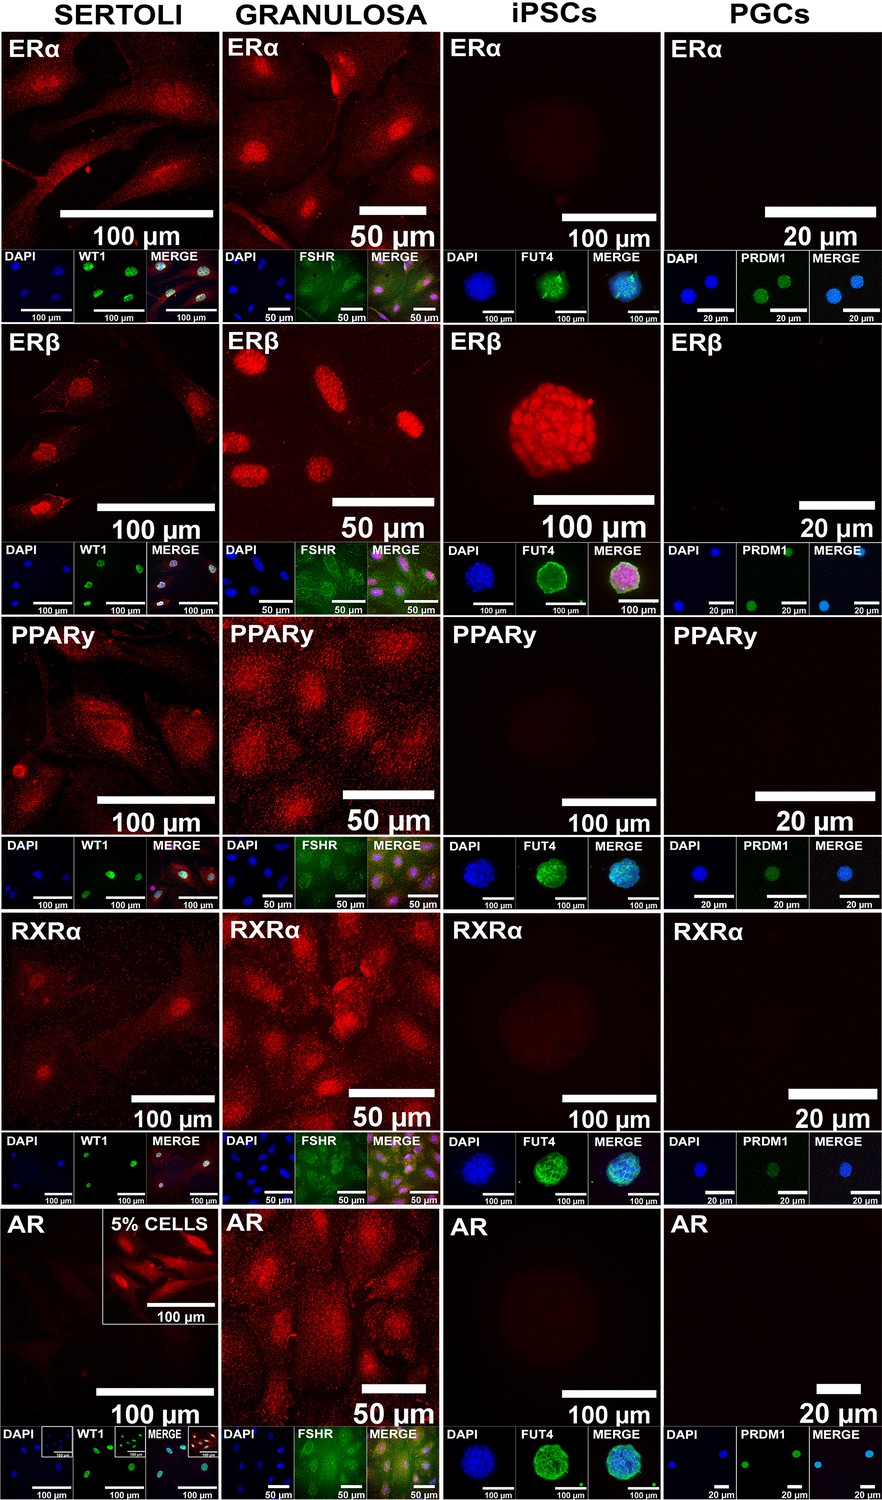
Assessment of expression of additional endocrine receptors potentially involved in cell type-specific responses to BPS exposure.
Immunocytochemistry staining of expression of ERα, ERβ, PPARγ, RXRα, and AR is shown, along with staining for known cell-type-specific markers. Somatic cell types express all receptors, pluripotent cells express ERβ but not ERα, PPARγ, RXRα or AR, and germ cells do not express any of the endocrine receptors.
Figure 3—figure supplement 2
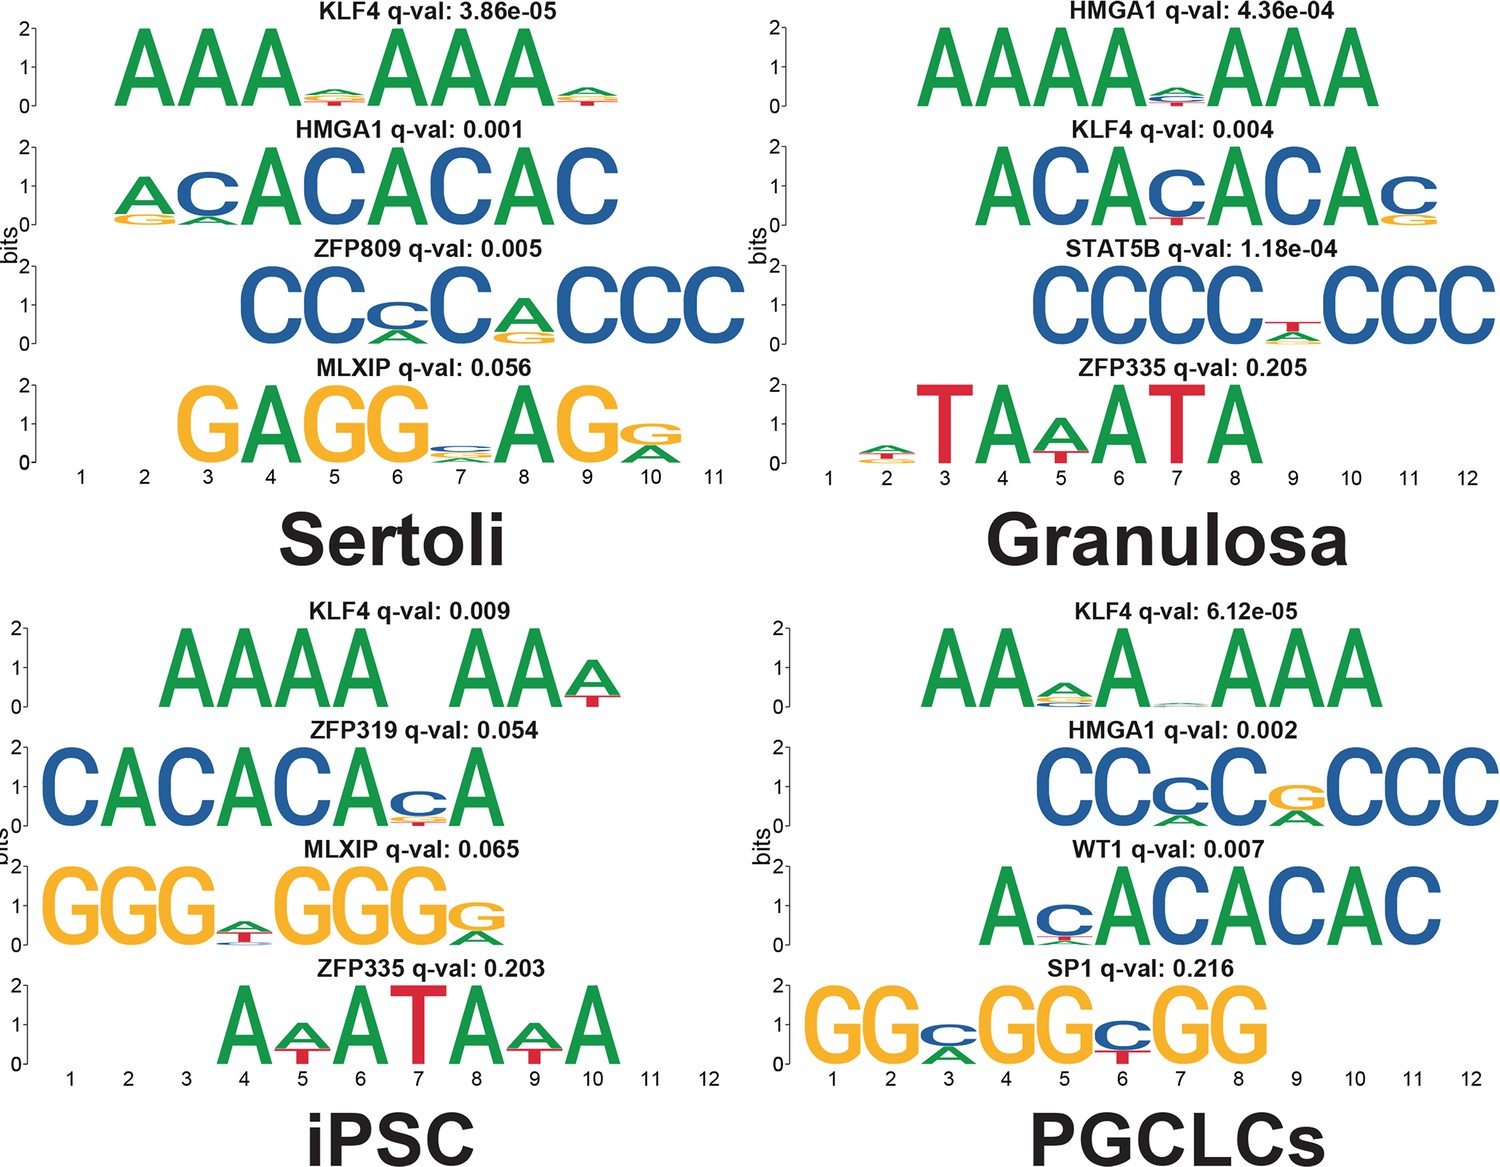
Motifs near enriched DMCs.
Identification of the top 4 motif sequences (e-value <0.05) within 500 bp of cell type-specific enriched DMCs that were either associated with enhancer regions in Sertoli, granulosa, and iPS cells or with transcription factor binding sites in PGCLCs. Each motif was compared with the JASPAR database for potential transcription factor binding capability associated with the motif. Transcription factors with potential binding capability are listed above each corresponding motif along with the adjusted p-value (q-value) of the association. Interestingly we see that the two most common motifs across all cell types were associated with either the chromatin remodeling transcription factor HMG1A or the pluripotency factor KLF4.
Figure 3—figure supplement 3
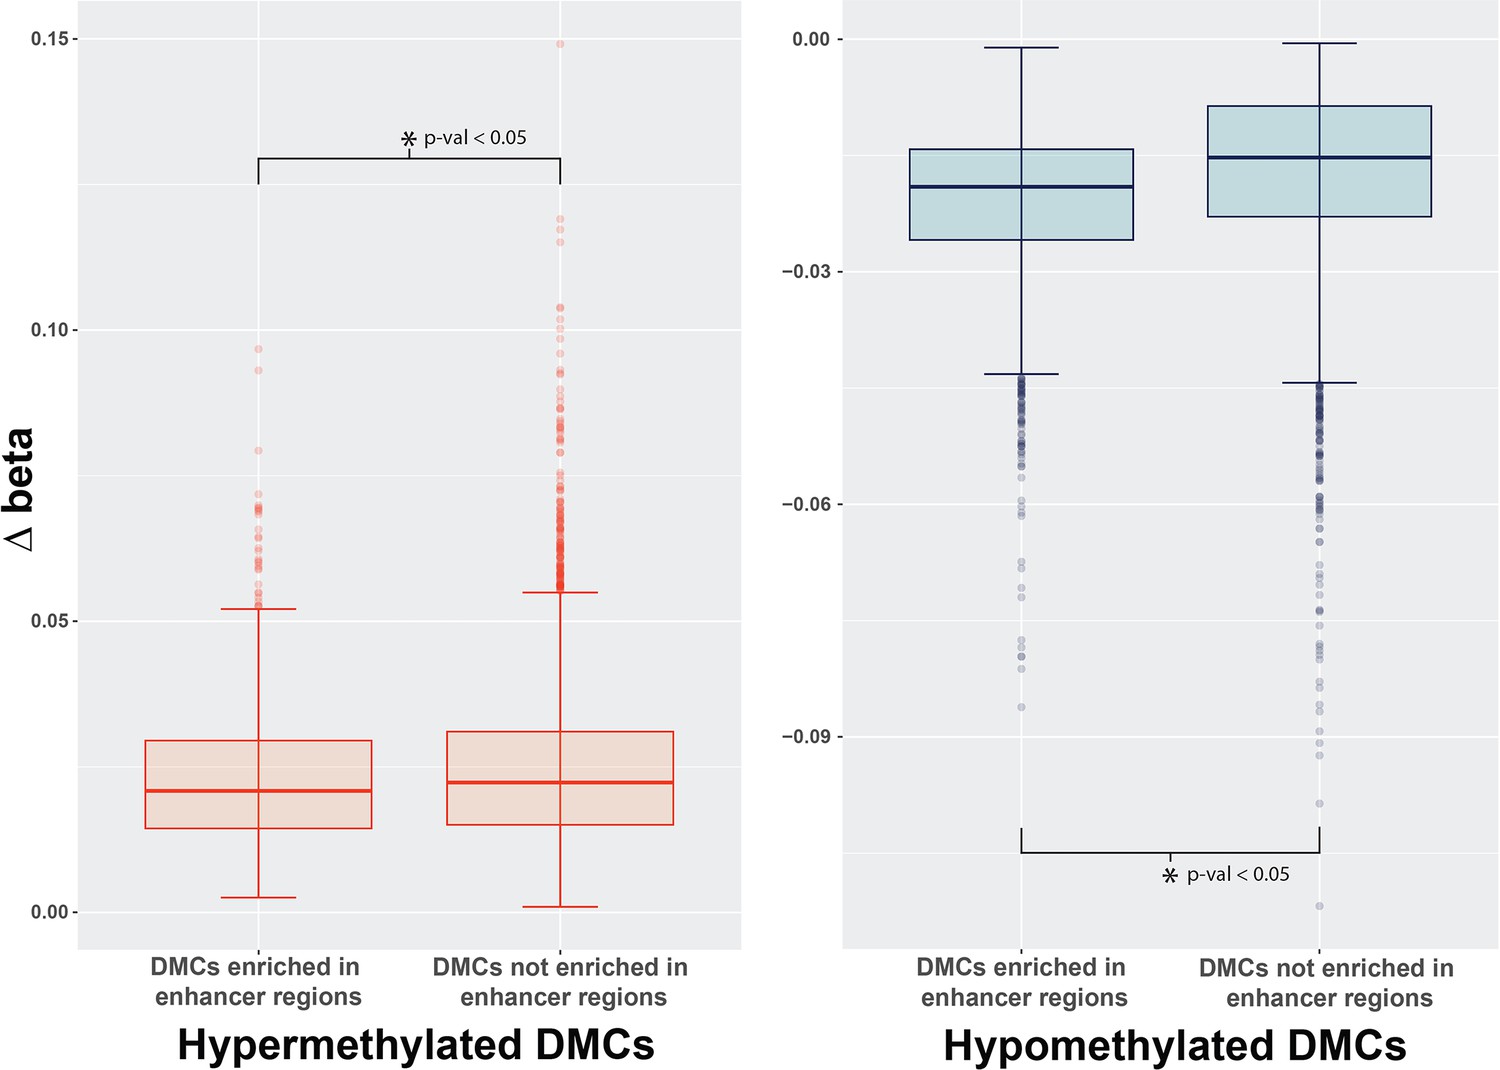
Comparison of delta beta values at significant DMCs.
Analysis of the differences in beta values at DMCs from Sertoli, Granulosa, and iPSCs that were enriched at enhancer regions and associated with closer proximity to ERE elements or DMCs that were not enriched at enhancers that had a lower frequency of ERE elements in close proximity. Box plots display a high degree of similarity in the delta beta intensities measured for these specific DMCs in BPS-treated samples vs control samples. Interestingly, the differences between the distribution of beta values were sufficient to be significant based on the two-sample Kolmogorov-Smirnov test. These observed differences indicate that there is higher variability of the delta betas associated with hypomethylated changes occurring at DMCs associated with enhancers but not hypermethylation indicating a trend for a higher proportion of cells to have hypomethylated changes at these specific regions.
Figure 3—figure supplement 4
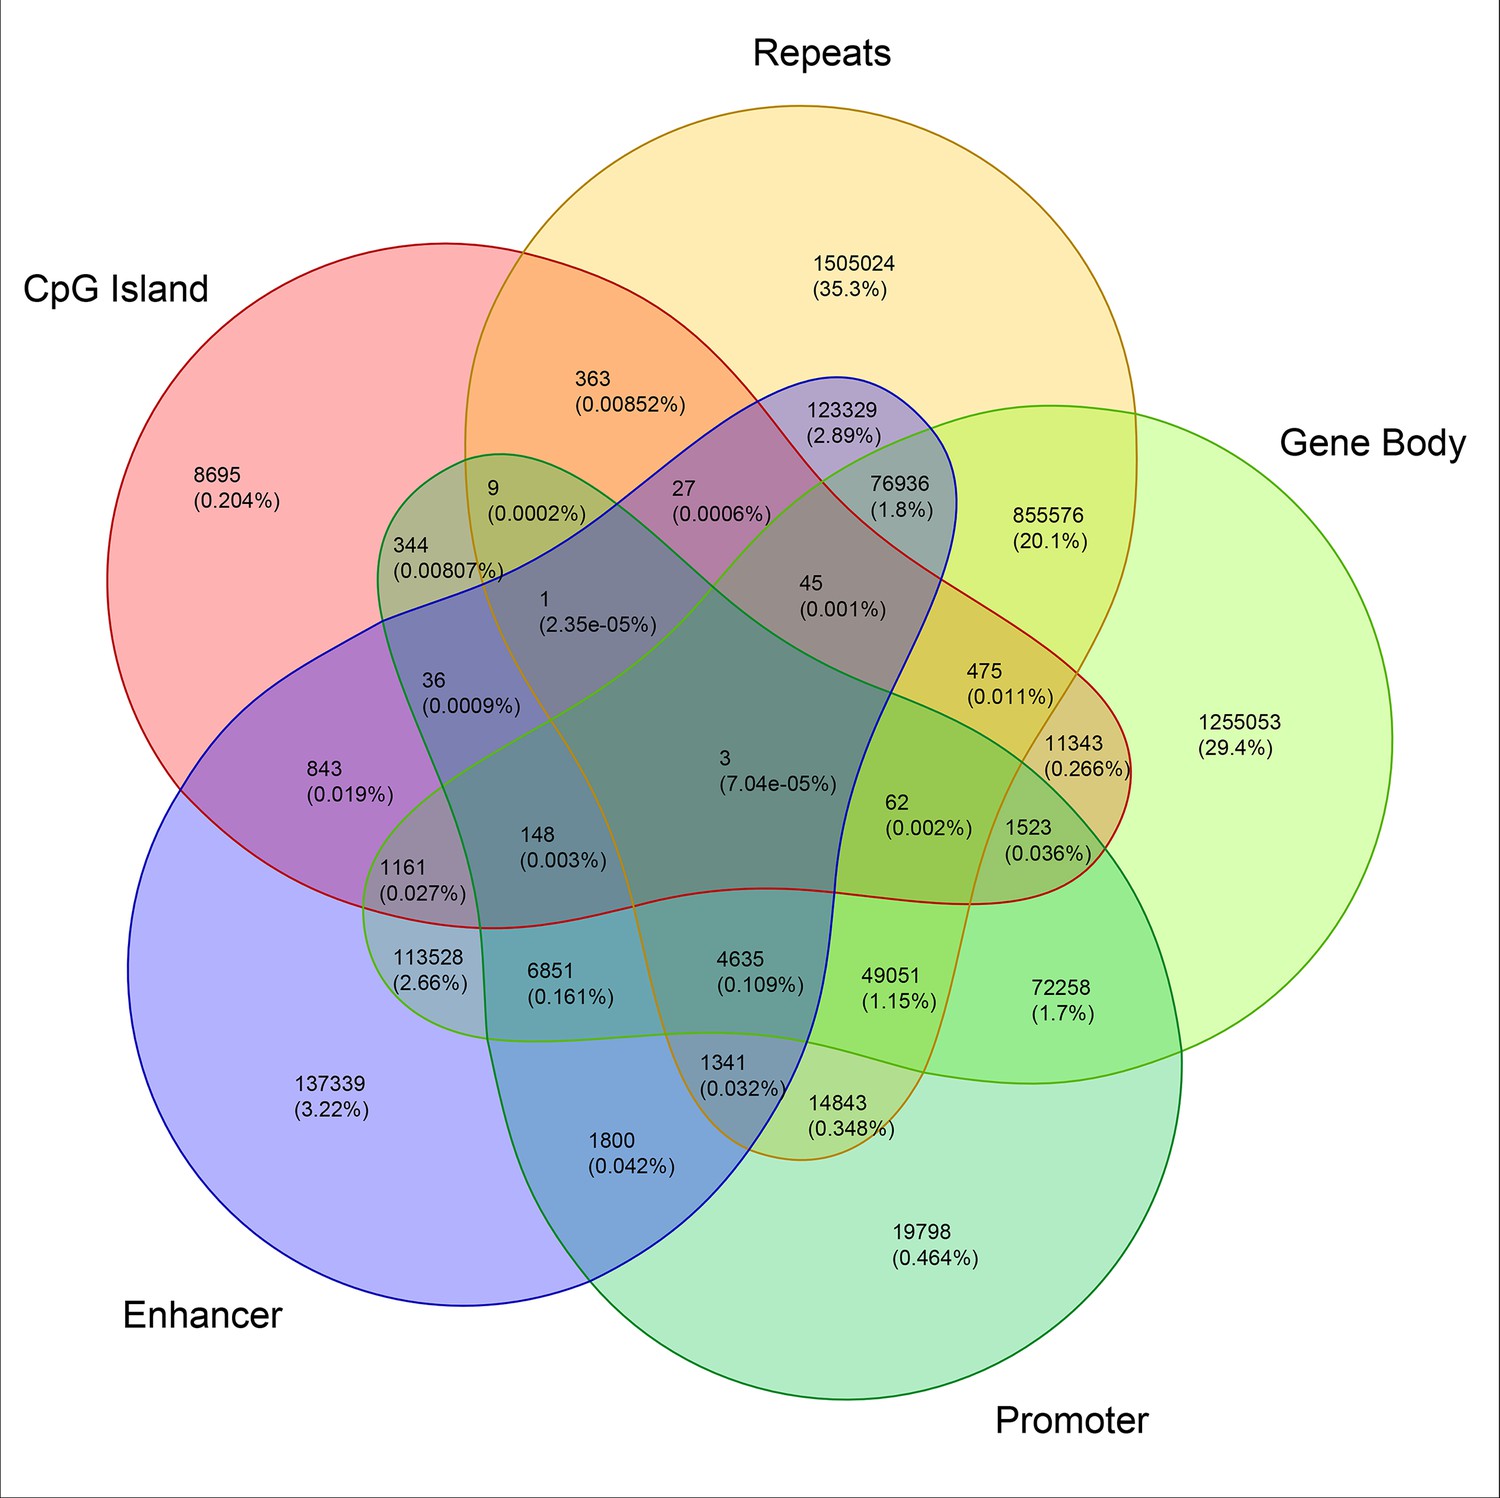
Genome-wide annotation of ERE half-sites.
Venn diagram displaying the identification of ERE half-sites localized in known genic and intergenic regions.
Figure 4
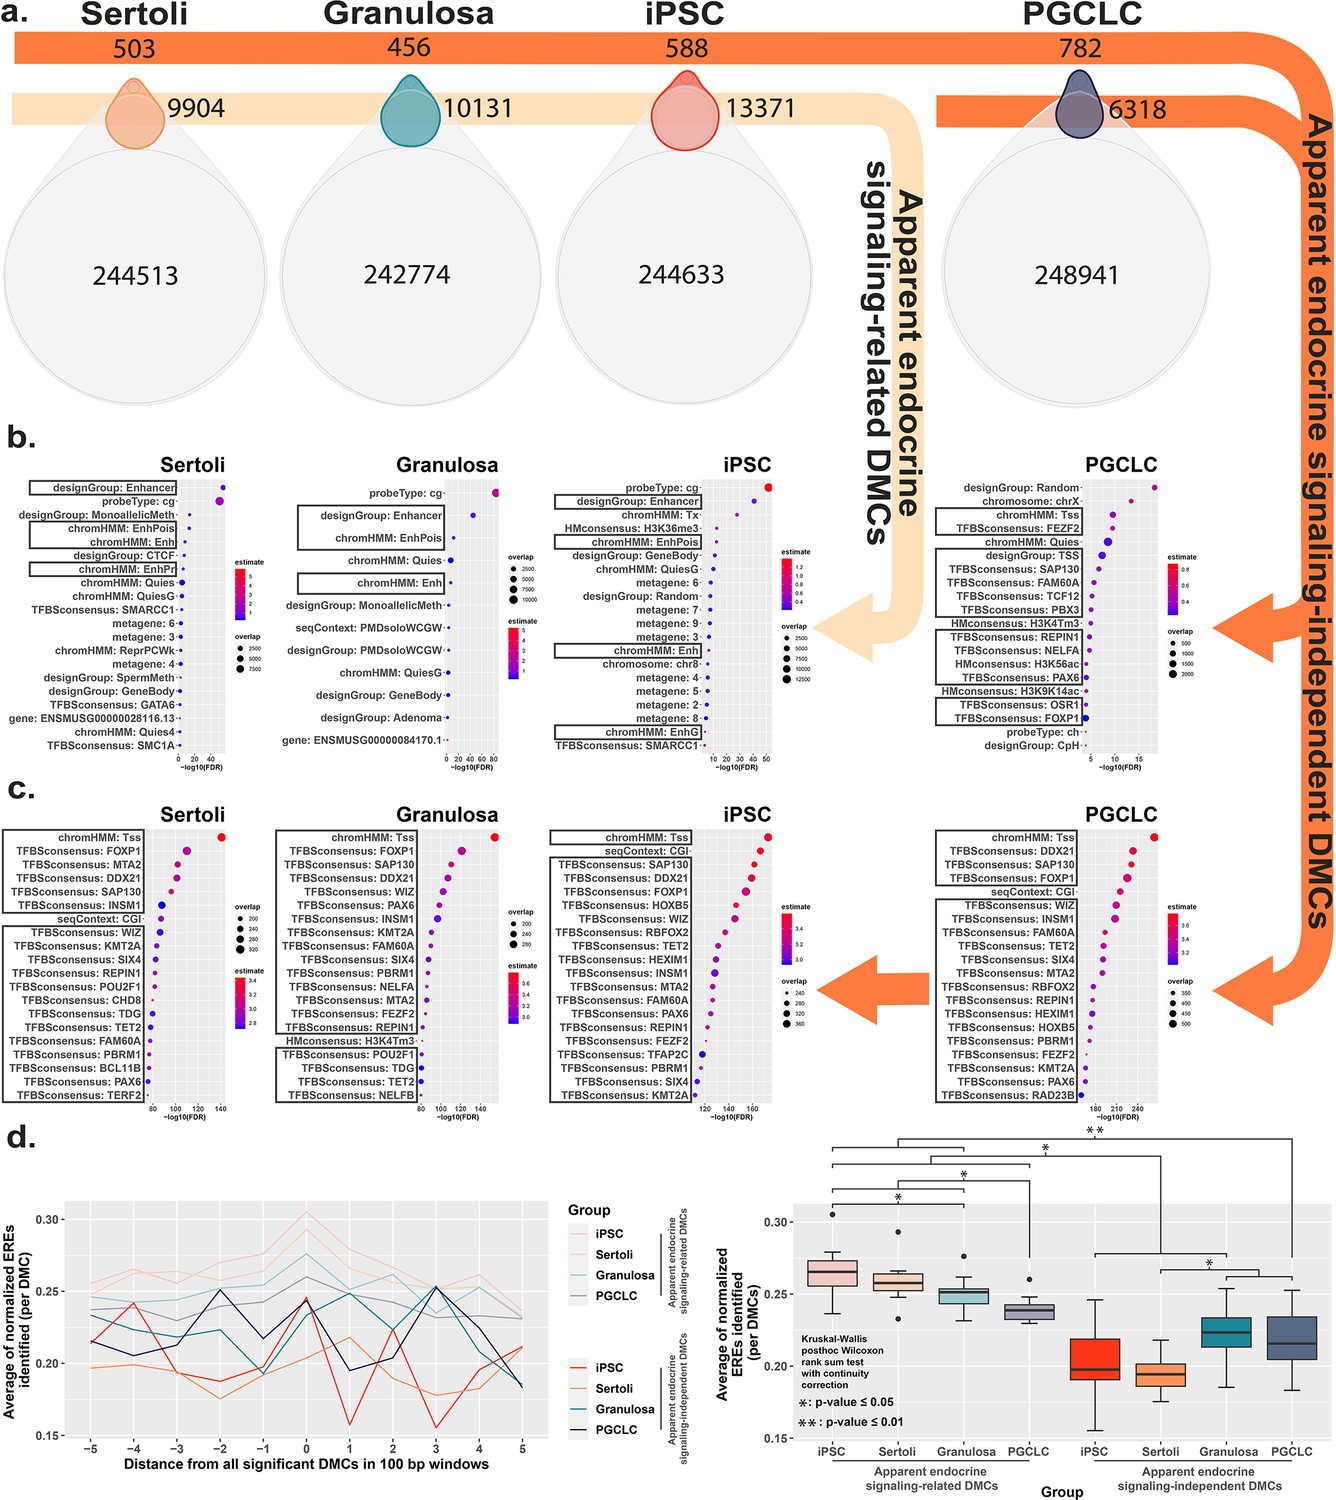
Direct comparison of BPS exposure-specific and cell-type specific features between cell types.
(a) Assessment Venn diagrams indicating DMCs that are due either to BPS exposure (top, smaller ovals) or inherent cell-type specific differences (bottom, larger ovals). Numbers of apparent endocrine-signaling related DMCs are shown in the light orange arrow, and apparent endocrine-signaling independent DMCs are shown in the dark orange arrows. Enrichment plots indicating feature annotations in genomic regions displaying (b) apparent endocrine-signaling related DMCs occurring predominantly in enhancer regions in somatic Sertoli and granulosa cell types or pluripotent cells expressing one or more estrogen receptors, or (c) a smaller set of apparent endocrine-signaling independent DMCs occurring predominantly in promoter regions in all four cell types regardless of +/-expression of relevant endocrine receptors. (d) Normalized density plots and box plots displaying the frequency of ERE half-sites identified within 500 bp of apparent endocrine-signaling related DMCs occurring predominantly in enhancer regions and apparent endocrine-signaling independent DMCs occurring predominantly in promoters.
Figure 5 with 1 supplement
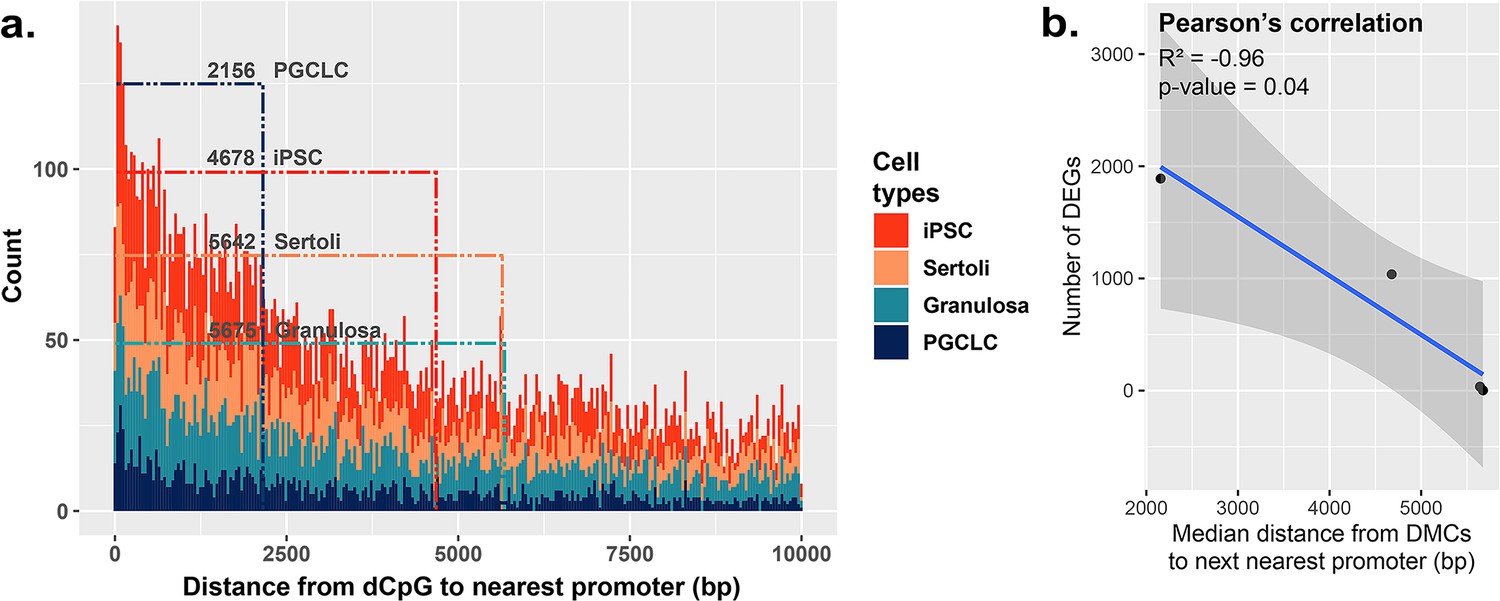
Correlation between the proximity of DMCs to promoters and dysregulation of gene expression.
(a) Proximity plot displaying distances from exposure-specific DMCs to nearest promoter regions. Dotted lines indicate median points of the data for each cell type. (b) Correlation plot displaying a negative relationship between the distance from DMCs to nearest promoters and resulting dysregulation of gene expression within each cell type.
Figure 5—figure supplement 1
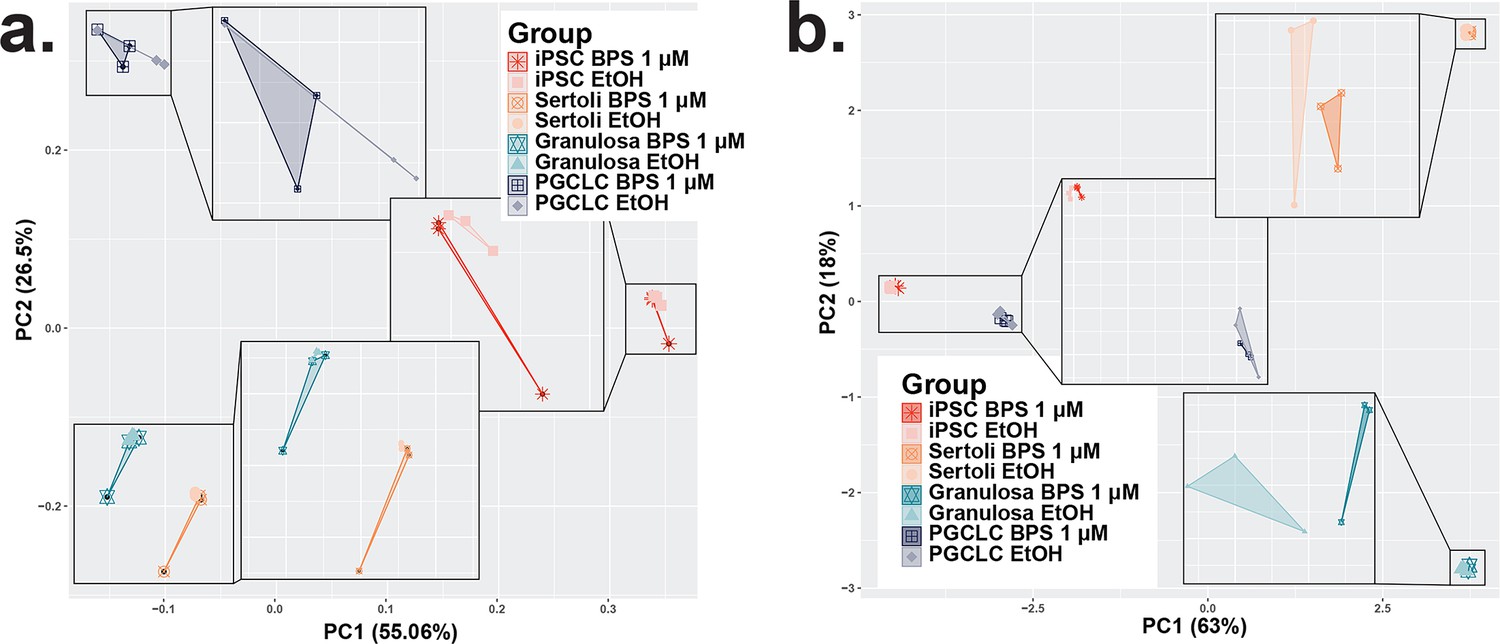
Consistency among replicates of pluripotent, somatic, and germ cell types and variation between DNA methylation Infinium Beadchip array experimental and control groups.
Plots displaying principle component analyses of data from the cell-type-specific susceptibility to BPS via changes in DNA methylation from DNA methylation Infinium Beadchip array data and (d) gene expression from bulk RNA-seq data. The dimensional reduction of the variation in plots displays that replicate samples cluster into regions based on distinct cell identity profiles with only minimal overlap between treatment and control samples.
Figure 6 with 1 supplement
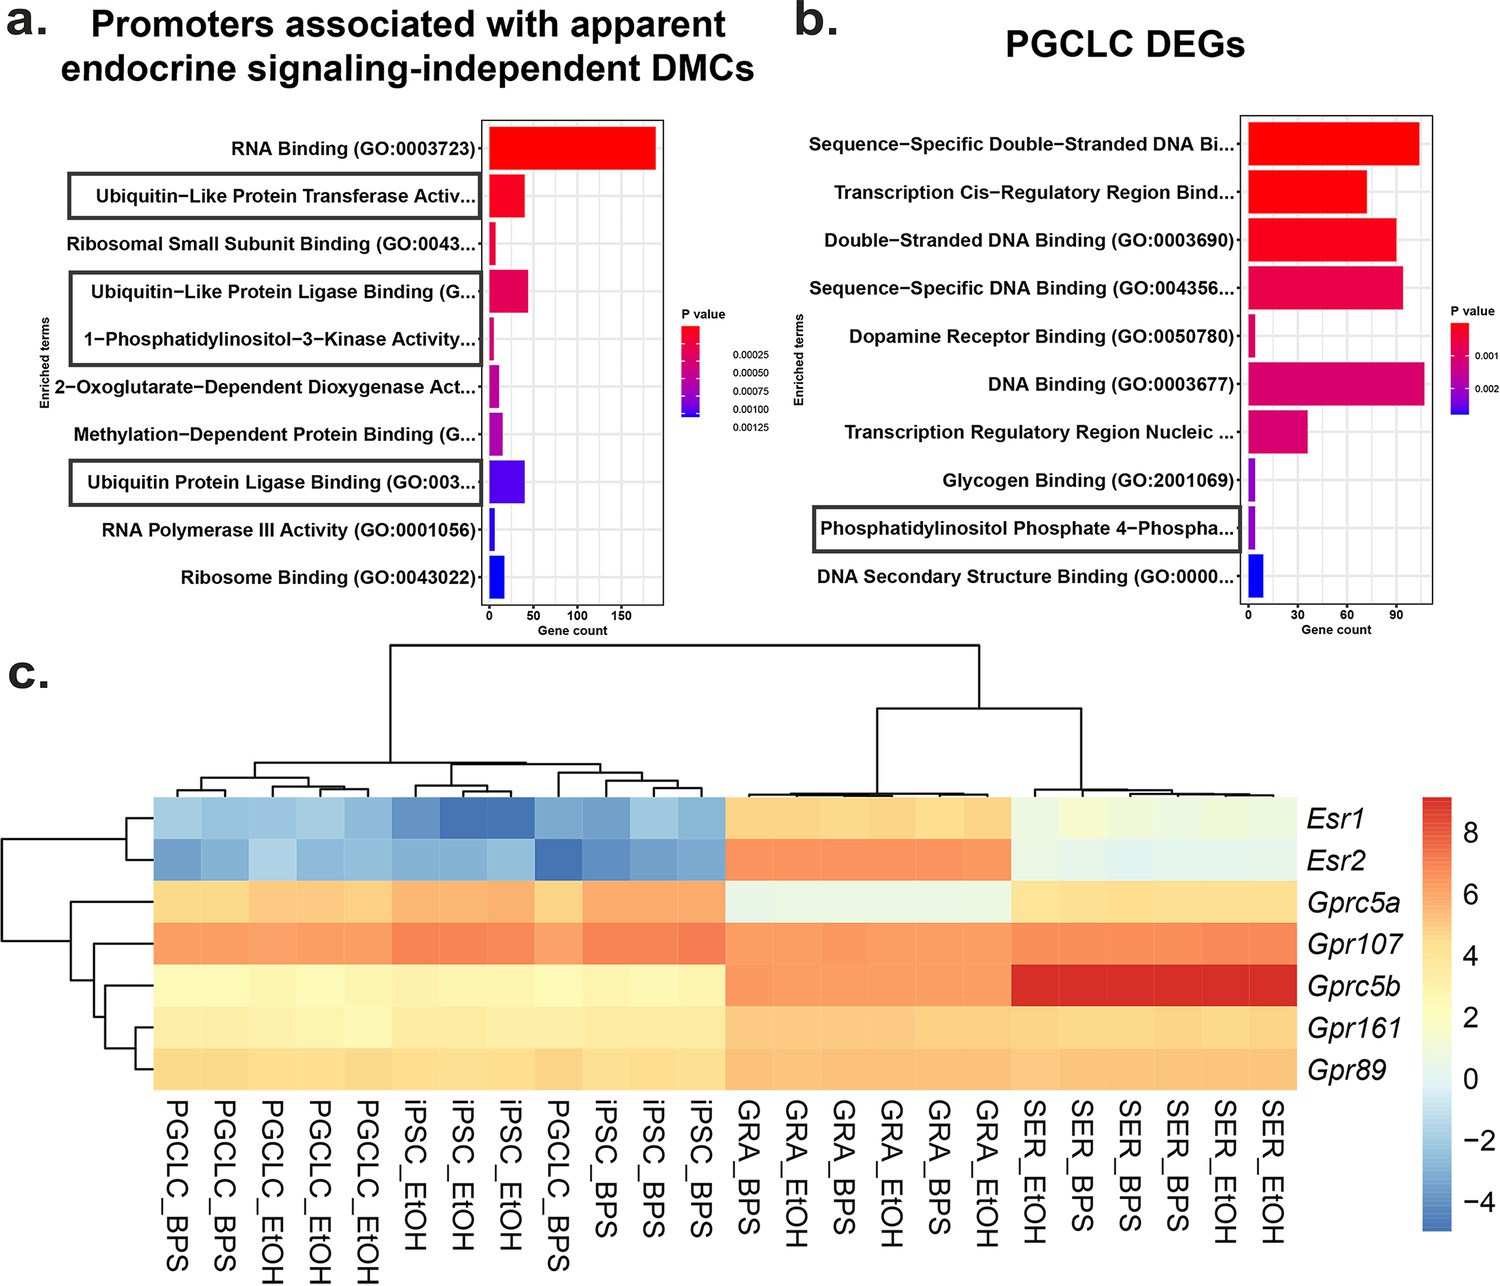
Potential involvement of non-canonical estrogen signaling pathways in BPS-induction of epimutations.
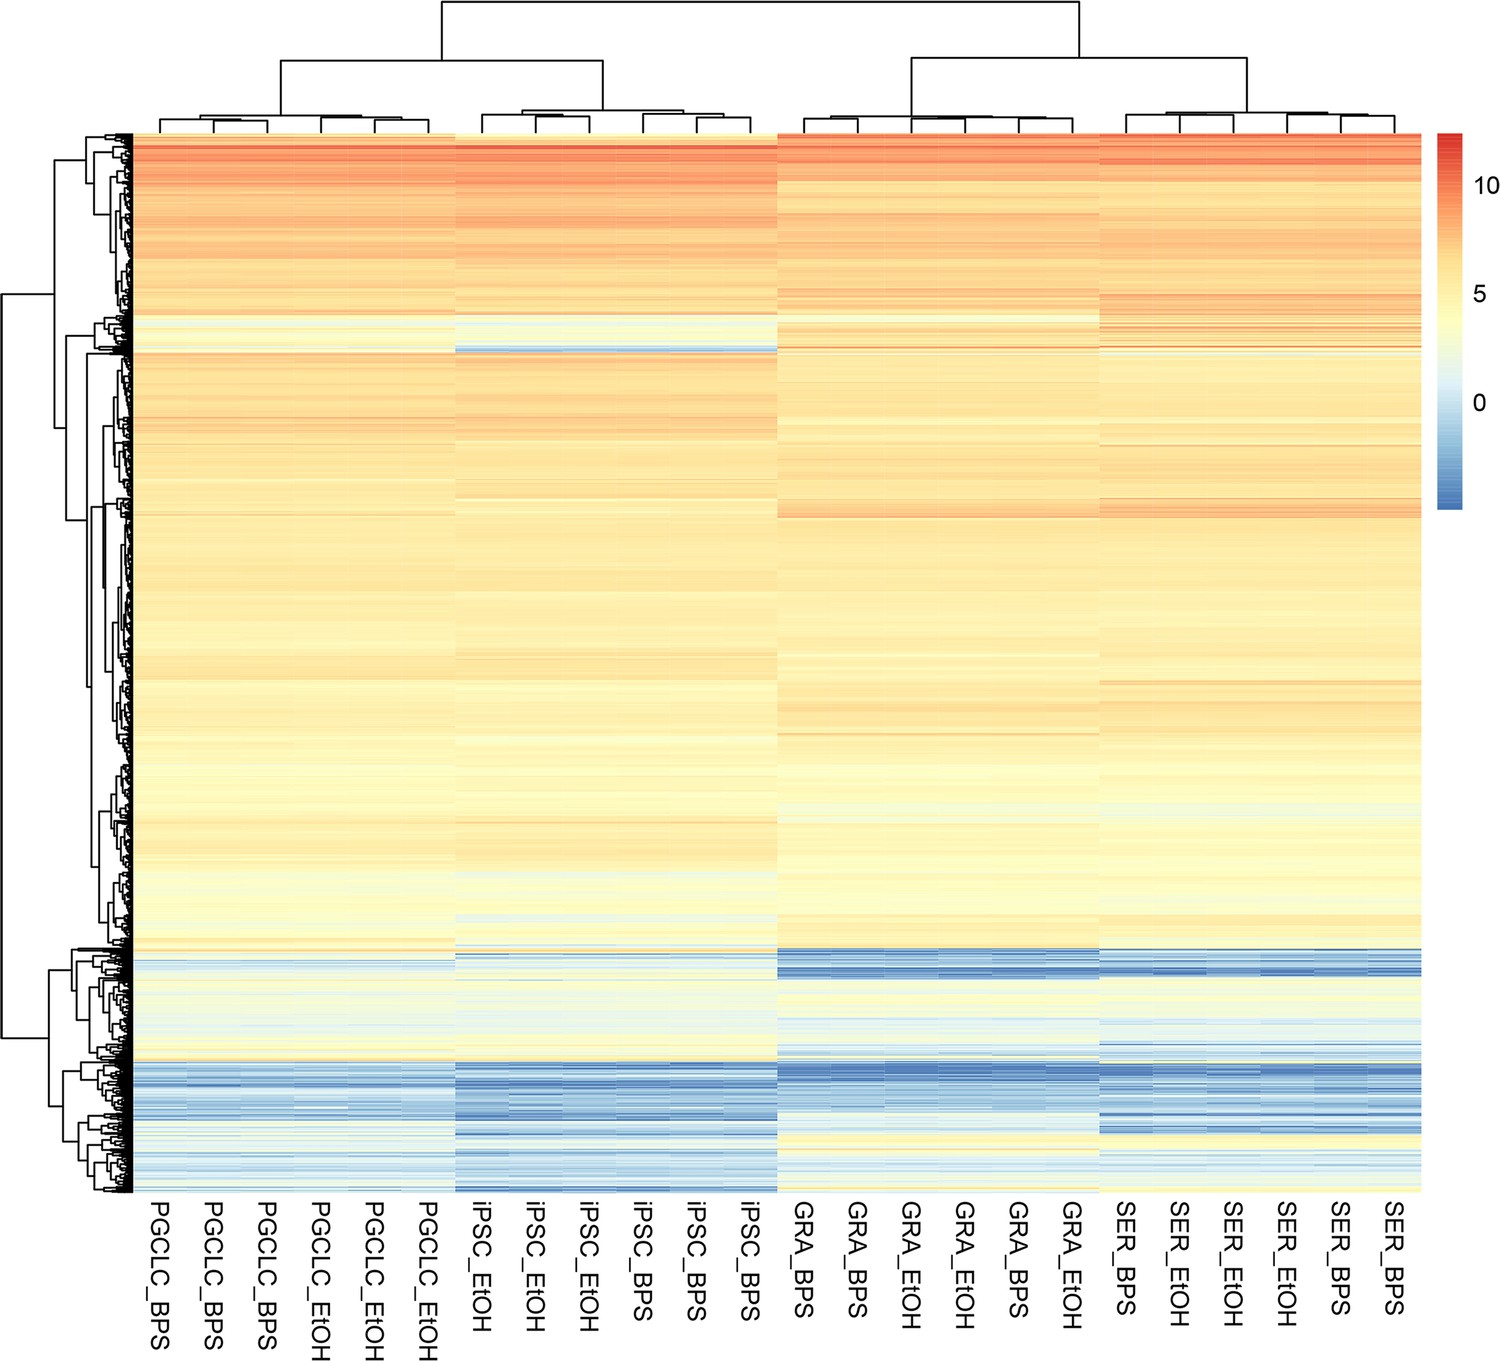
Relative expression of genes (a) enriched for apparent endocrine-signaling independent promoter-region DMCs found in all cell types or (b) dysregulated in PGCLCs which lack expression of estrogen receptors. (c) Heatmap of relative expression of estrogen receptor genes (Esr1 and Esr2) and G-coupled protein receptors (Gprc5a, Gpr107, Gprc5b, Gpr161, and Gpr89) in pluripotent, somatic, and germ cell types. Gprc5a, Gpr107, Gprc5b, Gpr161, and Gpr89 all have been shown to bind to BPA or 17β-estradiol in rat models and represent potential G-coupled protein receptors which could lead to the induction of endocrine-signaling independent DMCs.
Figure 6—figure supplement 1
Differential expression of potential endocrine-signaling independent DMCs.
Heatmap displaying the relative expression of genes with promoters enriched for apparent endocrine-signaling independent DMCs. The majority of these genes displayed a similar pattern of active expression in all cell types examined.
Figure 7 with 4 supplements
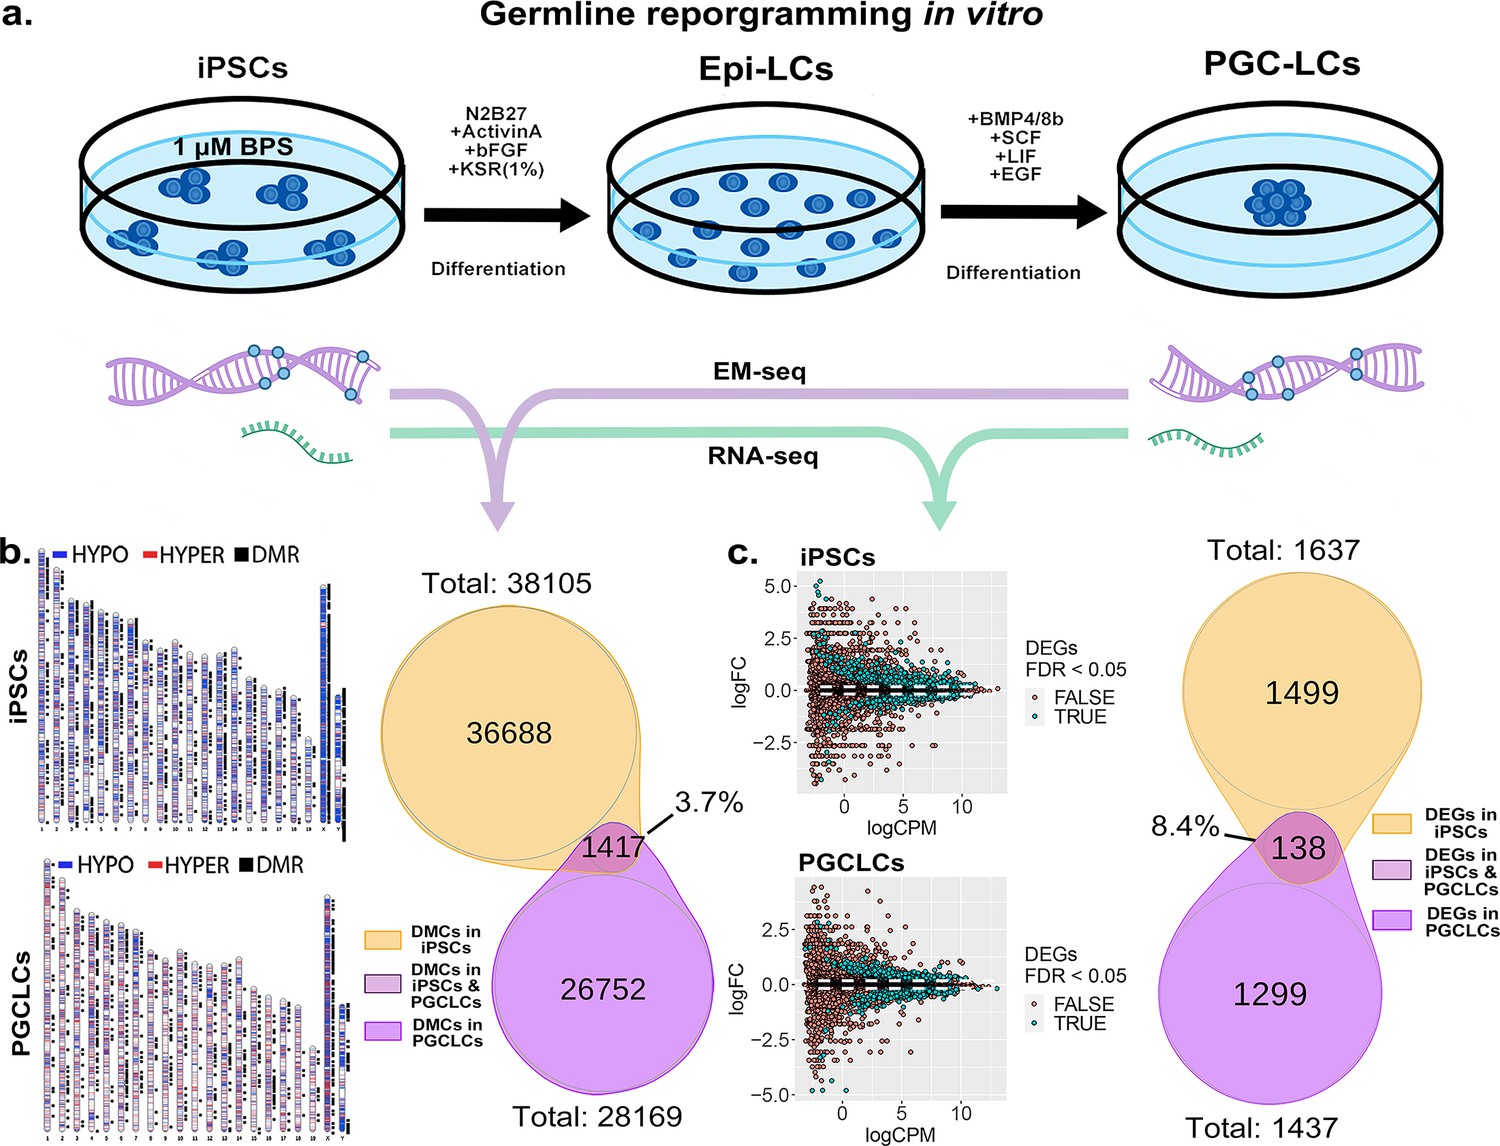
Persistence of BPS-induced epimutations through recapitulation of early germline reprogramming in vitro.
(a) Schematic illustrating derivation of PGCLCs from iPSCs in vitro. iPSCs are first induced to form EpiLCs which are then induced to form PGCLCs. iPSCs were exposed to either ethanol +1 μM BPS or ethanol (carrier) only, then induced to undergo transitions to form EpiLCs and then PGCLCs. (b) DNA samples from BPS-exposed or control iPSCs as well as subsequently derived PGCLCs were assessed for exposure-specific DNA methylation epimutations by EM-seq. BPS-treated iPSCs showed 38,105 DMCs and subsequently derived PGCLCs showed 28,169 DMCs. Of those, only 1417 (3.7%) of the DMCs were conserved from the BPS-exposed iPSCs to the subsequently derived PGCLCs. (c) RNA samples from BPS-exposed or control iPSCs and subsequently derived PGCLCs were assessed for global gene expression patterns by RNA-seq. BPS-treated iPSCs showed 1637 exposure-specific DEGs and subsequently derived PGCLCs showed 1437 exposure-specific DEGs. Of those, only 138 (8.4%) were conserved from the BPS-exposed iPSCs to the subsequently derived PGCLCs.
-
Figure 7—source data 1
Quality control metrics for EM-seq data.
- https://cdn.elifesciences.org/articles/93975/elife-93975-fig7-data1-v1.docx
Figure 7—figure supplement 1
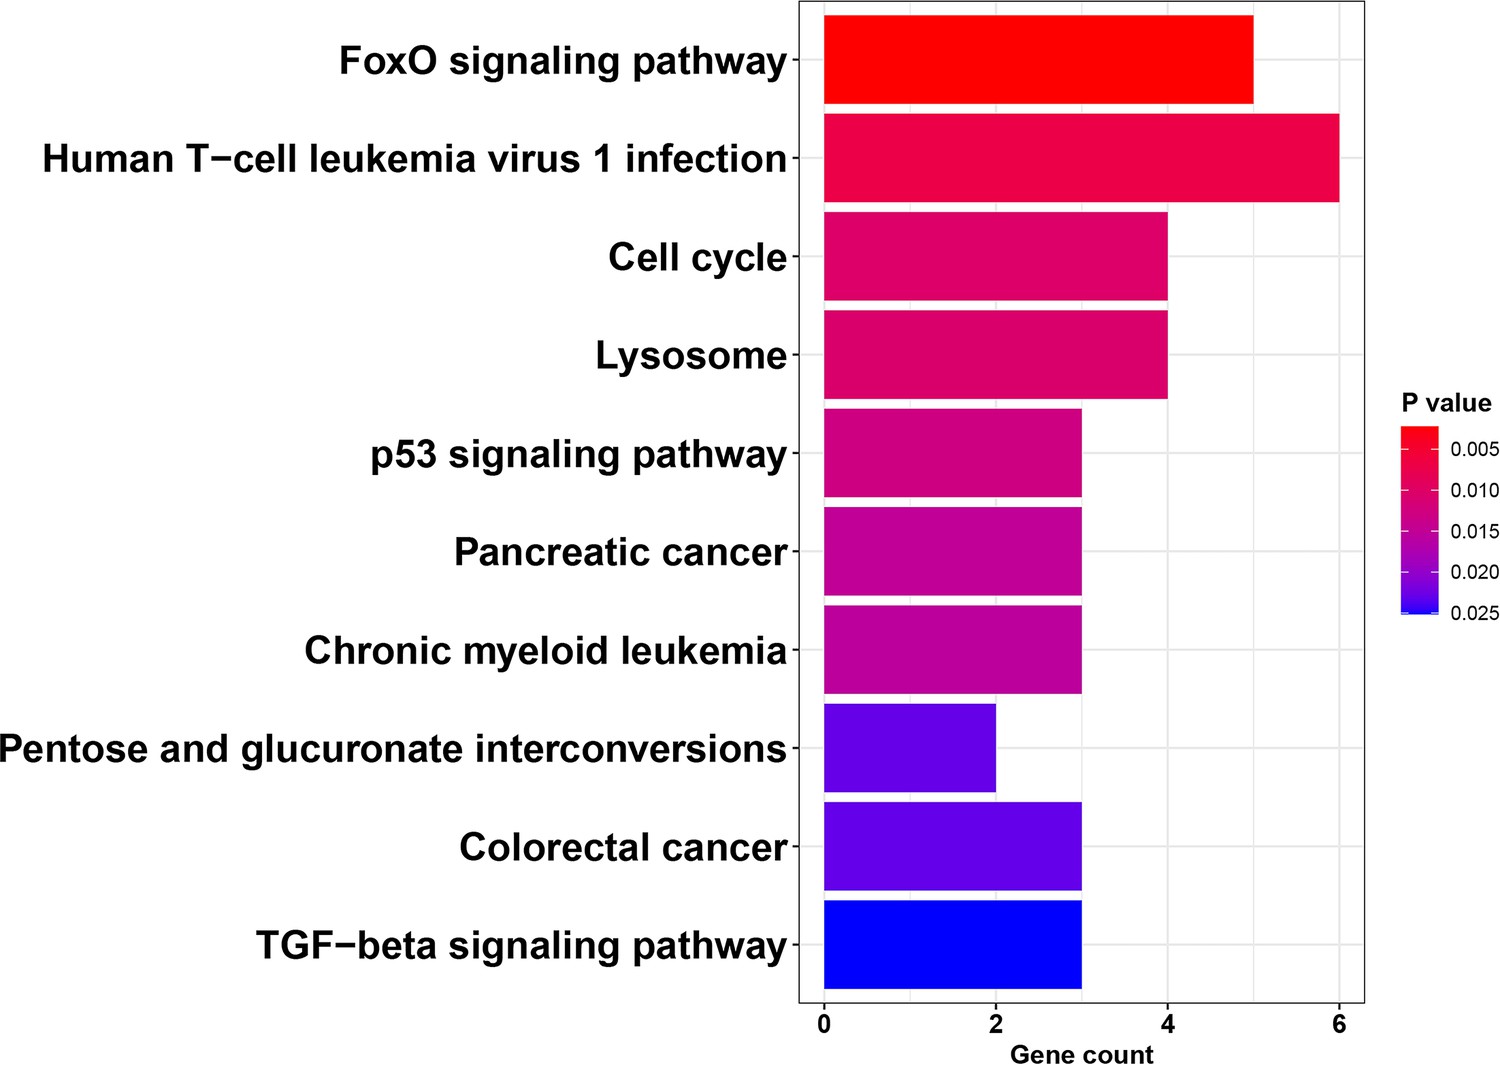
KEGG pathway analysis of DEGs detected in both iPSCs exposed to BPS and PGCLCs derived from the exposed iPSCs.
Analysis of KEGG pathways associated with 138 BPS-induced DEGs that persisted during the transition in cell fate from BPS-exposed iPSCs to PGCLCs revealed genes primarily involved with cell cycle and apoptosis pathways.
Figure 7—figure supplement 2
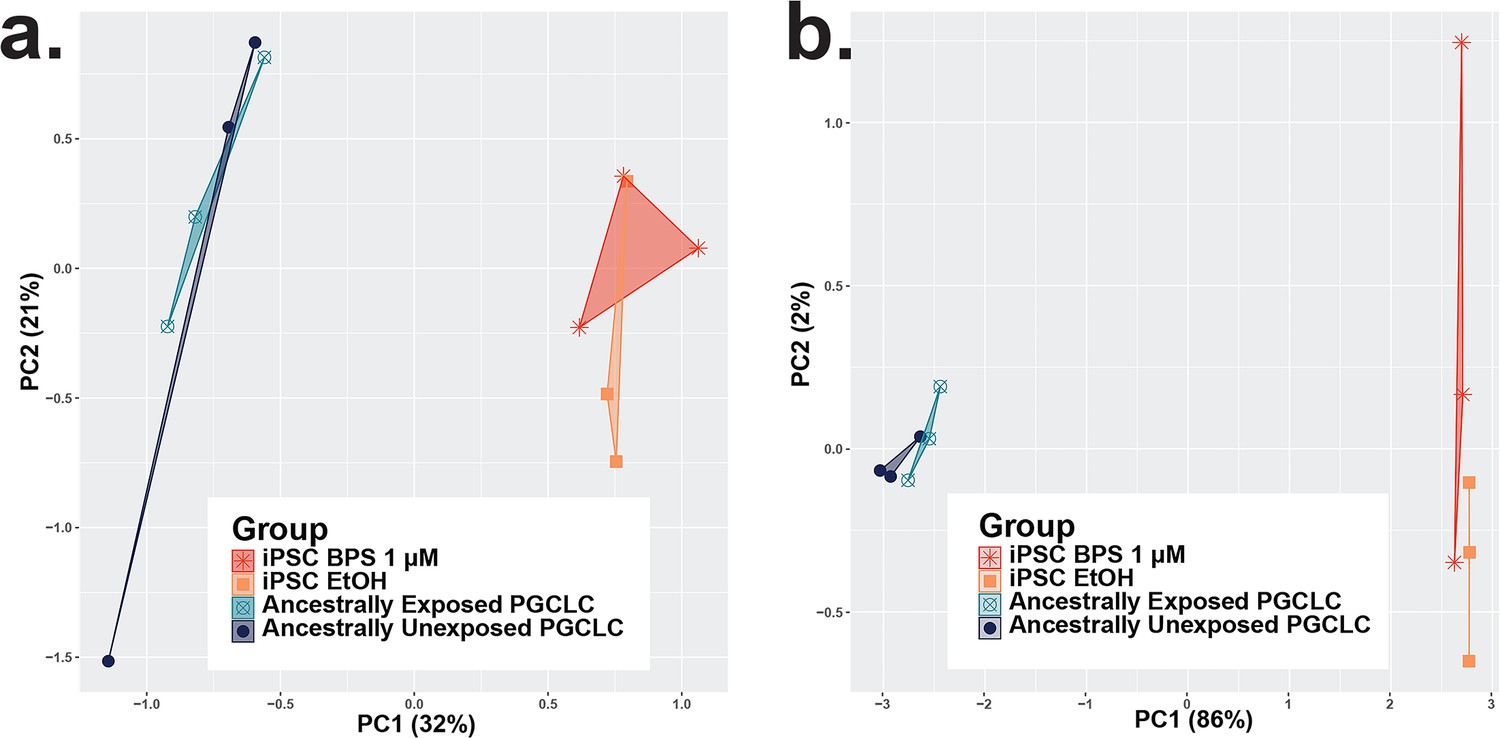
Consistency among iPSC and ancestrally exposed PGC-LC replicates and variation between RNA-seq and EM-seq experimental and control groups.
Plots displaying principle component analyses of data from the persistence of epimutations through transitions in cell states based on (a) DNA methylation from EM-seq data and (b) gene expression from bulk RNA-seq data. Again, replicate samples clustered into regions based on distinct cell identity profiles. However, there is a lack of strong separation between treatment conditions in the second principle component. While the differences in all experiments were sufficient to produce DMCs/DMRs/DEGs, the separation between treatment conditions displayed by the PCA could likely be increased by a larger sample size and indicate a limitation of only having triplicate replicates for this study.
Figure 7—figure supplement 3
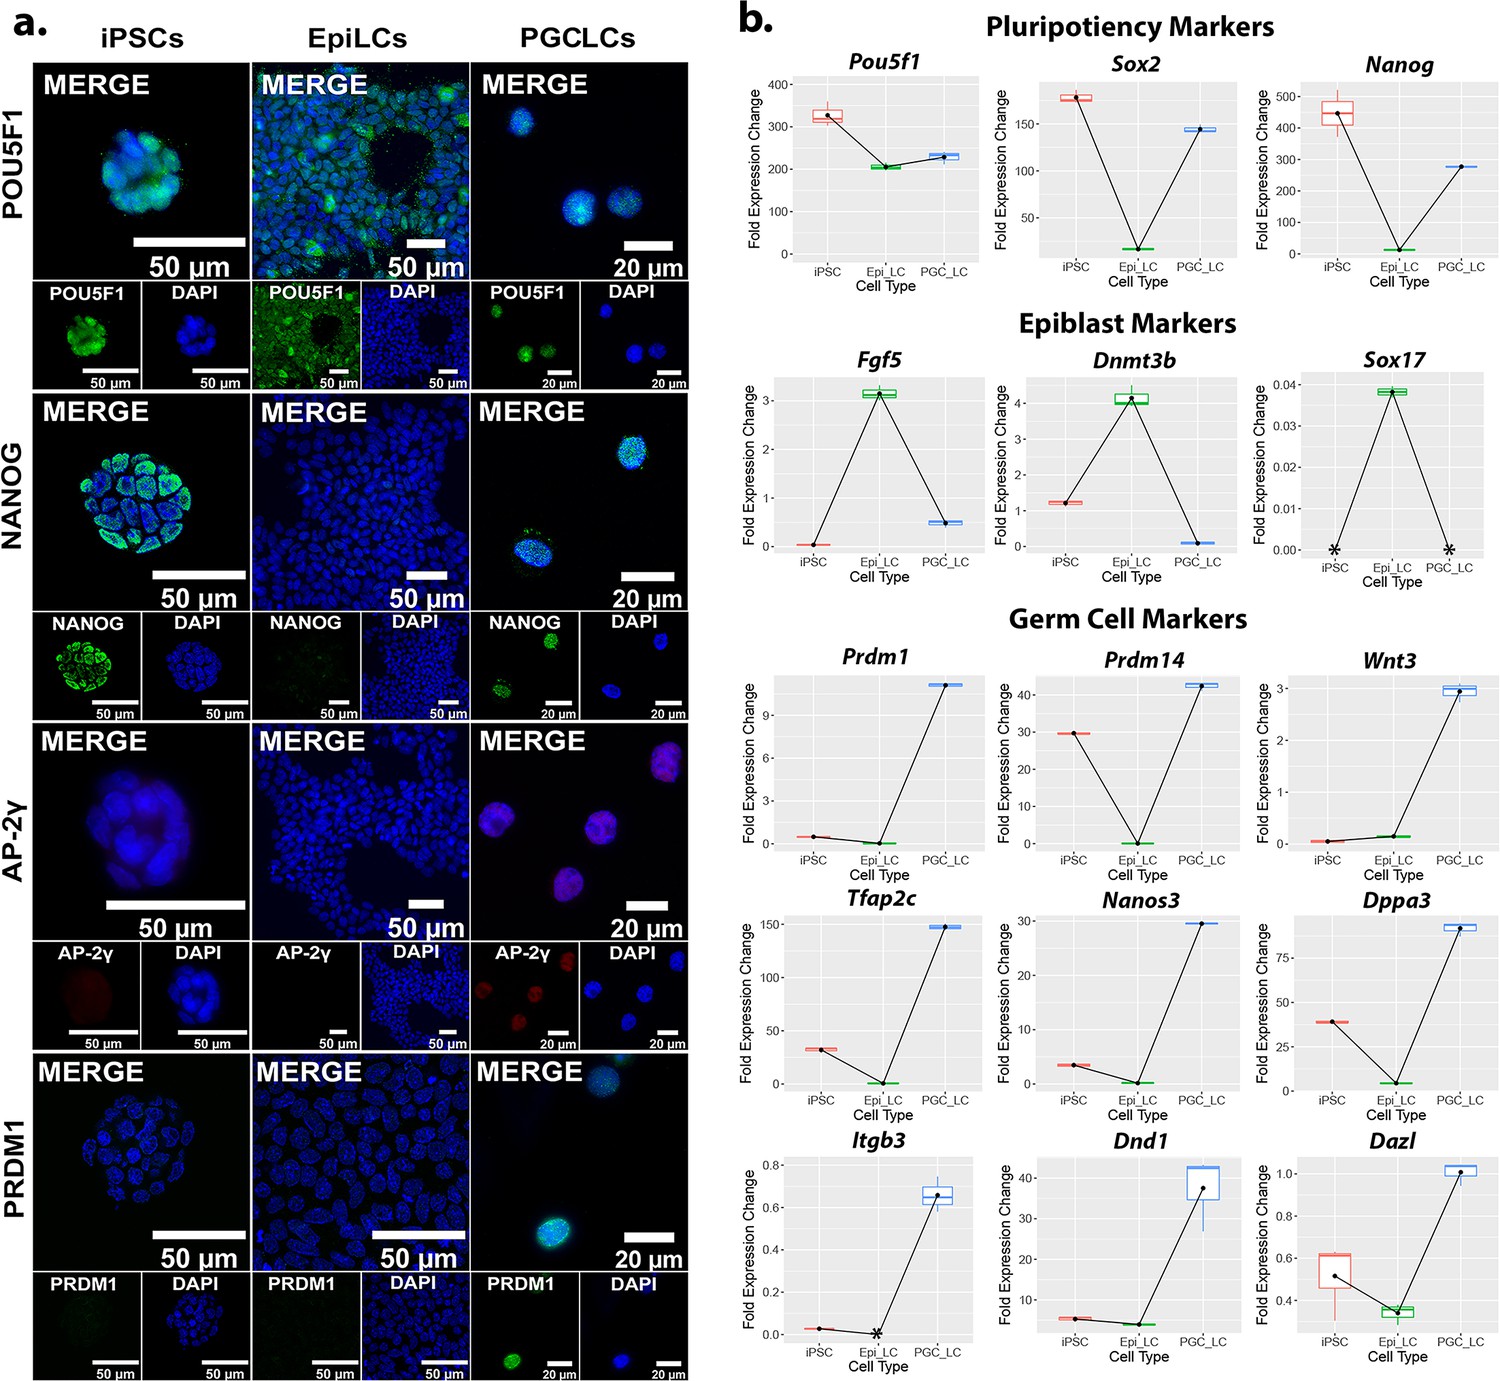
Relative expression of markers for PGCLC induction from iPSCs.
(a) ICC of pluripotency and germ cell marker expression throughout the transition from iPSCs to PGCLCs. (b) qRT-PCR of pluripotency, epiblast, and germ cell markers indicating gene expression profiles during induction of PGCLCs from iPSCs. Each gene fold expression is relative to the housekeeping gene Gusb using the ∆Cq method. The symbol * indicates that the expression of transcripts in the sample was either non-existent or so low as to be undetectable by qRT-PCR.
Figure 7—figure supplement 4
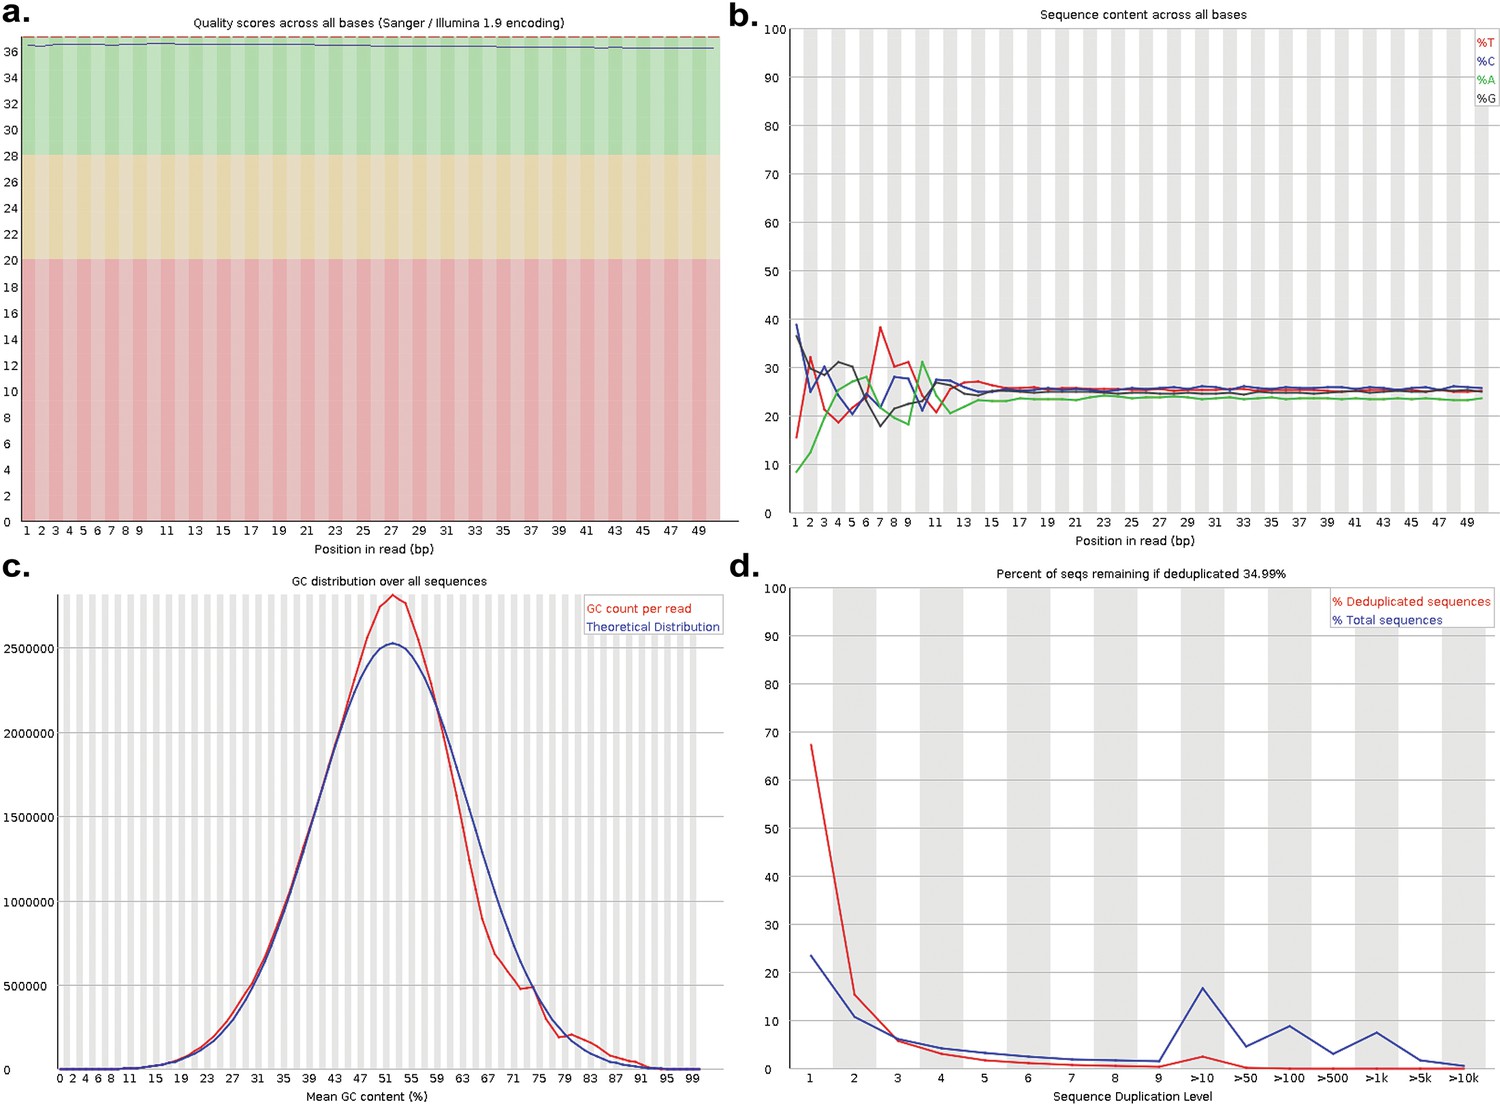
Quality control for RNA-seq data.
RNA-seq quality control data from one of the three PGCLC replicates exposed to BPS as an example. (a) Base calls showed high-quality scores (phred scores >30) for all bases in reads. (b) Reads showed equal distributions of all four bases following the initial adaptor sequence and sufficient base complexity. (c) Distribution of GC sequences across reads aligned very closely with the theoretical distribution. (d) Duplication plot indicates deduplicated libraries contained ~67% unique sequences which indicates sufficient library complexity for subsequent downstream data processing.
Tables
Table 1
DEGs containing DMCs observed in iPSC exposed to increasing doses of BPS.
| DEGs containing DMCs | iPSC 1 μM | iPSC 50 μM | iPSC 100 μM |
|---|---|---|---|
| Promoter | 264 (19.82%) | 693 (17.04%) | 1136 (22.37%) |
| Gene body | 436 (32.73%) | 1541 (37.91%) | 1934 (38.08%) |
Table 2
Treatment-specific differentially methylated sites (DMCs) (treated vs. control).
| DMCs | Sertoli | Granulosa | iPSCs | PGCLCs |
|---|---|---|---|---|
| Hypomethylated* | 7385 | 6444 | 9651 | 2315 |
| Hypermethylated† | 3022 | 4143 | 4308 | 4785 |
| Total | 10,407 | 10,587 | 13,959 | 7100 |
-
*
A CpG site that was predominantly methylated in the control samples but unmethylated in the exposed samples.
-
†
A CpG site that was predominantly unmethylated in the control samples but methylated in the exposed samples.
Table 3
Summary of ERE annotations.
| CpG islands | Repeat regions | Gene bodies | Promoters | Enhancers |
|---|---|---|---|---|
| 25,079 | 2,631,743 | 2,448,668 | 172,707 | 468,072 |
Table 4
Exposure-specific differentially expressed genes*.
| DEGs | Sertoli | Granulosa | iPSCs | PGCLCs |
|---|---|---|---|---|
| Down-regulated | 3 | 0 | 343 | 844 |
| Up-regulated | 32 | 2 | 694 | 1046 |
| Total | 35 | 2 | 1037 | 1890 |
-
*
Genes showing significant differential expression following exposure of each cell type to 1 µM BPS relative to matched control cell types exposed to carrier only.
Appendix 1—key resources table
| Reagent type (species) or resource | Designation | Source or reference | Identifiers | Additional information |
|---|---|---|---|---|
| Genetic reagent (M. musculus) | R26rtTA; Col1a12lox-4F2A | The Jackson Laboratory | 011011 | |
| Cell line (M. musculus) | CF1 Mouse embryonic fibroblasts, MitC-treated | Thermo Fisher Scientific | A34959 | |
| Chemical compound | Dulbecco’s Modified Eagle Medium (DMEM) | Thermo Fisher Scientific | 10313021 | High glucose, pyruvate, no glutamine |
| Chemical compound | Fetal bovine serum (FBS) | Thermo Fisher Scientific | 10439024 | Embryonic stem-cell FBS, qualified, USDA-approved regions |
| Chemical compound | Leukemia inhibitory factor (LIF) | Millipore Sigma | ESG1107 | ESGRO Recombinant Mouse LIF Protein |
| Chemical compound | DMEM/F12 | Thermo Fisher Scientific | 21041025 | No phenol red |
| Chemical compound | Insulin | Millipore Sigma | I1882 | From bovine pancreas |
| Chemical compound | Apo-Transferrin | Millipore Sigma | T1147 | From human |
| Chemical compound | Bovine Serum Albumin (BSA) | Thermo Fisher Scientific | 15260037 | Fraction V (7.5% solution) |
| Chemical compound | Progesterone | Millipore Sigma | P8783 | |
| Chemical compound | Putrescine dihydrochloride | Millipore Sigma | P5780 | |
| Chemical compound | Sodium selenite | Millipore Sigma | S5261 | |
| Chemical compound | Neurobasal | Thermo Fisher Scientific | 12348017 | No phenol red |
| Chemical compound | B-27 | Thermo Fisher Scientific | 12587010 | (50 X), minus vitamin A |
| Chemical compound | Penicillin-streptomycin | Thermo Fisher Scientific | 15070063 | (5,000 U/mL) |
| Chemical compound | GlutaMAX | Thermo Fisher Scientific | 35050061 | (100 X) |
| Chemical compound | 2-Mercaptoethanol | Thermo Fisher Scientific | 21985023 | (1000 X) |
| Chemical compound | CHIR99021 | BioVision | 1677–5 | |
| Chemical compound | PD0325901 | Amsbio | 04-0006-02 | 10 mM in DMSO |
| Chemical compound | Recombinant Human/ Murine/Rat Activin A | PeproTech | 120–14 | Insect derived |
| Chemical compound | Recombinant Human FGF-Basic (FGF-2/bFGF) | Thermo Fisher Scientific | 13256–029 | |
| Chemical compound | KnockOut Serum | Thermo Fisher Scientific | 10828028 | |
| Chemical compound | Glasgow's MEM (GMEM) | Thermo Fisher Scientific | 11710035 | |
| Chemical compound | Recombinant human bone morphogenetic protein 4 (BMP-4) | R&D Systems | 314 BP-010 | |
| Chemical compound | Recombinant mouse stem cell factor (SCF) | R&D Systems | 455-MC-010 | |
| Chemical compound | Recombinant human epidermal growth factor (EGF), carrier free (CF) | R&D Systems | 2028-EG-200 | |
| Chemical compound | Dulbecco’s phosphate- buffered saline (DPBS) | Thermo Fisher Scientific | 14040133 | |
| Chemical compound | Deoxyribonuclease I (DNaseI) | Millipore Sigma | DN25 | From bovine pancreas |
| Chemical compound | Trypsin (2.5%) | Thermo Fisher Scientific | 15090046 | No phenol red |
| Chemical compound | Soybean trypsin inhibitor | Thermo Fisher Scientific | 17075029 | |
| Chemical compound | Collagenase type IV | Worthington | LS004188 | From Clostridium histolyticum |
| Chemical compound | Sertoli Cell Medium | ScienCell Research Laboratories | 4521 | |
| Chemical compound | Ethanol (EtOH) | Fisher | BP28184 | (200 Proof) |
| Chemical compound | BSA | Millipore Sigma | A9085 | |
| Chemical compound | Heat inactivated (HI) FBS | Thermo Fisher Scientific | 10082147 | |
| Chemical compound | Trypsin-EDTA (0.25%) | Thermo Fisher Scientific | 25200072 | With phenol red |
| Chemical compound | Bisphenol S (BPS) | Millipore Sigma | 43034–100 MG | |
| Chemical compound | Phenol:Chloroform:Isoamyl Alcohol (25:24:1, v/v) | Thermo Fisher Scientific | 15593031 | |
| Chemical compound | TRIzol | Thermo Fisher Scientific | 15596026 | |
| Chemical compound | Isopropanol | Thermo Fisher Scientific | 327272500 | |
| Chemical compound | Proteinase K Solution (20 mg/mL) | Thermo Fisher Scientific | 25530049 | |
| Chemical compound | MaXtract High Density | Quiagen | 129046 | Phase lock gel tubes |
| Chemical compound | Sodium Acetate Solution | Thermo Fisher Scientific | R1181 | 3 M, pH 5.2 |
| Chemical compound | Glycogen (5 mg/ml) | Thermo Fisher Scientific | AM9510 | |
| Chemical compound | NaCl | Thermo Fisher Scientific | J21618.36 | |
| Chemical compound | Tris base | Millipore Sigma | 77-86-1 | |
| Chemical compound | Ethylenediaminetetraacetic acid (EDTA) | Millipore Sigma | E9884-100G | |
| Chemical compound | Sodium dodecyl sulfate (SDS) | Millipore Sigma | 151-21-3 | |
| Chemical compound | Triton X-100 | Thermo Fisher Scientific | 85111 | |
| Chemical compound | RQ1 DNase | Promega | M6101 | |
| Chemical compound | Propidium iodide | BioLegend | 421301 | FCy 5 μL/106 cells |
| Antibody | ERα | Thermo Fisher Scientific | MA1-310 | Host: mouse monoclonal, ICC 1:100 |
| Antibody | ERβ | GeneTex | GTX70174 | Host: mouse monoclonal, ICC 1:100 |
| Antibody | INHA | Invitrogen | PA5-13681 | Host: rabbit polyclonal, ICC 1:25 |
| Antibody | FSHR | Affinity | AF5477 | Host: rabbit polyclonal, ICC 1:250 |
| Antibody | SOX9 | Abcam | ab185966 | Host: rabbit monoclonal, ICC 1:100 |
| Antibody | GAPDH | Novus | NB300-221 | Host: mouse monoclonal, ICC 1:100 |
| Antibody | WT1 | Novus | NBP2-67587 | Host: rabbit monoclonal, ICC 1:100 |
| Antibody | FUT4 | GeneTex | GTX34467 | Host: rabbit monoclonal, ICC 1:50 |
| Antibody | NANOG | Abcam | ab80892 | Host: rabbit polyclonal, ICC 1:100 |
| Antibody | POU5F1 | Abcam | ab19857 | Host: rabbit polyclonal, ICC 1:200 |
| Antibody | SOX2 | Abcam | ab97959 | Host: rabbit polyclonal, ICC 1:200 |
| Antibody | ID4 | Thermo Fisher Scientific | PA5-26976 | Host: rabbit polyclonal, ICC 1:50 |
| Antibody | AR | Santa Cruz | sc-7305 | Host: mouse monoclonal, ICC 1:50 |
| Antibody | PPARγ | Santa Cruz | sc-7273 | Host: mouse monoclonal, ICC 1:200 |
| Antibody | RXRα | Invitrogen | 433900 | Host: mouse monoclonal, ICC 1:200 |
| Antibody | PRDM1 | Thermo Fisher Scientific | 14-5963-82 | Host: rat monoclonal, ICC 1:50 |
| Antibody | Goat Anti Mouse Alexa 647 | Abcam | ab150119 | Host: goat polyclonal, ICC 1:200 |
| Antibody | Goat Anti Rabbit Alexa 488 | Abcam | ab150081 | Host: goat polyclonal, ICC 1:1000 |
| Antibody | Goat Anti Rabbit Alexa 647 | Abcam | ab150179 | Host: goat polyclonal, ICC 1:200 |
| Antibody | Goat Anti Rat Alexa 647 | Thermo Fisher Scientific | A21247 | Host: goat polyclonal, ICC 1:200 |
| Antibody | FUT4 (IgM, κ), brilliant violet 421 | BD Horizon | 562705 | Host: mouse monoclonal, FCy 5 μL/106 cells |
| Antibody | ITGB3 (IgG), PE | BioLegend | 104307 | Host: hamster monoclonal, FCy 1 μL/106 cells |
| Antibody | IgM, κ Isotype control, brilliant violet 421 | BD Horizon | 562704 | Host: mouse monoclonal, FCy 1.25 μL/106 cells |
| Antibody | IgG Isotype control, PE | BioLegend | 400907 | Host: hamster monoclonal, FCy 1 μL/106 cells |
| Commercial assay or kit | RNA Clean & Concentrator-5 | Zymo Research | R1016 | |
| Commercial assay or kit | Genomic DNA Clean & Concentrator-10 | Zymo Research | D4011 | |
| Commercial assay or kit | EZ DNA Methylation Kit | Zymo Research | D5001 | |
| Commercial assay or kit | SuperScript III One-Step RT-PCR System with Platinum Taq DNA Polymerase | Thermo Fisher Scientific | 12574026 | |
| Commercial assay or kit | PowerTrack SYBR Green Master Mix for qPCR | Thermo Fisher Scientific | A46109 | |
| Commercial assay or kit | Infinium Mouse Methylation BeadChip | Illumina | 20041558 | |
| Commercial assay or kit | RNA ScreenTape & Reagents | Agilent | 5067–5576 | |
| Commercial assay or kit | DNA ScreenTape & Reagents | Agilent | 5067–5583 | |
| Commercial assay or kit | Qubit dsDNA (Broad Range) BR Assay Kit | Thermo Fisher Scientific | Q32850 | |
| Commercial assay or kit | Qubit RNA (high sensitivity) HS Assay Kit | Thermo Fisher Scientific | Q32855 | |
| Commercial assay or kit | NEBNext Ultra II Directional RNA Library Prep Kit for Illumina | New England BioLabs | E7765 | |
| Commercial assay or kit | NEBNext Poly(A) mRNA Magnetic Isolation Module | New England BioLabs | E3370 | |
| Software, algorithm | ZEISS ZEN Microscopy Software | https://www.zeiss.com/microscopy/en/products/software/zeiss-zen.html | ZEN 3.7 | RRID:SCR_013672 |
| Software, algorithm | Primer-BLAST | https://www.ncbi.nlm.nih.gov/tools/primer-blast/ | RRID:SCR_003095 | |
| Software, algorithm | QuantSudtio Design & Analysis Software | https://www.thermofisher.com/us/en/home/technical-resources/software-downloads/quantstudio-3-5-real-time-pcr-systems.html | QuantStudio v1.5.1 | |
| Software, algorithm | Fiji | https://fiji.sc/ | Fiji v1.54f | RRID:SCR_002285; Schindelin et al., 2012 |
| Software, algorithm | Bfastq2 | https://support.illumina.com/downloads/bcl2fastq-conversion-software-v2-20.html | Bcl2fastq2 v2.20 | |
| Software, algorithm | FastQC | https://www.bioinformatics.babraham.ac.uk/projects/fastqc/ | FastQC 0.12.0 | RRID:SCR_014583; Andrews et al., 2023; Smith and de Sena Brandine, 2021 |
| Software, algorithm | Wg-blimp | https://github.com/MarWoes/wg-blimp | Wg-blimp v0.10.0 | Lehle and McCarrey, 2023; Wöste et al., 2020 |
| Software, algorithm | R-Project for Statistical Computing | http://www.r-project.org/ | R 4.2.1 | Packages: SeSAMe Ding et al., 2023; Triche et al., 2013; Zhou et al., 2022, Zhou et al., 2018, stringr RRID:SCR_022813; Wickham and RStudio, 2022, kintr RRID:SCR_018533; Xie et al., 2023, SummarizedExperiment Morgan et al., 2023, ggrepel RRID:SCR_017393; Slowikowski et al., 2023, pals Wright, 2023, wheatmap Zhou, 2022, magrittr Bache et al., 2022, ggplot2 RRID:SCR_014601; Wickham et al., 2023a, dplyr RRID:SCR_016708; Wickham et al., 2023b, tidyr RRID:SCR_017102; Wickham et al., 2023c ggvenn RRID:SCR_025300; Yan, 2023, RColorBrewer RRID:SCR_016697; Neuwirth, 2022, RIdeogram Hao et al., 2020, AnnotationDbi RRID:SCR_023487; Pagès et al., 2023, Mus.musculus Team, 2015, BSgenome.Mmusculus.UCSC.mm10 Team, 2021, GenomicRanges RRID:SCR_000025; Lawrence et al., 2013, universalmotif Tremblay, 2023, memes RRID:SCR_001783; Nystrom, 2023, plyranges RRID:SCR_021324; Lee et al., 2019, rtracklayer RRID:SCR_021325; Lawrence et al., 2009, Rsubread RRID:SCR_016945; Liao et al., 2019, edgeR RRID:SCR_012802; Chen et al., 2016; McCarthy et al., 2012; Robinson et al., 2010 |
Additional files
-
MDAR checklist
- https://cdn.elifesciences.org/articles/93975/elife-93975-mdarchecklist1-v1.docx
-
Supplementary file 1
Persisting DEGs in PGCLCs derived from iPSCs exposed to 1uM BPS.
- https://cdn.elifesciences.org/articles/93975/elife-93975-supp1-v1.csv
-
Supplementary file 2
Validation of normal karyotype analysis of MF5-9-1 iPSCs.
iPSCs from reprogrammed MEFs were validated for a normal karyotype prior to use in this project.
- https://cdn.elifesciences.org/articles/93975/elife-93975-supp2-v1.docx
-
Supplementary file 3
iPSC, EpiLC, and PGCLC Culture Media Components.
- https://cdn.elifesciences.org/articles/93975/elife-93975-supp3-v1.docx
-
Supplementary file 4
Preparation of primary cultures of Sertoli cells from mice.
- https://cdn.elifesciences.org/articles/93975/elife-93975-supp4-v1.docx
-
Supplementary file 5
Preparation of primary cultures of granulosa cells from mice protocol.
- https://cdn.elifesciences.org/articles/93975/elife-93975-supp5-v1.docx
-
Supplementary file 6
qRT-PCR primers.
- https://cdn.elifesciences.org/articles/93975/elife-93975-supp6-v1.docx
Download links
A two-part list of links to download the article, or parts of the article, in various formats.
Downloads (link to download the article as PDF)
Open citations (links to open the citations from this article in various online reference manager services)
Cite this article (links to download the citations from this article in formats compatible with various reference manager tools)
An in vitro approach reveals molecular mechanisms underlying endocrine disruptor-induced epimutagenesis
eLife 13:RP93975.
https://doi.org/10.7554/eLife.93975.4


