Feedback inhibition by a descending GABAergic neuron regulates timing of escape behavior in Drosophila larvae
- Department of Biology, McGill University, Canada
- Integrated Program of Neuroscience, McGill University, Canada
- Alan Edwards Center for Research on Pain, McGill University, Canada
Figures
Figure 1 with 2 supplements
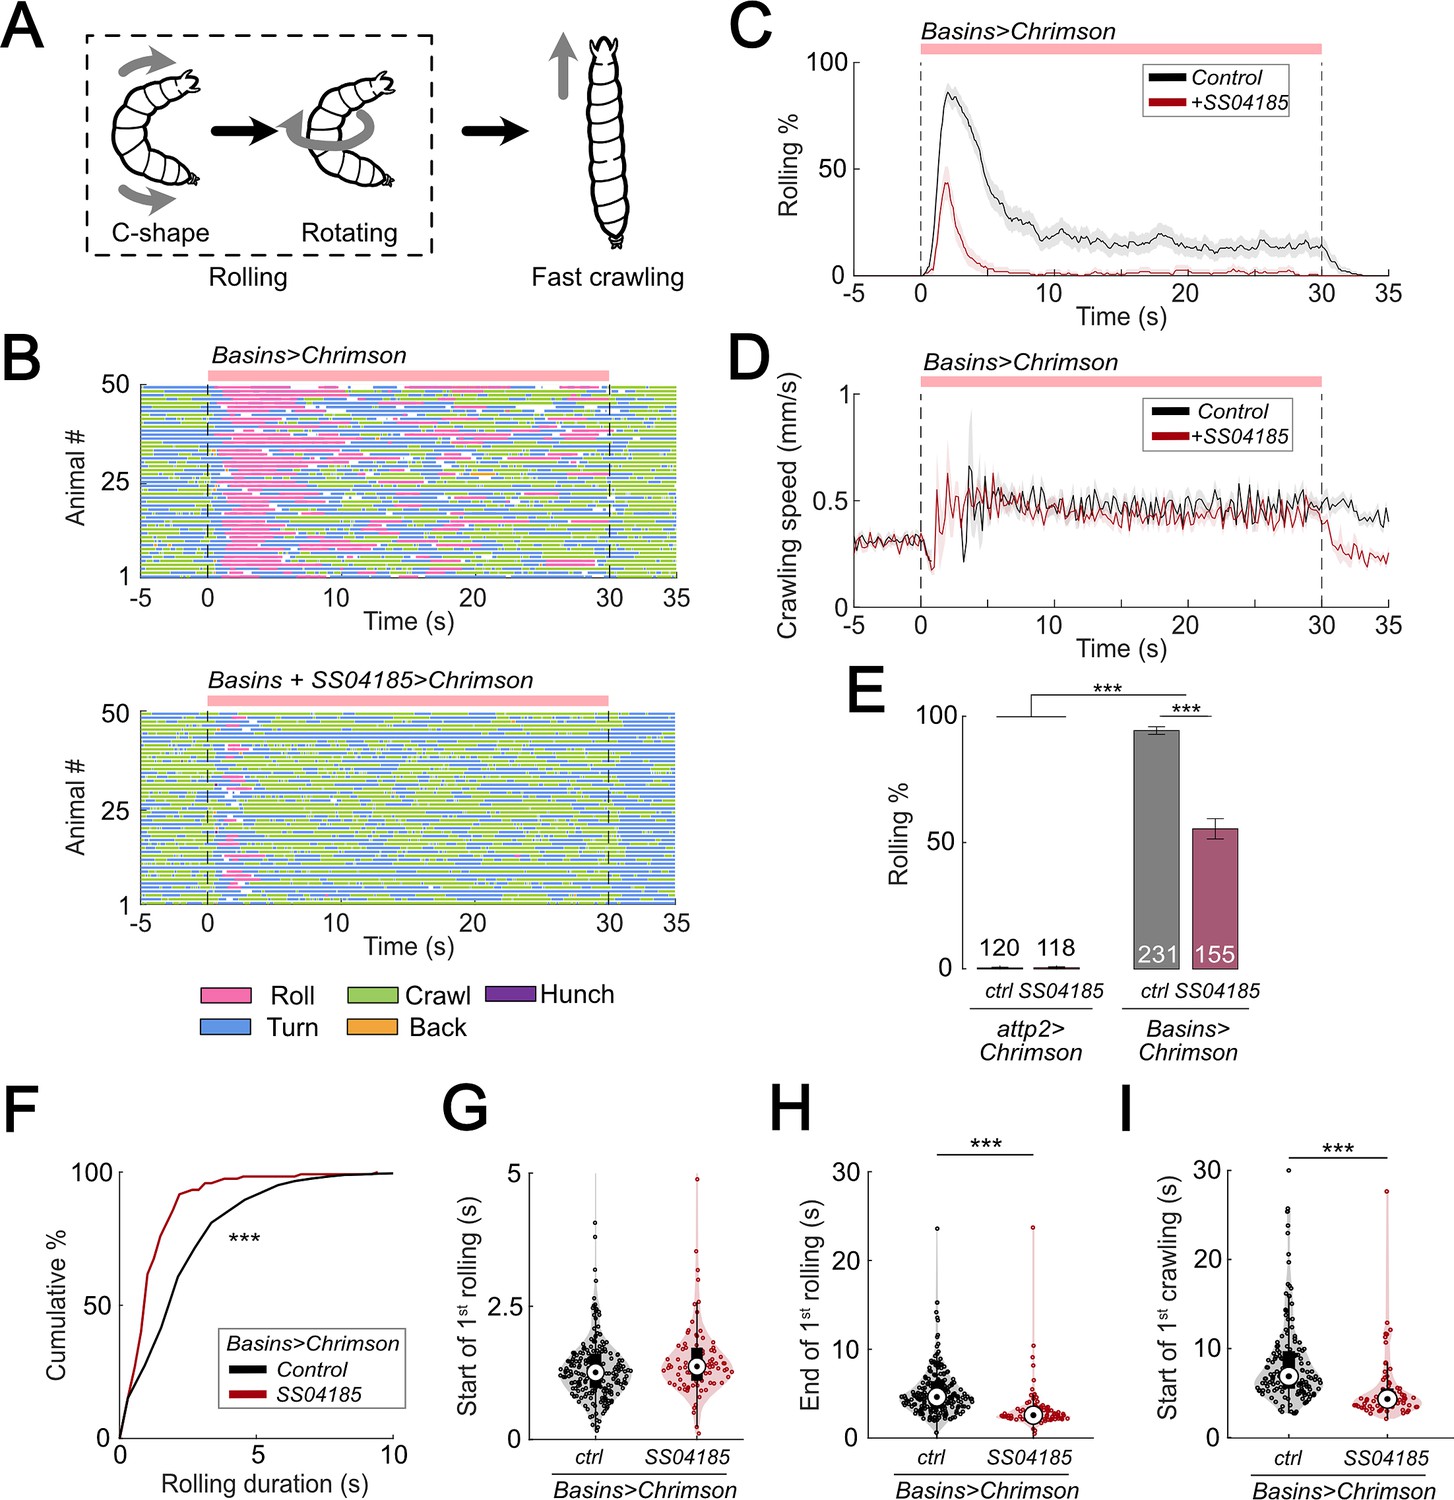
Activation of SS04185 inhibits rolling evoked by activation of Basin neurons.
(A) Schematic of Drosophila larval escape behavior sequence. (B) Ethograms of Basin activation (top panel) and co-activation of SS04185 and Basins (bottom panel). Each row represents an individual larva. Pink, blue, green, orange, and purple lines represent bouts of rolling, turning, crawling, backward crawling, and hunching. The red bar and dashed lines indicate the time window during which neural activation was present. Genotypes: 20xUAS-IVS-CsChrimson::mVenus/+;+; R72F11-Gal4/+ (top); 20xUAS-IVS-CsChrimson::mVenus/+; R54B01-Gal4.AD/+; R46E07-Gal4.DBD/ R72F11-Gal4 (bottom). Genotypes in (C, D, F–I) are the same as those mentioned here. (C) Time series of larval crawling speed during co-activation of SS04185 and Basins (red) and activation of Basins alone (black). Shaded areas represent the standard error. The red bar and dashed lines denote the optogenetic stimulation window. (D) Time series of rolling probabilities of larvae during co-activation of SS04185 and Basins (red) and activation of Basins alone (black). Shaded areas represent 95% confidential intervals for rolling probabilities. The red bar and dashed lines denote the optogenetic stimulation window. (E) Rolling probabilities of larvae with activation of different neurons. Error bars represent the 95% confidence interval. Genotypes from left to right: (1) 20xUAS-IVS-CsChrimson::mVenus/+;;, (2) 20xUAS-IVS-CsChrimson::mVenus/+; R54B01-Gal4.AD/+; R46E07-Gal4.DBD/+, (3) 20xUAS-IVS-CsChrimson::mVenus/+;; R72F11-Gal4/+, and (4) 20xUAS-IVS-CsChrimson::mVenus/+; R54B01-Gal4.AD/+; R46E07-Gal4.DBD/ R72F11-Gal4. n = 120, 118, 231, 155 from left to right. Statistics: Chi-square test, χ2 = 0, p > 0.05 for the first two groups; χ2 = 83.85, p < 0.001 for the last two groups; and χ2 = 365.51, p < 0.001 for the comparison between the first two groups and the last two groups. (F) Cumulative plot of rolling duration. Statistics: Mann–Whitney U test, p < 0.001, n = 652, 120. (G) A violin plot showing start of first rolling bout for each larva during stimulation. Statistics: Mann–Whitney U test, p = 0.027, n = 225, 89. (H) A violin plot displaying end of first rolling bout for each larva during stimulation. Statistics: Mann–Whitney U test, p < 0.001, n = 225, 89. (I) A violin plot presenting start of first crawling bout for each larva during stimulation. Statistics: Mann–Whitney U test, p < 0.001, n = 214, 70. ***p < 0.001.
-
Figure 1—source data 1
Excel sheet containing statistics data from behavior tracking depicted in Figure 1E-I.
- https://cdn.elifesciences.org/articles/93978/elife-93978-fig1-data1-v1.zip
-
Figure 1—source data 2
Excel sheet containing raw data from behavior tracking depicted in Figure 1E-I.
- https://cdn.elifesciences.org/articles/93978/elife-93978-fig1-data2-v1.zip
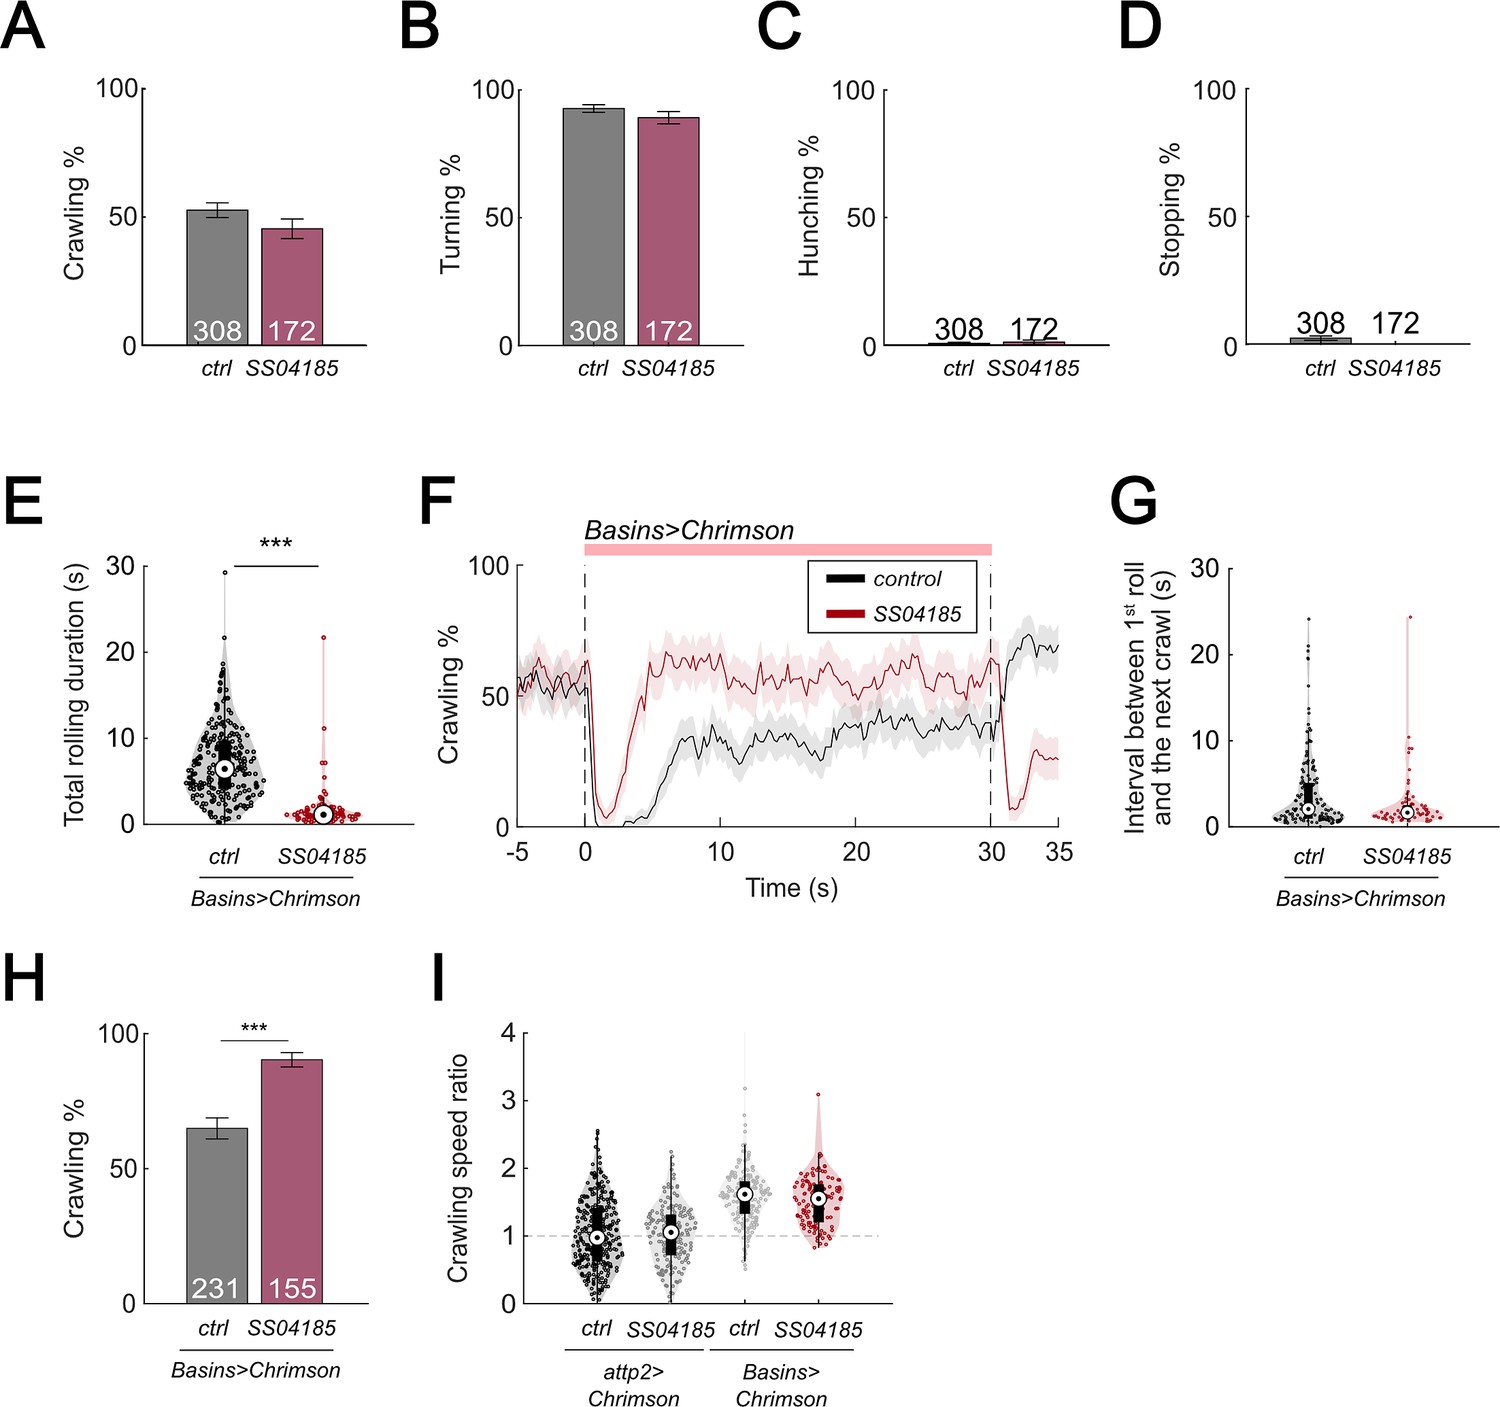
Figure 1—figure supplement 1
Activation of SS04185 inhibits rolling.
(A) Crawling probabilities of larvae with the activation of SS04185-expressing neurons. Error bars, 95% confidence interval. Genotypes: 20xUAS-IVS-CsChrimson::mVenus/+;; (black); 20xUAS-IVS-CsChrimson::mVenus/+; R54B01-Gal4.AD/+; R46E07-Gal4.DBD/+ (red). Genotypes in (B–D) are the same as shown here. n = 308, 172. Statistics: Chi-square test, χ2 = 2.32, p > 0.05. (B) Turning probabilities of larvae with activation of SS04185-expressing neurons. Error bars, 95% confidence interval. n = 308, 172. Statistics: Chi-square test, χ2 = 1.77, p > 0.05. (C) Hunching probabilities of larvae with activation of SS04185-expressing neurons. Error bars, 95% confidence interval. n = 308, 172. Statistics: Chi-square test, χ2 = 0.35, p > 0.05. (D) Stopping probabilities of larvae with activation of SS04185-expressing neurons. Error bars, 95% confidence interval. n = 308, 172. Statistics: Chi-square test, χ2 = 3.97, p = 0.046. (E) A violin plot of total time spent rolling for each individual larva during stimulation. Statistics: Mann–Whitney U test, p < 0.001, n = 225, 89. (F) Time series of crawling probabilities of SS04185 and Basin co-activation larvae (green) and Basin activation only larvae (black). Shaded areas show 95% confidential intervals of the crawling probabilities. Dashed lines display the window of optogenetic stimulation. Genotypes: 20xUAS-IVS-CsChrimson::mVenus/+; +; R72F11-Gal4/+ (control); 20xUAS-IVS-CsChrimson::mVenus/+; R54B01-Gal4.AD/+; R46E07-Gal4.DBD/R72F11-Gal4 (SS04185). Genotypes in (G–H) are the same as mentioned here. n = 228, 124. (G) A violin plot of interval between first roll and next crawl. Statistics: Mann–Whitney U test, p > 0.05, n = 151, 74. (H) Crawling probabilities of SS04185 and Basin co-activation larvae (red) and Basin activation only larvae (black). Error bars, 95% confidence interval. n = 228, 124. Statistics: Chi-square test, χ2 = 28.36, p < 0.001. (I) A violin plot of crawling speed ratio of larvae with null, SS04185 neuron, Basin, SS04185 neuron and Basin activation (from left to right). Crawling speed ratio = crawling speed 5–10 s after stimulation onset/crawling speed 0–5 s before stimulation onset. Statistics: Kruskal–Wallis test: H = 144, p < 0.001; Bonferroni-corrected Mann–Whitney U test: p > 0.05 for two groups on the left and two groups on the right. n = 308, 172, 227, 124. Genotypes from left to right: (1) 20xUAS-IVS-CsChrimson::mVenus/+;;; (2) 20xUAS-IVS-CsChrimson::mVenus/+; R54B01-Gal4.AD/+; R46E07-Gal4.DBD/+; (3) 20xUAS-IVS-CsChrimson::mVenus/+;; R72F11-Gal4/+; (4) 20xUAS-IVS-CsChrimson::mVenus/+; R54B01-Gal4.AD/+; R46E07-Gal4.DBD/R72F11-Gal4. ***p < 0.001.
-
Figure 1—figure supplement 1—source data 1
Excel sheet containing raw data from behavior tracking depicted in Figure 1—figure supplement 1E, F and I.
- https://cdn.elifesciences.org/articles/93978/elife-93978-fig1-figsupp1-data1-v1.zip
-
Figure 1—figure supplement 1—source data 2
Excel sheet containing statistics data from behavior tracking depicted in Figure 1—figure supplement 1E, F and I.
- https://cdn.elifesciences.org/articles/93978/elife-93978-fig1-figsupp1-data2-v1.zip
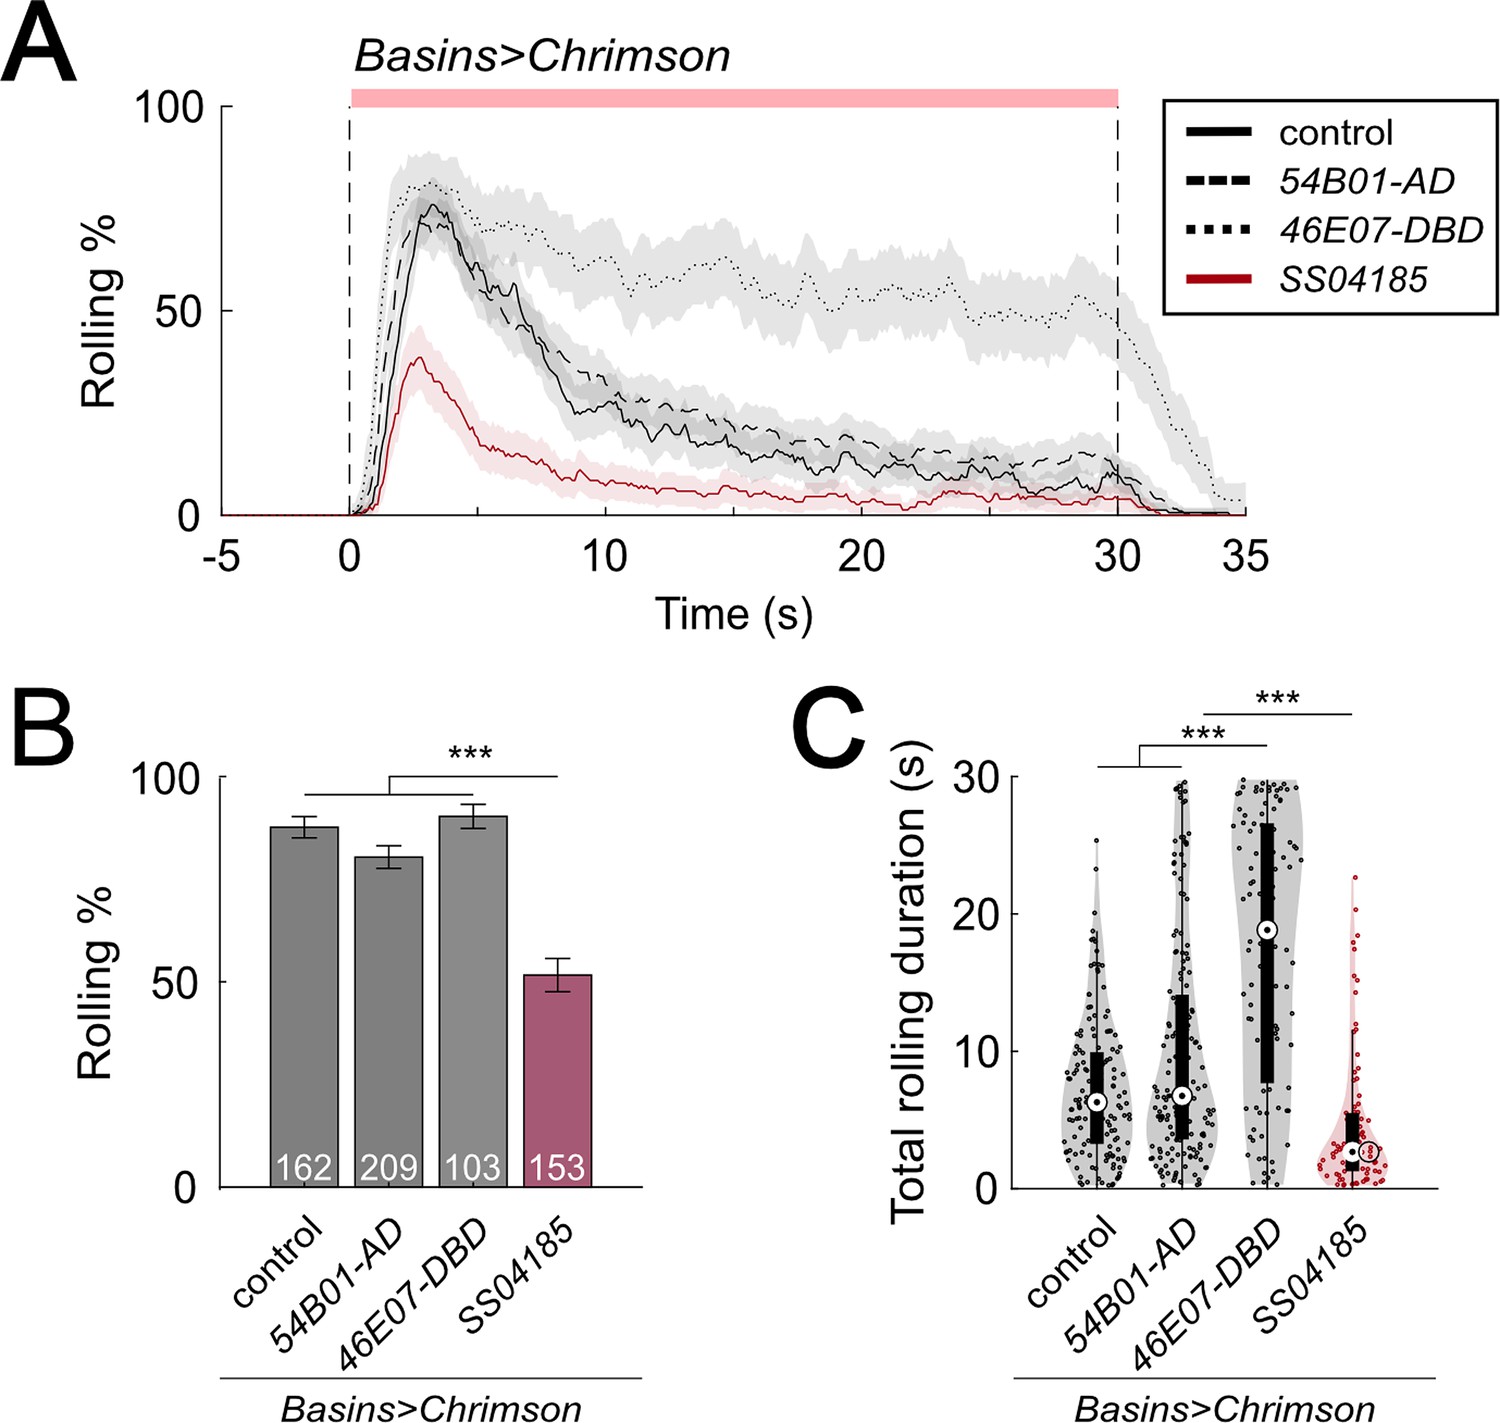
Figure 1—figure supplement 2
Activation of SS04185 inhibits rolling.
(A) Time series of rolling probabilities of larvae during co-activation of SS04185 and Basins (red) and activation of Basins alone (black). Shaded areas represent 95% confidential intervals for rolling probabilities. The red bar and vertical dashed lines denote the optogenetic stimulation window. Genotypes: (1) 20xUAS-IVS-CsChrimson::mVenus/+;; R72F11-Gal4/+ (control), (2) 20xUAS-IVS-CsChrimson::mVenus/+; R54B01-Gal4.AD/+; R72F11-Gal4/+ (54B01-AD), (3) 20xUAS-IVS-CsChrimson::mVenus/+;; R72F11-Gal4/R46E07-Gal4.DBD (46E07-DBD), and (4) 20xUAS-IVS-CsChrimson::mVenus/+; R54B01-Gal4.AD/+; R46E07-Gal4.DBD/ R72F11-Gal4 (SS04185). Genotypes in (B, C) are the same as mentioned here. n = 162, 209, 103, 153. (B) Rolling probabilities of larvae plotted in (A) in the first 5 s of stimulation. Error bars represent the 95% confidence interval. n = 162, 209, 103, 153 from left to right. Statistics: Chi-square test, χ2 = 6.66, p > 0.05 for the left three groups and χ2 = 72.52, p < 0.001 for the comparison between the left three groups and the SS04185 group. (C) A violin plot of total time spent rolling for each individual larva during stimulation. Statistics: Kruskal–Wallis test: H = 105.99, p < 0.001; Bonferroni-corrected Mann–Whitney U test, p > 0.05 for the comparison between control and 54B01-AD; p < 0.001 for all other pairwise comparisons, n = 151, 172, 100, 86. ***p < 0.001.
-
Figure 1—figure supplement 2—source data 1
Excel sheet containing statistic data from behavior tracking depicted in Figure 1—figure supplement 2C.
- https://cdn.elifesciences.org/articles/93978/elife-93978-fig1-figsupp2-data1-v1.zip
-
Figure 1—figure supplement 2—source data 2
Excel sheet containing raw data from behavior tracking depicted in Figure 1—figure supplement 2B and C.
- https://cdn.elifesciences.org/articles/93978/elife-93978-fig1-figsupp2-data2-v1.zip
Figure 2 with 1 supplement
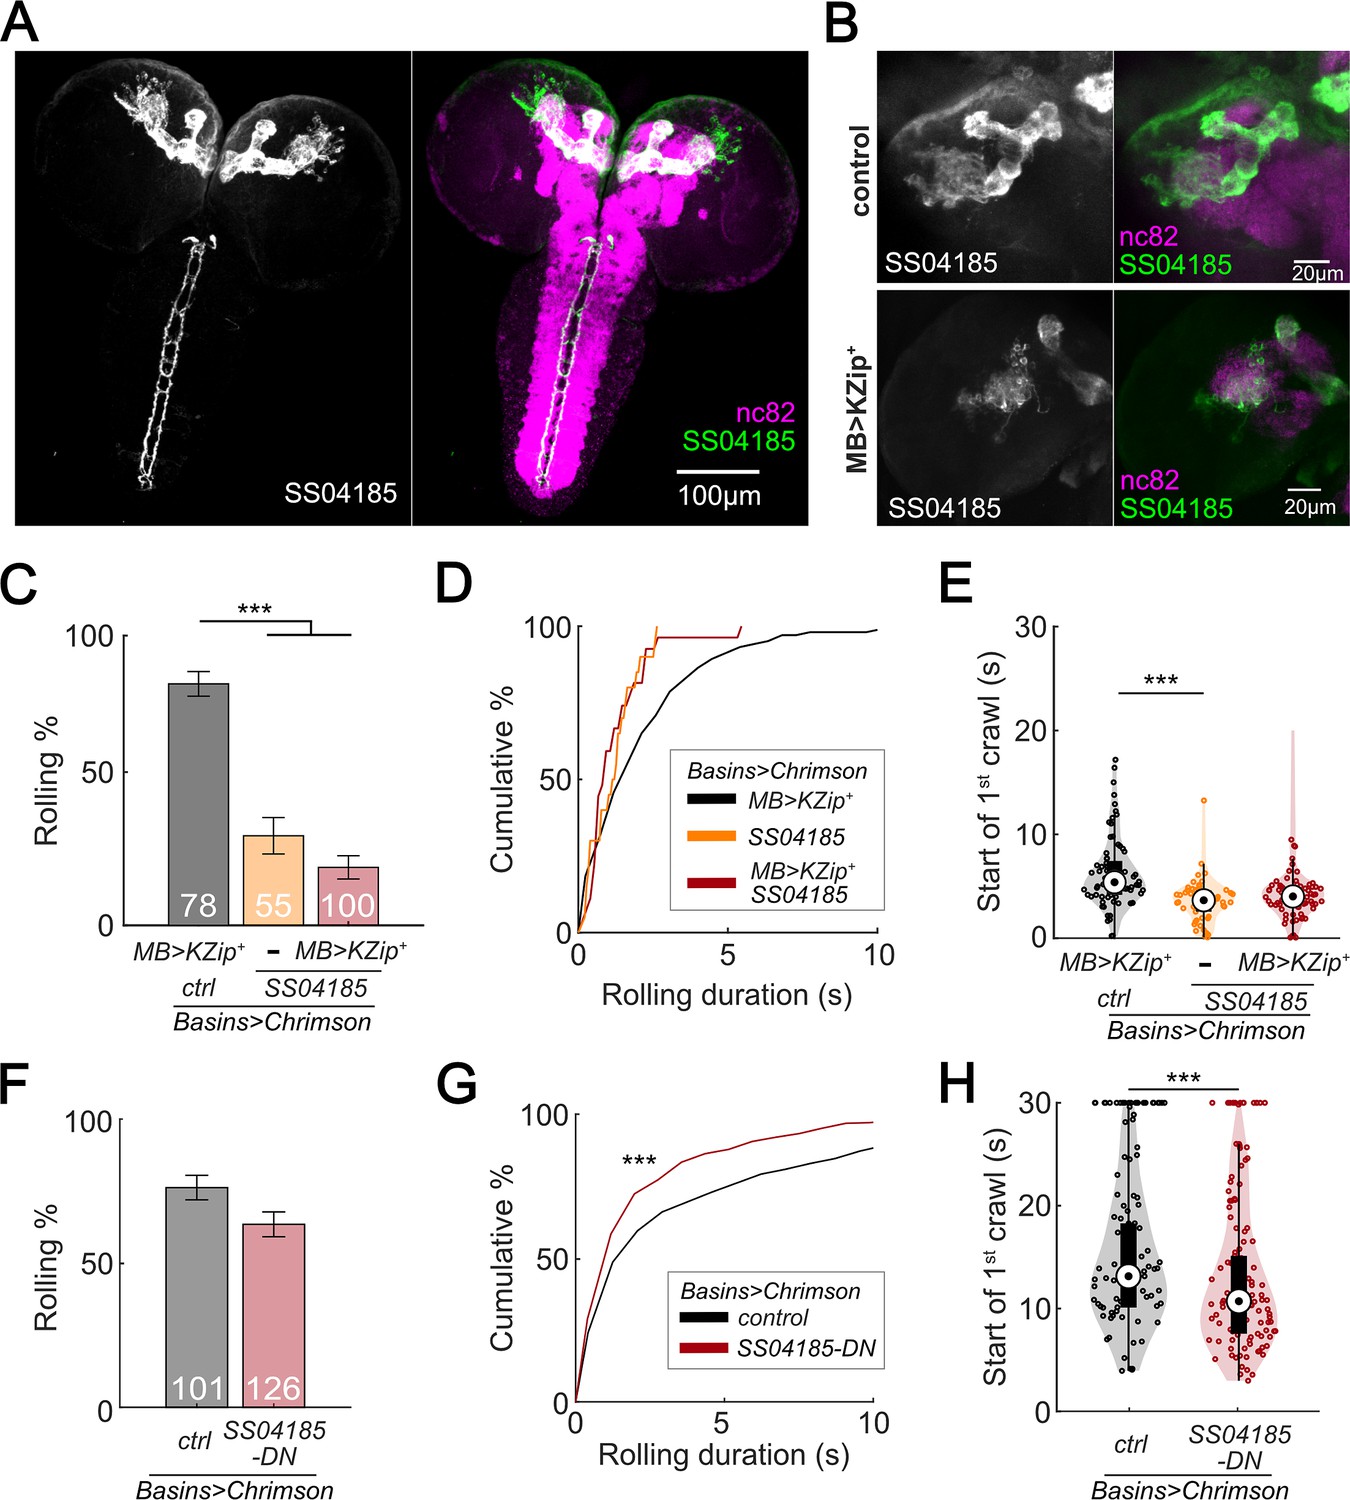
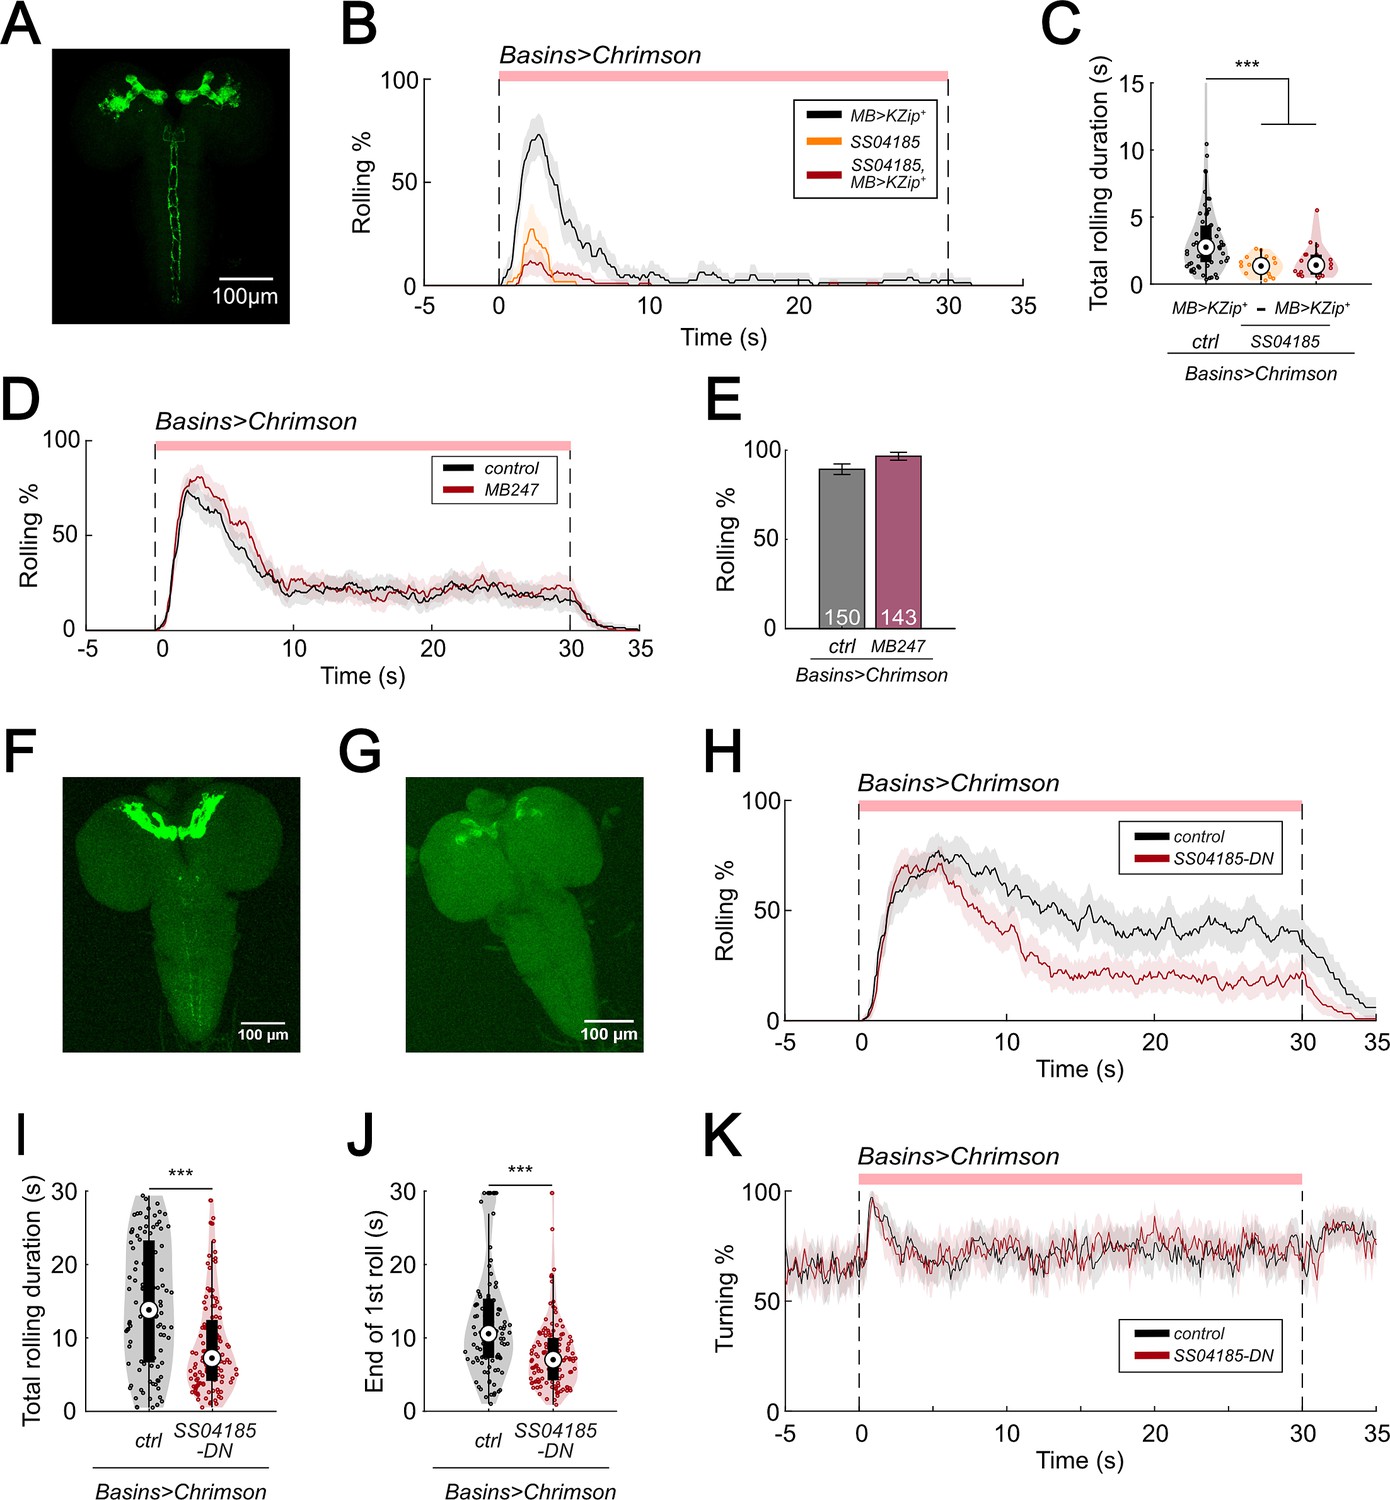
SS04185-DN, but not SS04185-MB, inhibits rolling when co-activated with Basins.
(A) Morphology of SS04185 neurons. GFP, gray (left), green (right); nc82, magenta. Anterior, up; dorsal view; scale bar, 100 µm. Genotype: 10xUAS-IVS-myr::GFP/+; R54B01-Gal4.AD/+; R46E07-Gal4.DBD/+. (B) Kenyon cells are less labeled in SS04185 with MB>Killer Zipper. CsChrimson::mVenus expression in Kenyon cells of SS04185 in Control and SS04185 with Killer Zipper in mushroom body (MB). mVenus, gray (left), green (right); nc82, magenta. Anterior, up; dorsal view; scale bar, 20 µm. Genotype: 20xUAS-IVS-CsChrimson::mVenus/+; R54B01-Gal4.AD/+; R46E07-Gal4.DBD/+ (control); 20xUAS-IVS-CsChrimson::mVenus/+; R13F02-LexA,LexAop-KZip+/R54B01-Gal4.AD; R72F11-Gal4/R46E07-Gal4.DBD (MB>KZip+). (C) Rolling probabilities of larvae with activation of SS04185 reduce the expression of CsChrimson in MB neurons. Error bars, 95% confidence interval. n = 78, 55, 100 from left to right. Statistics: Chi-square test, χ2 = 2.32, p > 0.05 for the two groups with SS04185 expression; χ2 = 37.50, p < 0.001 for the comparison between the two groups on the left; χ2 = 70.45, p < 0.001 for the comparison between the groups with MB>KZip + expression which reduce expression of CsChrimson in MB. Genotypes: 20xUAS-IVS-CsChrimson::mVenus/+; R13F02-LexA,LexAop-KZip+/+; R72F11-Gal4/+ (black); 20xUAS-IVS-CsChrimson::mVenusR54B01-Gal4.AD/+; R46E07-Gal4.DBD/R72F11-Gal4 (orange); 20xUAS-IVS-CsChrimson::mVenus/+; R13F02-LexA,LexAop-KZip+/R54B01-Gal4.AD; R72F11-Gal4/R46E07-Gal4.DBD (red). Genotypes in (D–E) are the same as mentioned here. (D) Cumulative plot of rolling duration. Statistics: Kruskal–Wallis test: H = 8.28, p = 0.016; Bonferroni-corrected Mann–Whitney U test, p > 0.05 for all pairwise post hoc tests, n = 103, 20, 27 from left to right. (E) A violin plot of start of first crawling bout for each larva during stimulation. Statistics: Kruskal–Wallis test: H = 15.02, p < 0.001; Bonferroni-corrected Mann–Whitney U test, p > 0.05 for the two groups with SS04185 expression; p < 0.001 for the comparison between the group without SS04185 expression and the groups with full SS04185 expression, n = 65, 20, 7 from left to right. (F) The probabilities of larval rolling during first 5 s of stimulation. Error bars, 95% confidence interval. n = 101, 126. Statistics: Chi-square test, χ2 = 4.27, p = 0.039. Genotype: 13xLexAop2-IVS-CsChrimson::tdTomato/w+, hs-FLP; R54B01-Gal4.AD/72F11-LexA; 20XUAS-(FRT.stop)-CsChrimson::mVenus/R46E07-Gal4.DBD. Genotypes in (G, H) are the same as mentioned here. (G) Cumulative plot of rolling duration. Statistics: Mann–Whitney U test, p < 0.001, n = 350, 473. (H) A violin plot of start of first crawling bout for each larva during stimulation. Statistics: Mann–Whitney U test, p < 0.001, n = 97, 120. ***p < 0.001.
-
Figure 2—source data 1
Excel sheet containing raw data from behavior tracking depicted in Figure 2D, E, G and H.
- https://cdn.elifesciences.org/articles/93978/elife-93978-fig2-data1-v1.zip
-
Figure 2—source data 2
Excel sheet containing statistic data from behavior tracking depicted in Figure 2C-H.
- https://cdn.elifesciences.org/articles/93978/elife-93978-fig2-data2-v1.zip
Figure 2—figure supplement 1
SS04185-DN inhibits rolling.
(A) Morphology of SS04185 neurons with split Gal4 inhibition in mushroom body (MB). GFP, green. Anterior, up; dorsal view; scale bar, 100 µm. Genotype: 20xUAS-IVS-CsChrimson::mVenus/+; R13F02-LexA,LexAop-KZip+/R54B01-Gal4.AD; R72F11-Gal4/R46E07-Gal4.DBD. (B) Time series of rolling probabilities of larvae with split Gal4 inhibition in MB (black), SS04185 activation (orange), and both SS04185 activation and split Gal4 inhibition in MB (red). Shaded areas show 95% confidential intervals of rolling probabilities. The red bar and dashed lines display the window of optogenetic stimulation. Genotypes: 20xUAS-IVS-CsChrimson::mVenus/+; R13F02-LexA,LexAop-KZip+/+; R72F11-Gal4/+ (black); 20xUAS-IVS-CsChrimson::mVenus/+; R54B01-Gal4.AD/+; R46E07-Gal4.DBD/R72F11-Gal4 (orange); 20xUAS-IVS-CsChrimson::mVenus/+; R13F02-LexA,LexAop-KZip+/R54B01-Gal4.AD; R72F11-Gal4/R46E07-Gal4.DBD (red). Genotypes in (C) are the same as mentioned here. (C) A violin plot of total time spent rolling for each individual larva during stimulation. Statistics: Kruskal–Wallis test: H = 21.05, p < 0.001; Bonferroni-corrected Mann–Whitney U test, p > 0.05 for the two groups with SS04185 expression; p < 0.001 for the comparison between the group without SS04185 expression and the two groups with SS04185 expression, n = 66, 17, 21 from left to right. (D) Time series of rolling probabilities of larvae with Basin activation (black), or Basin and MB co-activation (red). The red bar and dashed lines display the window of optogenetic stimulation eliciting larval escape responses. Shaded areas show 95% confidential intervals of rolling probabilities. n = 150, 143. Genotype: 20xUAS-IVS-CsChrimson::mVenus/+; +; R72F11-Gal4/+ (control); 20xUAS-IVS-CsChrimson::mVenus/+;+; MB247-Gal4/R72F11-Gal4 (MB247). Genotypes in (E) are the same as mentioned here. (E) Binned larval rolling probabilities during the first 5 s of stimulation in (D). Error bars, 95% confidence interval. n = 150, 143. Statistics: Chi-square test, χ2 = 3.80, p > 0.05. (F) and (G) show immunostaining of SS04185-expressing neurons. SS04185, green. Anterior, up; dorsal view; scale bar, 100 µm. Genotype: w+, hs(KDRT.stop)FLP/13xLexAop2-IVS-CsChrimson::tdTomato; R54B01-Gal4.AD/72F11-LexA; 20xUAS-FRT(stop)-CsChrimson::mVenus/R46E07-Gal4.DB. Genotypes in (H–K) are the same as mentioned here. (F) has both SS04185-DN and SS04185-MB expression only, and (G) has SS04185-MB expression. (H) Time series of rolling probabilities of larvae with SS04185-MB activation (black), or SS04185-MB and SS04185-DN co-activation (red). The red bar and dashed lines display the window of optogenetic stimulation eliciting larval escape responses. Shaded areas show 95% confidential intervals of rolling probabilities. (I) A violin plot of total time spent rolling for each individual larva during stimulation. Statistics: Mann–Whitney U test, p < 0.001, n = 99, 124. (J) A violin plot of end of first rolling bout for each larva during stimulation. Statistics: Mann–Whitney U test, p < 0.001, n = 99, 124. (K) Time series of turning probabilities of larvae with SS04185-MB activation (black), or SS04185-MB and SS04185-DN co-activation (red). The red bar and dashed lines display the window of optogenetic stimulation eliciting larval escape responses. Shaded areas show 95% confidential intervals of turning probabilities. ***p < 0.001.
-
Figure 2—figure supplement 1—source data 1
Excel sheet containing raw data from behavior tracking depicted in Figure 2—figure supplement 1C, I and J.
- https://cdn.elifesciences.org/articles/93978/elife-93978-fig2-figsupp1-data1-v1.zip
-
Figure 2—figure supplement 1—source data 2
Excel sheet containing statistics data from behavior tracking depicted in Figure 2—figure supplement 1C, E, I and J.
- https://cdn.elifesciences.org/articles/93978/elife-93978-fig2-figsupp1-data2-v1.zip
Figure 3
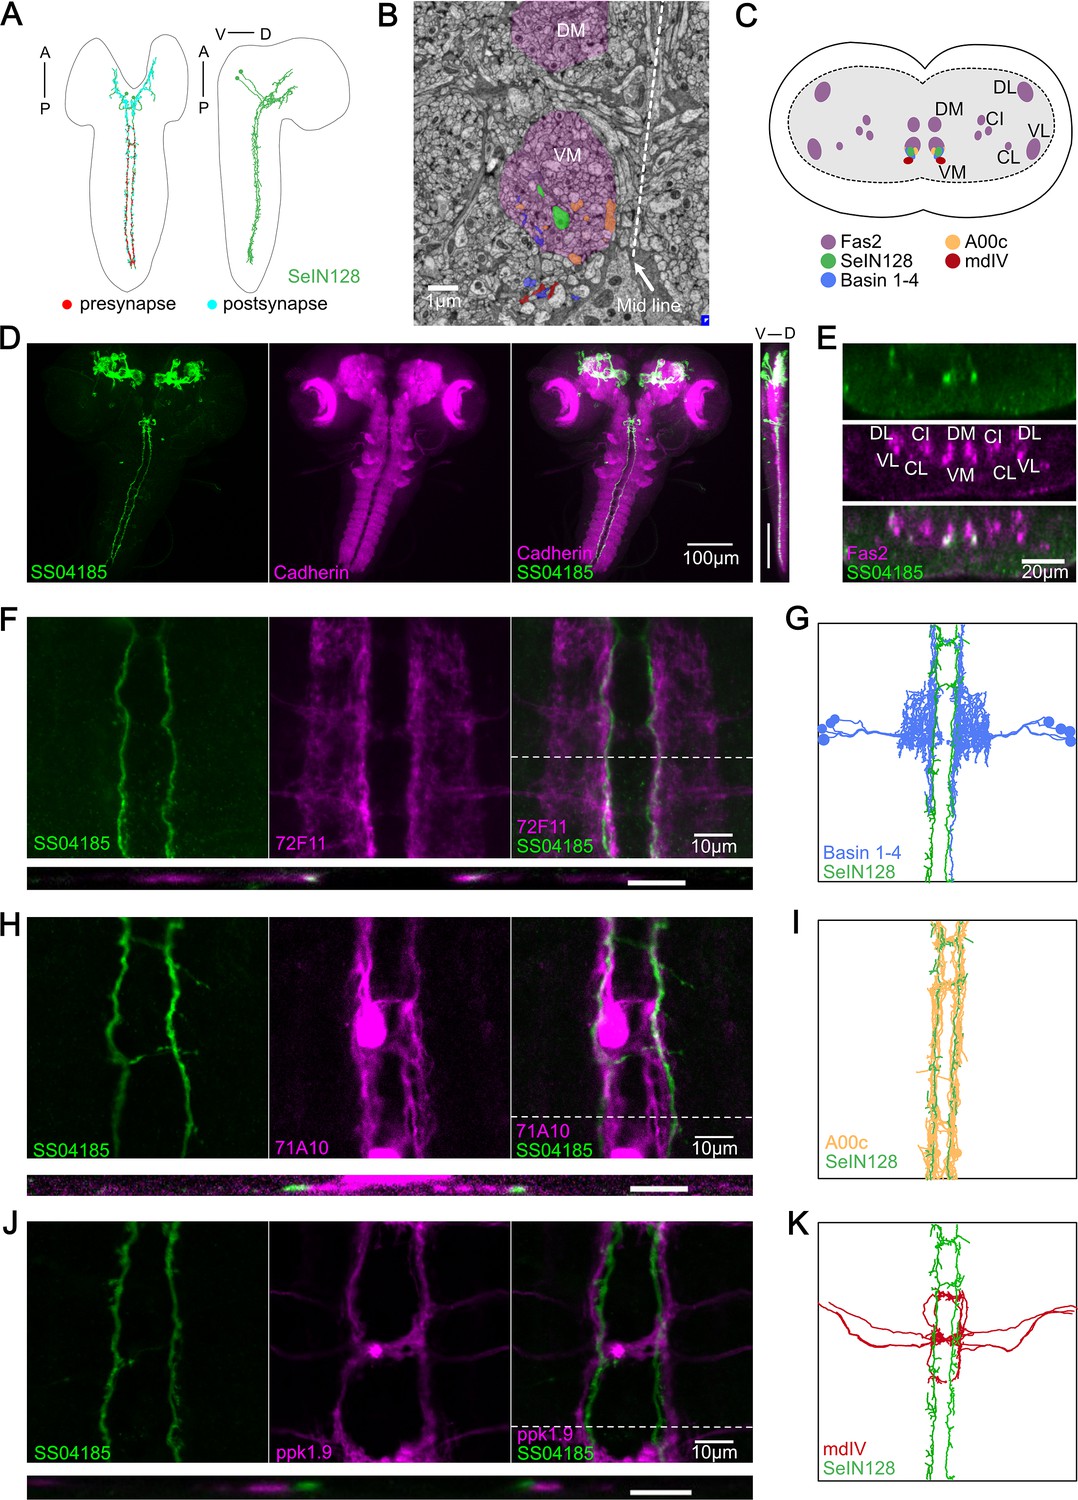
SS04185-DN is identical to SeIN128.
(A) Transmission Electron microscopy (TEM) neuron reconstruction of SeIN128 neurons. Left panel: anterior, up; dorsal view. Right panel: anterior, up; dorsal, right; lateral view. Red dots, presynaptic sites. Cyan dots, postsynaptic sites. (B) A transverse section of larval central nervous system (CNS) from EM reconstruction data. SeIN128 (green), Basins (blue), and A00c (orange) are located in ventromedial tract (VM). mdIV, red; magenta, neural tracts. DM, dorsomedial tract; VM, ventromedial tract. Dorsal, up; anterior view; scale bar, 1 µm. (C) Cartoon generated based on transverse section of SeIN128, Basin-1 to Basin-4, A00c, and mdIV from EM neuron reconstruction data and (D). Nerve tracts are shown in magenta. Dorsal, up; posterior view. DM, dorsomedial tract; VM, ventromedial tract; CI, central-intermediate tract; CL, central-lateral tract; DL, dorsolateral tract; VL, ventrolateral tract. SeIN128, green; Basin-1 to Basin-4, blue; A00c, orange; mdIV, red. (D) SS04185-expressing neurons co-stained with N-cadherin. A cell body of SS04185-descending neuron located in ventral part of the subesophageal zone (SEZ). SS04185, green; N-cadherin, magenta. Anterior, up; left, dorsal view; right, longitudinal section; scale bar, 100 µm. Genotype: 10xUAS-IVS-myr::GFP/+; R54B01-Gal4.AD/+; R46E07-Gal4.DBD/+. SS04185, green; Cadherin, magenta. Anterior, left, dorsal, up; lateral view; scale bar, 100 µm. (E) Transverse section of SS04185-DN co-stained with Fas2. SS04185-DN located at ventromedial tract (VM). SS04185, green; Fas2, magenta. Dorsal, up; posterior view; scale bar, 20 µm. DM, dorsomedial tract; VM, ventromedial tract; CI, central-intermediate tract; CL, central-lateral tract; DL, dorsolateral tract; VL, ventrolateral tract. Genotype: 10xUAS-IVS-myr::GFP/+; R54B01-Gal4.AD/+; R46E07-Gal4.DBD/+. (F, H, J) SS04185-DN co-localized with Basins or A00C neuron tract but not MdIV. SS04185, green; Basins (F), A00c (H), or mdIV (J), magenta. Genotype: w; R54B01-Gal4.AD/R72F11-LexA(F) 71A10-LexA(H) or ppk1.9-LexA(J); R46E07-Gal4.DBD/13xLexAop2-IVS-CsChrimson::tdTomato,20xUAS-IVS-GCaMP6s. Top panel: anterior, up; dorsal view; scale bar, 10 µm. Bottom panel: dorsal, up; posterior view; scale bar, 5 µm. (G, I, K) SeIN128, Basin-2, A00c, or mdIV morphologies from the TEM neural reconstruction. Anterior, up; dorsal view. SS04185, green; Basin-2, blue; A00C, orange; mdIV, red.
Figure 4 with 2 supplements
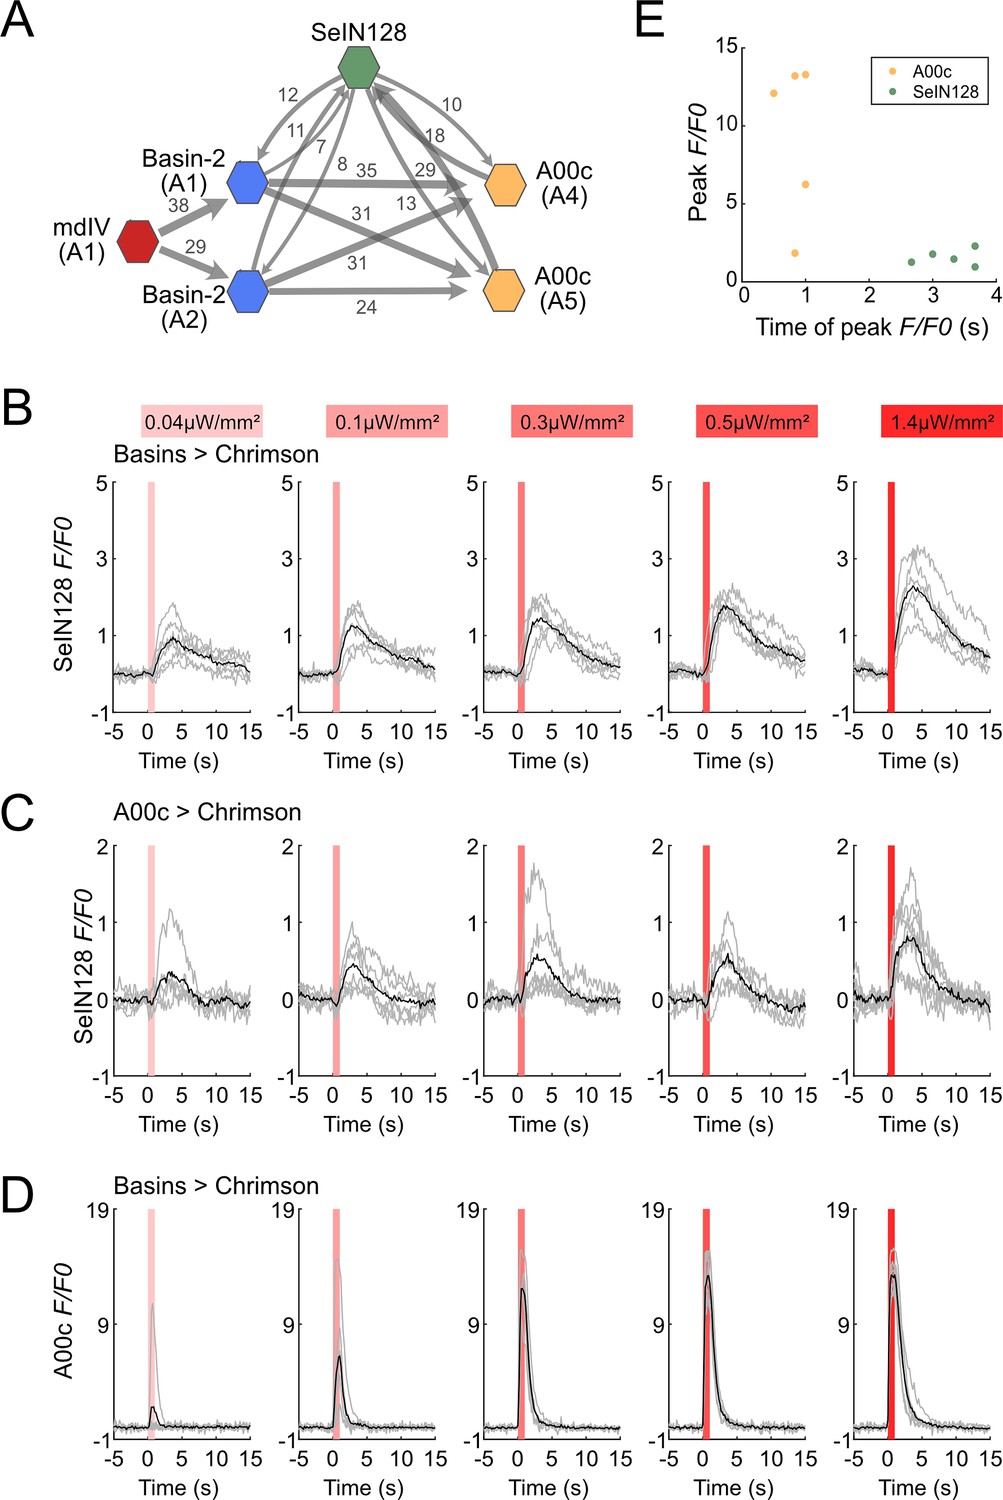
SeIN128 receives input from Basin and A00c neurons.
(A) Summary of the connectivity between SeIN128 and the escape circuit. SeIN128 receives inputs from Basin-2 and A00c and provide feedback to Basin-2 and A00c. Synapse number shown next to connection arrows, where line width is proportional to synapse number. All connections in the ventral nerve cord are shown except unilateral synapses, <5 synapses, between neurons. Each polygon represents a pair of the indicated neuron and segment (segment number is shown under the neuron name). SeIN128, green; Basin-2, blue; A00c, orange; mdIV, red. SeIN128 is functionally downstream of Basins (B) or A00c (C). Calcium transients, ΔF/F0 traces of GCaMP6s in SeIN128 axons (black line, mean; gray line, single larva) during 610 nm optogenetic activation of Basins at various intensities. Vertical gray line represents optogenetic activation. Genotype: w; R72F11-LexA (B) or R71A10-LexA (C) /R54B01-Gal4.AD; 13xLexAop2-IVS—CsChrimson::tdTomato, 20xUAS-IVS-GCaMP6s/R46E07-Gal4.DBD. (D) A00c responses are faster and stronger than SeIN128 responses during activation of Basins. Calcium transients (black line, mean; gray line, single larva) represented by ΔF/F0 in A00c by of 610 nm optogenetic activation of Basins at various intensities. Genotype: w; R72F11-LexA/+; 13xLexAop2-IVS-CsChrimson::tdTomato, 20xUAS-IVS-GCaMP6s/R71A10-Gal4. For (B–D), irradiances from left to right are 0.04, 0.1, 0.3, 0.5, and 1.4 µW/mm2. For each irradiance (n = 6), individual traces are shown with gray lines whereas the average of individuals is shown in black. The shaded gray area indicates the period of optogenetic activation (0–1 s). (E) The timing of the peak ΔF/F0 correlated with the identity of the neurons but not the peak ΔF/F0 value. SeIN128 neurons are shown as orange dots, whereas A00c is shown as a green dot.
-
Figure 4—source data 1
Excel sheet containing raw data depicted in Figure 4C.
- https://cdn.elifesciences.org/articles/93978/elife-93978-fig4-data1-v1.zip
Figure 4—figure supplement 1
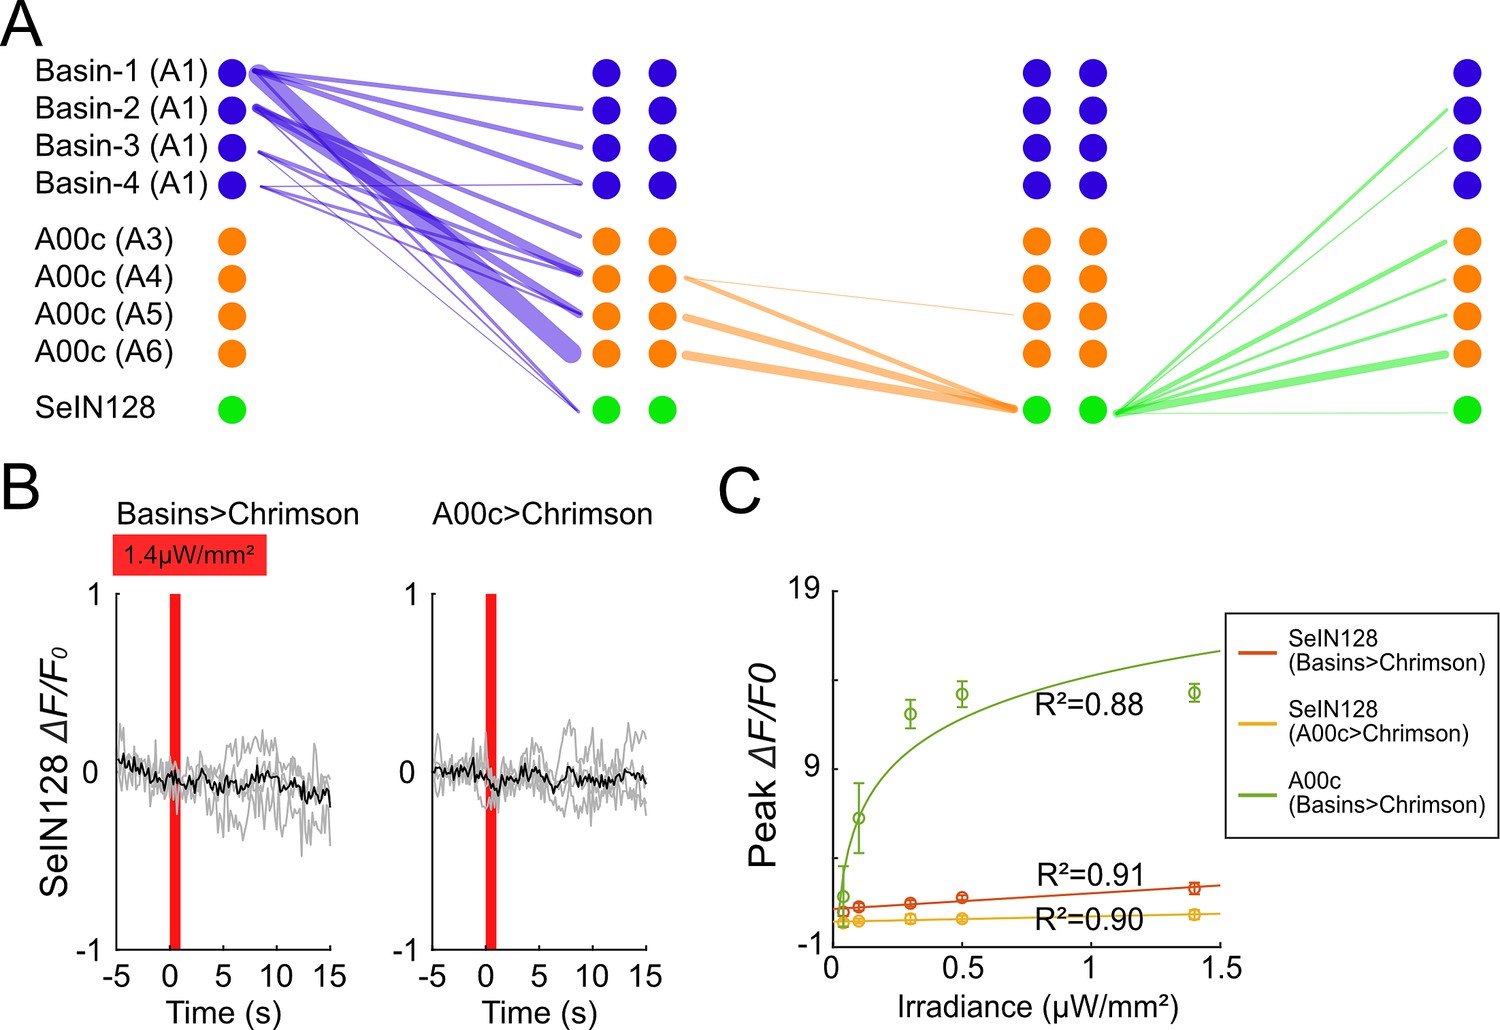
SeIN128 is downstream of Basin and A00c neurons.
(A) Connectivity among Basin, A00c, and SeIN128. Each line represents synaptic connections from the presynaptic neurons (left) to the postsynaptic neurons (right). Line widths are proportional to the counts of the synapses. (B) SeIN128 does not respond to light stimulation when all-trans retinal is not fed. Calcium transients, ΔF/F0 traces of GCaMP6s in SeIN128 axons (black line, mean; gray line, single larva) during 610 nm optogenetic activation of Basins at various intensities. Vertical gray line represents optogenetic activation. The shaded gray area indicates the period of optogenetic activation (0–1 s). Irradiance, 1.4 µW/mm2. n = 4. Genotype: w; R72F11-LexA (left panel) or R71A10-LexA (right panel) /R54B01-Gal4.AD; 13xLexAop2-IVS-CsChrimson::tdTomato, 20xUAS-IVS-GCaMP6s/R46E07-Gal4.DBD. (C) Peak ΔF/F0 increased with increasing irradiance in both SeIN128 and A00c neurons. The orange line corresponds with Figure 4B; yellow line corresponds with Figure 4C; and green line corresponds with Figure 4D.
-
Figure 4—figure supplement 1—source data 1
Excel sheet containing raw data depicted in Figure 4A and B.
- https://cdn.elifesciences.org/articles/93978/elife-93978-fig4-figsupp1-data1-v1.zip
Figure 4—figure supplement 2
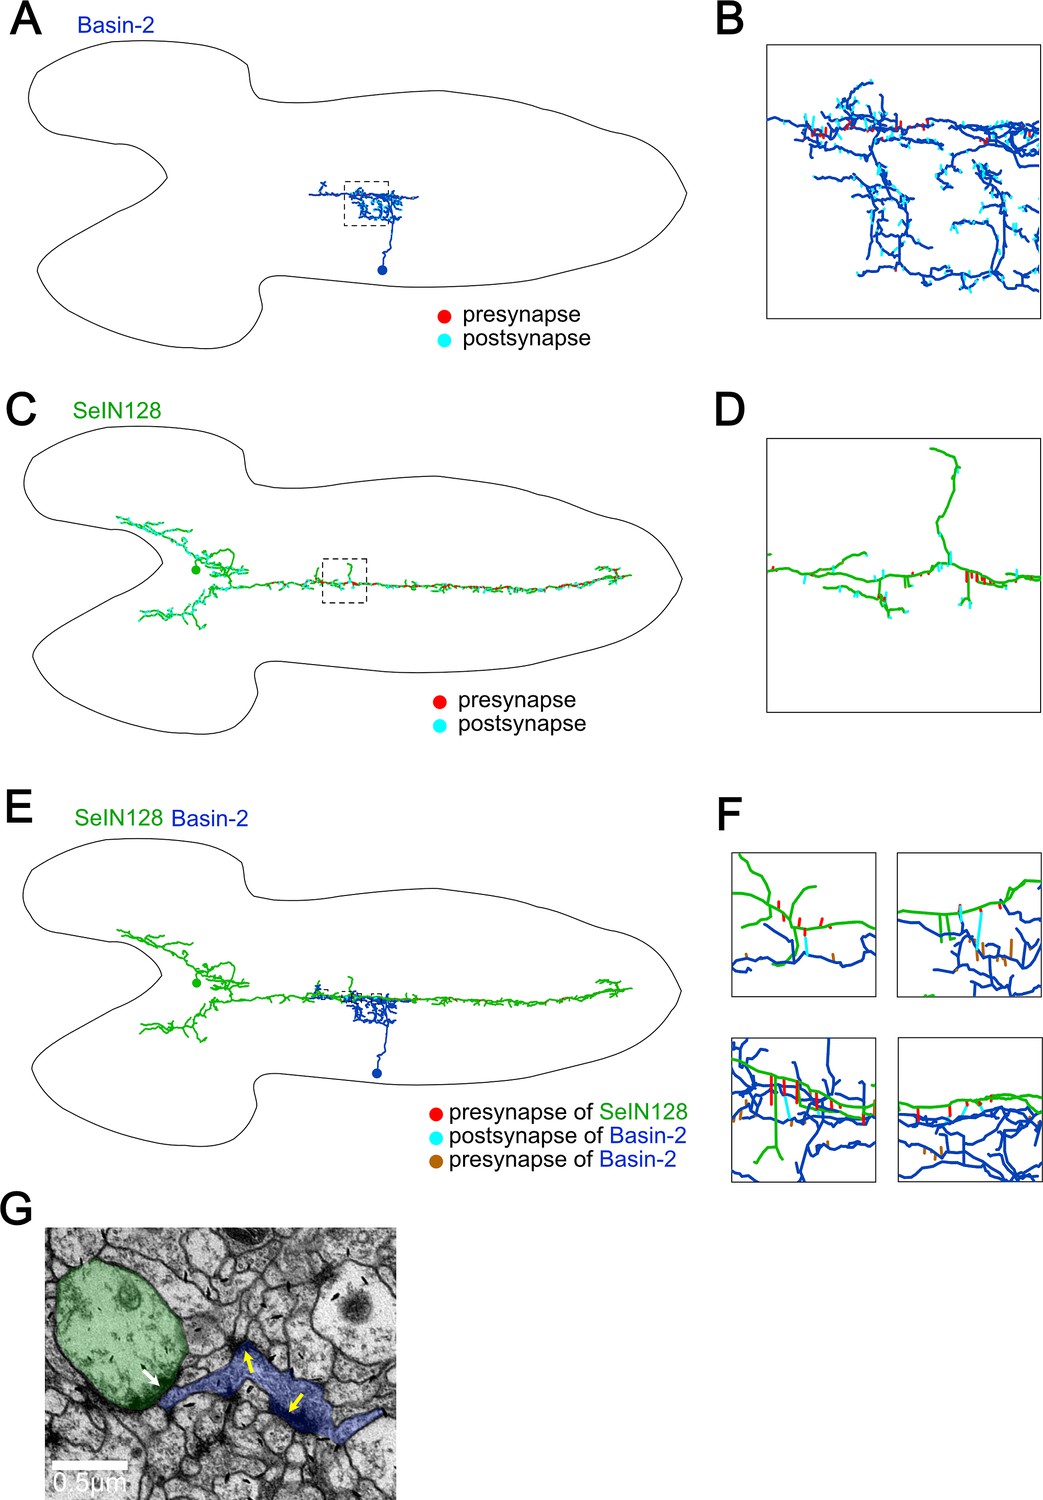
Synapses from SeIN128 to Basin-2 are located near Basin-2 outputs.
(A) Basin-2 morphology and cell body location reported in EM reconstruction dataset (A1, left hemi-segment). Dorsal view. Red lines, presynaptic sites; cyan lines, postsynaptic sites. (B) A zoomed-in view of the square in (A). (C) SeIN128 morphology and cell body location reported in EM reconstruction dataset (right). Dorsal view. Red lines, presynaptic sites; cyan lines, postsynaptic sites. (D) A zoomed-in view of the square in (C). (E) Connections between SeIN128 and Basin-2. Dorsal view. Red lines, presynaptic sites of SeIN128; cyan lines, postsynaptic sites of Basin-2; brown lines, presynaptic sites of Basin-2. (F) Zoomed-in views of squares in (E). (G) EM view of left top panel in (F). Green, SeIN128; blue, Basin-2. White arrows show SeIN128 presynaptic sites adjacent to Basin-2. Yellow arrows are two presynaptic sites of Basin-2.
Figure 5 with 1 supplement
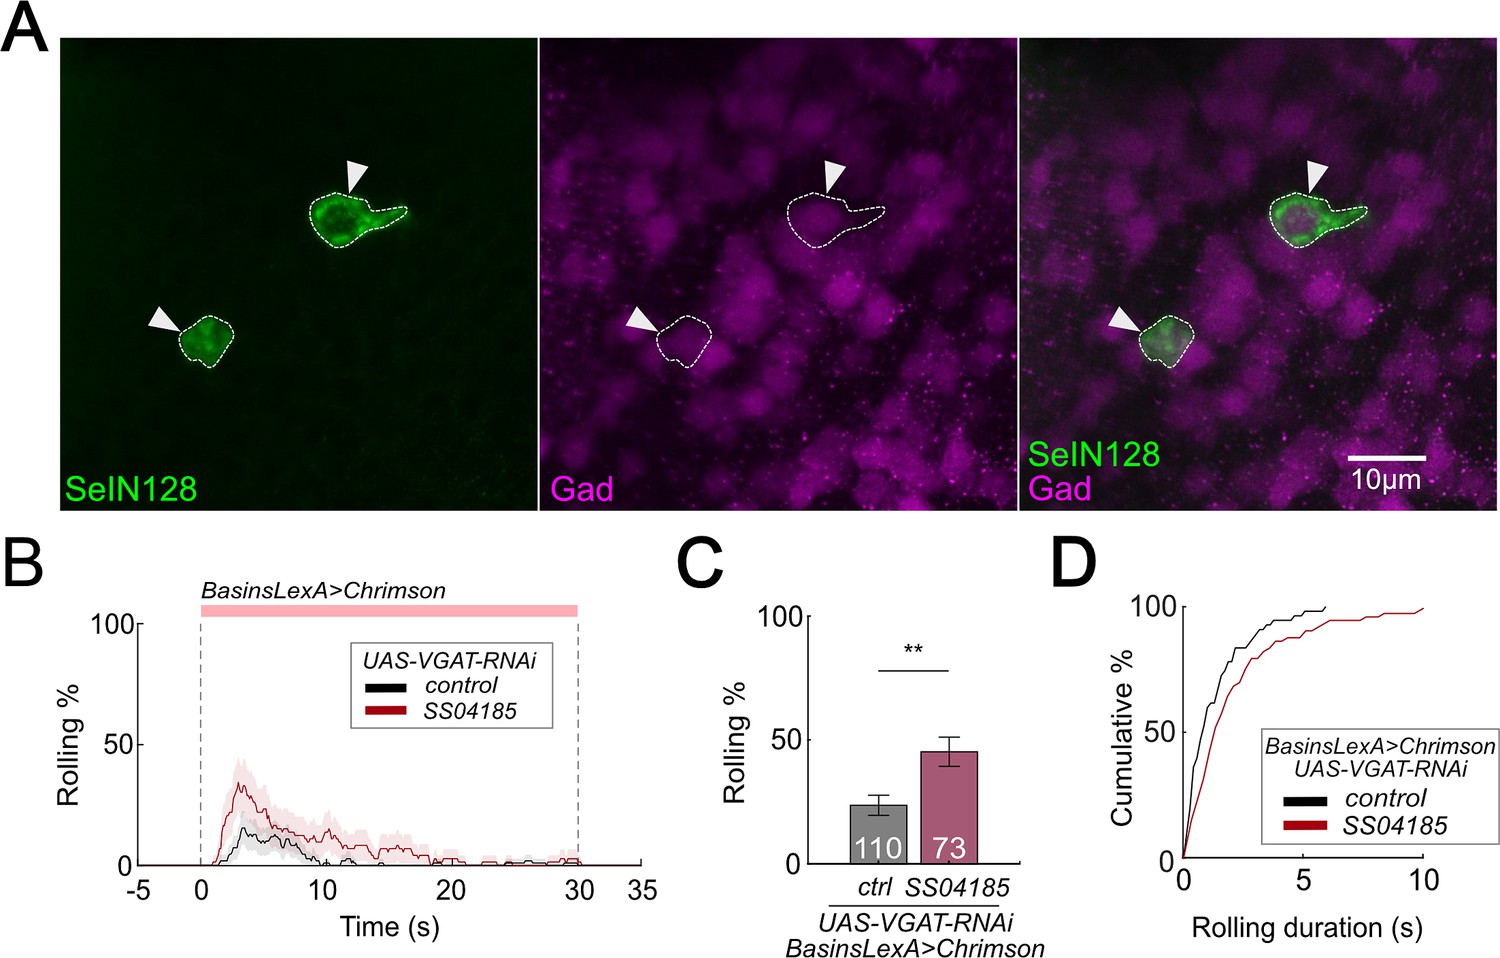
SeIN128 is GABAergic and negatively controls rolling.
(A) Immunostaining of SeIN128 cell body (green) and GABAergic neuron (magenta). Genotype: 10xUAS-IVS-myr::GFP; R54B01-Gal4.AD/13xLexAop-dsRed; R46E07-Gal4.DBD/Trojan-GAD-T2A-LexA. White triangles indicate locations of SeIN128 cell bodies. Anterior, up; dorsal view; scale bar, 10 µm. (B) Time series of rolling probabilities of larvae with Basin activation (black), or vesicular GABA transporter (VGAT) RNA interference (RNAi) in SS04185 and Basin activation (red). The red bar and dashed lines display the window of optogenetic stimulation eliciting larval escape responses. Shaded areas show 95% confidential intervals of rolling probabilities. Genotypes: 13xLexAop2-IVS-CsChrimson::mVenus; R72F11-LexA/+; HMS02355/+ (black); 13xLexAop2-IVS-CsChrimson::mVenus; R72F11-LexA/R54B01-Gal4.AD; HMS02355/R46E07-Gal4.DBD (red). Genotypes in (C, D) are the same as mentioned here. (C) Binned larval rolling probabilities during first 5 s of stimulation in (A). Error bars, 95% confidence interval. n = 110, 73. Statistics: Chi-square test, χ2 = 9.34, p < 0.001. (D) Cumulative plot of rolling duration. Statistics: Mann–Whitney U test, p = 0.015, n = 55, 73. **p < 0.01.
-
Figure 5—source data 1
Excel sheet containing raw data depicted in Figure 5D.
- https://cdn.elifesciences.org/articles/93978/elife-93978-fig5-data1-v1.zip
-
Figure 5—source data 2
Excel sheet containing statistics data depicted in Figure 5C and D.
- https://cdn.elifesciences.org/articles/93978/elife-93978-fig5-data2-v1.zip
Figure 5—figure supplement 1
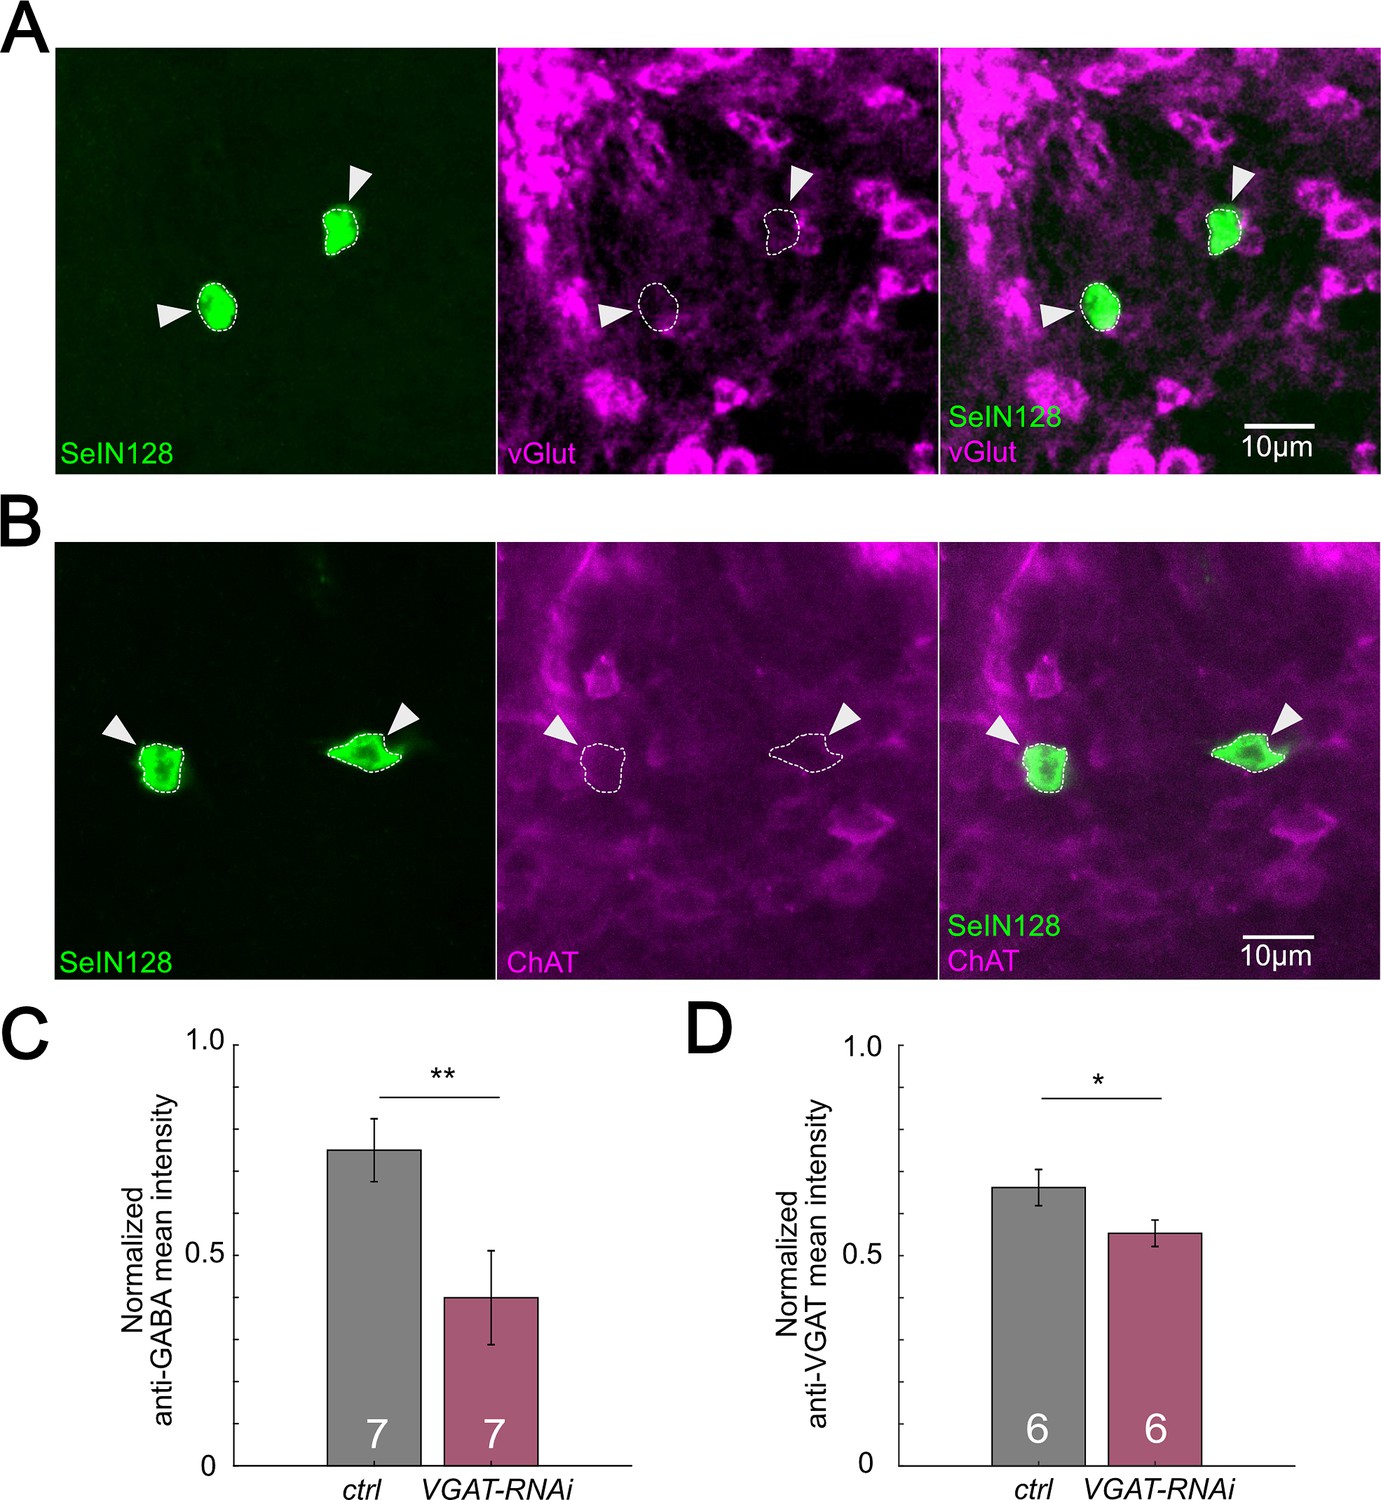
SeIN128 is GABAergic.
(A) Immunostaining of SeIN128 cell body (green) and glutamatergic neuron (magenta). Genotype: 10xUAS-IVS-myr::GFP/+; R54B01-Gal4.AD/+; R46E07-Gal4.DBD/+. (B) Immunostaining of SeIN128 cell body (green) and cholinergic neuron (magenta). Genotype: 10xUAS- IVS-myr::GFP/+; R54B01-Gal4.AD/+; R46E07-Gal4.DBD/+. In (A, B), white triangles indicate locations of SeIN128 cell bodies. Anterior, up; dorsal view; scale bar, 10 µm. (C) Normalized anti-GABA fluorescence intensities in the neuropil by anti-Elav staining in segments A4 to A6. A.U., arbitrary unit. Genotype: w; R57C10-Gal4 /+ (black) and w; R57C10-Gal4/UAS-HMS02355 (red). Statistics: Student’s t test, **p = 0.0106, n = 7. (D) Normalized anti-VGAT fluorescence intensities in the neuropil by anti-Elav staining in segments A4 to A6. A.U., arbitrary unit. Genotype: w; R57C10-Gal4 /+ (black) and w;; R57C10-Gal4/UAS-HMS02355 (red). Statistics: Student’s t test, p = 0.0031, n = 6. *p = 0.0295.
-
Figure 5—figure supplement 1—source data 1
Excel sheet containing raw data depicted in Figure 5—figure supplement 1C and D.
- https://cdn.elifesciences.org/articles/93978/elife-93978-fig5-figsupp1-data1-v1.zip
-
Figure 5—figure supplement 1—source data 2
Excel sheet containing statistics data depicted in Figure 5—figure supplement 1C and D.
- https://cdn.elifesciences.org/articles/93978/elife-93978-fig5-figsupp1-data2-v1.zip
Figure 6 with 1 supplement
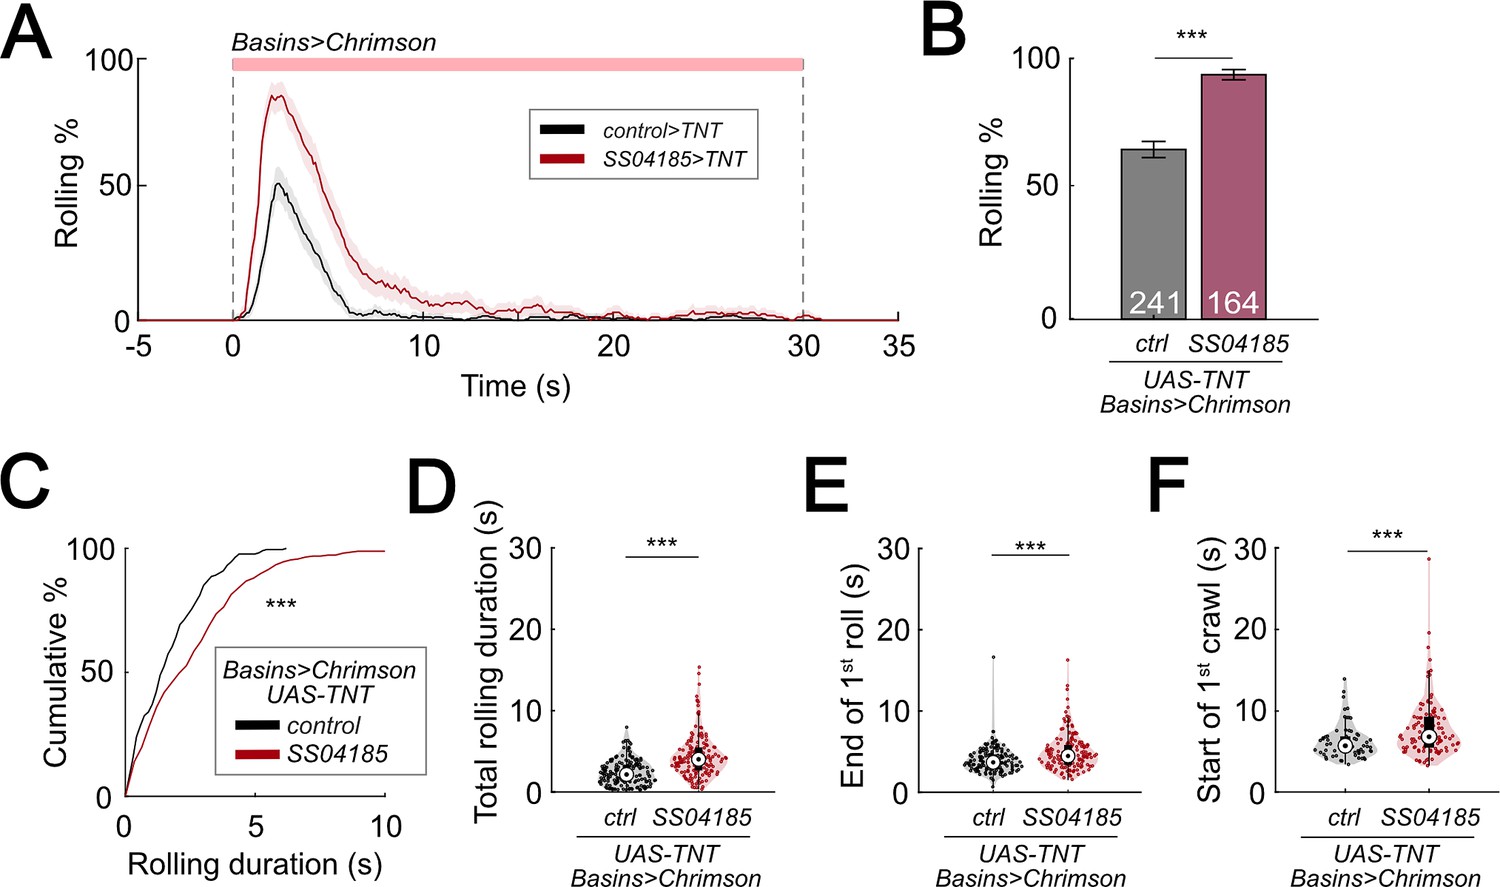
Inhibition of SeIN128 prolongs rolling and delays initiation of crawling.
(A) Time series of rolling probabilities of larvae with Basin activation (black), or SS04185 inhibition and Basin activation (red). Shaded regions show 95% confidential intervals of rolling probabilities. Genotypes: 13xLexAop2-IVS-CsChrimson::mVenus; R72F11-LexA/+; UAS- TeTxLC.tnt/+ (black); 13xLexAop2-IVS-CsChrimson::mVenus; R72F11-LexA/R54B01-Gal4.AD; UAS-TeTxLC.tnt/R46E07-Gal4.DBD (red). Genotypes in (B–F) are the same as mentioned here. (B) Rolling probabilities during first 5 s of stimulation in (A). Error bars, 95% confidence interval. n = 241, 164. Statistics: Chi-square test, χ2 = 44.02, p < 0.001. (C) A violin plot of total time spent rolling for each individual larva during stimulation. Statistics: Mann–Whitney U test, p < 0.001, n = 221, 258. (D) Cumulative plot of rolling duration. Statistics: Mann–Whitney U test, p < 0.001, n = 160, 154. (E) A violin plot of end of first rolling bout for each larva during stimulation. Statistics: Mann–Whitney U test, p < 0.001, n = 160, 154. (F) A violin plot of start of first crawling bout for each larva during stimulation. Statistics: Mann–Whitney U test, p < 0.001, n = 65, 105. ***p < 0.001.
-
Figure 6—source data 1
Excel sheet containing raw data from behavior tracking depicted in Figure 6C-F.
- https://cdn.elifesciences.org/articles/93978/elife-93978-fig6-data1-v1.zip
-
Figure 6—source data 2
Excel sheet containing statistics data from behavior tracking depicted in Figure 6C-F.
- https://cdn.elifesciences.org/articles/93978/elife-93978-fig6-data2-v1.zip
Figure 6—figure supplement 1
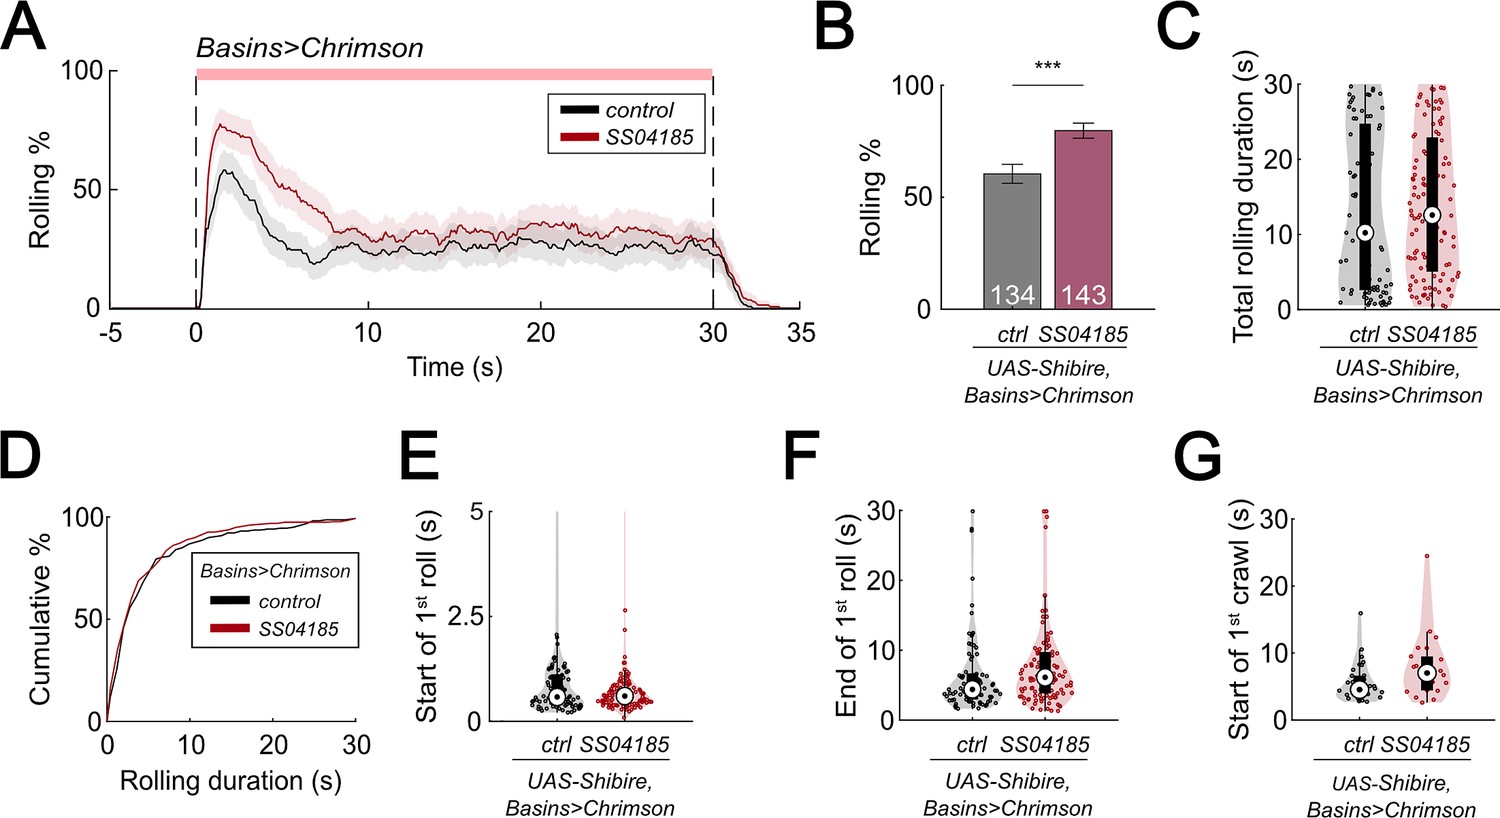
SeIN128 inhibition enhances rolling.
(A) Time series of rolling probabilities of larvae with Basin activation (black), or SS04185 inhibition and Basin activation (red). Larvae were incubated with heat to trigger the effect of shibirets1. The red bar and dashed lines display the window of optogenetic stimulation eliciting larval escape responses. Shaded areas show 95% confidential intervals of rolling probabilities. Genotypes: 13xLexAop2-IVS-CsChrimson::mVenus;R72F11-LexA/+; 20xUAS-TTS-Shibire/+ (black); 13xLexAop2-IVS-CsChrimson::mVenus; R72F11-LexA/R54B01-Gal4.AD; 20xUAS-TTS-Shibire/R46E07-Gal4.DBD (red). Genotypes in (B–G) are the same as mentioned here. (B) Binned larval rolling probabilities during first 5 s of stimulation in (A). Error bars, 95% confidence interval. n = 134, 143. Statistics: Chi-square test, χ2 = 12.33, p < 0.001. (C) A violin plot of total time spent rolling for each individual larva during stimulation. Statistics: Mann–Whitney U test, p > 0.05, n = 85, 115. (D) Cumulative plot of rolling duration. Statistics: Mann–Whitney U test, p > 0.05, n = 219, 352. (E) A violin plot of start of first rolling bout for each larva during stimulation. Statistics: Mann–Whitney U test, p > 0.05, n = 85, 115. (F) A violin plot of end of first rolling bout for each larva during stimulation. Statistics: Mann–Whitney U test, p = 0.013, n = 85, 115. (G) A violin plot of start of first crawling bout for each larva during stimulation. Statistics: Mann–Whitney U test, p = 0.034, n = 32, 22. ***p < 0.001.
Figure 7 with 1 supplement
SeIN128 sends feedback inhibition to Basins.
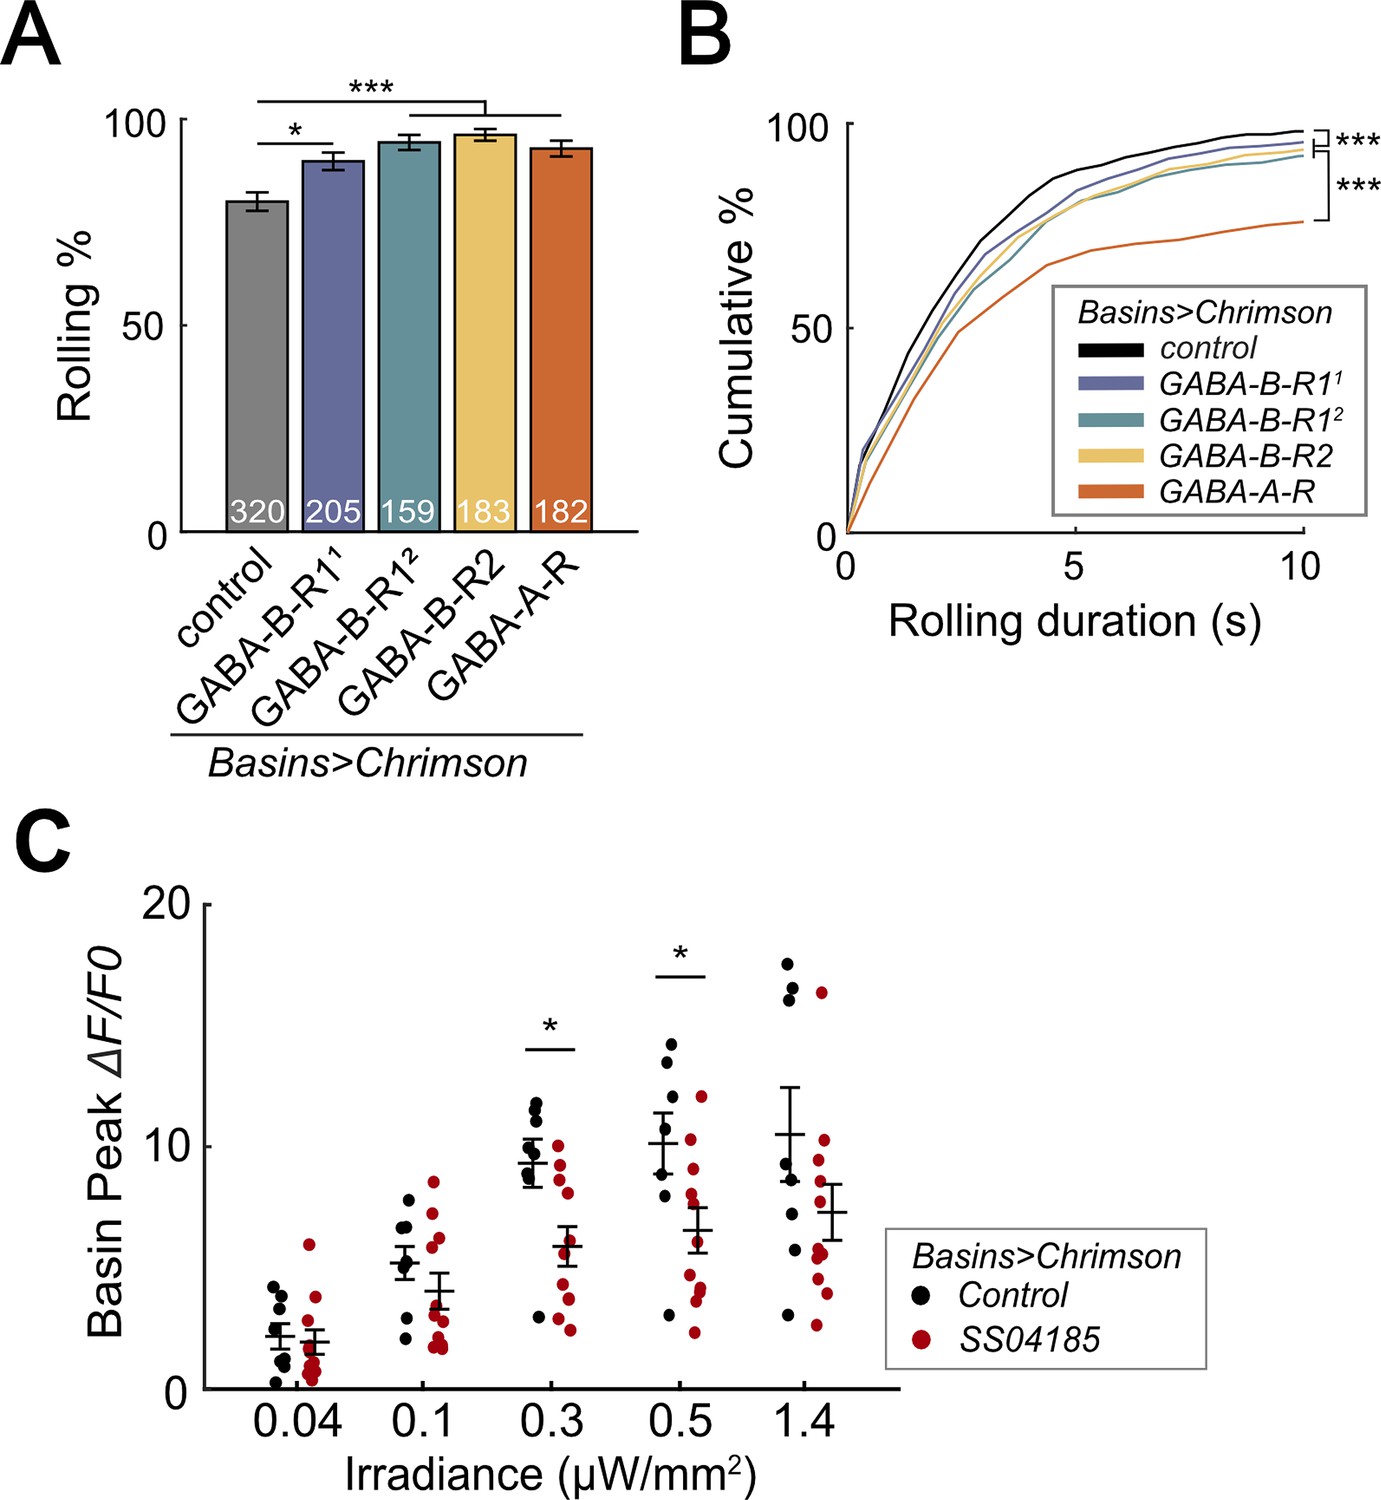
(A) Rolling probabilities for larvae with GABAR-RNAi in their Basin neurons. From left to right, the genotypes are 20xUAS-IVS-CsChrimson::mVenus/+; R72F11-Gal4/+ (black), 20xUAS—IVS-CsChrimson::mVenus/+; R72F11-Gal4/UAS-HMC03388 (blue), 20xUAS-IVS-CsChrimson::mVenus/+; R72F11-Gal4/UAS-JF02989 (green), 20xUAS-IVS-CsChrimson::mVenus/+; R72F11-Gal4/UAS-HMC02975 (yellow), and 20xUAS-IVS-CsChrimson::mVenus/+; R72F11-Gal4/UAS-HMC03643 (orange). Genotypes in (B) are the same as mentioned here. N = 320, 205, 159, 183, 182 from left to right. Statistics: Chi-square test, Bonferroni correction. GABA-B-R11 group: χ2 = 8.76, p = 0.012. GABA-B-R12 group: χ2 = 24.70, p < 0.001. GABA-B-R2 group: χ2 = 25.77, p < 0.001. GABA-A-R group: χ2 = 16.29, p < 0.001. (B) Cumulative plot of rolling duration. Statistics: Kruskal–Wallis test: H = 69.52, p < 0.001; Bonferroni-corrected Mann–Whitney U test, p < 0.001 between control and the GABA-B-R11, GABA-B-R12, and GABA-B-R2 RNA interference (RNAi) groups; p < 0.001 between GABA-A-R and all other RNAi groups. Sample sizes for the colored bars from top (control, black) to bottom (GABA-A-R, red); n = 520, 488, 387, 582, 306. (C) Summary of peak ΔF/F0 in Basin axons with or without SeIN128 activation under various irradiances. Control groups shown in black are without SeIN128 activation while experimental groups shown in red are with SeIN128 activation. Statistics: Mann–Whitney U test, p > 0.05 for irradiances of 0.04, 0.1, and 1.4 µW/mm2; p = 0.016 for irradiance of 0.3 µW/mm2; p = 0.032 for irradiance of 0.5 µW/mm2. Genotype: 20xUAS-Syn21-opGCaMP6s, 10xUAS-Syn21-CsChrimson88::tdTomato/+; CyO/+;R72F11-Gal4/TM6 (black); 20xUAS-Syn21-opGCaMP6s,10xUAS-Syn21-CsChrimson88::tdTomato/+;CyO/R54B01-Gal4.AD;R72F11-Gal4/R46E07-Gal4.DBD (red). *p < 0.05, ***p < 0.001.
-
Figure 7—source data 1
Excel sheet containing raw data from behavior tracking depicted in Figure 7B and C.
- https://cdn.elifesciences.org/articles/93978/elife-93978-fig7-data1-v1.zip
-
Figure 7—source data 2
Excel sheet containing statistics data from behavior tracking depicted in Figure 7B and C.
- https://cdn.elifesciences.org/articles/93978/elife-93978-fig7-data2-v1.zip
Figure 7—figure supplement 1
SeIN128 sends feedback inhibition to Basins.
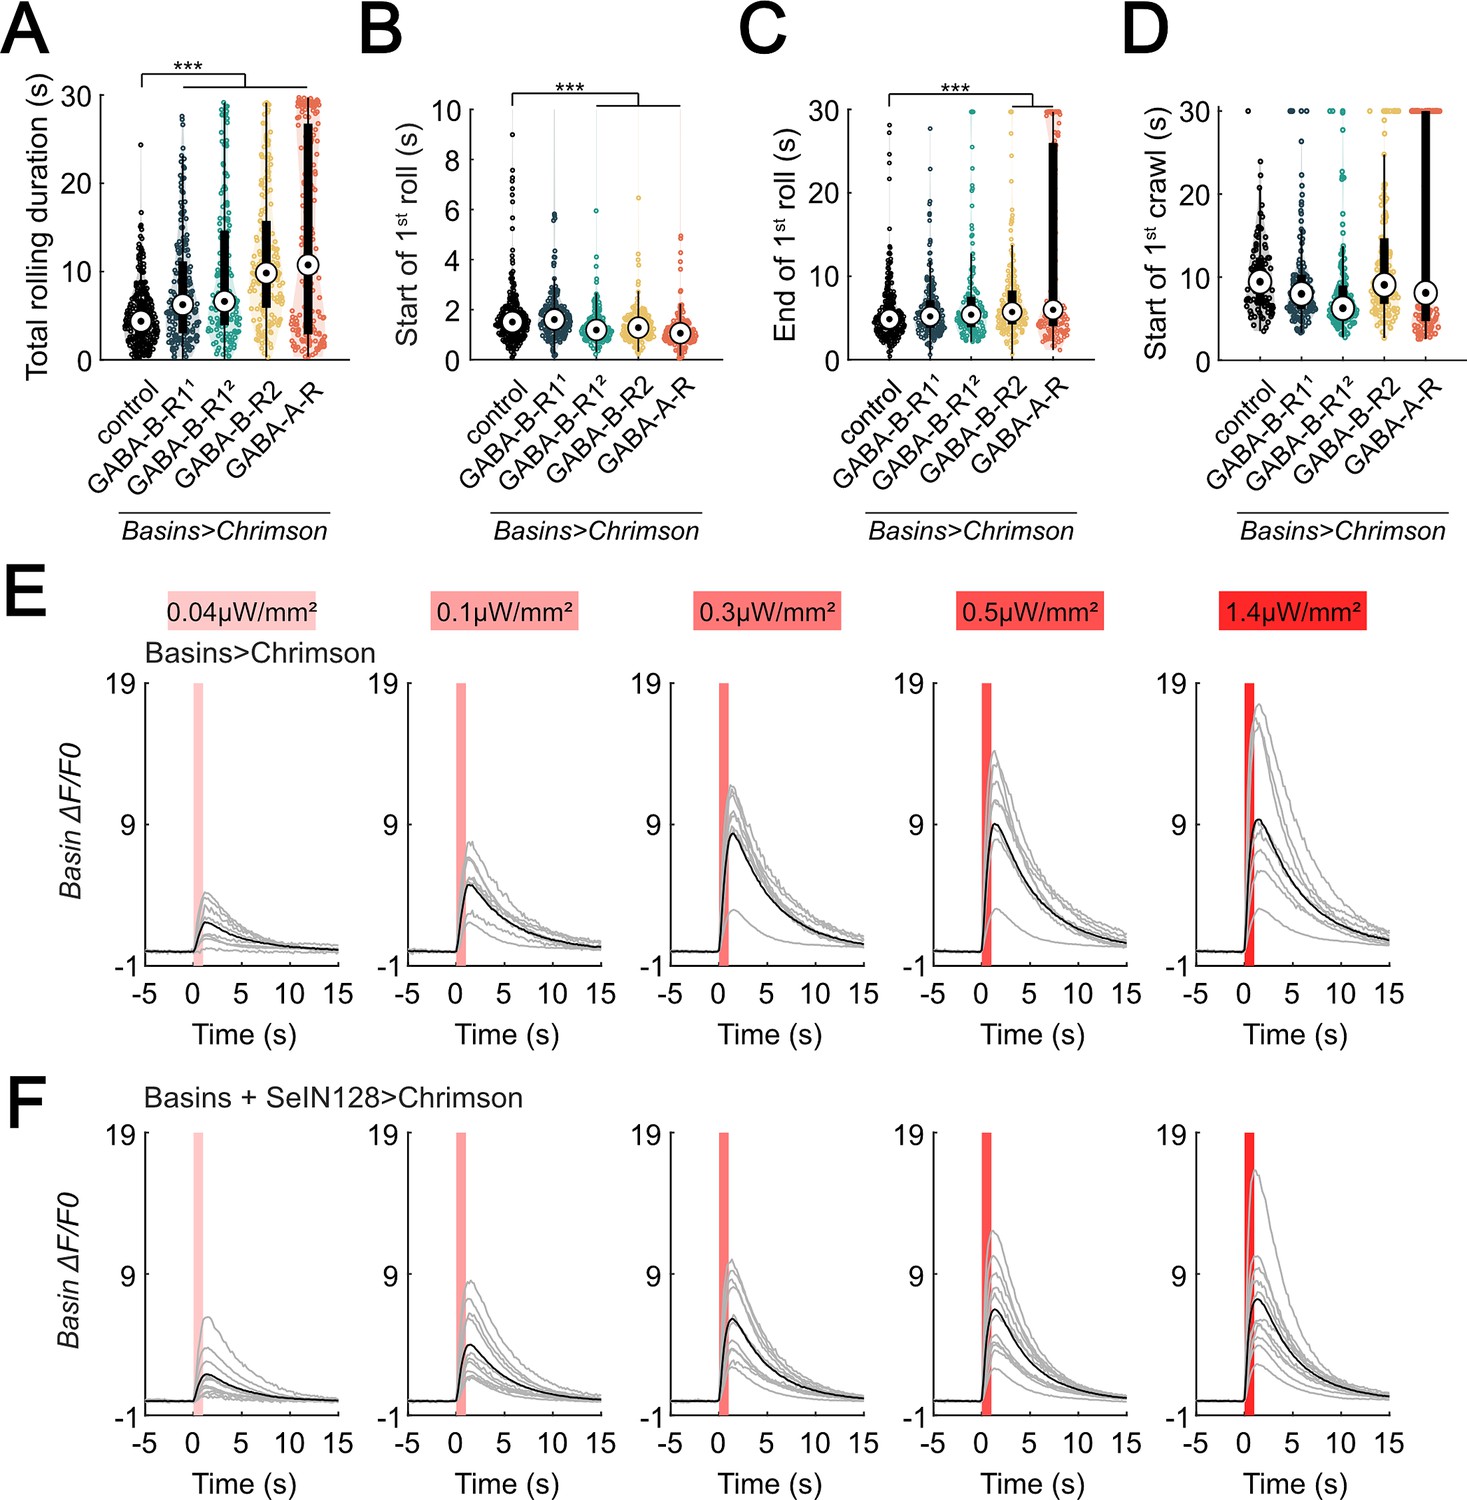
(A) A violin plot of total time spent rolling for each individual larva with GABAR-RNAi in their Basin neurons during stimulation. Statistics: Kruskal–Wallis test: H = 110.86, p < 0.001; Bonferroni-corrected Mann–Whitney U test, p < 0.001 for all RNA interference (RNAi) groups, n = 271, 194, 154, 178, 174 from left to right. The genotypes are 20xUAS-IVS-CsChrimson::mVenus/+; R72F11-Gal4/+ (black), 20xUAS—IVS-CsChrimson::mVenus/+; R72F11-Gal4/UAS-HMC03388 (blue), 20xUAS-IVS-CsChrimson::mVenus/+; R72F11-Gal4/UAS-JF02989 (green), 20xUAS-IVS-CsChrimson::mVenus/+; R72F11-Gal4/UAS-HMC02975 (yellow), and 20xUAS-IVS-CsChrimson::mVenus/+; R72F11-Gal4/UAS-HMC03643 (orange). Genotypes in (B–D) are the same as mentioned here. (B) A violin plot of start of first rolling bout for each larva during stimulation. Statistics: Kruskal–Wallis test: H = 86.50, p < 0.001; Bonferroni-corrected Mann–Whitney U test, p < 0.001 for GABA-B-R12, GABA-B-R2, and GABA-A-R groups, n = 271, 194, 154, 178, 174 from left to right. (C) A violin plot of end of first rolling bout for each larva during stimulation. Statistics: Kruskal–Wallis test: H = 36.01, p < 0.001; Bonferroni-corrected Mann–Whitney U test, p < 0.001 for GABA-B-R2 and GABA-A-R groups, n = 271, 194, 154, 178, 174 from left to right. (D) A violin plot of start of first crawling bout for each larva during stimulation. Statistics: Kruskal–Wallis test: H = 53.07, p < 0.001; Bonferroni-corrected Mann–Whitney U test, p < 0.001 for GABA-B-R12 group, n = 89, 119, 139, 135, 137 from left to right. (E) Calcium transients (mean ± standard error of the mean [SEM]) represented by ΔF/F0 are evoked in Basin axons by optogenetic activation of Basin neurons various intensities. N = 9. Genotype: 20xUAS-Syn21-opGCaMP6s,10xUAS-Syn21-CsChrimson88::tdTomato/+;CyO/+;TM6/R72F11-Gal4. (F) Calcium transients (mean ± SEM) in Basin axons represented by ΔF/F0 are decreased by optogenetic activation of SeIN128 neurons at various intensities. N = 10. Genotype: 20xUAS-Syn21-opGCaMP6s,10xUAS-Syn21-CsChrimson88::tdTomato/+;CyO/R54B01-Gal4.AD;R72F11-Gal4/R46E07-Gal4.DBD. For (E, F), irradiances from left to right are 0.04, 0.1, 0.3, 0.5, and 1.4 µW/mm2. For each irradiance, individual traces are shown with gray lines, whereas the average of individuals is shown in black. Shaded gray area denotes period of optogenetic activation (0–1 s). ***p < 0.001.
-
Figure 7—figure supplement 1—source data 1
Excel sheet containing raw data from behavior tracking depicted in Figure 7—figure supplement 1.
- https://cdn.elifesciences.org/articles/93978/elife-93978-fig7-figsupp1-data1-v1.zip
-
Figure 7—figure supplement 1—source data 2
Excel sheet containing statistics data from behavior tracking depicted in Figure 7—figure supplement 1.
- https://cdn.elifesciences.org/articles/93978/elife-93978-fig7-figsupp1-data2-v1.zip
Figure 8 with 1 supplement
SeIN128 inhibits rolling elicited by both Basin-2 and Basin-4 activation.
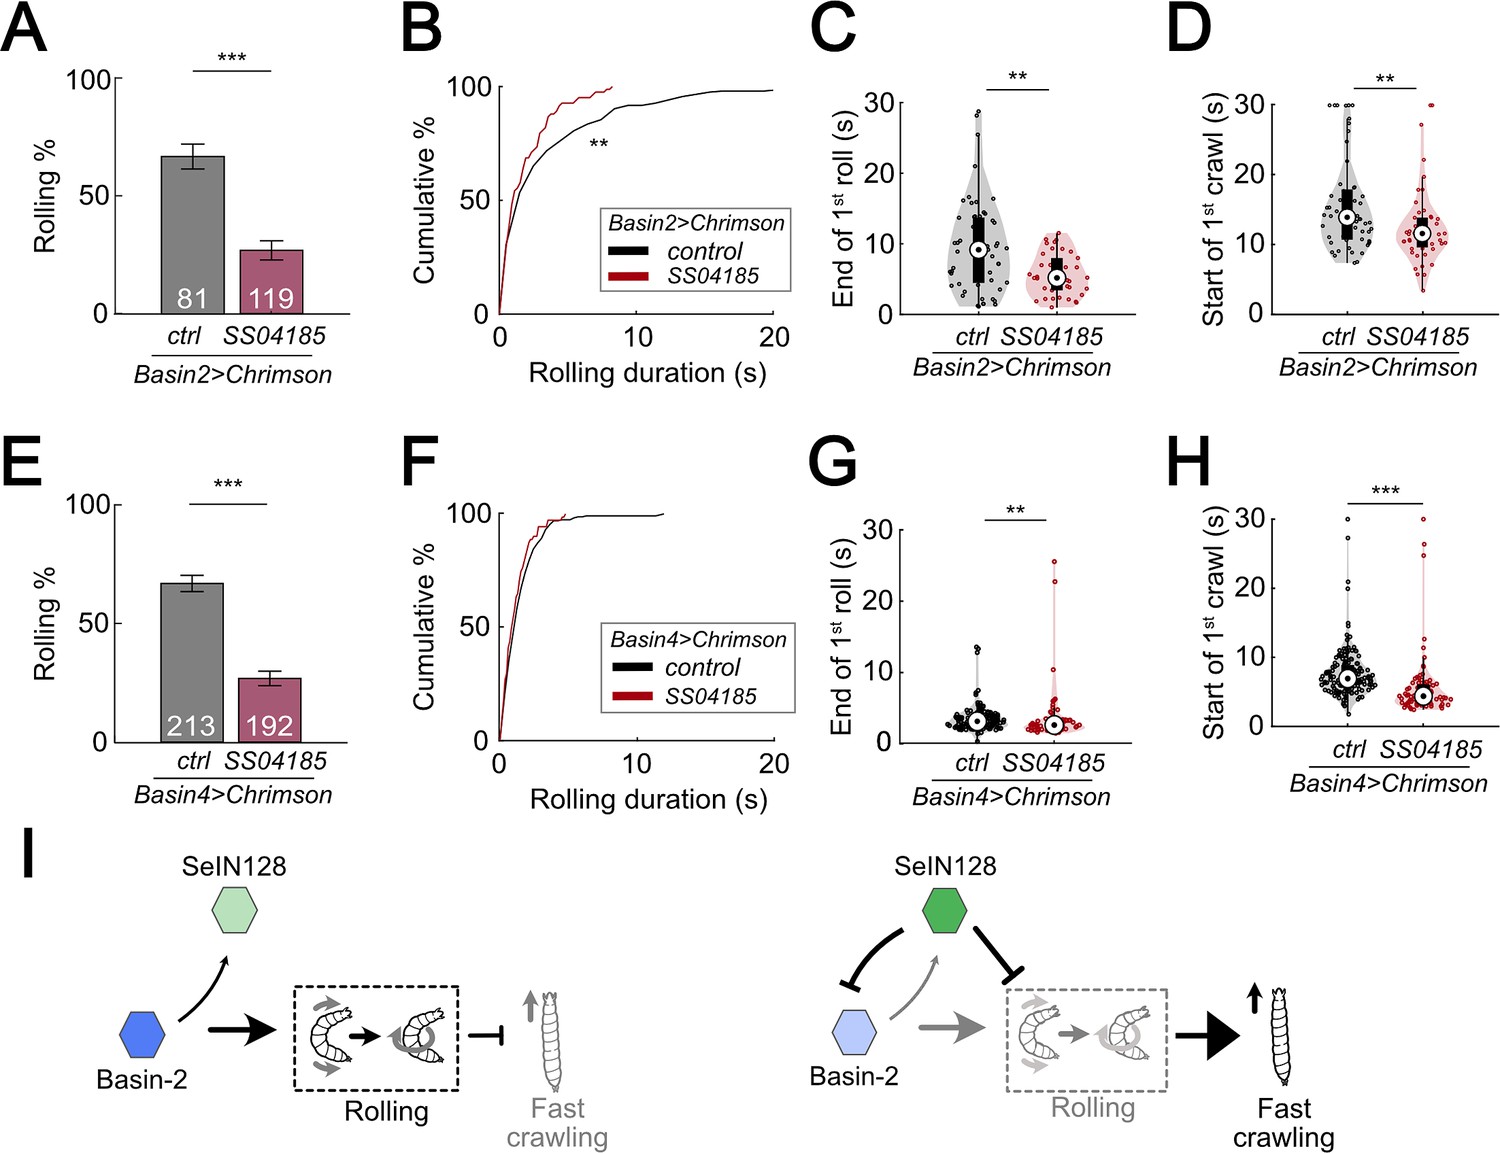
(A) Binned larval rolling probabilities during the first 5 s of stimulation. Error bars, 95% confidence interval. n = 81, 119. Statistics: Chi-square test, χ2 = 35.51, p < 0.001. Genotypes: 20xUAS-IVS-CsChrimson::mVenus/+; R72F11-Gal4.AD/+; R38H09-Gal4.DBD/+ (black); 20xUAS-IVS-CsChrimson::mVenus/+; R72F11-Gal4.AD/R54B01-Gal4.AD; R38H09-Gal4.DBD/R46E07-Gal4.DBD (red). Genotypes in (B–D) are the same as mentioned here. (B) Cumulative plot of rolling duration. Statistics: Mann–Whitney U test, p = 0.0034, n = 206, 83. (C) A violin plot of end of first rolling bout for each larva during stimulation. Statistics: Mann–Whitney U test, p = 0.0047, n = 57, 38. (D) A violin plot of start of first crawling bout for each larva during stimulation. Statistics: Mann–Whitney U test, p = 0.045, n = 107, 38. (E) Binned larval rolling probabilities during first 5 s of stimulation. Error bars, 95% confidence interval. n = 192, 213. Statistics: Chi-square test, χ2 = 64.81, p < 0.001. Genotypes: 20xUAS-IVS-CsChrimson::mVenus/+; R72F11-Gal4.AD/+; R57F07-Gal4.DBD/+ (black); 20xUAS-IVS-CsChrimson::mVenus/+; R72F11-Gal4.AD/R54B01-Gal4.AD; R57F07-Gal4.DBD/R46E07-Gal4.DBD (red). Genotypes in (F–H) are the same as mentioned here. (F) Cumulative plot of rolling duration. Statistics: Mann–Whitney U test, p = 0.032, n = 231, 71. (G) A violin plot of end of first rolling bout for each larva during stimulation. Statistics: Mann–Whitney U test, p = 0.0047, n = 129, 61. (H) A violin plot of start of first crawling bout for each larva during stimulation. Statistics: Mann–Whitney U test, p < 0.001, n = 159, 71. (I) A summarizing illustration. Basin-2 activates rolling and supresses fast crawling, while SeIN128 decreases Basin-2 activities to inhibit rolling and disinhibit fast crawling. Arrows show activation and blunt ends represent inhibition. **p < 0.01, ***p < 0.001.
-
Figure 8—source data 1
Excel sheet containing raw data from behavior tracking depicted in Figure 8B-D and F-H.
- https://cdn.elifesciences.org/articles/93978/elife-93978-fig8-data1-v1.zip
-
Figure 8—source data 2
Excel sheet containing statistics data from behavior tracking depicted in Figure 8B-D and F-H.
- https://cdn.elifesciences.org/articles/93978/elife-93978-fig8-data2-v1.zip
Figure 8—figure supplement 1
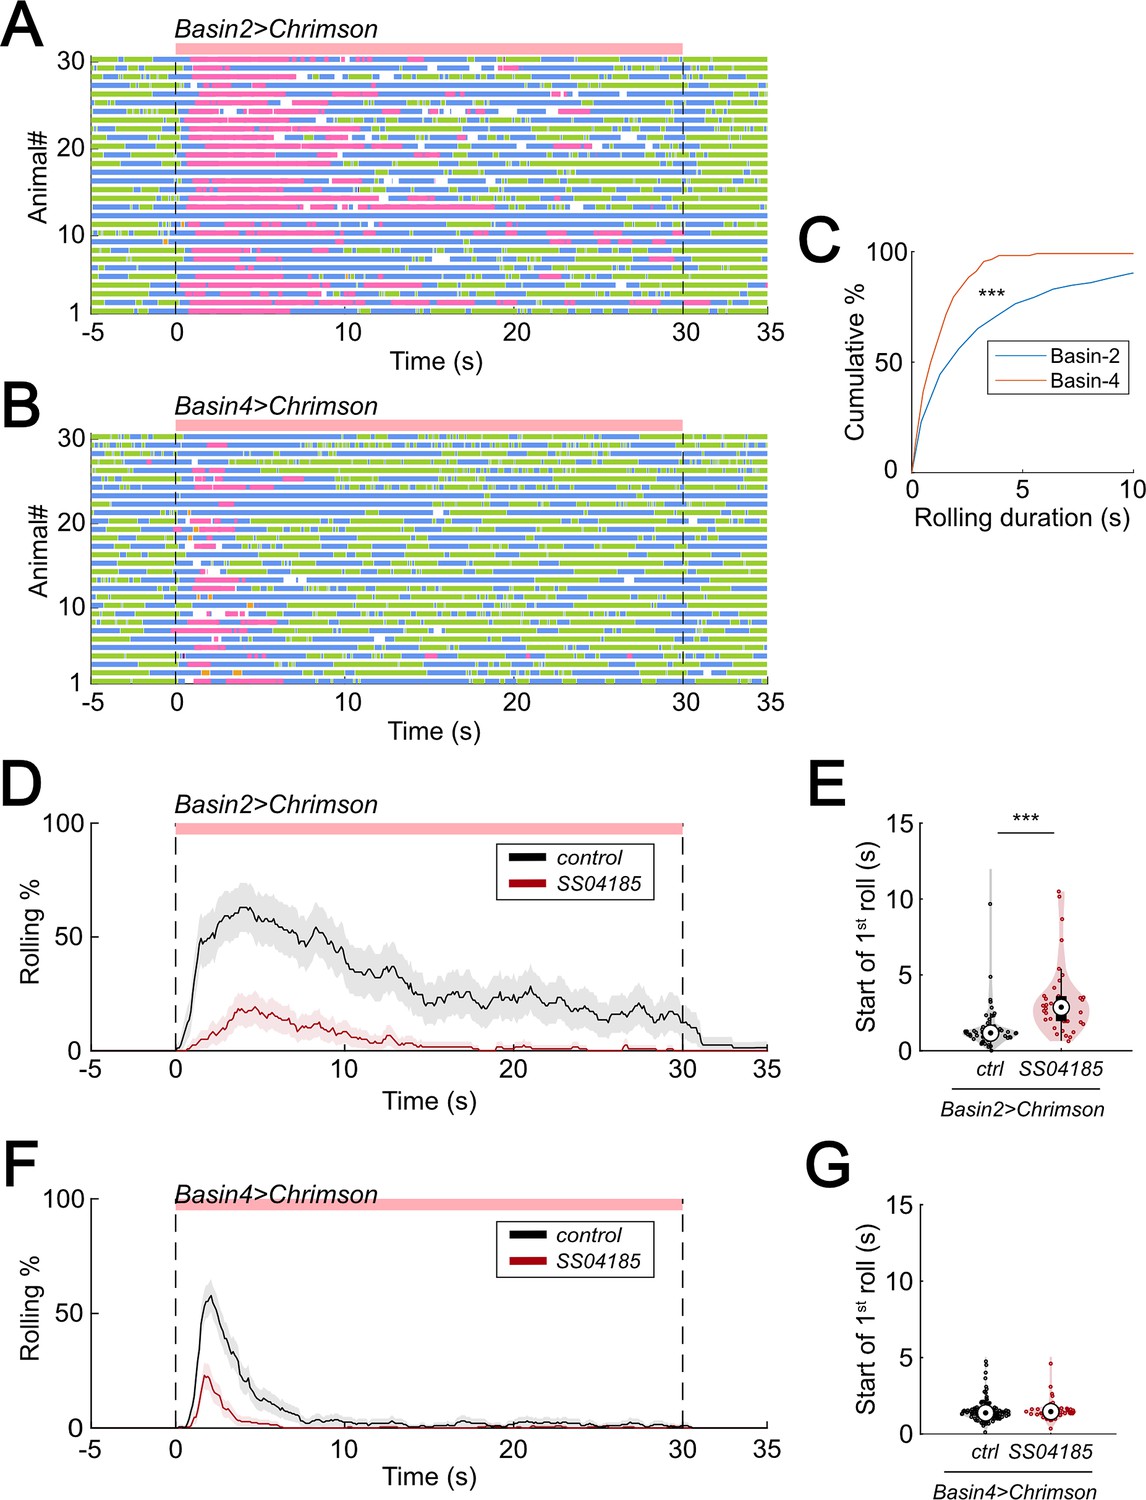
SeIN128 inhibits rolling elicited by both Basin-2 and Basin-4 activation.
(A) and (B) show ethograms of Basin-2 activation (A) and Basin-4 activation (B). Each row represents an individual larva. Pink, blue, green, orange, and purple lines represent bouts of rolling, turning, crawling, backward crawling, and hunching. The red bar and dashed lines denote the time window during the period of neural activation. Genotypes: 20xUAS-IVS-CsChrimson::mVenus/+; R72F11-Gal4.AD/+; R38H09-Gal4.DBD/+ (A); 20xUAS-IVS-CsChrimson::mVenus/+; R72F11-Gal4.AD/+; R57F07-Gal4.DBD/+ (B). Genotypes in (C) are the same as mentioned here. (C) Cumulative plot of rolling duration. Statistics: Mann–Whitney U test, p < 0.001, n = 681, 141. (D) Time series of rolling probabilities of larvae with Basin-2 activation (black), or SS04185 and Basin-2 co-activation (red). The red bar and dashed lines display the window of optogenetic stimulation eliciting larval escape responses. Shaded areas show 95% confidential intervals of rolling probabilities. Genotypes: 20xUAS-IVS-CsChrimson::mVenus/+; R72F11-Gal4.AD/+; R38H09-Gal4.DBD/+ (black); 20xUAS-IVS-CsChrimson::mVenus/+; R72F11-Gal4.AD/R54B01-Gal4.AD; R38H09-Gal4.DBD/R46E07-Gal4.DBD (red). Genotypes in (E) are the same as mentioned here. (E) A violin plot of start of first rolling bout for each larva during stimulation. Statistics: Mann–Whitney U test, p < 0.001, n = 57, 38. (F) Time series of rolling probabilities of larvae with Basin-4 activation (black), or SS04185 and Basin-4 co-activation (red). The red bar and dashed lines display the window of optogenetic stimulation eliciting larval escape responses. Shaded areas show 95% confidential intervals of rolling probabilities. Genotypes: 20xUAS-IVS-CsChrimson::mVenus/+; R72F11-Gal4.AD/+; R57F07-Gal4.DBD/+ (black); 20xUAS-IVS-CsChrimson::mVenus/+; R72F11-Gal4.AD/R54B01-Gal4.AD; R57F07-Gal4.DBD/R46E07-Gal4.DBD (red). Genotypes in (G) are the same as mentioned here. (G) A violin plot of start of first rolling bout for each larva during stimulation. Statistics: Mann–Whitney U test, p > 0.05, n = 129, 61. ***p < 0.001.
-
Figure 8—figure supplement 1—source data 1
Excel sheet containing raw data from behavior tracking depicted in Figure 8—figure supplement 1C, E and G.
- https://cdn.elifesciences.org/articles/93978/elife-93978-fig8-figsupp1-data1-v1.zip
-
Figure 8—figure supplement 1—source data 2
Excel sheet containing statistics data from behavior tracking depicted in Figure 8—figure supplement 1C, E and G.
- https://cdn.elifesciences.org/articles/93978/elife-93978-fig8-figsupp1-data2-v1.zip
Videos
Video 1
Drosophila larva behavior during only Basins activation.
Activation of Basins alone evokes protracted rolling followed by turning/crawling.
Video 2
Drosophila larva behavior during co-activation of Basins and SS04185 neurons.
Co-activation of SS04185 and Basins evokes only brief rolling followed by turning/crawling.
Tables
Key resources table
| Reagent type (species) or resource | Designation | Source or reference | Identifiers | Additional information |
|---|---|---|---|---|
| Gene (Drosophila melanogaster) | Killer Zipper (KZip+) | Dolan et al., 2017 Bloomington Drosophila Stock Center (BDSC) | RRID:BDRC_76254 | |
| Genetic reagent (D. melanogaster) | R72F11-Gal4 | BDSC | BDSC:39786; RRID:BDRC_39786 | FlyBase: P{GMR72F11-GAL4} |
| Genetic reagent (D. melanogaster) | R71A10-Gal4 | BDSC | BDSC:39562; RRID:BDRC_39562 | FlyBase P{GMR71A10-GAL4} |
| Genetic reagent (D. melanogaster) | SS04185-Gal4 | Gift from Zlatic laboratory | N/A | R54B01-Gal4AD; R46E07-Gal4DBD |
| Genetic reagent (D. melanogaster) | SS00739-Gal4 | Gift from Zlatic laboratory | N/A | R72F11-Gal4AD;R38H09-Gal4DBD |
| Genetic reagent (D. melanogaster) | SS00740-Gal4 | Gift from Zlatic laboratory | N/A | R72F11-Gal4AD;R57F07-Gal4DBD |
| Genetic reagent (D. melanogaster) | MB247-Gal4 | BDSC | BDRC:50742; RRID:BDRC_50742 | FlyBase P{Mef2-GAL4.247} |
| Genetic reagent (D. melanogaster) | R13F02-LexA | BDSC | BDRC:52460; RRID:BDRC_52460 | FlyBase P{GMR13F02-lexA} |
| Genetic reagent (D. melanogaster) | R72F11-LexA | BDSC | BDRC:94661; RRID:BDRC_94661 | FlyBase P{GMR72F11-lexA} |
| Genetic reagent (D. melanogaster) | R71A10-LexA | Gift from Zlatic lab | N/A | |
| Genetic reagent (D. melanogaster) | Mi{Trojan-LexA-QFAD.2}Gad1 | BDSC | BDRC:60324; RRID:BDRC_60324 | FlyBase Mi{Trojan-lexA:QFAD.2} |
| Genetic reagent (D. melanogaster) | 20xUAS-IVS-CsChrimson::mVenus | BDSC | BDRC:55134; RRID:BDRC_55134 | FlyBase P{20XUAS-IVS-CsChrimson.mVenus} |
| Genetic reagent (D. melanogaster) | 20xUAS-IVS-CsChrimson::mVenus | BDSC | BDRC:55136; RRID:BDRC_55136 | FlyBase P{20XUAS-IVS-CsChrimson.mVenus} |
| Genetic reagent (D. melanogaster) | 13xLexAop2-IVS-CsChrimson::mVenus | BDSC | BDRC:55137; RRID:BDRC_55137 | FlyBase P{13XLexAop2-IVS-CsChrimson.mVenus} |
| Genetic reagent (D. melanogaster) | 13xLexAop2-IVS-CsChrimson::tdTomato | Gift from Rubin lab | N/A | |
| Genetic reagent (D. melanogaster) | 13xLexAop2-IVS-CsChrimson::tdTomato | BDSC | BDRC:82183; RRID:BDRC_82183 | FlyBase PBac{13XLexAop2-IVS-CsChrimson.tdTomato} |
| Genetic reagent (D. melanogaster) | 20xUAS(FRT.stop)CsChrimson.mVenus(attP18), pBPhsFlp2::Pest | Gift from Rubin lab | N/A | |
| Genetic reagent (D. melanogaster) | hs(KDRT.stop)FLP | BDSC | BDRC:67091; RRID:BDRC_67091 | FlyBase symbol: P{hs(KDRT.stop)FLP} |
| Genetic reagent (D. melanogaster) | 20xUAS(FRT.stop)CsChrimson::mVenus | Gift from Rubin lab | N/A | |
| Genetic reagent (D. melanogaster) | UAS-TeTxLC.tnt | BDSC | BDRC:28838; RRID:BDRC_28838 | FlyBase symbol: P{UAS-TeTxLC.tnt} |
| Genetic reagent (D. melanogaster) | 20xUAS-TTS-Shibirets1-p10 | BDSC | BDRC:66600; RRID:BDRC_66600 | FlyBase PBac{20XUAS-TTS-shits1-p10} |
| Genetic reagent (D. melanogaster) | 10xUAS-IVS-mry::GFP | Gift from Rubin lab | N/A | |
| Genetic reagent (D. melanogaster) | 13xLexAop-dsRed | Gift from Rubin lab | N/A | |
| Genetic reagent (D. melanogaster) | 20xUAS-IVS-GCaMP6s | BDSC | BDRC:42749; RRID:BDRC_42749 | FlyBase PBac{20XUAS-IVS-GCaMP6s} |
| Genetic reagent (D. melanogaster) | 20xLexAop-IVS-Syn21-GCaMP6s | Gift from Rubin lab | N/A | |
| Genetic reagent (D. melanogaster) | 20xUAS-Syn21-opGCaMP6s | Gift from Rubin lab | N/A | |
| Genetic reagent (D. melanogaster) | 10xUAS-Syn21-CsChrimson88::tdTomato | Gift from Rubin lab | N/A | |
| Genetic reagent (D. melanogaster) | HMS02355 | BDSC | BDRC:41958; RRID:BDRC_41958 | FlyBase P{TRiP.HMS02355} |
| Genetic reagent (D. melanogaster) | HMC03388 | BDSC | BDRC:51817; RRID:BDRC_51817 | FlyBase P{TRiP.HMC03388} |
| Genetic reagent (D. melanogaster) | JF02989 | BDSC | BDRC:28353; RRID:BDRC_28353 | FlyBase P{TRiP.JF02989} |
| Genetic reagent (D. melanogaster) | HMC02975 | BDSC | BDRC:50608; RRID:BDRC_50608 | FlyBase P{TRiP.HMC02975} |
| Genetic reagent (D. melanogaster) | HMC03643 | BDSC | BDRC:52903; RRID:BDRC_52903 | FlyBase P{TRiP.HMC03643} |
| Antibody | anti-Brp, clone nc82 (Mouse monoclonal) | Developmental Studies Hybridoma Bank | Cat#: nc82, RRID:AB_2314866 | IHC (1:50) |
| Antibody | 1D4 anti-fasciclin II (Mouse monoclonal) | Developmental Studies Hybridoma Bank | Cat#: 1D4 anti-Fasciclin II, RRID:AB_528235 | IHC (1:20) |
| Antibody | anti-cadherin, DN-(extracellular domain) (Rat monoclonal) | Developmental Studies Hybridoma Bank | Cat#: DN-Ex #8, RRID:AB_528121 | IHC (1:20) |
| Antibody | anti-GFP (Chicken polyclonal) | Abcam | Cat#:ab13970, RRID:AB_300798 | IHC (1:3000) |
| Antibody | anti-GFP (Rabbit polyclonal) | Thermo Fisher Scientific | Cat#:A-6455, RRID:AB_221570 | IHC (1:1000) |
| Antibody | anti-DsRed (Rabbit polyclonal) | Takara Bio | Cat#:632496, RRID:AB_10013483 | IHC (1:1000) |
| Antibody | anti-Drosophila choline acetyltransferase (Mouse monoclonal) | Developmental Studies Hybridoma Bank | Cat#:chat4b1, RRID:AB_528122 | IHC (1:20) |
| Antibody | anti-GABA (Rabbit polyclonal) | Millipore Sigma | Cat#:A2052 | IHC (1:1000) |
| Antibody | Drosophila VGLUT (Rabbit polyclonal) | Gift from McCabe laboratory; Banerjee et al., 2021 | IHC (1:20) | |
| Antibody | anti-VGAT (Rabbit polyclonal) | Gift from Krantz laboratory; Fei et al., 2010 | IHC (1:200) | |
| Antibody | anti-Elav (Rat polyclonal) | Developmental Studies Hybridoma Bank | Cat#:7E8A10, RRID:AB_528218 | IHC (1:50) |
| Antibody (secondary) | anti-chicken IgY (H+L) Alexa Fluor 488 (Goat polyclonal) | Thermo Fisher Scientific | Cat#:A-11039, RRID:AB_2534096 | IHC (1:500) |
| Antibody (secondary) | anti-rabbit IgG (H+L) Alexa Fluor 488 (Goat polyclonal) | Thermo Fisher Scientific | Cat#:A-11034, RRID:AB_ 2576217 | IHC (1:500) |
| Antibody (secondary) | anti-rabbit IgG (H+L) Alexa Fluor 568 (Goat polyclonal) | Thermo Fisher Scientific | Cat#:A-11011, RRID:AB_143157 | IHC (1:500) |
| Antibody (secondary) | anti-mouse IgG (H+L) Alexa Fluor 568 (Goat polyclonal) | Thermo Fisher Scientific | Cat#:A-11004, RRID:AB_2534072 | IHC (1:500) |
| Antibody (secondary) | anti-rat IgG (H+L) Alexa Fluor 568 (Goat polyclonal) | Thermo Fisher Scientific | Cat#:A-11077, RRID:AB_2534121 | IHC (1:500) |
| Chemical compound, drug | PBS, phosphate-buffered saline, 10× solution | Fisher Scientific | Cat#:BP399-1 | |
| Chemical compound, drug | Triton X-100 | Millipore Sigma | Cat#:X100-100ML | |
| Chemical compound, drug | Paraformaldehyde 20% aqueous solution | Electron Microscopy Sciences | Cat#:15713 | |
| Chemical compound, drug | Normal goat serum | Gibco | Cat#:PCN5000 | |
| Chemical compound, drug | VECTASHIELD antifade mounting medium | Vector Laboratories | Cat#:H-1000-10 | |
| Chemical compound, drug | Drosophila Agar | Diamed | Cat#:GEN66-103 | |
| Chemical compound, drug | All Trans Retinal | Toronto Research Chemicals Inc | Cat#:R24000 | |
| Chemical compound, drug | Poly-L-lysine | Sigma-Aldrich | Cat#:P1524 | |
| Software, algorithm | FIJI | https://fiji.sc/ | RRID:SCR_002285 | |
| Software, algorithm | MATLAB | MathWorks | RRID:SCR_001622 | |
| Software, algorithm | CATMAID | https://catmaid.readthedocs.org/ | RRID:SCR_006278 | |
| Software, algorithm | Multi Worm Tracker | http://sourceforge.net/projects/mwt | N/A | |
| Software, algorithm | ZEN | Carl Zeiss Microscopy | Version 2.1 | |
| Software, algorithm | Affinity Designer | Affinity | Version 1.10.5 | |
| Software, algorithm | ScanImage | MBF Bioscience | N/A |
Additional files
Download links
A two-part list of links to download the article, or parts of the article, in various formats.
Downloads (link to download the article as PDF)
Open citations (links to open the citations from this article in various online reference manager services)
Cite this article (links to download the citations from this article in formats compatible with various reference manager tools)
Feedback inhibition by a descending GABAergic neuron regulates timing of escape behavior in Drosophila larvae
eLife 13:RP93978.
https://doi.org/10.7554/eLife.93978.3


