Transcriptional inhibition after irradiation occurs preferentially at highly expressed genes in a manner dependent on cell cycle progression
- Weill Cornell Medicine, Department of Pathology and Laboratory Medicine, United States
- Basic and Translational Research Division, Department of Cardiology, Boston Children's Hospital, United States
- Department of Pediatrics, Harvard Medical School, United States
Figures
Figure 1 with 2 supplements
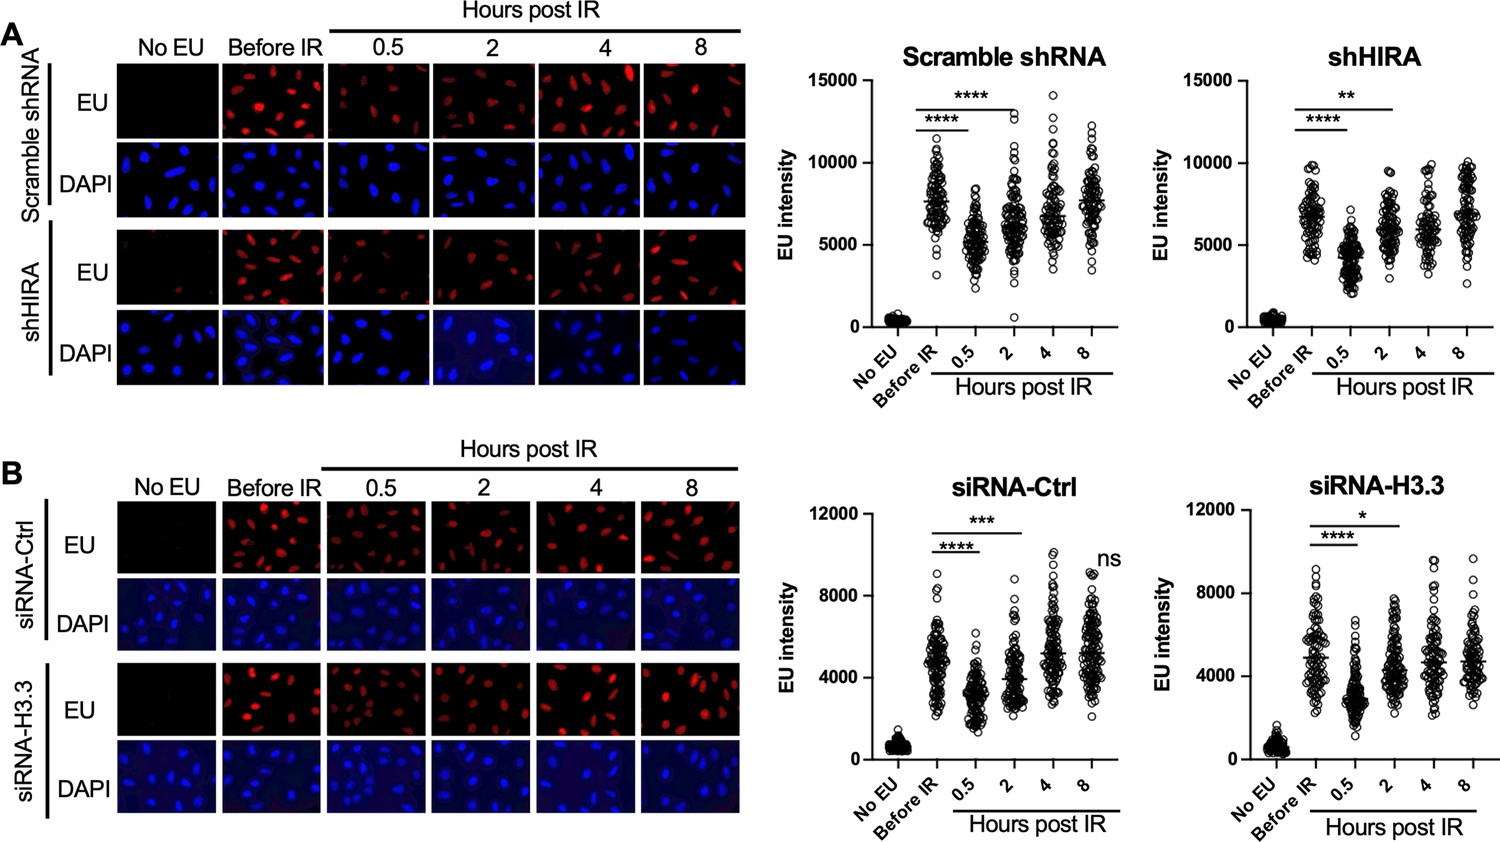
Transcriptional inhibition after irradiation and transcriptional restart after DNA repair in a HIRA-independent manner.
(A) U2OS cells were transfected with either a scrambled shRNA or shRNA against HIRA, and were either incubated with ethynyl uridine (EU) or not, as indicated, and were irradiated (10 Gy) or not as indicated, followed by detection of EU by click chemistry of a fluorophore and DNA was detected by DAPI staining. The right panel shows quantitation of the mean intensity of EU in at least 80 cells for each condition. ****p<0.001, **p<0.01, by student’s t-test. (B) U2OS cells were transfected with either a control siRNA (siRNA-Ctrl) or two siRNAs against each gene encoding H3.3 (siRNA-H3). EU and DAPI were detected as described in A and quantitated as described in A. ****p<0.001, ***p<0.005, *p<0.05 by student’s t-test.
Figure 1—figure supplement 1
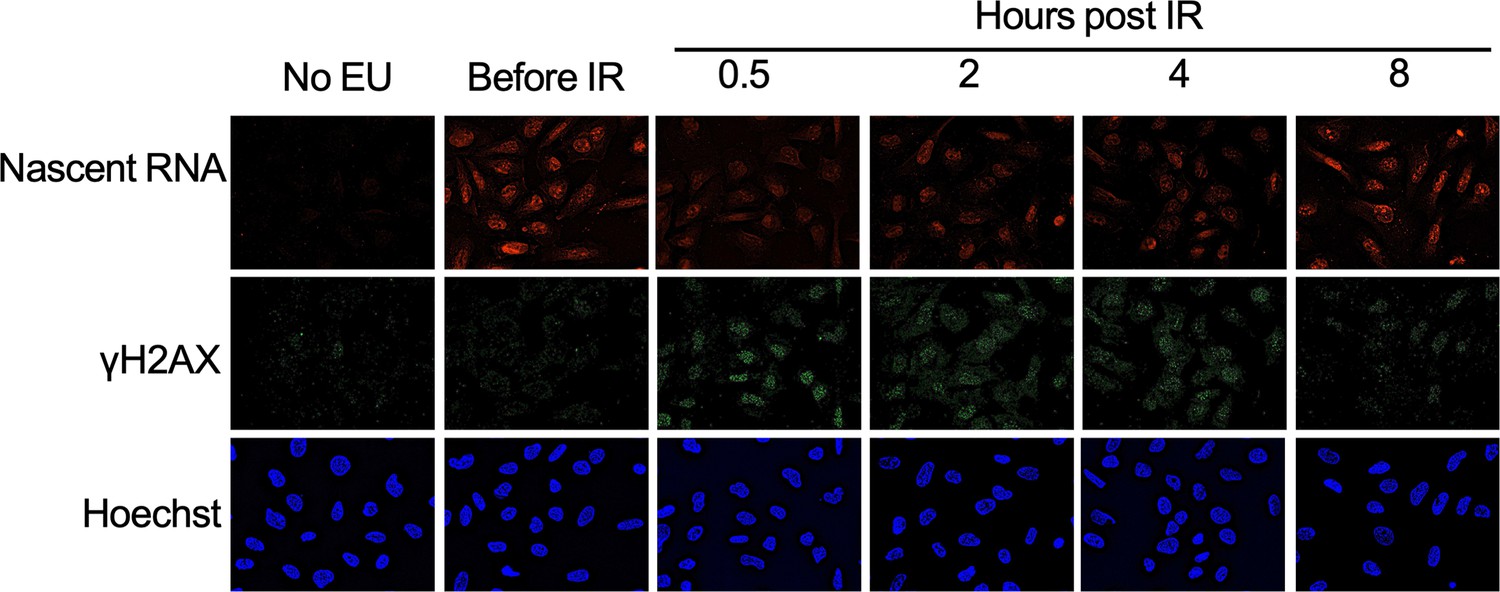
Transcriptional inhibition after irradiation and transcriptional restart after DNA repair in U2OS cells.
U2OS cells were either incubated with ethynyl uridine (EU) or not, as indicated, and were irradiated (10 Gy) or not as indicated, followed by detection of the EU by click chemistry of a fluorophore, and immunofluorescence staining of gamma H2AX in the same cells and the DNA was detected by Hoechst staining.
Figure 1—figure supplement 2
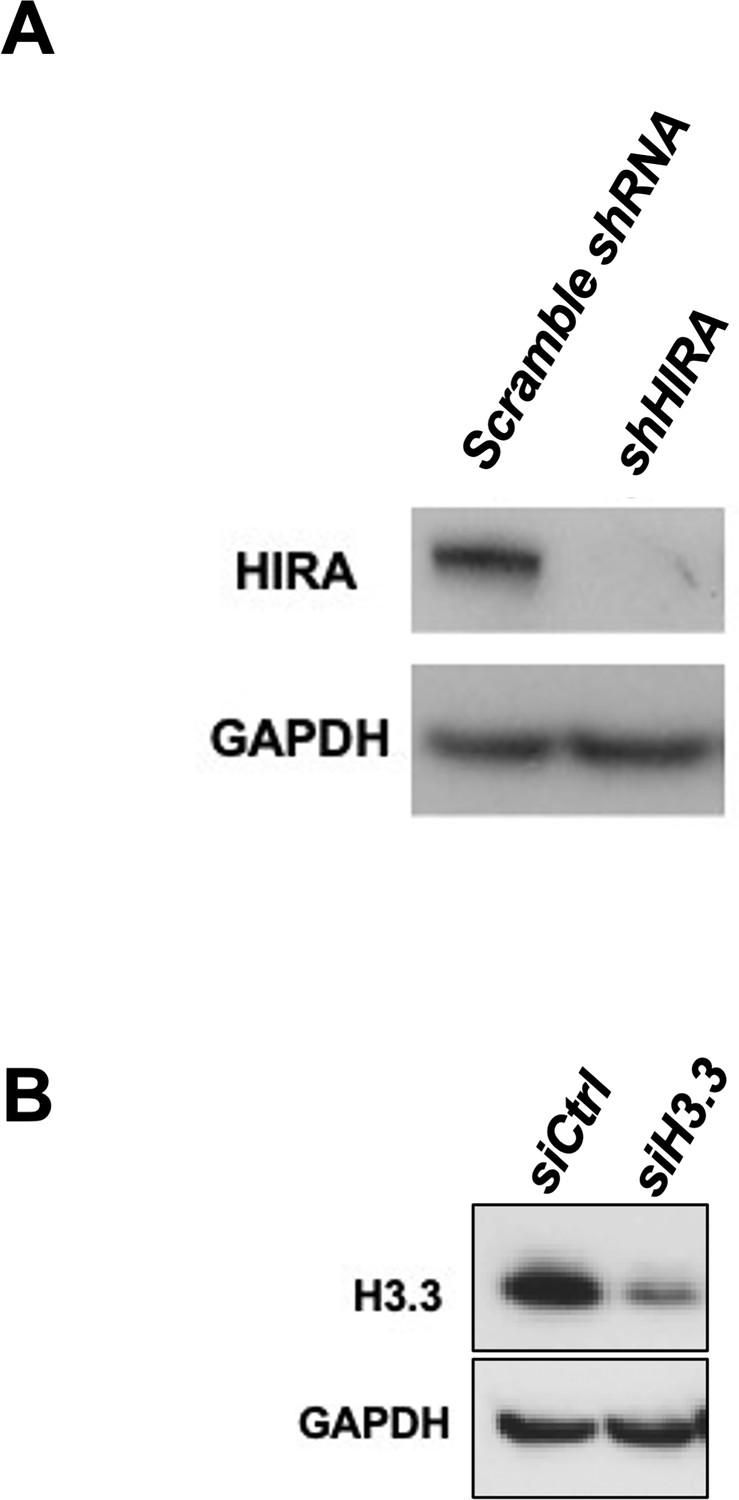
Confirmation of knockdown of HIRA (A) and H3.3 (B).
The samples were from the same experiments shown in Figure 1.
-
Figure 1—figure supplement 2—source data 1
Original file for the Western blot analysis in Figure 1—figure supplement 1A (anti-HIRA and anti-GAPDH).
- https://cdn.elifesciences.org/articles/94001/elife-94001-fig1-figsupp2-data1-v1.zip
-
Figure 1—figure supplement 2—source data 2
PDF containing Figure 1—figure supplement 1A and original scans of the relevant Western blot analysis (anti-CUL4A, anti-CUL4B, and anti-GAPDH) with highlighted bands and sample labels.
- https://cdn.elifesciences.org/articles/94001/elife-94001-fig1-figsupp2-data2-v1.pdf
-
Figure 1—figure supplement 2—source data 3
Original file for the Western blot analysis in Figure 1—figure supplement 1B (anti-H3.3 and anti-GAPDH).
- https://cdn.elifesciences.org/articles/94001/elife-94001-fig1-figsupp2-data3-v1.tif
-
Figure 1—figure supplement 2—source data 4
PDF containing Figure 1—figure supplement 1B and original scans of the relevant Western blot analysis (anti-H3.3 and anti-GAPDH) with highlighted bands and sample labels.
- https://cdn.elifesciences.org/articles/94001/elife-94001-fig1-figsupp2-data4-v1.pdf
Figure 2 with 1 supplement
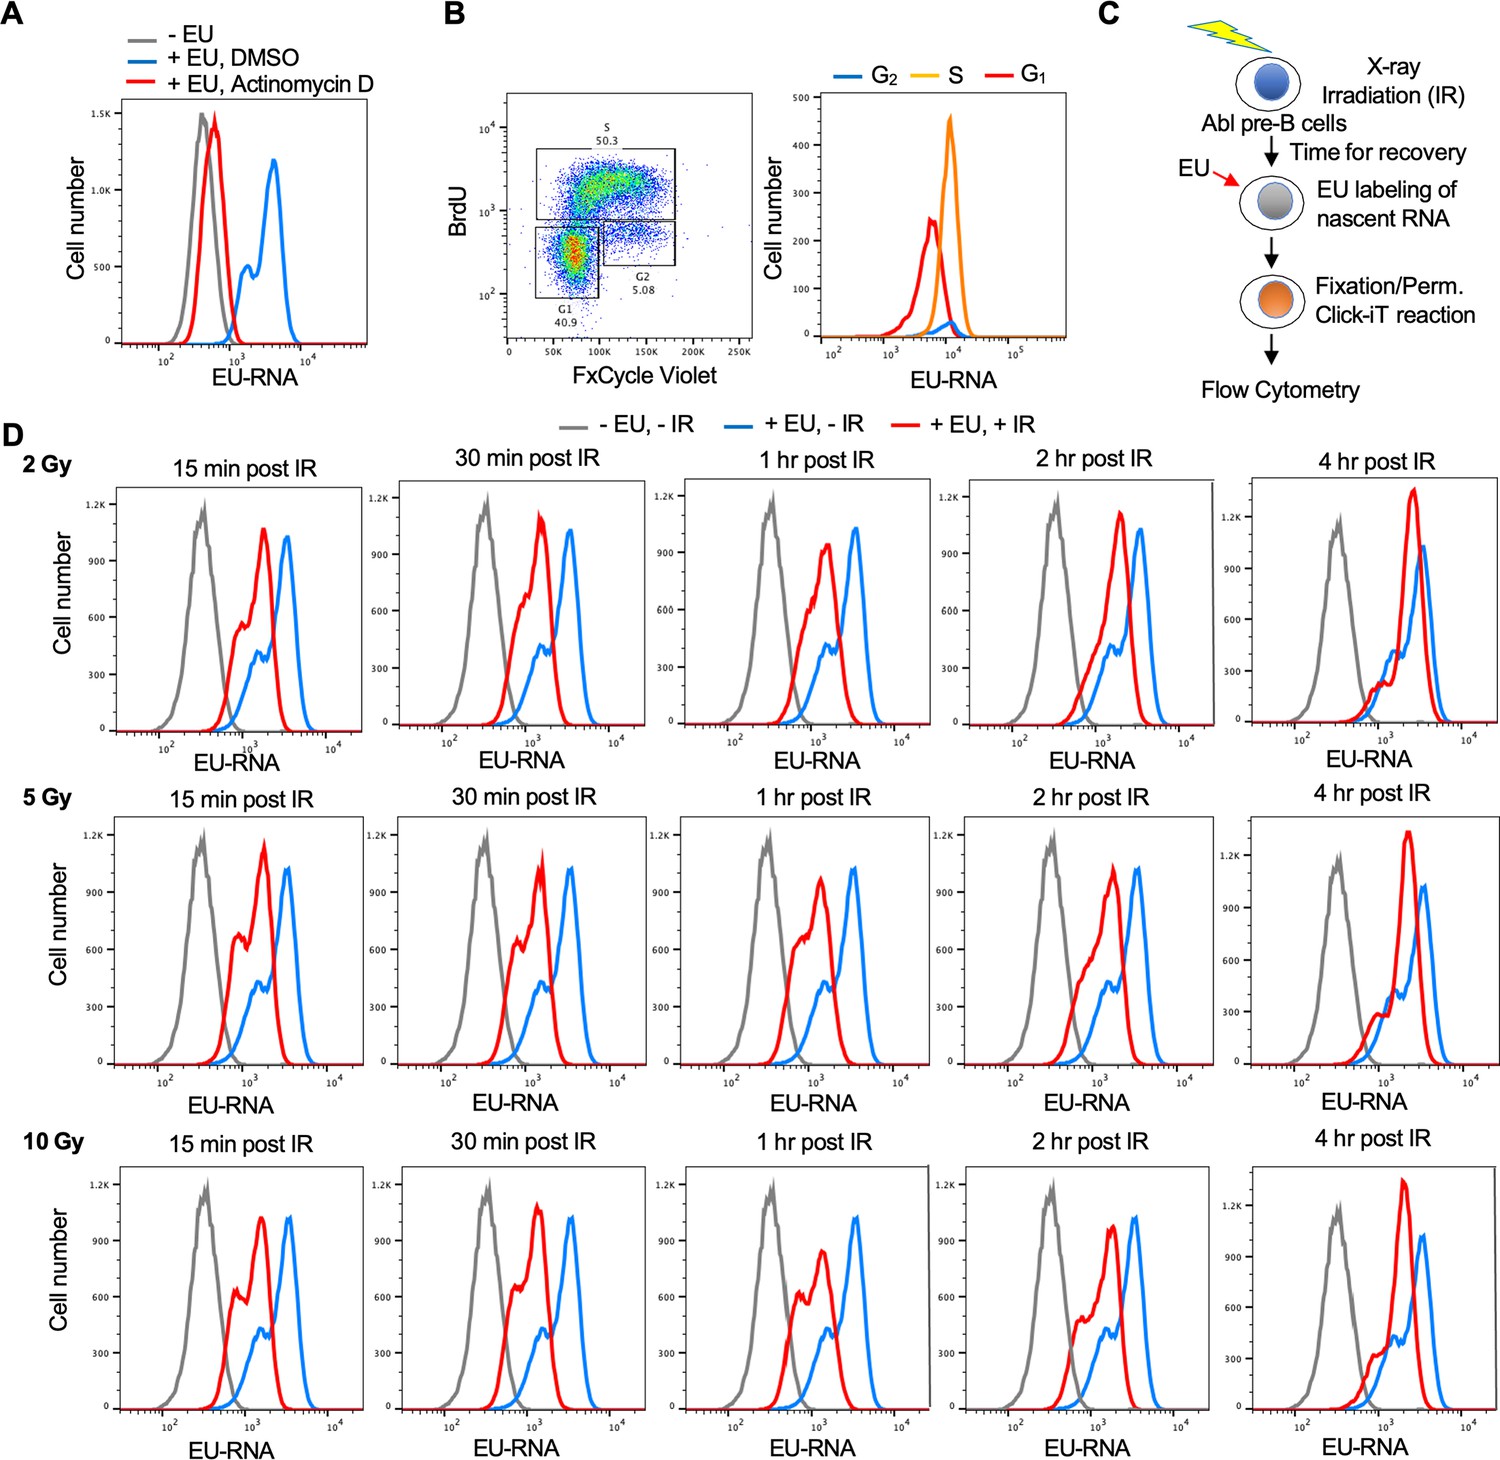
Development of a flow cytometry assay for nascent transcripts shows that transcriptional inhibition after ionizing radiation (IR) is not dose-dependent.
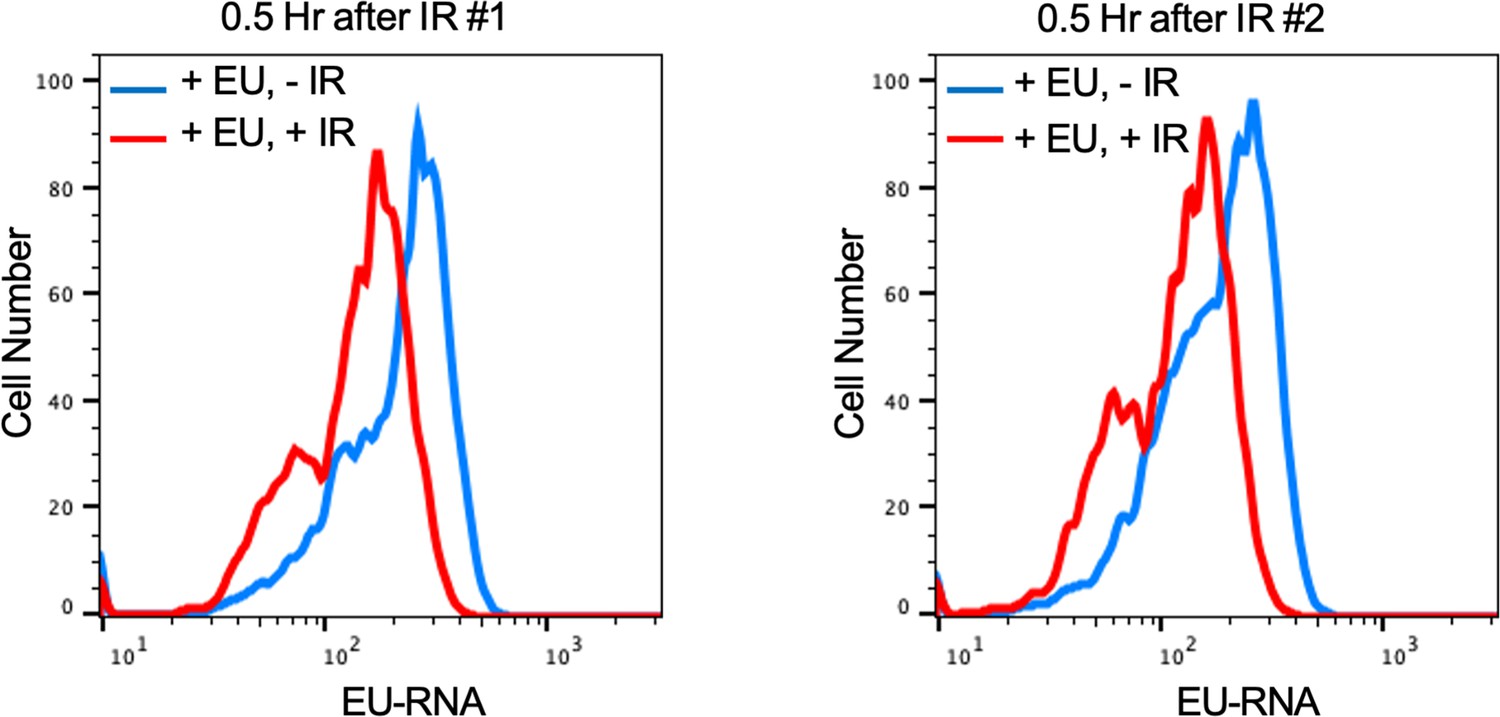
(A) The ethynyl uridine (EU) positive signal in murine Abl pre-B cells detected by flow cytometry is due to transcripts, as indicated by the addition of 5 µM of the general RNA polymerase inhibitor Actinomycin D for 1 hr. (B) The two EU peaks observed by flow cytometry correspond to G1 (low peak) and G2 (high peak) cells. Cycling Abl pre-B cells (left panel) were gated for those with 2 N DNA (G1) content or 4 N (G2) content as detected by FxCycle Violate or with BrdU incorporation (S) as indicated and were individually analyzed for EU incorporation into nascent transcripts (right panel). (C) Schematic of the assay to detect transcriptional inhibition and transcriptional recovery after IR. (D) Time course of transcriptional inhibition and recovery in Abl pre-B cells after IR with the indicated times after IR at the indicated doses of IR.
Figure 2—figure supplement 1
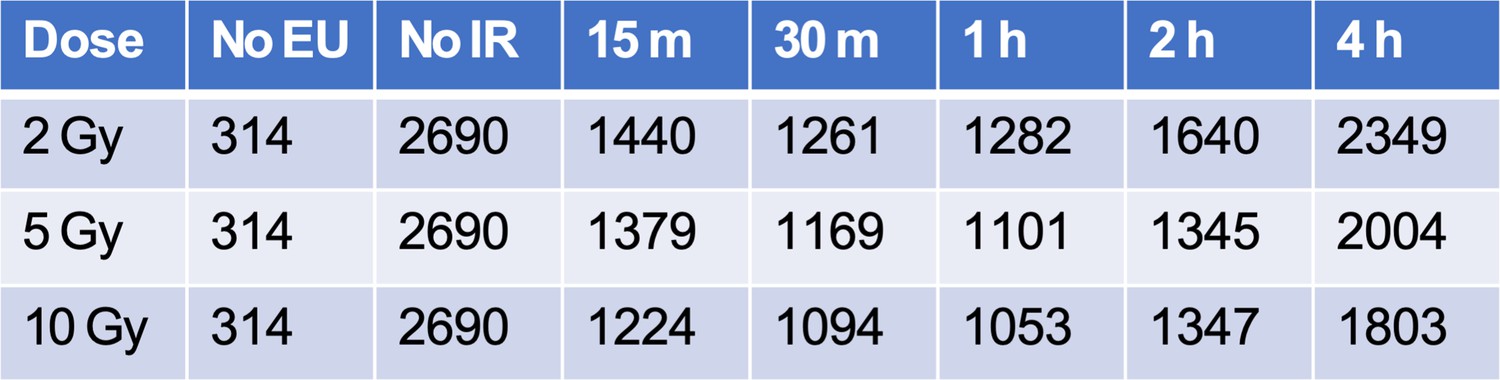
The mean intensities of the ethynyl uridine (EU) peaks shown in Figure 2D are indicated.
The mean value of each sample was calculated by Flowjo software.
Figure 3 with 3 supplements
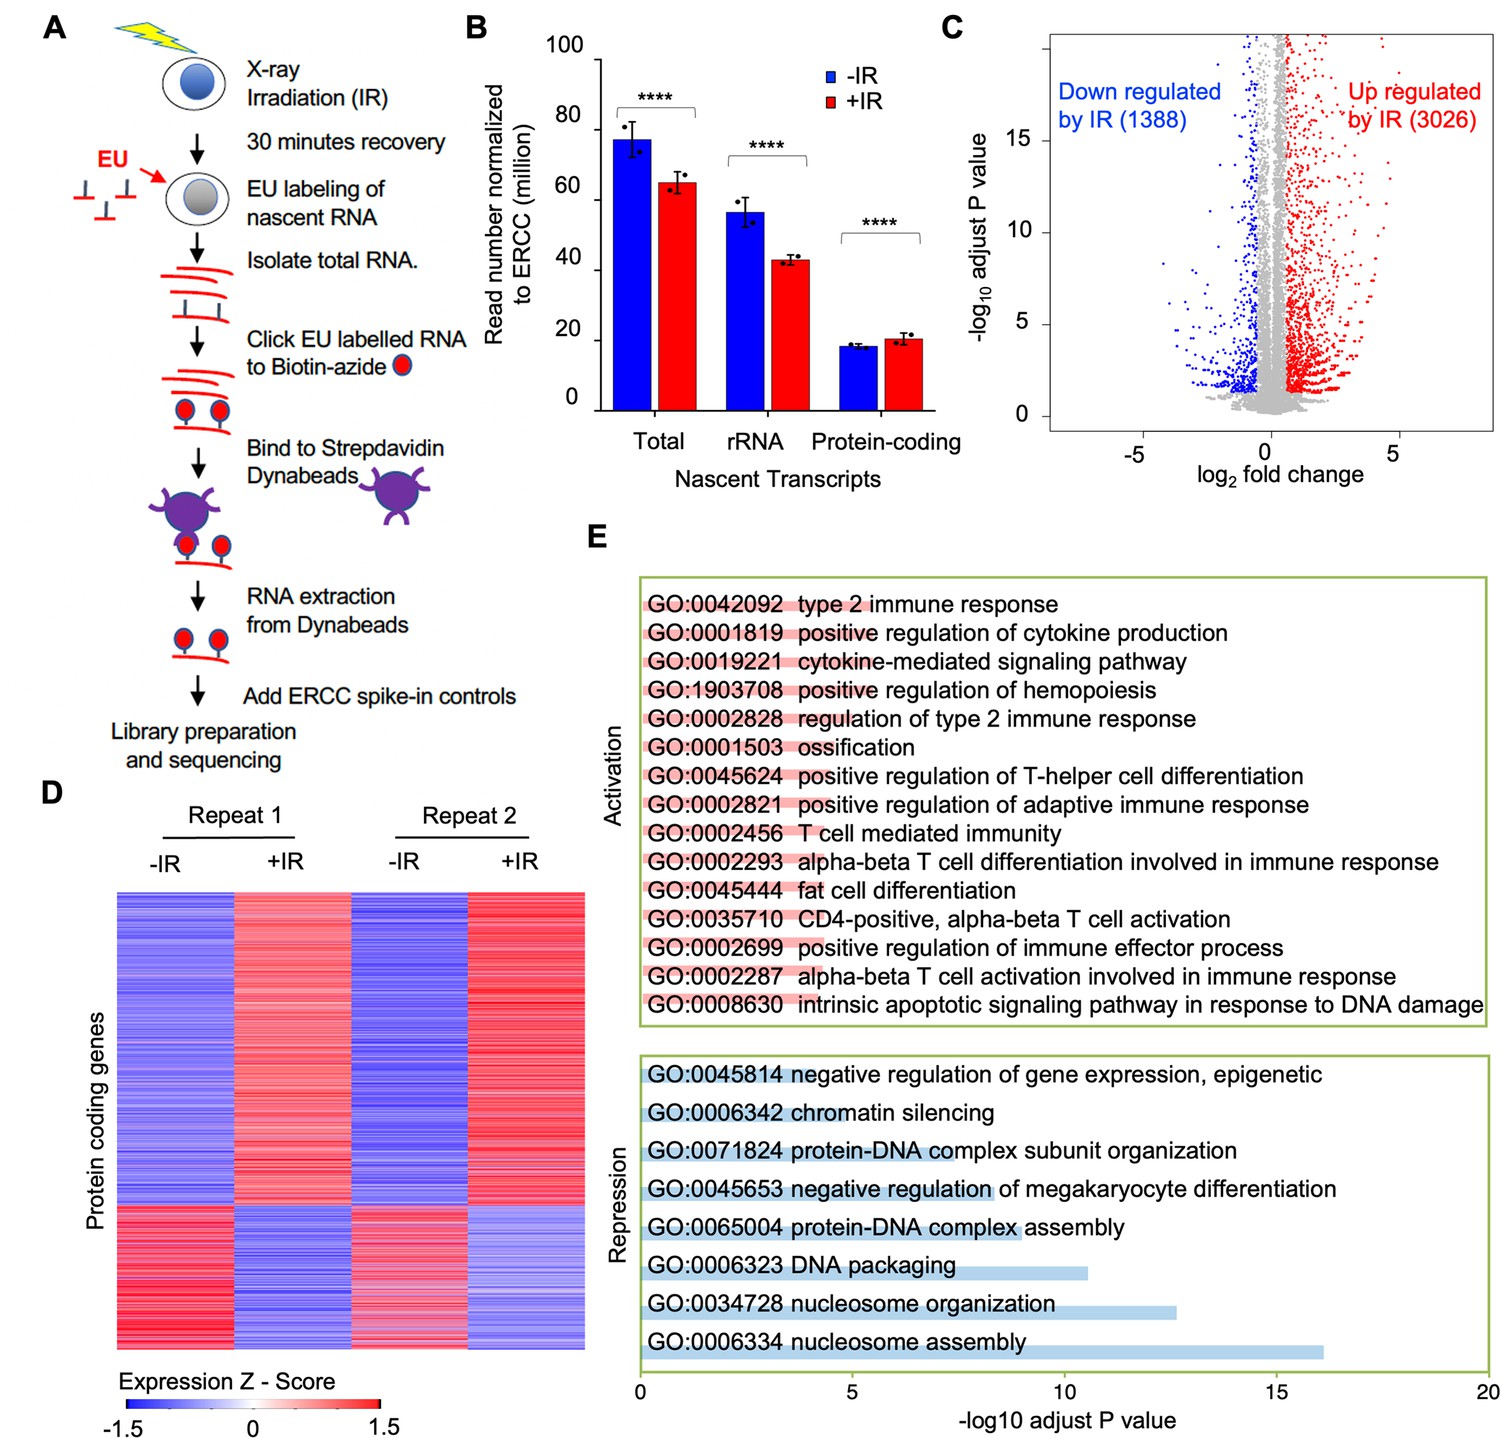
Reduction of nascent transcript levels after irradiation is mainly of the rDNA.
(A) Schematic of nascent transcript sequencing. (B) Read counts for the total nascent transcripts, rDNA transcripts, and protein-coding transcripts before and 30 min after ionizing radiation (IR), normalized to ERCC spike-in controls. (C) Significantly changed nascent transcripts from protein-coding genes are indicated upon irradiation, and the numbers indicate the number of upregulated and downregulated genes 30 min after IR. Data shown are an average of the two independent experimental repeats. (D) Heat map of significantly increased and decreased nascent transcripts 30 min after IR, shown for two independent experimental repeats. Expression z-score was calculated by subtracting the overall average gene abundance from the raw expression for each gene and dividing that result by the standard deviation (SD) of all of the measured counts across all samples. (E) Gene ontology analysis of the top significantly enriched GO terms most upregulated after IR (pink) and most downregulated after IR (blue).
Figure 3—figure supplement 1
Nascent transcript levels before and after 30 min of ionizing radiation (IR).
Figure 3—figure supplement 2
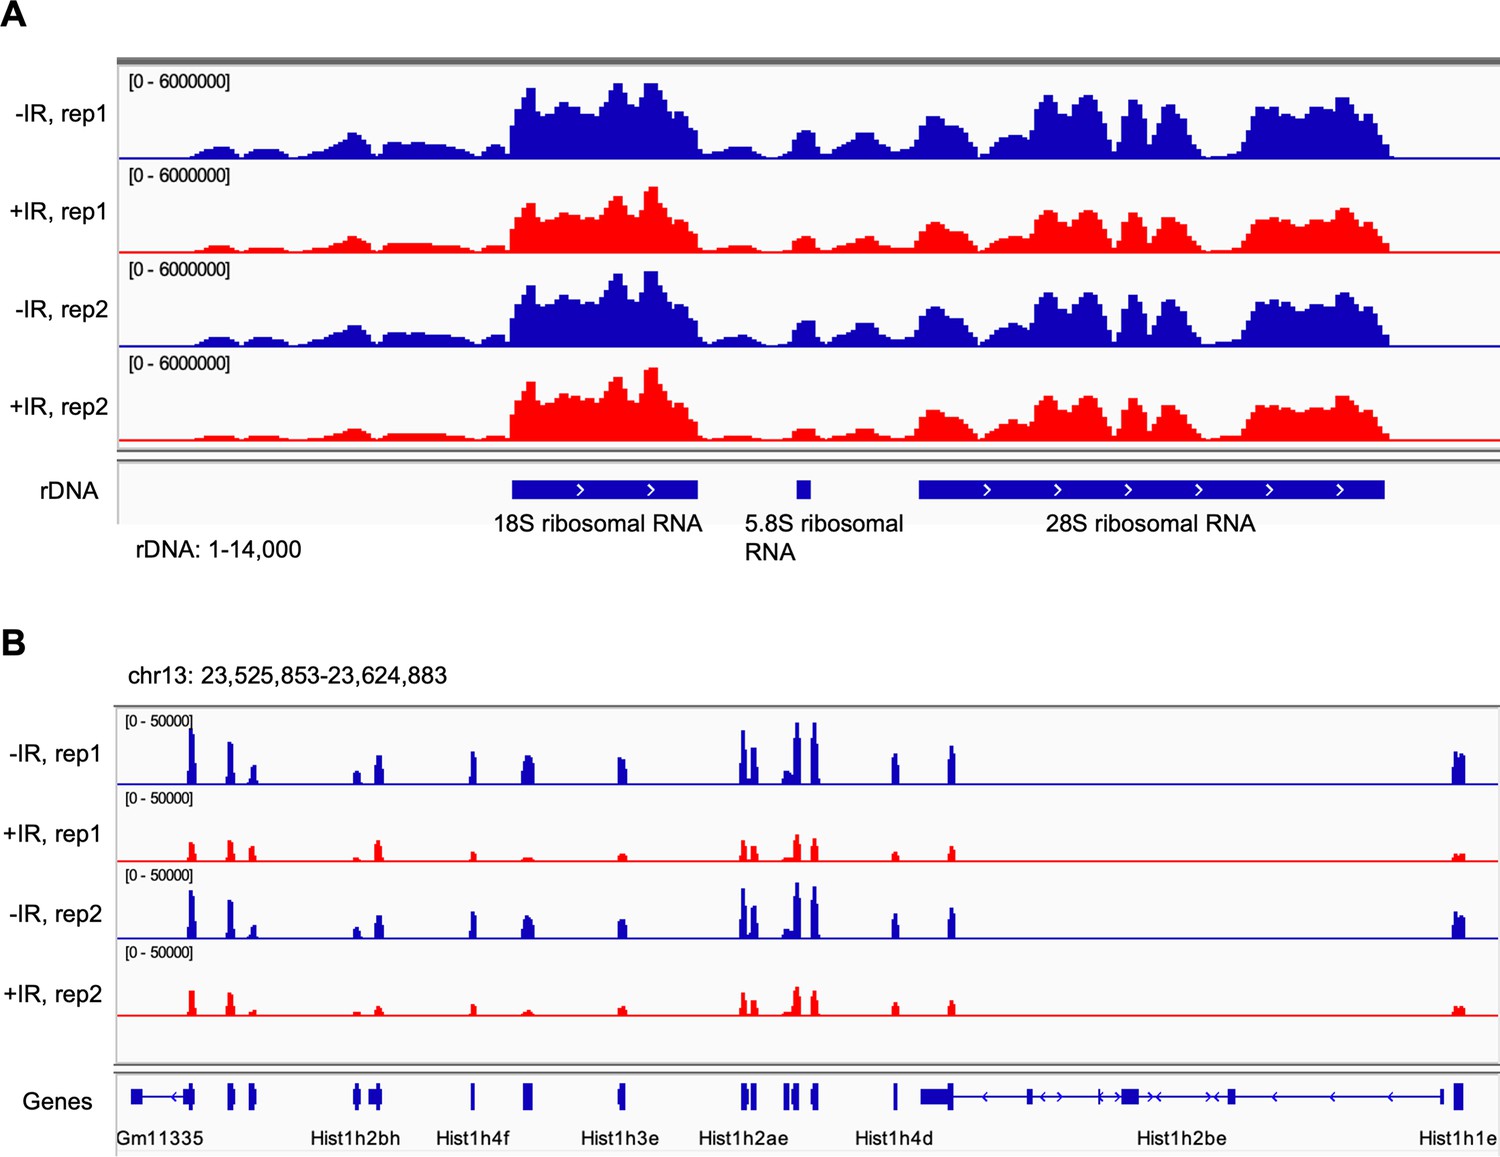
Screen shot from the UCSC browser of nascent transcripts.
(A) Nascent transcripts before and after IR over ribosomal DNA (rDNA). (B) Nascent histone transcripts before and after ionizing radiation (IR) over histone cluster 1.
Figure 3—figure supplement 3
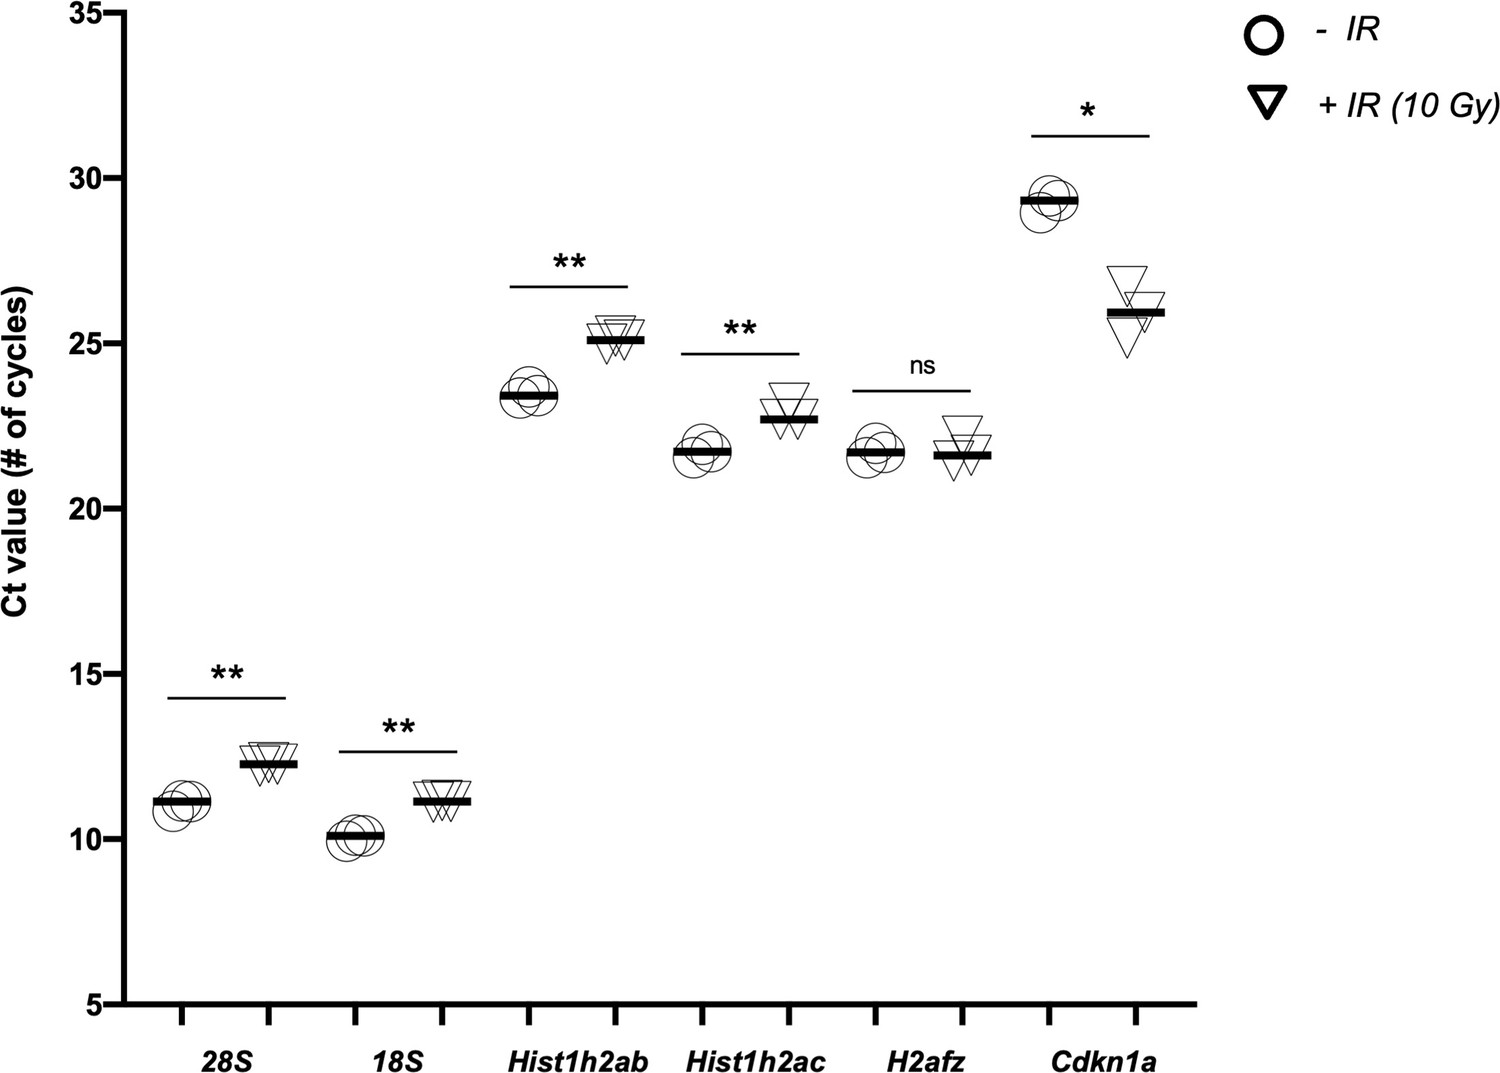
Validation of nascent transcript levels of differentially expressed genes (DEGs) from ethynyl uridine (EU)-RNA seq by real-time quantitative RT-PCR.
Samples from three independent experiments were used for the analyses. Ct value is presented to show the absolute amounts of EU-labeled RNA transcripts from the same number of cells before and after 30 min of ionizing radiation (IR) (10 gray). Significant difference after IR compared to before IR are indicated by asterisks, where ** indicates p<0.01, * indicates p<0.05 and ns indicates non-significant by student’s t-test.
Figure 4
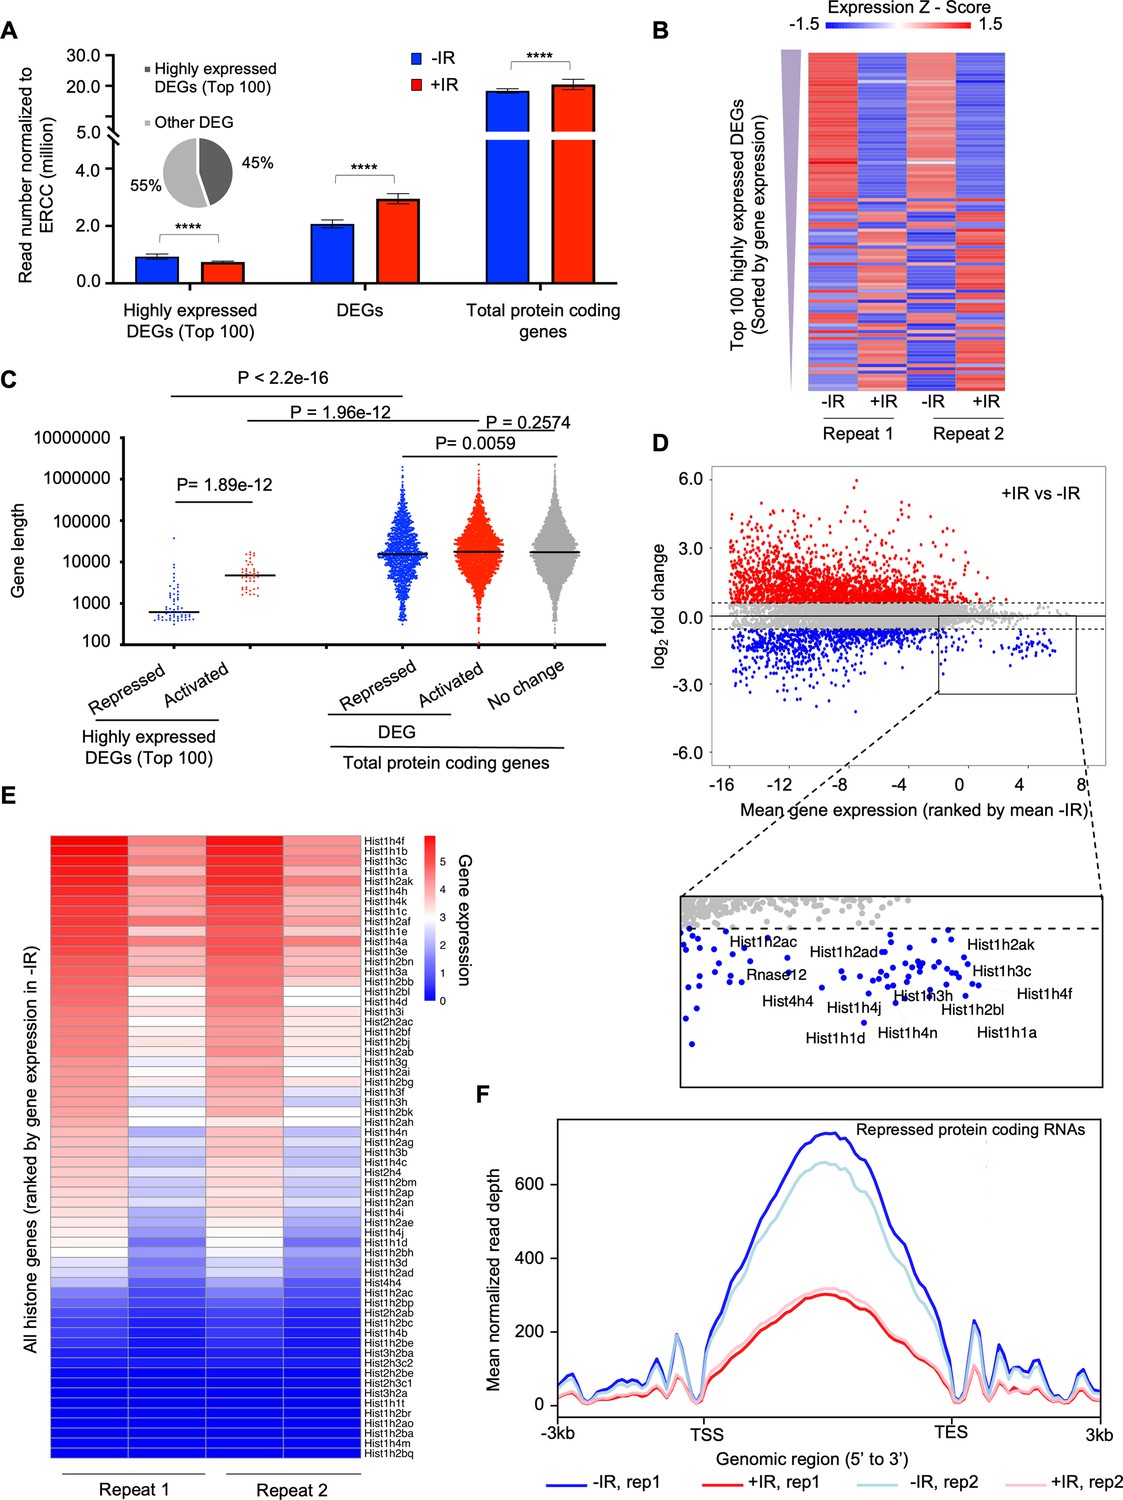
The highly transcribed protein-coding genes tend to be repressed after irradiation, due to a decrease in the transcription of the histone genes.
(A) Plot of the transcript abundance of differentially expressed genes (DEGs) showing that highly expressed genes have reduced nascent transcript levels 30 min after ionizing radiation (IR), while moderately expressed and low-level expressed genes tend to have increased nascent transcript levels 30 min after IR. Mean gene expression and standard deviation are shown in million reads mapped to genes normalized by ERCC spike-in reads. Data are shown from two independent experimental repeats (rep) of the experiment. (B) Heat map showing nascent transcript levels of the top 100 highly expressed DEGs, ranked by gene expression from top (highest) to bottom, 30 min after IR, shown for two independent experimental repeats. Expression z-score was calculated by subtracting the overall average gene abundance from the raw expression for each gene and dividing that result by the standard deviation (SD) of all the measured counts across all four samples. (C) Among the top 100 of highly expressed protein-coding genes, repressed genes are significantly shorter compared to activated genes. The activated, non-changed, and repressed genes show little difference in gene size (the data are averaged for each gene between two independent experimental repeats). (D) Plot of change in gene expression after IR against mean gene expression (log2), ranked by mean gene expression in samples before IR on the x-axis, for all nascent transcripts. Some of the highly expressed genes whose nascent transcript levels decreased after IR are labeled in the rectangle, including histone genes. (E) Heat map of nascent transcripts of all histone genes before (left) and 30 minutes (right) after IR, shown for two independent experimental repeats. (F) The average read counts for repressed protein-coding genes throughout their gene length before and after IR for two independent repeats of the experiment.
Figure 5 with 2 supplements
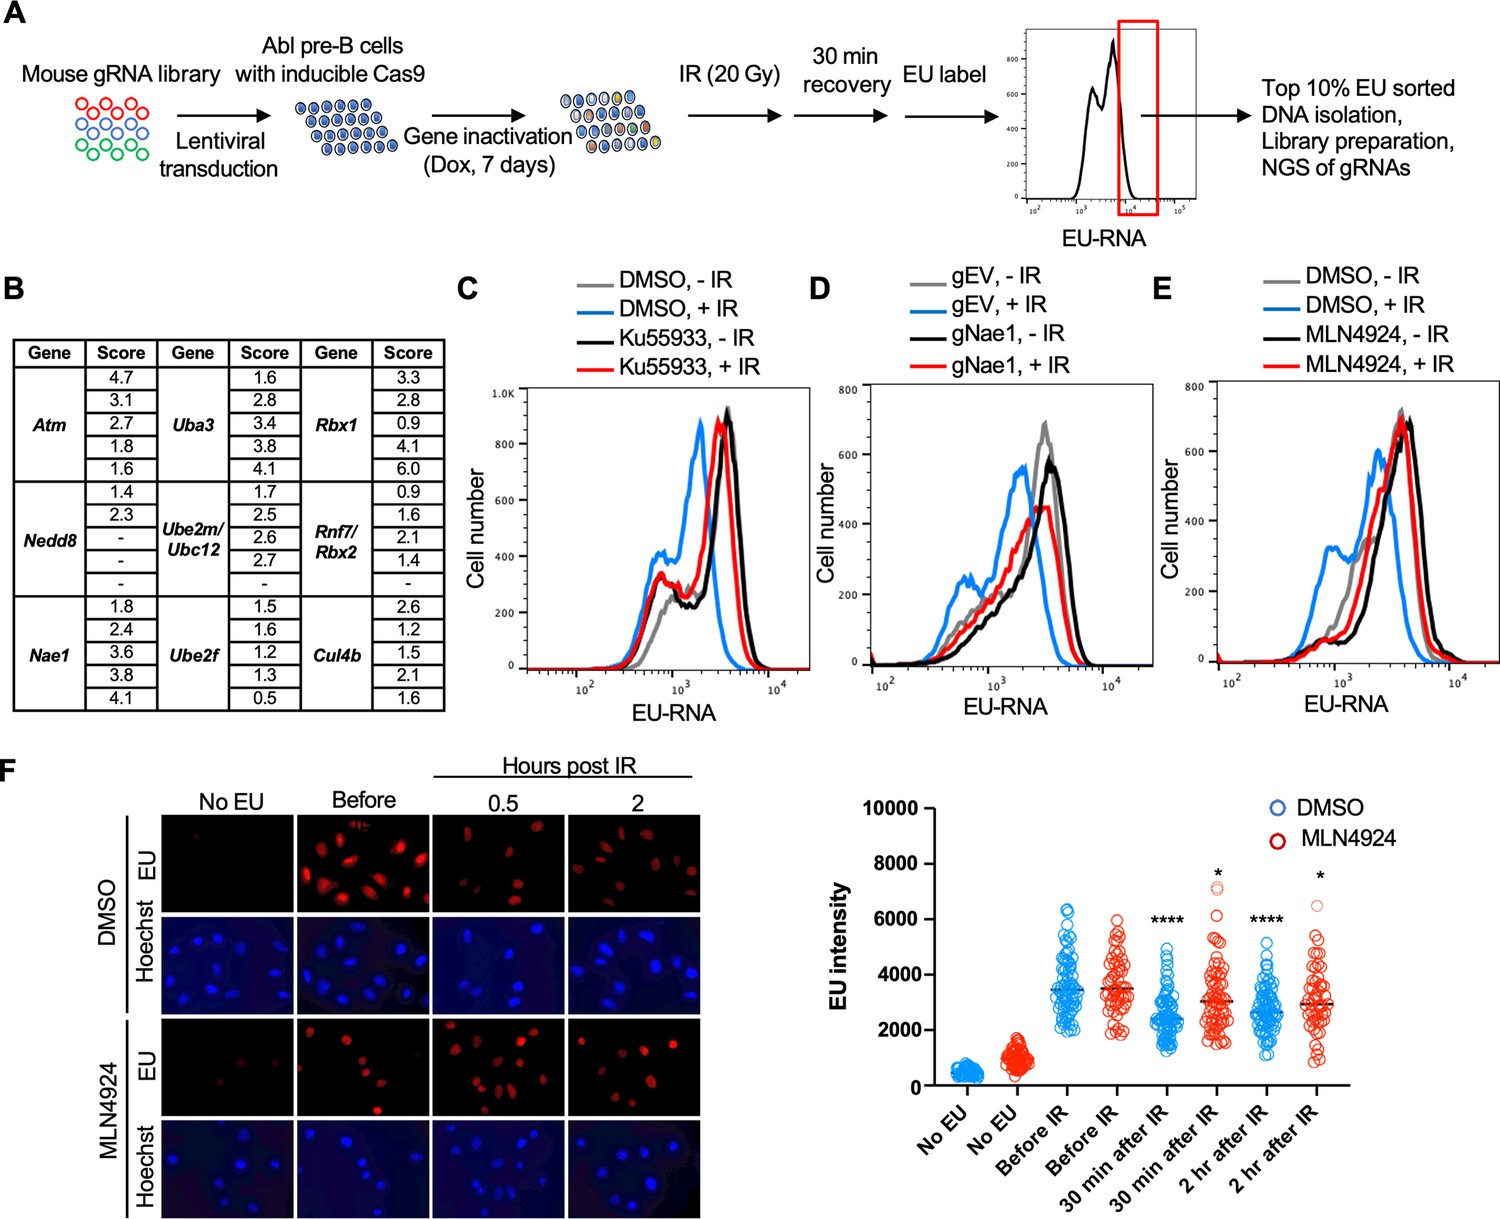
Whole genome gRNA screen CRISPR-Cas9 screen for factors involved in transcriptional inhibition after irradiation identifies the neddylation pathway.
(A) Schematic of whole genome gRNA CRISPR-Cas9 screen for gene products that promote transcriptional inhibition after IR. (B) Fold enrichment of five guide RNAs against the indicated genes in the 10% of cells with most ethynyl uridine (EU) incorporated into transcripts 30 min after ionizing radiation (IR). (C). Inhibition of ataxia telangiectasia mutated (ATM) greatly reduces transcriptional inhibition 30 min after IR in Abl pre-B cells. The inhibitor was used at 15 µM for 1 hr. (D) gRNA-mediated depletion of Nae1 greatly reduces transcriptional inhibition 30 min after IR in Abl pre-B cells. (E) Inhibition of neddylation greatly reduces transcriptional inhibition 30 min after IR. The inhibitor was used at 1 µM for 16 hr in Abl pre-B cells. (F) Inhibition of neddylation reduces transcriptional inhibition after IR in U2OS cells, as detected by fluorescence analysis of nascent transcripts as described in legend to Figure 1 and quantitated as in Figure 1. Significant differences after IR compared to before IR are indicated by asterisks, where ****p<0.001, *p<0.05 by student’s t-test. All experiments in this figure are in murine Abl pre-B cells.
Figure 5—figure supplement 1
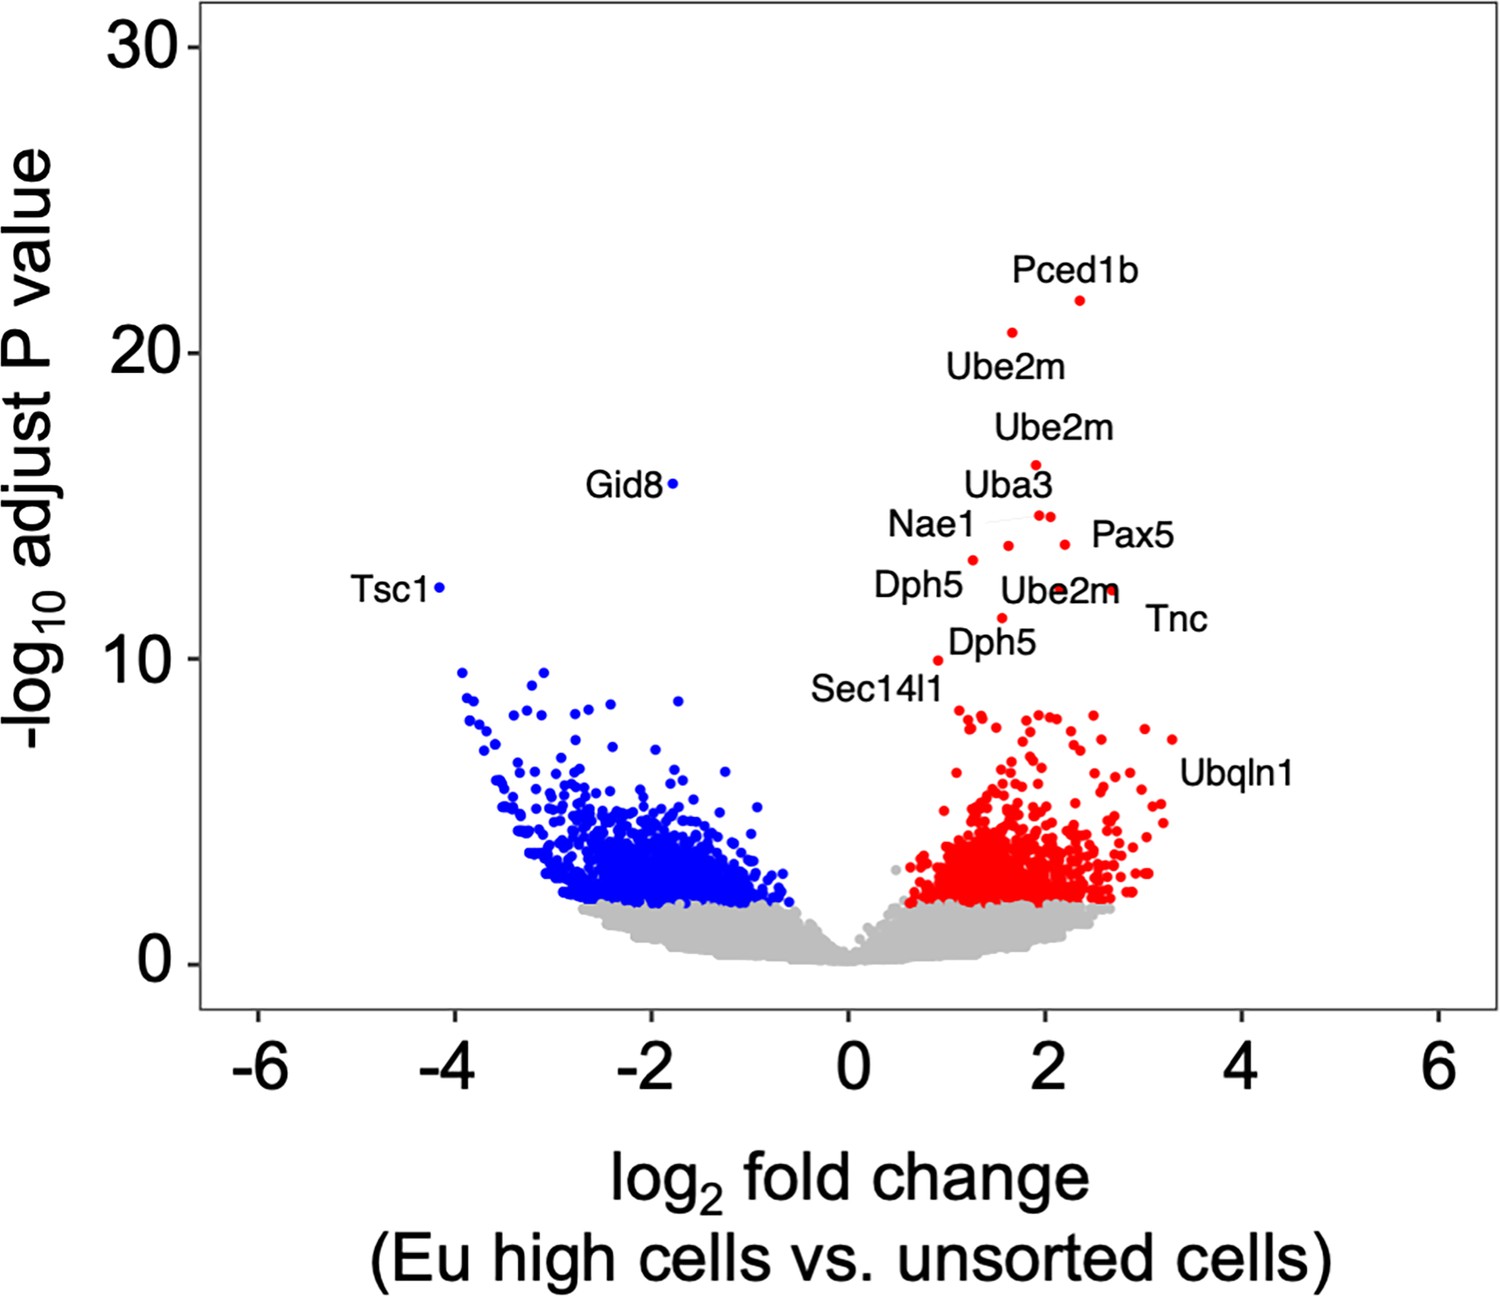
CRISPR-Cas9 screen identifies genes promoting transcriptional inhibition after ionizing radiation (IR).
A volcano plot of guide RNA changes between ethynyl uridine (EU) high cells and unsorted cells. Labeled genes are some of those that have p adjust ≤ 10–6.
Figure 5—figure supplement 2
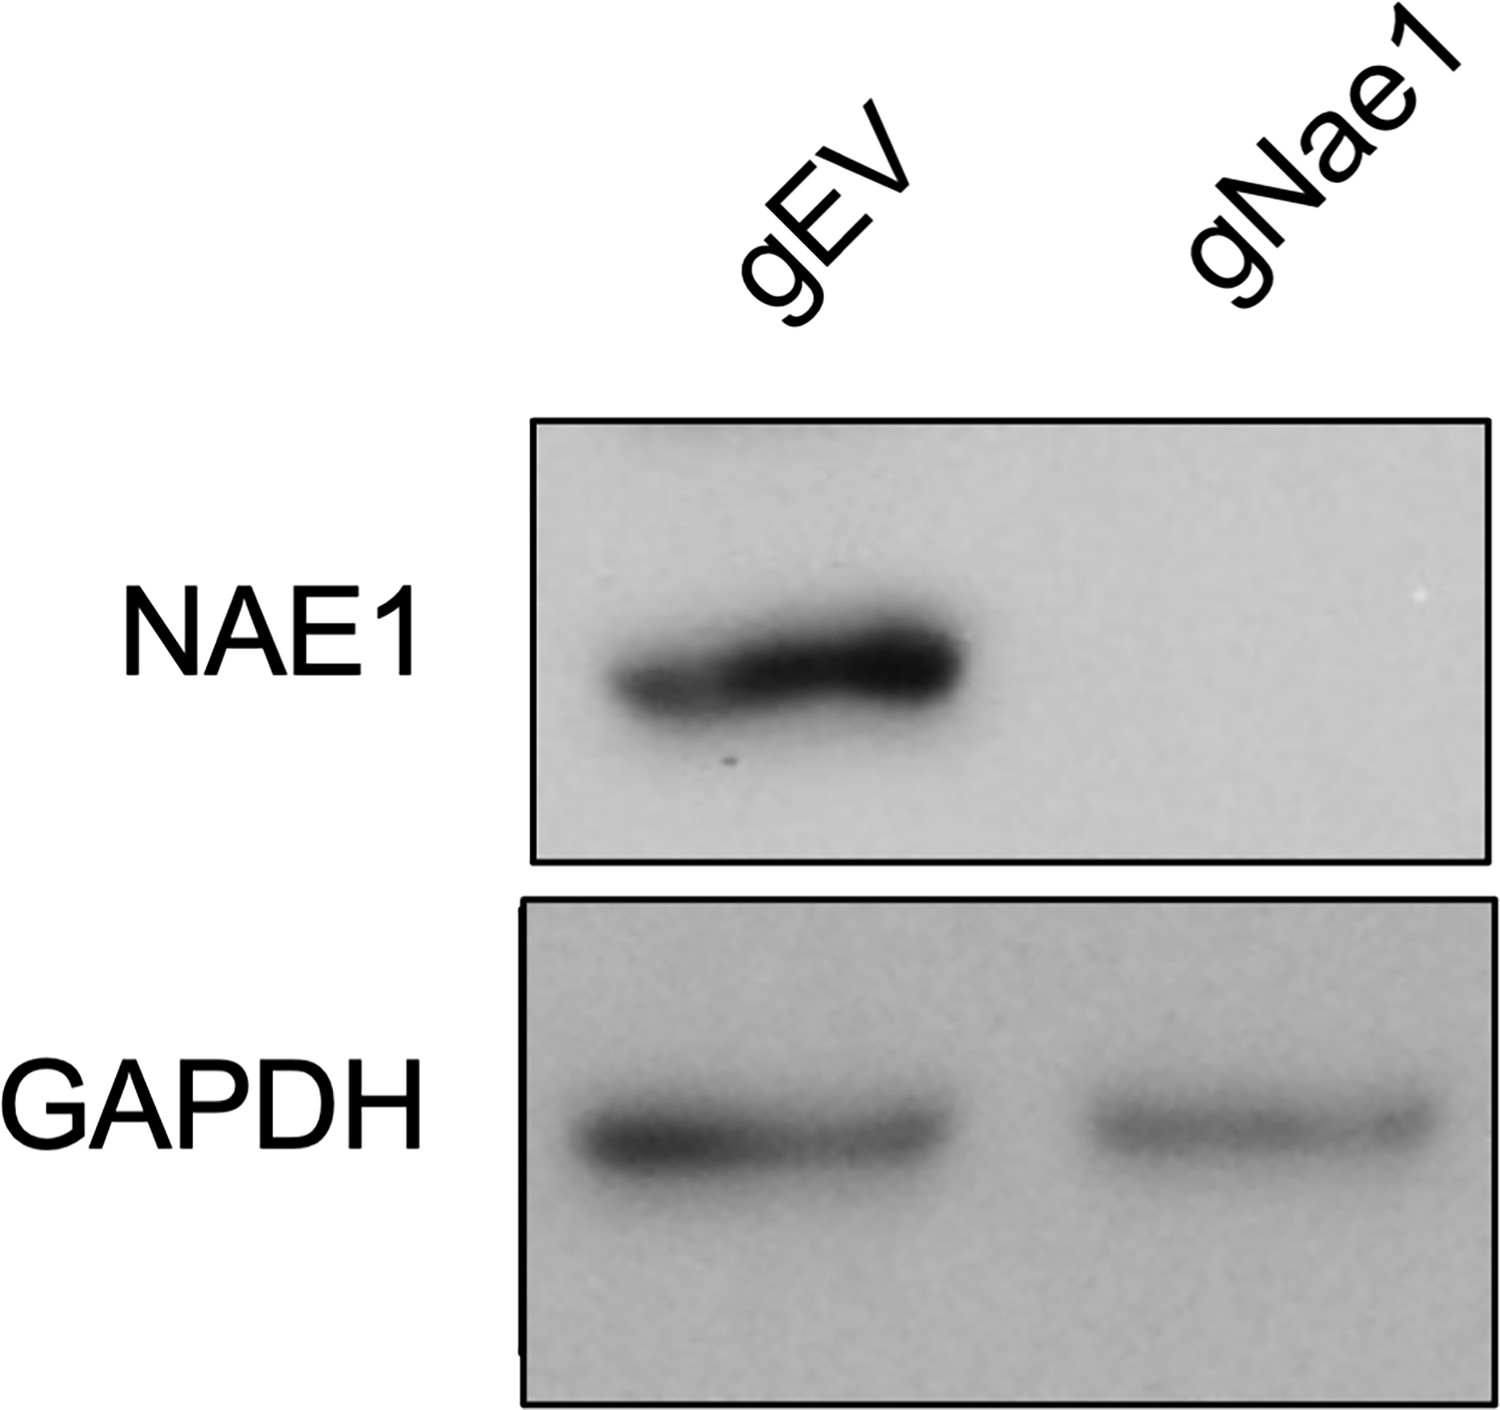
Confirmation of knockdown of Nae1.
gEV is an empty vector. The samples were from the same experiments shown in Figure 5D.
-
Figure 5—figure supplement 2—source data 1
Original file for the Western blot analysis in Figure 5D (anti-Nae1 and anti-GAPDH).
- https://cdn.elifesciences.org/articles/94001/elife-94001-fig5-figsupp2-data1-v1.zip
-
Figure 5—figure supplement 2—source data 2
PDF of Western blot analysis in Figure 5D and original scans of the relevant Western blot analysis (anti-Nae1 and anti-GAPDH) with highlighted bands and sample labels.
- https://cdn.elifesciences.org/articles/94001/elife-94001-fig5-figsupp2-data2-v1.pdf
Figure 6 with 2 supplements
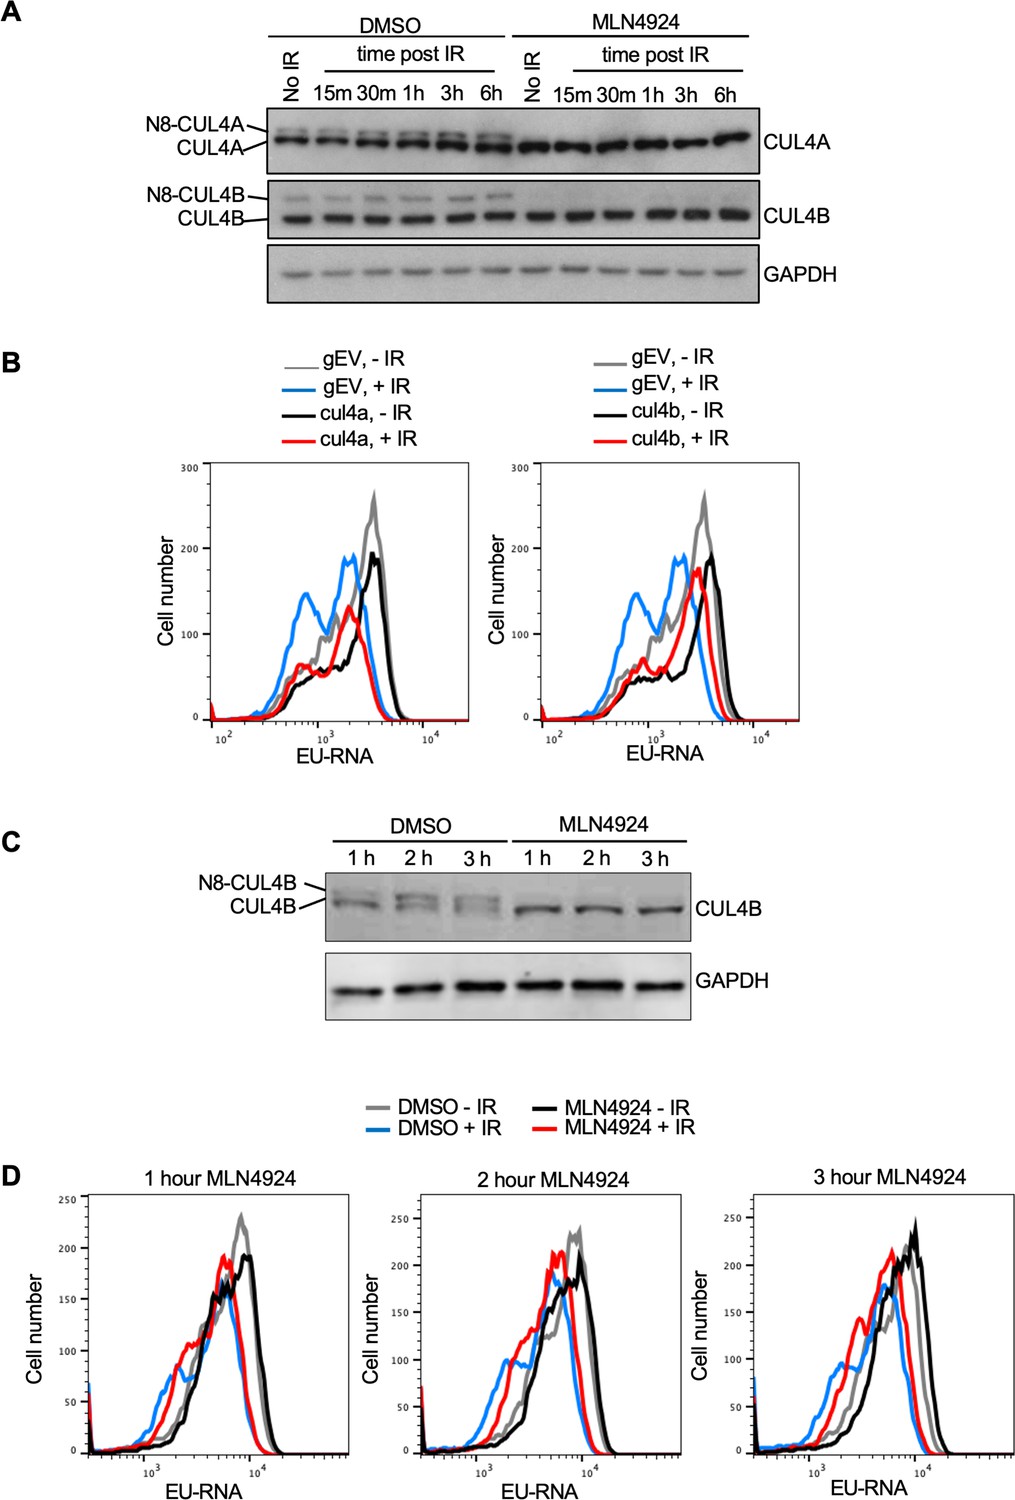
CUL4B but not CUL4A contributes to transcriptional inhibition after irradiation.
(A) Analysis of CUL4A and CUL4B neddylation in U2OS cells after ionizing radiation (IR), in the absence of presence of 10 µM treatment for 3 hr with the neddylation inhibitor. N8 indicates the neddylated species. (B) Analysis of nascent transcripts in Abl pre-B cell lines stably depleted of CUL4A or CUL4B 30 min after IR, as indicated. (C) Short treatment of Abl pre-B cells with neddylation inhibitor MLN4924 is sufficient to block neddylation of CUL4B. (D) The same cells used in C were analyzed for ethynyl uridine (EU) incorporation into nascent transcripts 30 min after irradiation, without or with the indicated time of MLN4924 treatment before irradiation.
-
Figure 6—source data 1
Original file for the Western blot analysis in Figure 6A (anti-CUL4A, anti-CUL4B, and anti-GAPDH).
- https://cdn.elifesciences.org/articles/94001/elife-94001-fig6-data1-v1.zip
-
Figure 6—source data 2
PDF containing Figure 6A and original scans of the relevant Western blot analysis (anti-CUL4A, anti-CUL4B, and anti-GAPDH) with highlighted bands and sample labels.
- https://cdn.elifesciences.org/articles/94001/elife-94001-fig6-data2-v1.pdf
-
Figure 6—source data 3
Original file for the Western blot analysis in Figure 6C (anti-CUL4B and anti-GAPDH).
- https://cdn.elifesciences.org/articles/94001/elife-94001-fig6-data3-v1.zip
-
Figure 6—source data 4
PDF containing Figure 6C and original scans of the relevant Western blot analysis (anti-CUL4B and anti-GAPDH) with highlighted bands and sample labels.
- https://cdn.elifesciences.org/articles/94001/elife-94001-fig6-data4-v1.pdf
Figure 6—figure supplement 1
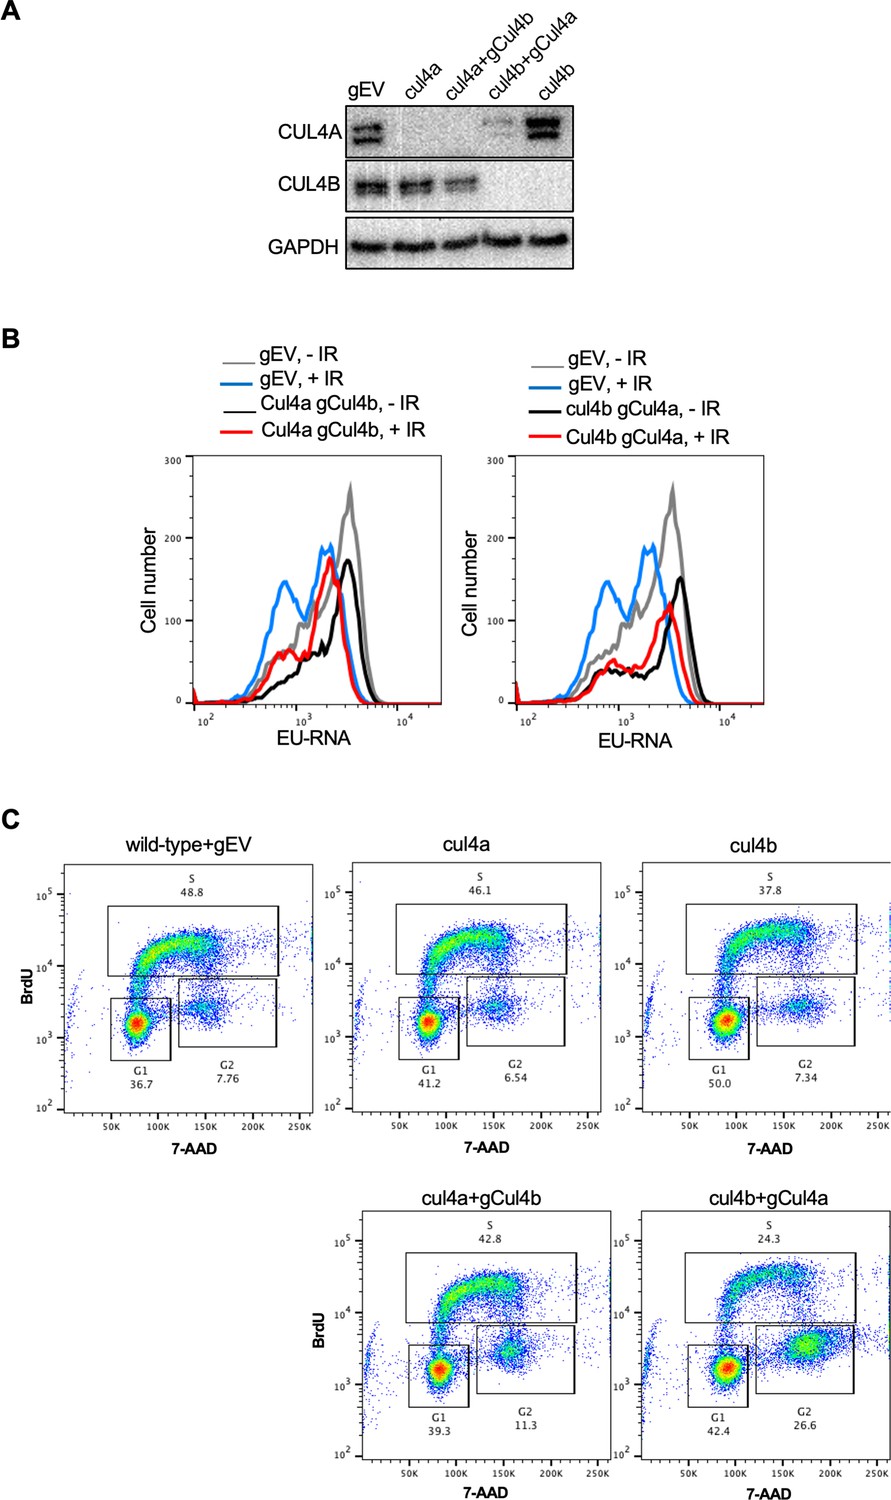
Analysis of CUL4A and CUL4B depletion.
(A) The western blot shows the CUL4A and CUL4B levels from the experiment shown in Figure 6B. Additionally gRNAs were used to deplete CUL4A in cul4b cells and CUL4B in CUL4A cells and their western blot analyses are also shown. (B) The ethynyl uridine (EU) analysis of these double-depleted cells is shown. (C) Cell cycle analysis of the experiment shown in A and B and Figure 6B.
-
Figure 6—figure supplement 1—source data 1
Original file for the Western blot analysis is in Figure 6—figure supplement 1A (anti-CUL4A, anti-CUL4B, and anti-GAPDH).
- https://cdn.elifesciences.org/articles/94001/elife-94001-fig6-figsupp1-data1-v1.zip
-
Figure 6—figure supplement 1—source data 2
PDF containing Figure 6—figure supplement 1A and original scans of the relevant Western blot analysis (anti-CUL4A, anti-CUL4B, and anti-GAPDH) with highlighted bands and sample labels.
- https://cdn.elifesciences.org/articles/94001/elife-94001-fig6-figsupp1-data2-v1.pdf
Figure 6—figure supplement 2
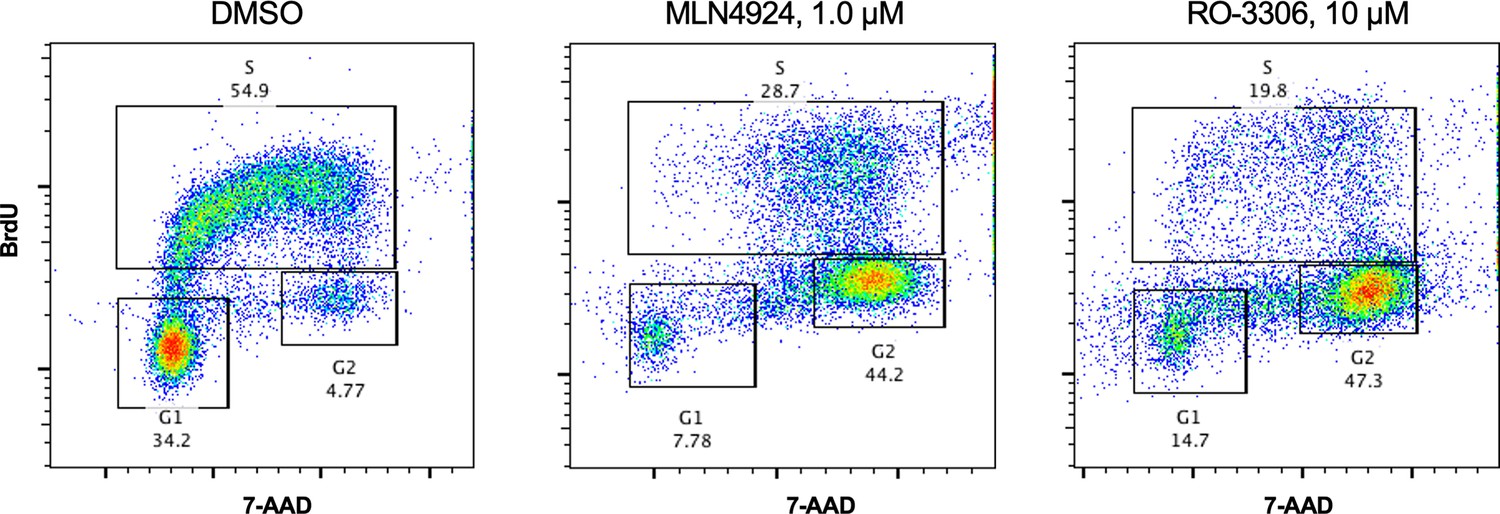
Cell cycle analysis of cells treated with MLN4924 and RO3306.
MLN4924 or RO3306 treatment leads cell cycle arrest in G2 phase.
Figure 7 with 1 supplement
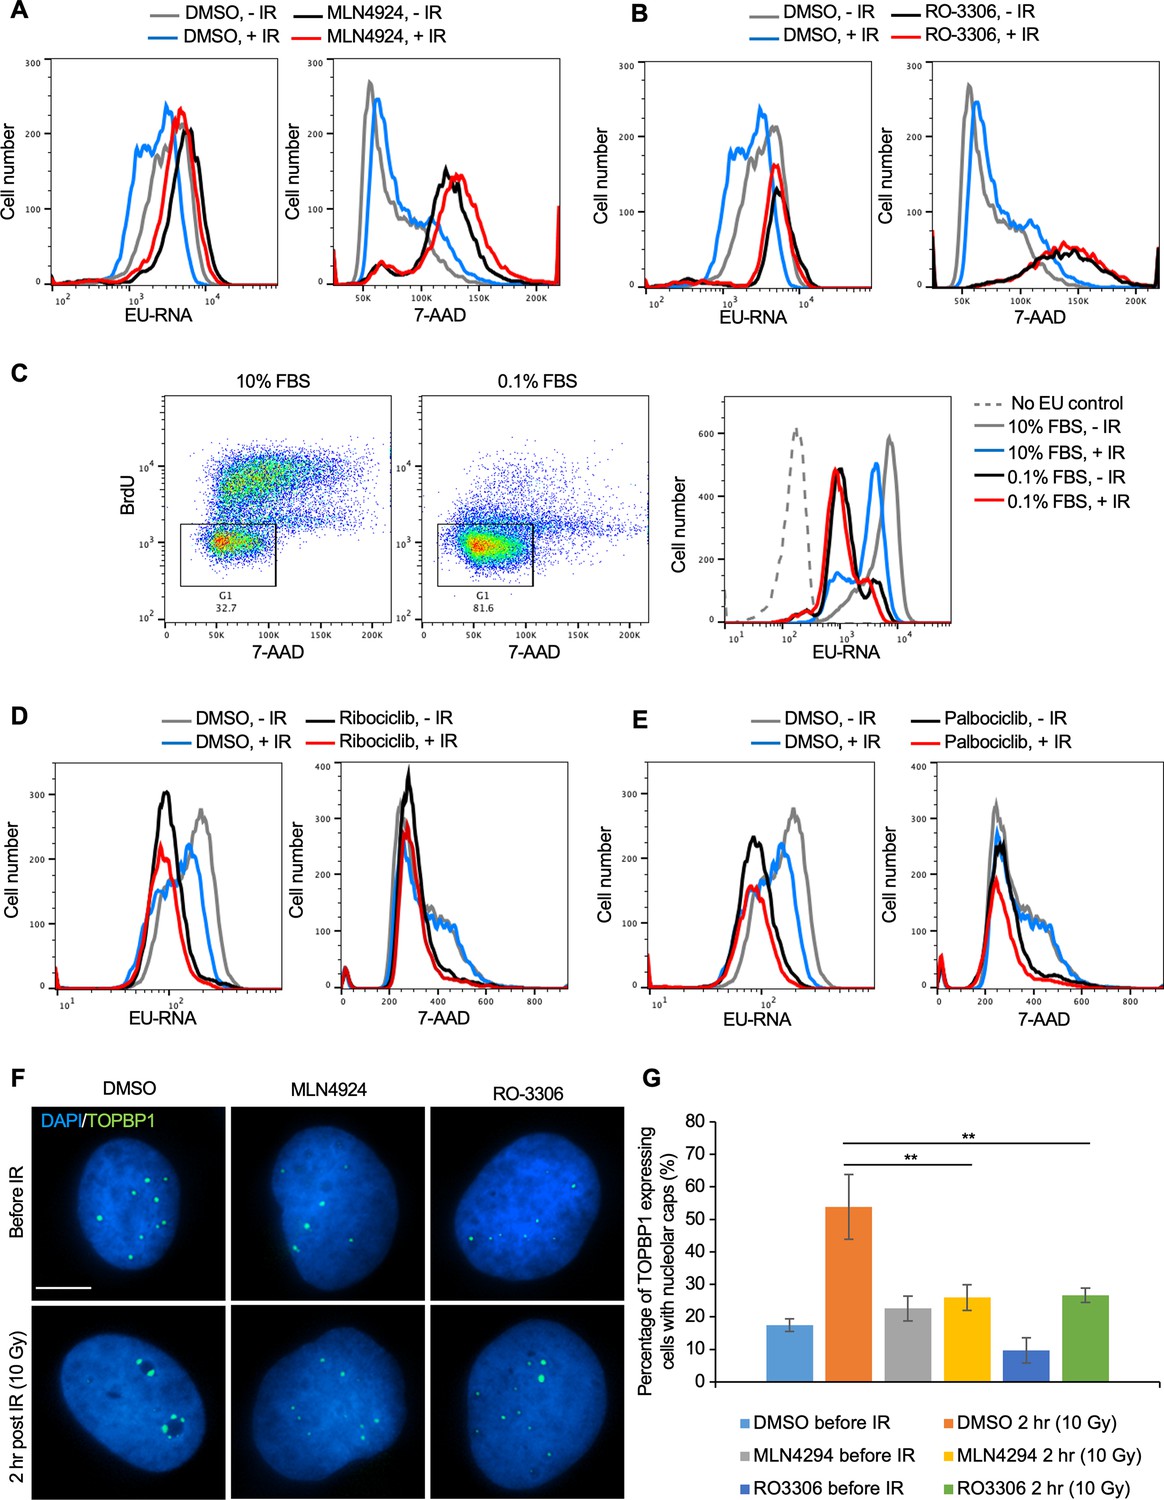
Cell cycle arrest in G1 or G2 prevents transcriptional inhibition after DNA damage.
(A) Abl pre-B cells were treated with MLN4924 (1 μM) for 16 hr, followed by ionizing radiation (IR) and staining of DNA with 7-Aminoactinomycin D (7-AAD) and nascent transcripts with ethynyl uridine (EU) 30 min after IR. (B) Abl pre-B cells were treated with RO-3306 (10 μM) for 16 hr, followed by IR and staining of DNA with 7-AAD and nascent transcripts with EU 30 min after IR. (C) The left two panels show the cell cycle distribution of Abl pre-B cells after growth for 72 hr in 1% FBS or 0.1% FBS. The rectangles and numbers indicate the % of cells with a 2 N DNA content. The right panel shows the EU incorporated into nascent transcripts 30 min after IR for the same samples. (D) Abl pre-B cells were treated with Ribociclib (5 μM) for 24 hr followed by IR and staining of DNA with 7-AAD and nascent transcripts with EU 30 min after IR. (E) Abl pre-B cells were treated with Palbociclib (5 μM) for 24 hr, followed by IR and staining of DNA with 7-AAD and nascent transcripts with EU 30 min after IR. (F) The U2OS cells were treated with doxycycline (1 μg/mL) for 12 hr to express eGFP-TOPBP1. Then, DMSO, MLN4924, and RO3306 were added to the cells for another 16 hr. TOPBP1 localization was shown in cells before IR or 2 hr after IR (10 Gy). Scale bar is 10 μm. (G) Quantification of TOPBP1 expressing cells with nucleolar caps before and after IR (10 Gy) in cells treated with MLN4924 and RO-3306. Data shown are an average of the three independent experimental repeats. Significant differences are indicated by asterisks, where **p<0.01 by student’s Tt-test.
Figure 7—figure supplement 1
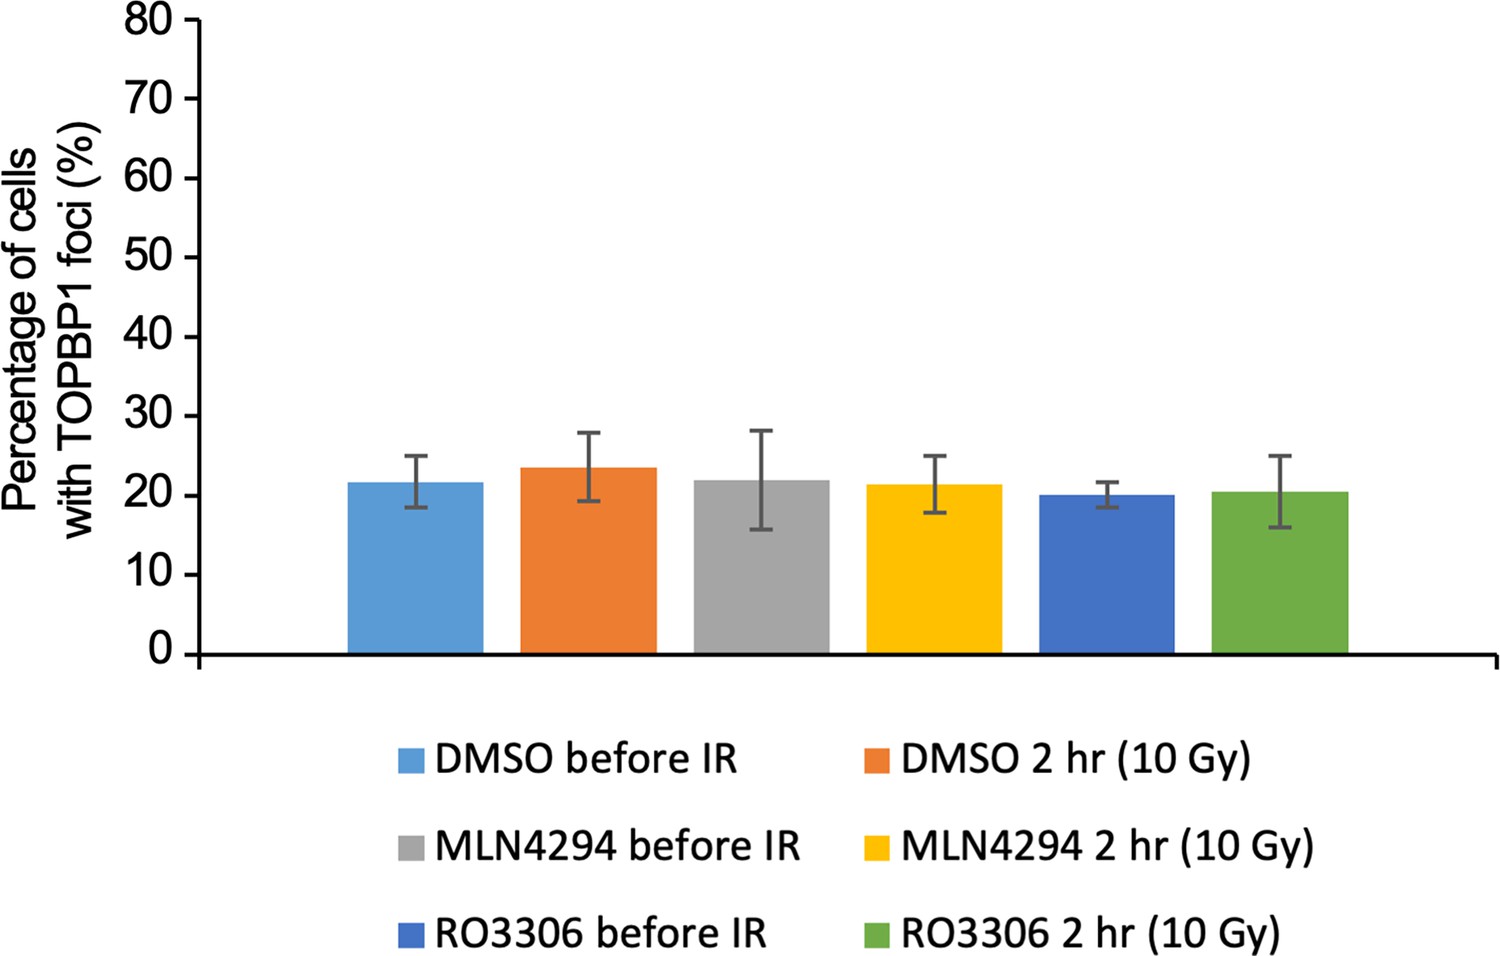
Quantification of cells with TOPBP1 expression before and after ionizing radiation (IR) (10 Gy) in cells treated with MLN4924 and RO-3306.
The samples were from the same experiments shown in Figure 7F and G.
Additional files
-
Supplementary file 1
Nascent RNA profiles of each gene using ethynyl uridine (EU) RNA-seq.
- https://cdn.elifesciences.org/articles/94001/elife-94001-supp1-v1.xlsx
-
Supplementary file 2
Significantly enriched Gene ontology (GO) terms for up-regulated gene after irradiation.
- https://cdn.elifesciences.org/articles/94001/elife-94001-supp2-v1.xlsx
-
Supplementary file 3
Significantly enriched Gene ontology (GO) terms for down-regulated genes after irradiation.
- https://cdn.elifesciences.org/articles/94001/elife-94001-supp3-v1.xlsx
-
Supplementary file 4
Whole genome CRISPR-Cas9 screen detects the abundance of all gRNAs and target genes for ethynyl uridine (EU) high cells and unsorted cells.
- https://cdn.elifesciences.org/articles/94001/elife-94001-supp4-v1.xlsx
-
MDAR checklist
- https://cdn.elifesciences.org/articles/94001/elife-94001-mdarchecklist1-v1.pdf
Download links
A two-part list of links to download the article, or parts of the article, in various formats.
Downloads (link to download the article as PDF)
Open citations (links to open the citations from this article in various online reference manager services)
Cite this article (links to download the citations from this article in formats compatible with various reference manager tools)
Transcriptional inhibition after irradiation occurs preferentially at highly expressed genes in a manner dependent on cell cycle progression
eLife 13:RP94001.
https://doi.org/10.7554/eLife.94001.3


