Leveraging mobility data to analyze persistent SARS-CoV-2 mutations and inform targeted genomic surveillance
- Institute for Infectious Diseases and Infection Control, Jena University Hospital, Germany
- Center for Sepsis Control and Care, Jena University Hospital/Friedrich Schiller University Jena, Germany
- SMA Development GmbH - epicinsights Agentur für Künstliche Intelligenz und Big Data Analytics, Germany
- Department of Anaesthesiology and Intensive Care, Jena University Hospital, Germany
- Thuringian State Authority for Consumer Protection, Department Health Protection, Germany
- Methodology and Research Infrastructure, Genome Competence Center (MF1), Robert Koch Institute, Germany
- Centre for Artificial Intelligence in Public Health Research, Robert Koch Institute, Germany
- Transmission, Infection, Diversification and Evolution Group, Max Planck Institute for Geoanthropology, Germany
- Center for Applied Research, InfectoGnostics Research Campus Jena, Germany
Figures
Figure 1 with 3 supplements
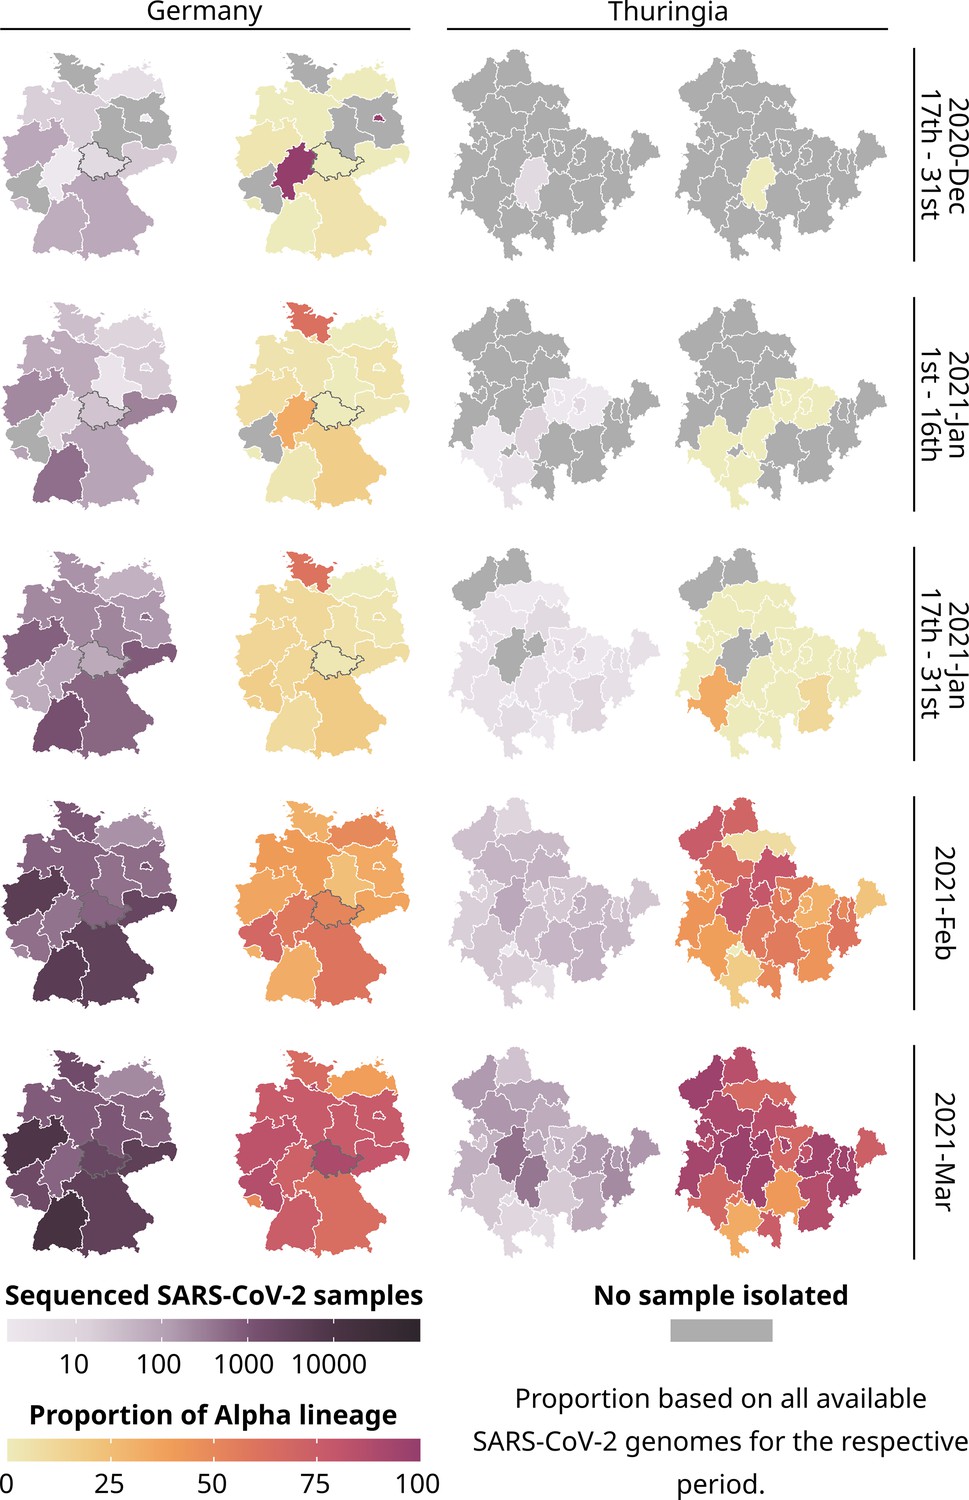
Total number of all sequenced SARS-CoV-2 samples (purple) and the proportion of the Alpha lineage for all sequenced samples (yellow-red) for each state of Germany and each district of Thuringia.
289,487 publicly available German SARS-CoV-2 genomes and their metadata were used for the general German maps, excluding data from Thuringia. For Thuringia, we always used 7394 genomes and their metadata from our database for the German and Thuringian maps. Please note that for all states except Thuringia, we used the postal code of the sending laboratory as a proxy for the geographical location of a sample. A gray border on the maps of Germany highlights Thuringia.
-
Figure 1—source code 1
R-script to generate Figure 1, Figure 1—figure supplement 1.
- https://cdn.elifesciences.org/articles/94045/elife-94045-fig1-code1-v1.zip
-
Figure 1—source data 1
Total number of reported SARS-CoV-2 samples and number of reported Alpha lineage samples for each German federal state per month.
The respective proportions of Alpha and non-Alpha samples are calculated.
- https://cdn.elifesciences.org/articles/94045/elife-94045-fig1-data1-v1.xlsx
-
Figure 1—source data 2
Total number of reported SARS-CoV-2 samples and number of reported Alpha lineage samples for each Thuringian district per month.
The respective proportions of Alpha and non-Alpha samples are calculated.
- https://cdn.elifesciences.org/articles/94045/elife-94045-fig1-data2-v1.xlsx
Figure 1—figure supplement 1
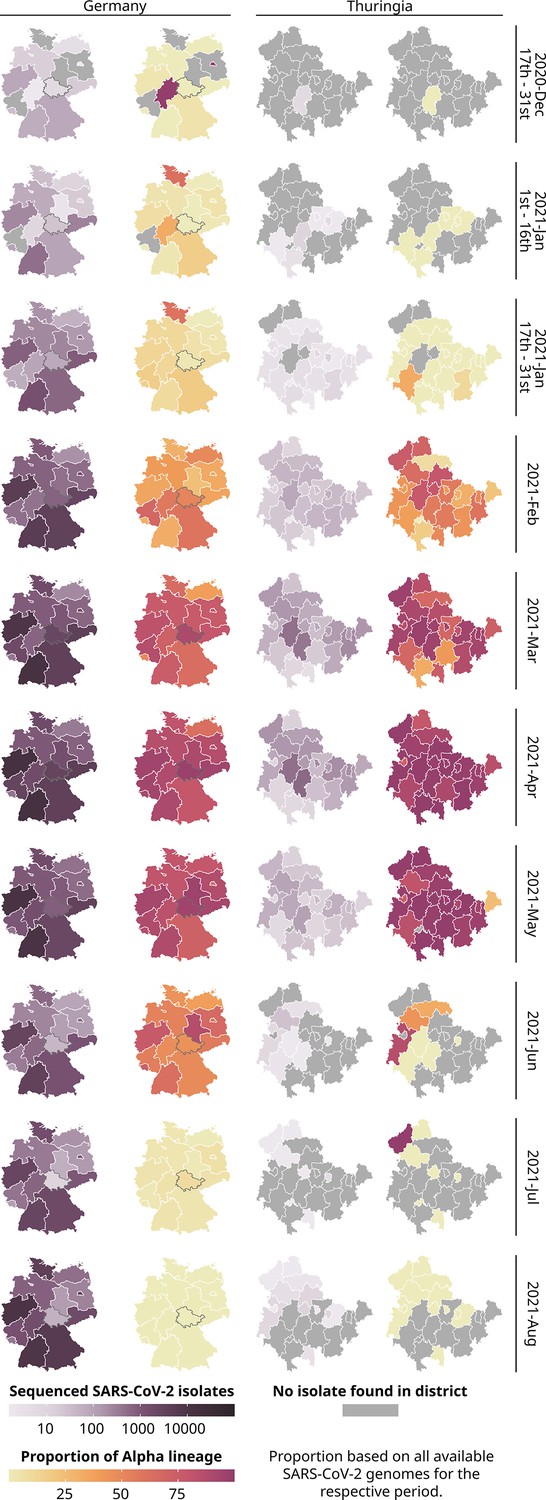
Total number of all sequenced SARS-CoV-2 samples (purple) and the proportion of the Alpha lineage for all sequenced samples (yellow-red) for each state of Germany and each district of Thuringia throughout the whole observation period.
289,487 publicly available German SARS-CoV-2 genomes and their metadata were used for the general German maps excluding data from Thuringia. For Thuringia, we always used 7394 genomes and their metadata from our database for both the German and the Thuringian maps. Please note that for all states except Thuringia, we used the postal code of the sending laboratory as a proxy for the geographical location of a sample. Thuringia is highlighted by a gray border on the maps of Germany.
Figure 1—figure supplement 2
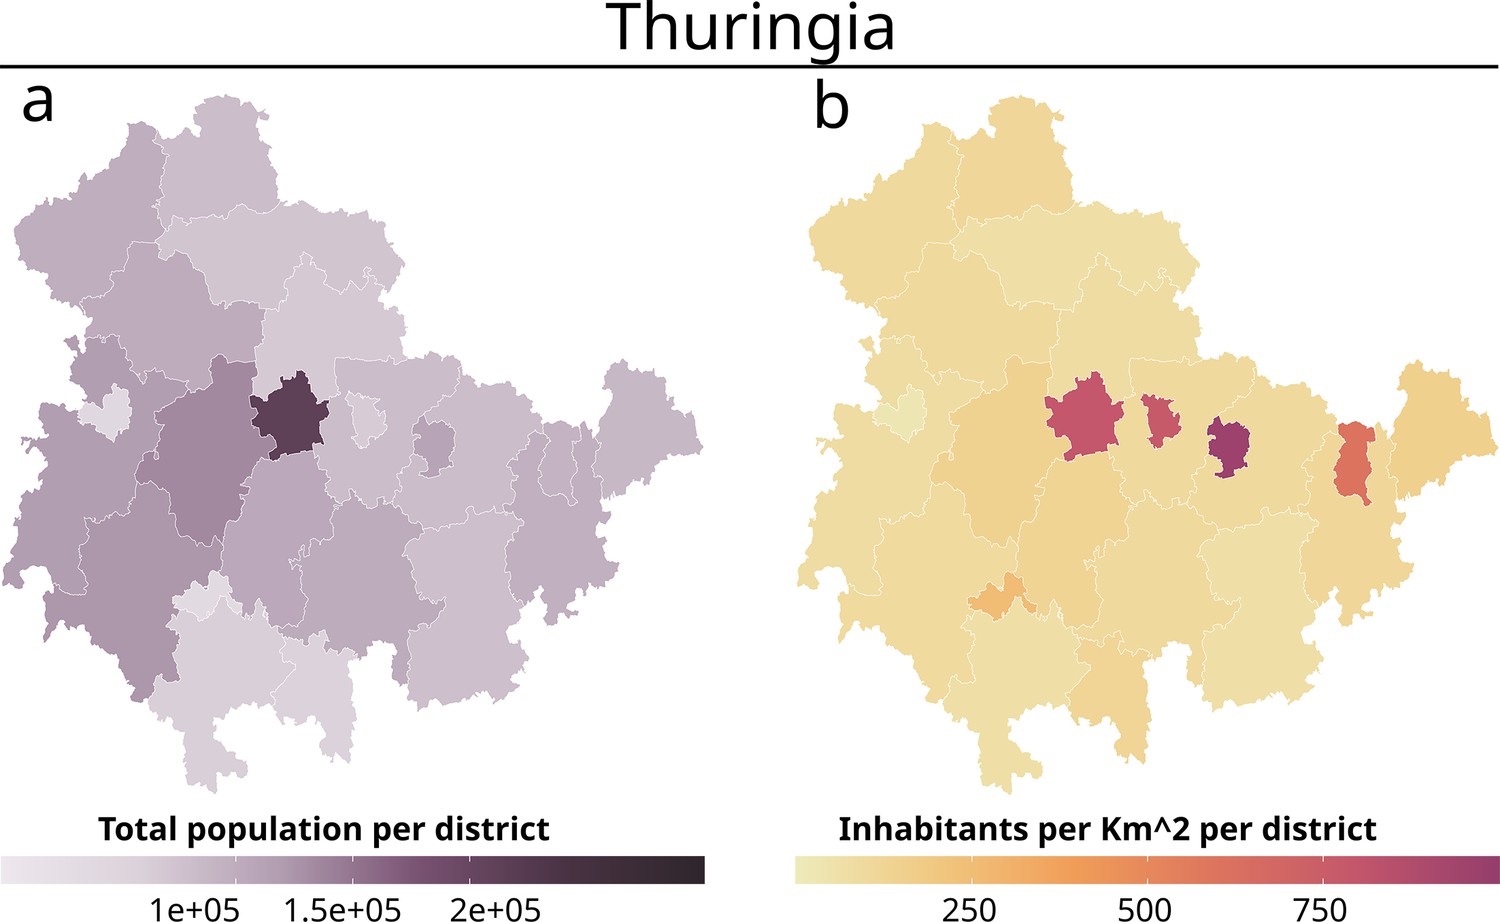
Total population (a) and population density per km2 (b) for each Thuringian district as stated for the December 31, 2020.
Figure 1—figure supplement 3
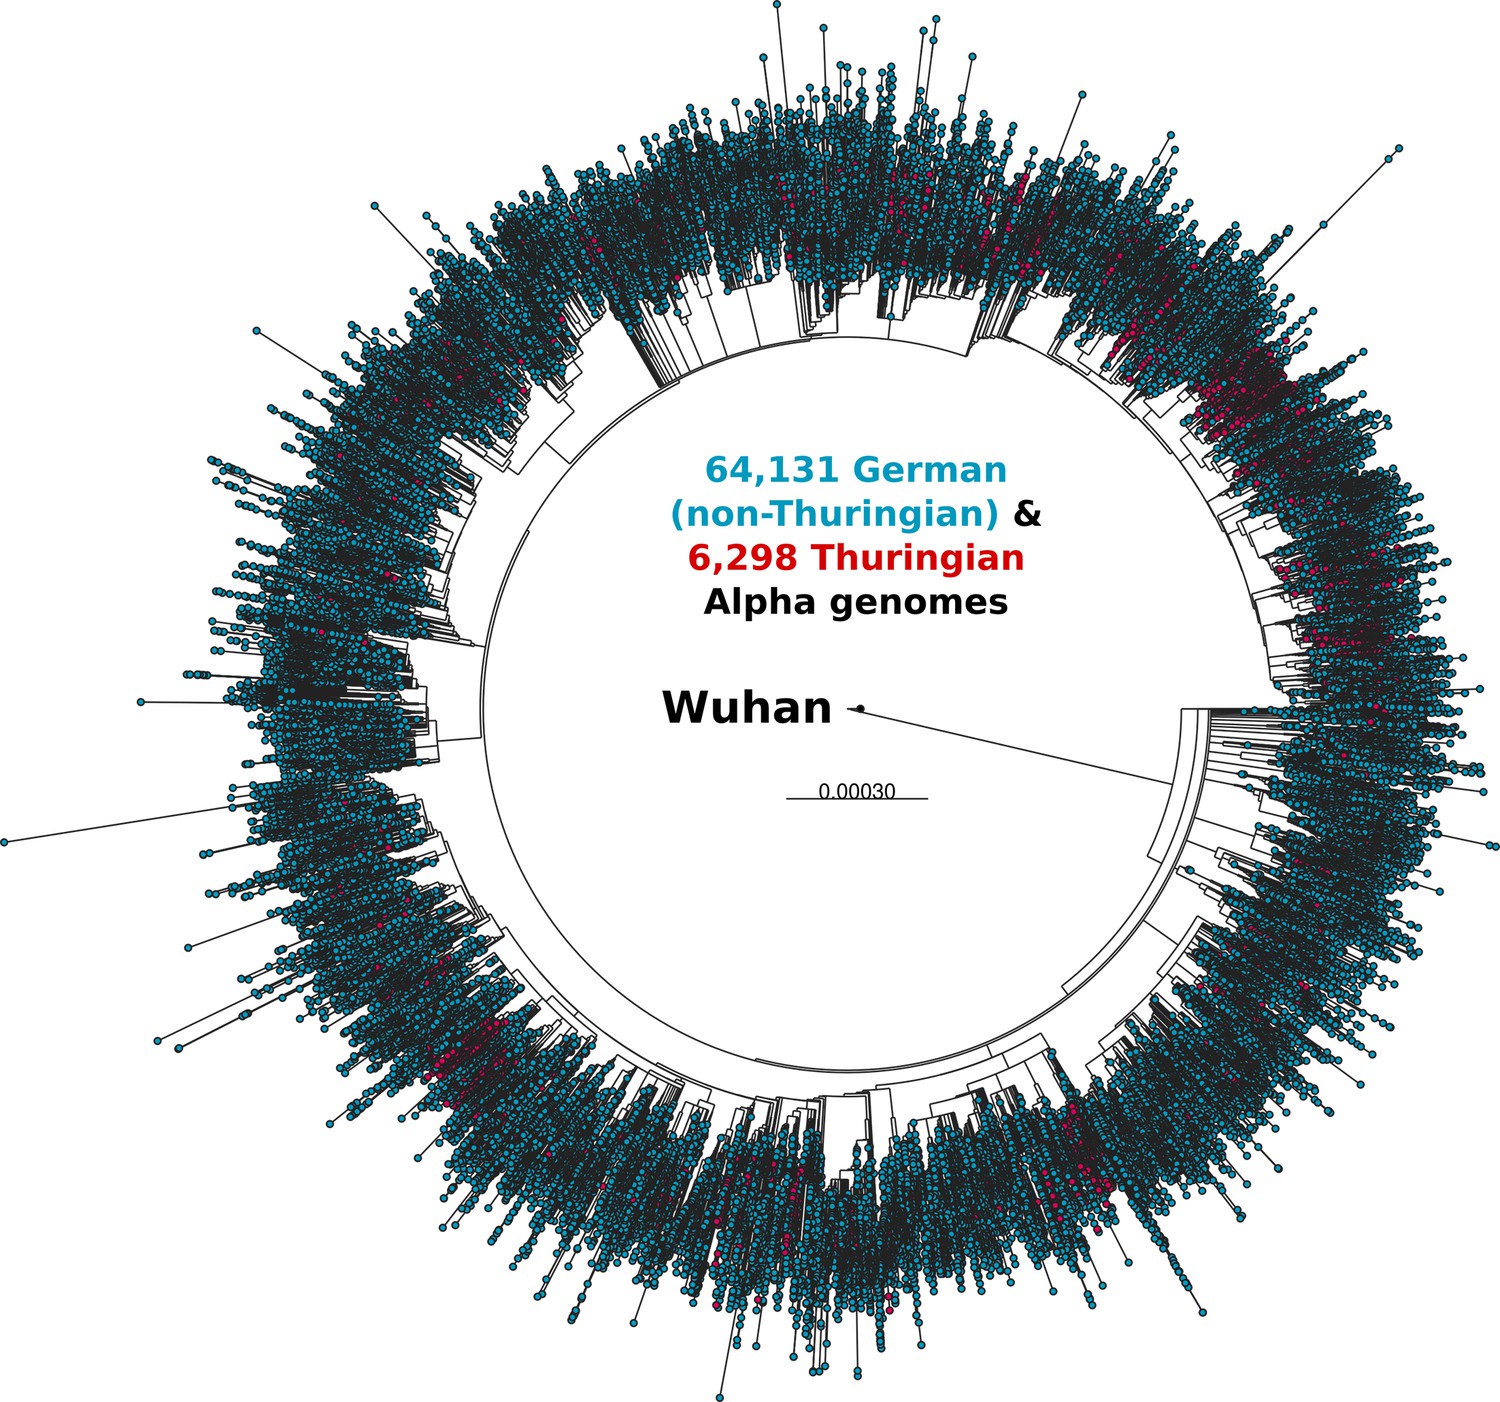
Phylogenetic time tree of the Alpha lineage.
The tree includes 64,131 German (non-Thuringian; blue) and 6298 Thuringian (red) Alpha genomes. Two genomes of the original Wuhan lineage are included as origin.
Figure 2 with 2 supplements
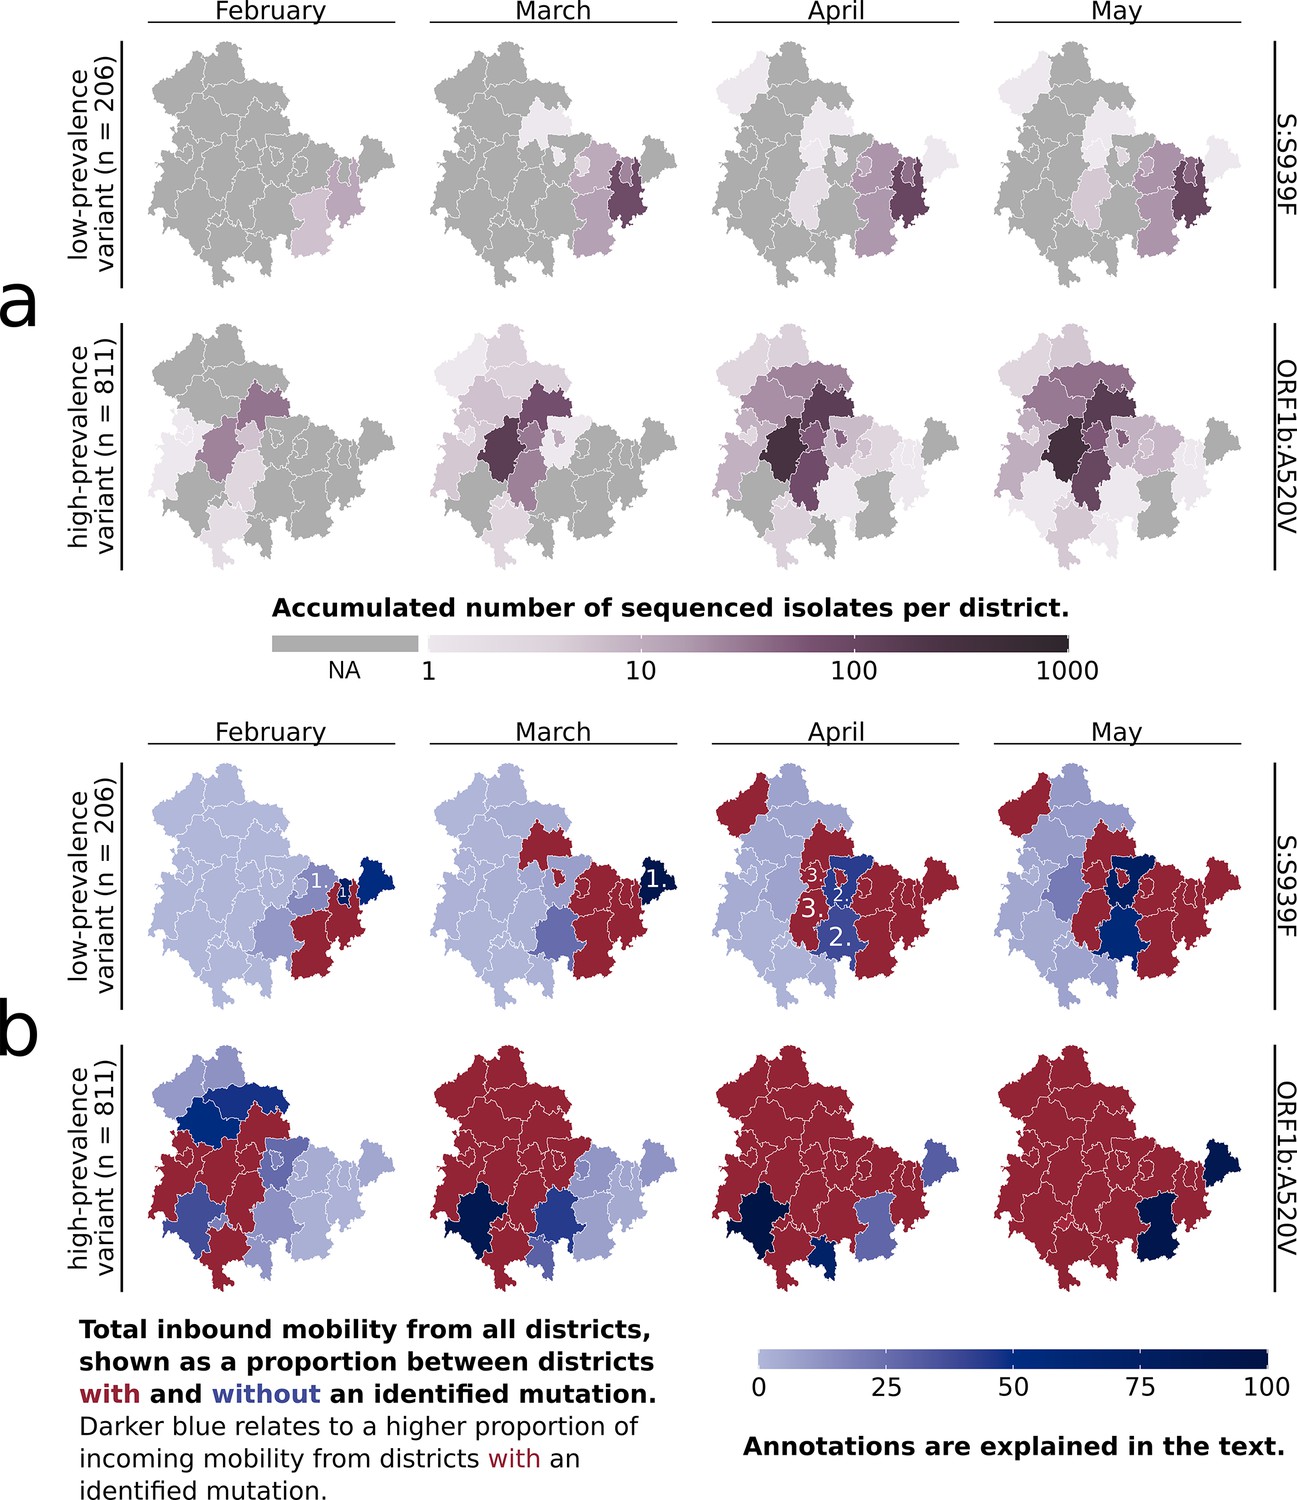
Overview of the subclusters ‘S:S939F’ and ‘ORF1b:A520V’ in Thuringian districts.
(a) Accumulated number of sequenced samples for each subcluster per district and per month. (b) Combined visualization of each district’s ‘inbound mobility’ from other districts (color intensity) and the occurrence of a subcluster sample (red = sample found, blue = no sample found). The inbound mobility of each district (blue color intensity) is shown as a proportion of incoming mobility from other districts with or without an identified sample. The darker the blue color of a district, the higher the proportion of inbound mobility from other districts with an identified subcluster sample (red districts). The light blue color describes that most of the inbound mobility of a district comes from other districts without an identified subcluster sample (blue districts). Numbers refer to district types 1, 2, and 3, as further defined in the main text. The last month of subcluster ‘ORF1b:A520V’ is not visualized, as affected districts were unchanged.
-
Figure 2—source code 1
R-script to generate Figure 2, Figure 2—figure supplements 1 and 2.
- https://cdn.elifesciences.org/articles/94045/elife-94045-fig2-code1-v1.zip
-
Figure 2—source data 1
Accumulated sample count for each Thuringian district per Alpha subcluster and month.
- https://cdn.elifesciences.org/articles/94045/elife-94045-fig2-data1-v1.xlsx
-
Figure 2—source data 2
Total number of incoming trips and numbers of trips coming from all cluster-affiliated districts to each Thuringian district per Alpha subcluster and per month.
The proportion of trips from cluster-affiliated districts among the total incoming trips is calculated.
- https://cdn.elifesciences.org/articles/94045/elife-94045-fig2-data2-v1.xlsx
Figure 2—figure supplement 1
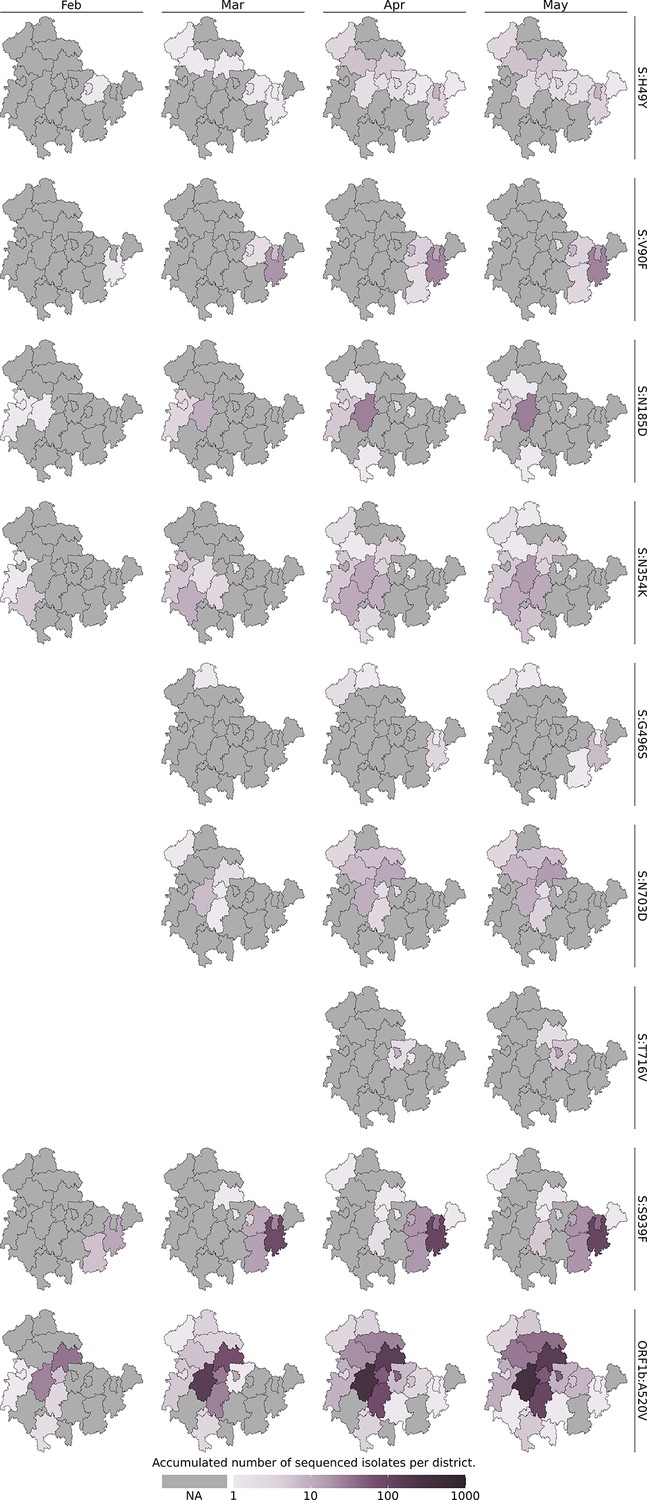
Accumulated number of sequenced samples for each Alpha lineage subcluster per district and per month.
Figure 2—figure supplement 2
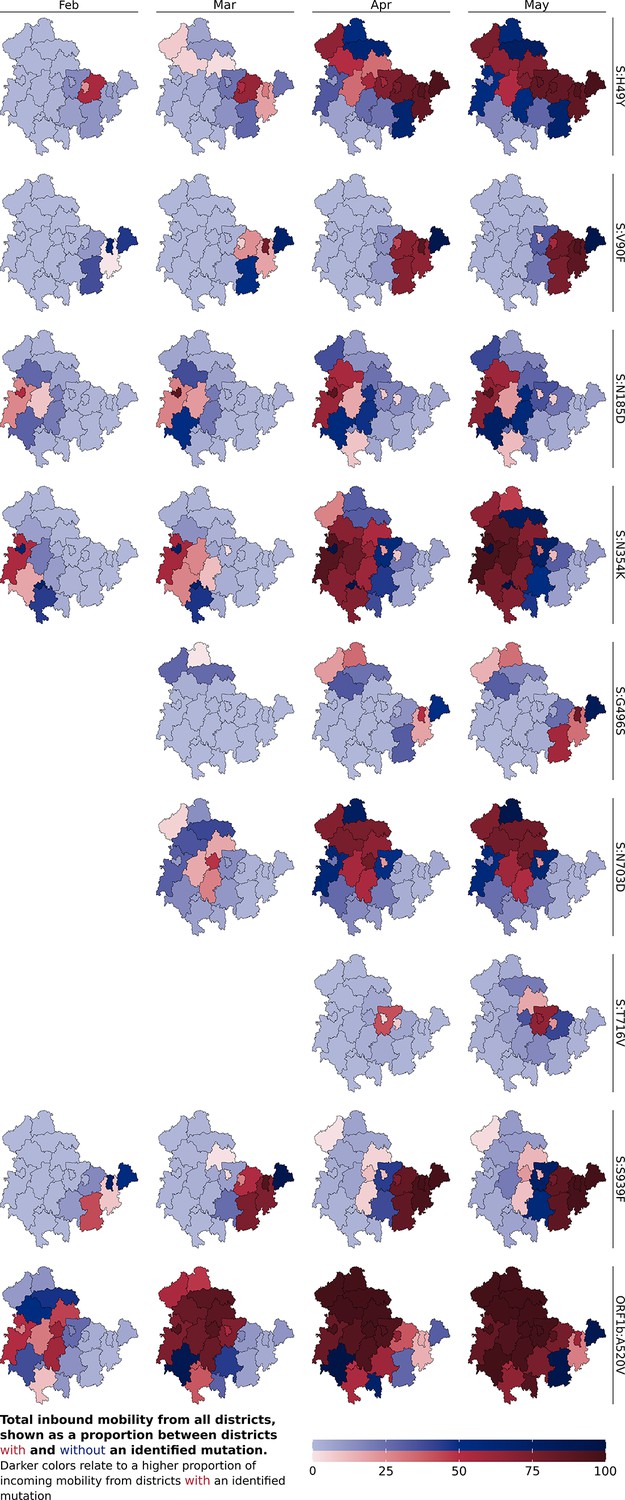
Combined visualization of each district’s ‘inbound mobility’ from other districts (color intensity) and the occurrence of a subcluster sample (red = sample found, blue = no sample found) per subcluster.
The inbound mobility of each district (color intensity) is shown as a proportion of incoming mobility from other districts with or without an identified sample. The darker the color (red and blue) of a district, the higher the proportion of inbound mobility from other districts with an identified subcluster sample (red districts). The light blue color describes that most of the inbound mobility of a district comes from other districts without an identified subcluster sample (blue districts).
Figure 3
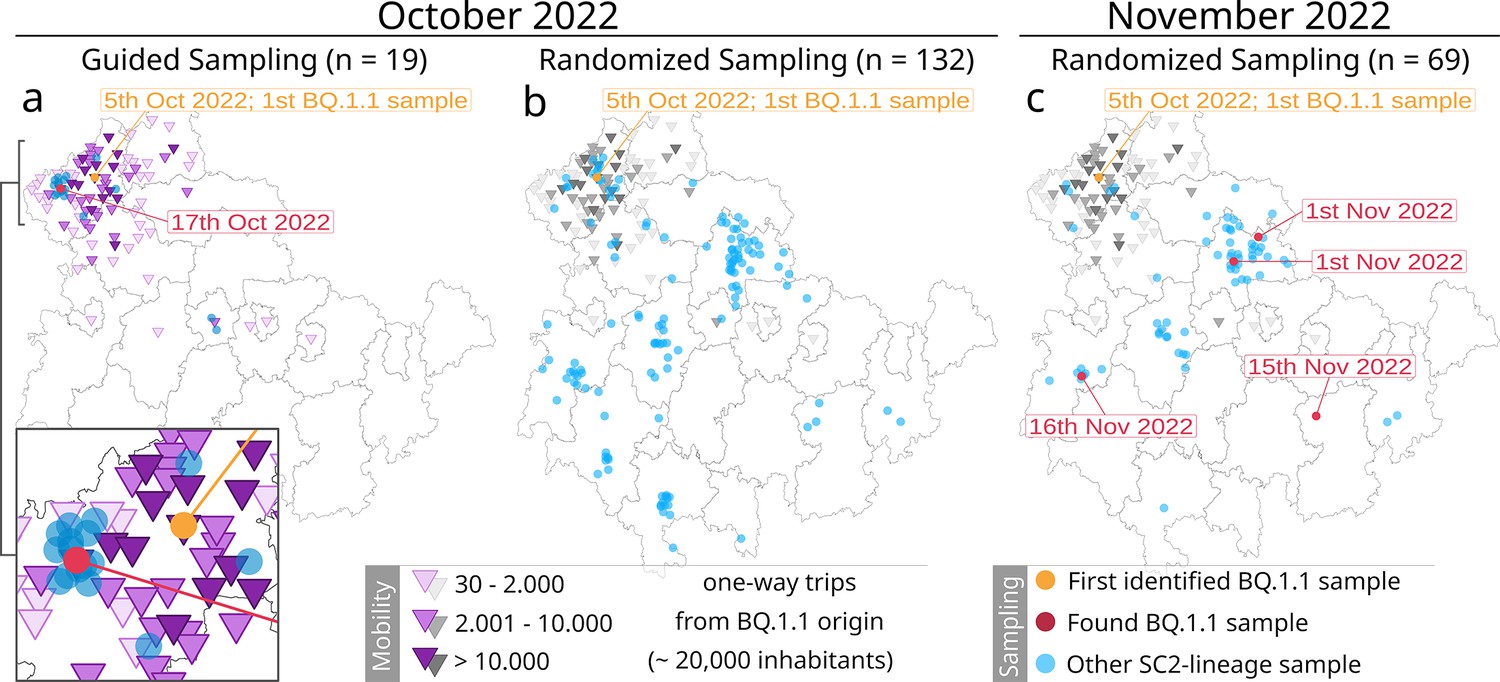
Overview of the mobility-guided sampling of the Omicron sublineage BQ.1.1 in Thuringia (a) compared to the default randomized sampling (surveillance) in October (b) and November 2022 (c).
The randomized surveillance results in November 2022 (c) have been added to highlight the spreading progress of BQ.1.1. Dots reflect the location of each sample (based on residents’ zip codes). Orange dot: first identified BQ.1.1 sample; red dot: additionally identified BQ.1.1 sample; blue dot: another SARS-CoV-2 lineage. Purple triangles represent the number of one-way trips a community received from the community of the first BQ.1.1 occurrence (orange dot) based on mobility data from October 2020 and June 2021. The same mobility data from mobility-guided sampling (a) were added in grayscales to the randomized surveillance (b and c) as a visual reference only. Sampling dots are slightly scattered to improve visibility.
-
Figure 3—source code 1
R-script to generate Figure 3.
- https://cdn.elifesciences.org/articles/94045/elife-94045-fig3-code1-v1.zip
-
Figure 3—source data 1
Overview of all Thuringian samples collected for the mobility-guided pilot experiment between October 5 and November 25, 2022.
- https://cdn.elifesciences.org/articles/94045/elife-94045-fig3-data1-v1.xlsx
-
Figure 3—source data 2
Mobility data and sampling counts of communities sampled for the mobility-guided pilot experiment between October 5 and November 25, 2022.
For each community, the incoming one-way trips from the community of BQ.1.1 origin in Thuringia based on the October 2020 and June 2021 datasets, the number of guided and randomized samples per community, and an indication of found BQ.1.1 samples are provided.
- https://cdn.elifesciences.org/articles/94045/elife-94045-fig3-data2-v1.xlsx
Tables
Table 1
Overview of nine Alpha subclusters in Thuringia, their sample count, their time period, and their specific mutations that are shared across all members of the subcluster (excluding characteristic Alpha mutations that are shared across all subclusters).
The mutation used to define the subcluster is highlighted in bold.
| Designation | Mutations | Number of samples | Time period | Remarks |
|---|---|---|---|---|
| 1 | S:H49Y, ORF1a:I841V | 44 | Feb-May 2021 | S:H49Y eases cell entry in S-pseudotyped lentiviral system (Ozono et al., 2021) |
| 2 | S:N354K | 63 | Feb-May 2021 | S:N354K slightly impaired mAb h11B11 (Du et al., 2021) |
| 3 | S:G496S, ORF1a:E1013K | 12 | Mar-May 2021 | S:G496S: compromises BA.1 replication fitness and changed mAb sensitivities, reduces ACE2 binding affinity, and increases immune evasion (Liang et al., 2022; Kimura et al., 2022; Asif et al., 2022) |
| 4 | S:N703D, ORF1a:D1228G, ORF1a:A2123V | 51 | Mar-May 2021 | – |
| 5 | S:T716V, N:G204P, ORF1a:D1600N | 22 | Apr-May 2021 | – |
| 6 | S:S939F | 206 | Feb-May 2021 | S:S939F: modulates T-cell propensity (Donzelli et al., 2022) |
| 6.1† | S:V90F, S:S939F | 55 | Feb-May 2021 | – |
| 7 | ORF1b:A520V | 811 | Feb-Jun 2021* | – |
| 7.1 ‡ | S:N185D, ORF1b:A520V, ORF1b:L1504F | 40 | Feb-May 2021 | – |
-
*
Only one sample for June.
-
†
Branch from subcluster 6.
-
‡
Branch from subcluster 7.
Additional files
-
Supplementary file 1
'microreact’-file summarizing all data presented in the microreact project.
The project can be found at here.
- https://cdn.elifesciences.org/articles/94045/elife-94045-supp1-v1.zip
-
Supplementary file 2
Description of supplementary method ‘Phylogenetic time tree construction’.
- https://cdn.elifesciences.org/articles/94045/elife-94045-supp2-v1.zip
-
Supplementary file 3
'xz’-packed fasta-file, containing all SARS-CoV-2 Alpha lineage genomes used in the Nextstrain analysis.
- https://cdn.elifesciences.org/articles/94045/elife-94045-supp3-v1.zip
-
Supplementary file 4
Metadata tsv-file containing the information for all SARS-CoV-2 Alpha lineage genomes used in the Nextstrain analysis.
- https://cdn.elifesciences.org/articles/94045/elife-94045-supp4-v1.xlsx
-
Supplementary file 5
'yaml’-file containing the build-instructions for the Nextstrain analysis.
- https://cdn.elifesciences.org/articles/94045/elife-94045-supp5-v1.zip
-
Supplementary file 6
'xz’-packed fasta-file containing the resulting, subsampled genomes of the Nextstrain analysis.
- https://cdn.elifesciences.org/articles/94045/elife-94045-supp6-v1.zip
-
Supplementary file 7
Nextstrain ‘tree.nwk’-file used to visualize the phylogenetic time tree.
Contains 64,131 German (non-Thuringian) and 6298 Thuringian Alpha lineage genomes.
- https://cdn.elifesciences.org/articles/94045/elife-94045-supp7-v1.zip
-
Supplementary file 8
Metadata tsv-file for the Alpha lineage genomes contained in the phylogenetic time tree.
- https://cdn.elifesciences.org/articles/94045/elife-94045-supp8-v1.xlsx
-
Supplementary file 9
GeoData used in Figure 1—source code 1, Figure 2—source code 1, Figure 3—source code 1.
- https://cdn.elifesciences.org/articles/94045/elife-94045-supp9-v1.zip
-
MDAR checklist
- https://cdn.elifesciences.org/articles/94045/elife-94045-mdarchecklist1-v1.pdf
Download links
A two-part list of links to download the article, or parts of the article, in various formats.
Downloads (link to download the article as PDF)
Open citations (links to open the citations from this article in various online reference manager services)
Cite this article (links to download the citations from this article in formats compatible with various reference manager tools)
Leveraging mobility data to analyze persistent SARS-CoV-2 mutations and inform targeted genomic surveillance
eLife 13:RP94045.
https://doi.org/10.7554/eLife.94045.3


