Self-inhibiting percolation and viral spreading in epithelial tissue
- Niels Bohr Institute, University of Copenhagen, Denmark
- Novo Nordisk Foundation Center for Stem Cell Medicine, reNEW, University of Copenhagen, Denmark
- PandemiX Center, Department of Science and Environment, Roskilde University, Denmark
- High Meadows Environmental Institute, Princeton University, United States
Figures
Figure 1 with 2 supplements
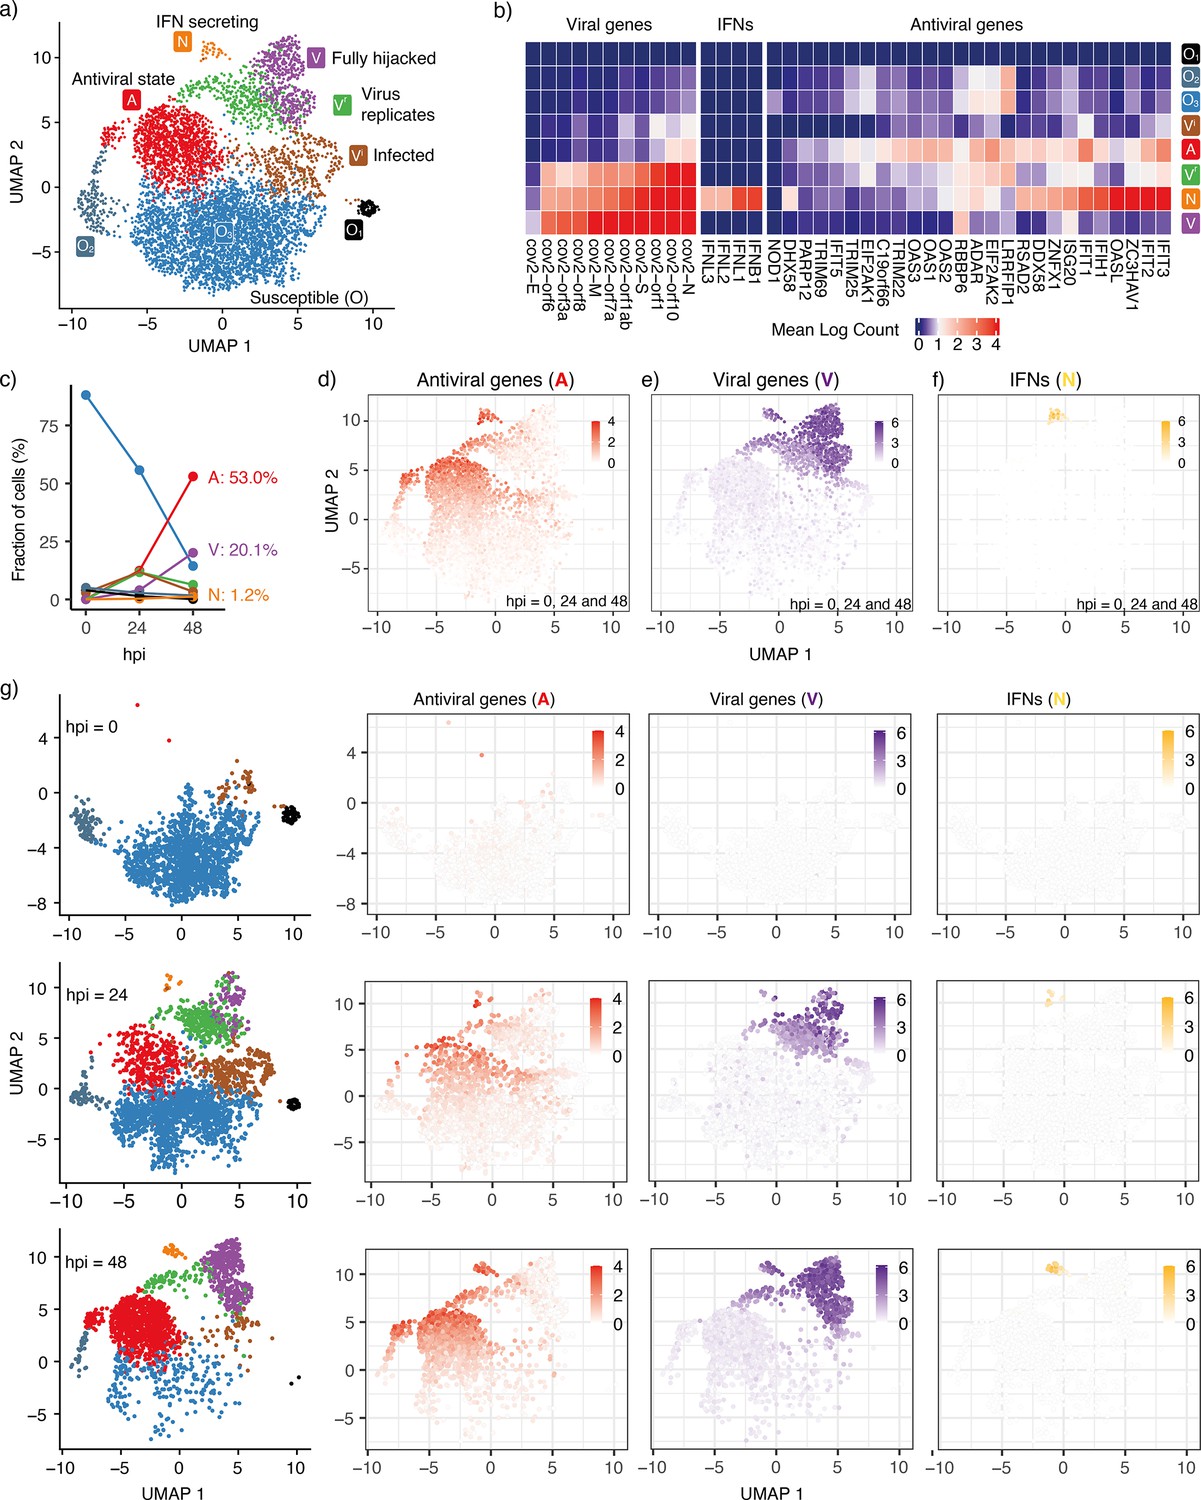
Cell states during SARS-CoV-2 infection in human tracheal/bronchial epithelial cells.
(a) 6162 cells (Fiege et al., 2021) covering samples of mock-infected (0 h), 24 hpi (hours post-infection), and 48 hpi visualized with UMAP. (b) Average expression of representative viral genes, IFNs, and antiviral genes in cells within each cluster (state). (c) Cell proportions of clusters at different time points (hpi = 0, 24, and 48). The same colors are used for the lines as for the cluster (state) in (a). (d) Average expression of antiviral genes (IFIT1, IFIT2, IFIT3, IFIT5, IFIH1, OAS1, OAS2, OAS3, OASL, DDX58) in each cell. (e) Average expression of viral genes (cov.orf1ab, cov.S, cov.orf3a, cov.orf6, cov.M, cov.N) in each cell. (f) Average expression of interferon genes (IFNB1, IFNL1, IFNL2, IFNL3) in each cell. 103 cells (1.7%) are IFN-positive. (g) Progression of viral infection as indicated by changes in cell proportions of different states. Cells are shown separately at each time point in the leftmost column. The right columns show the average expression of antiviral genes, viral genes, and IFNs in each of these cells. Colorkeys indicate the gene expression level from low (white) to high (red, purple, or yellow).
Figure 1—figure supplement 1
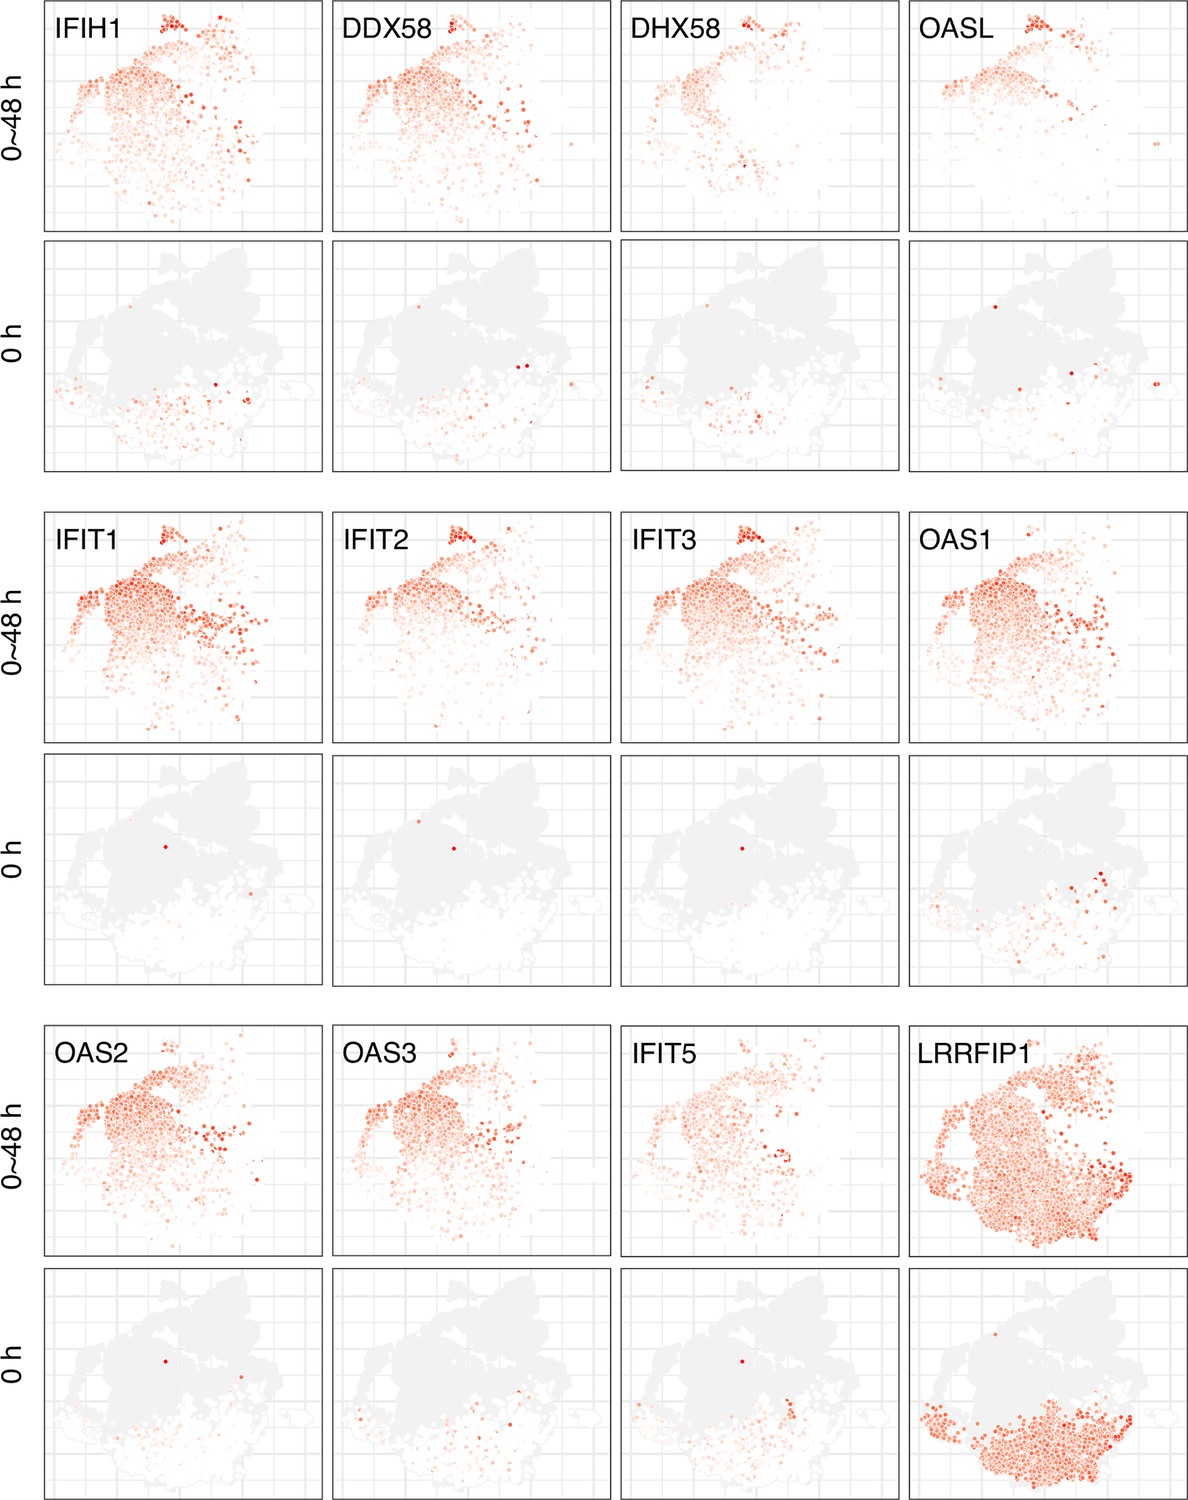
Expression of antiviral genes at different stages of early SARS-CoV-2 infection.
Once the infection has proceeded for 2 days, cells in the state express all the antiviral genes highly. The typical state can be identified from the 0 hr panels where some cells express low to moderate levels of antiviral genes before any exposure to infection. 8% of the cells at 0 hr express at least two of IFIH1, DDX58, and DHX58 at a detectable level.
Figure 1—figure supplement 2
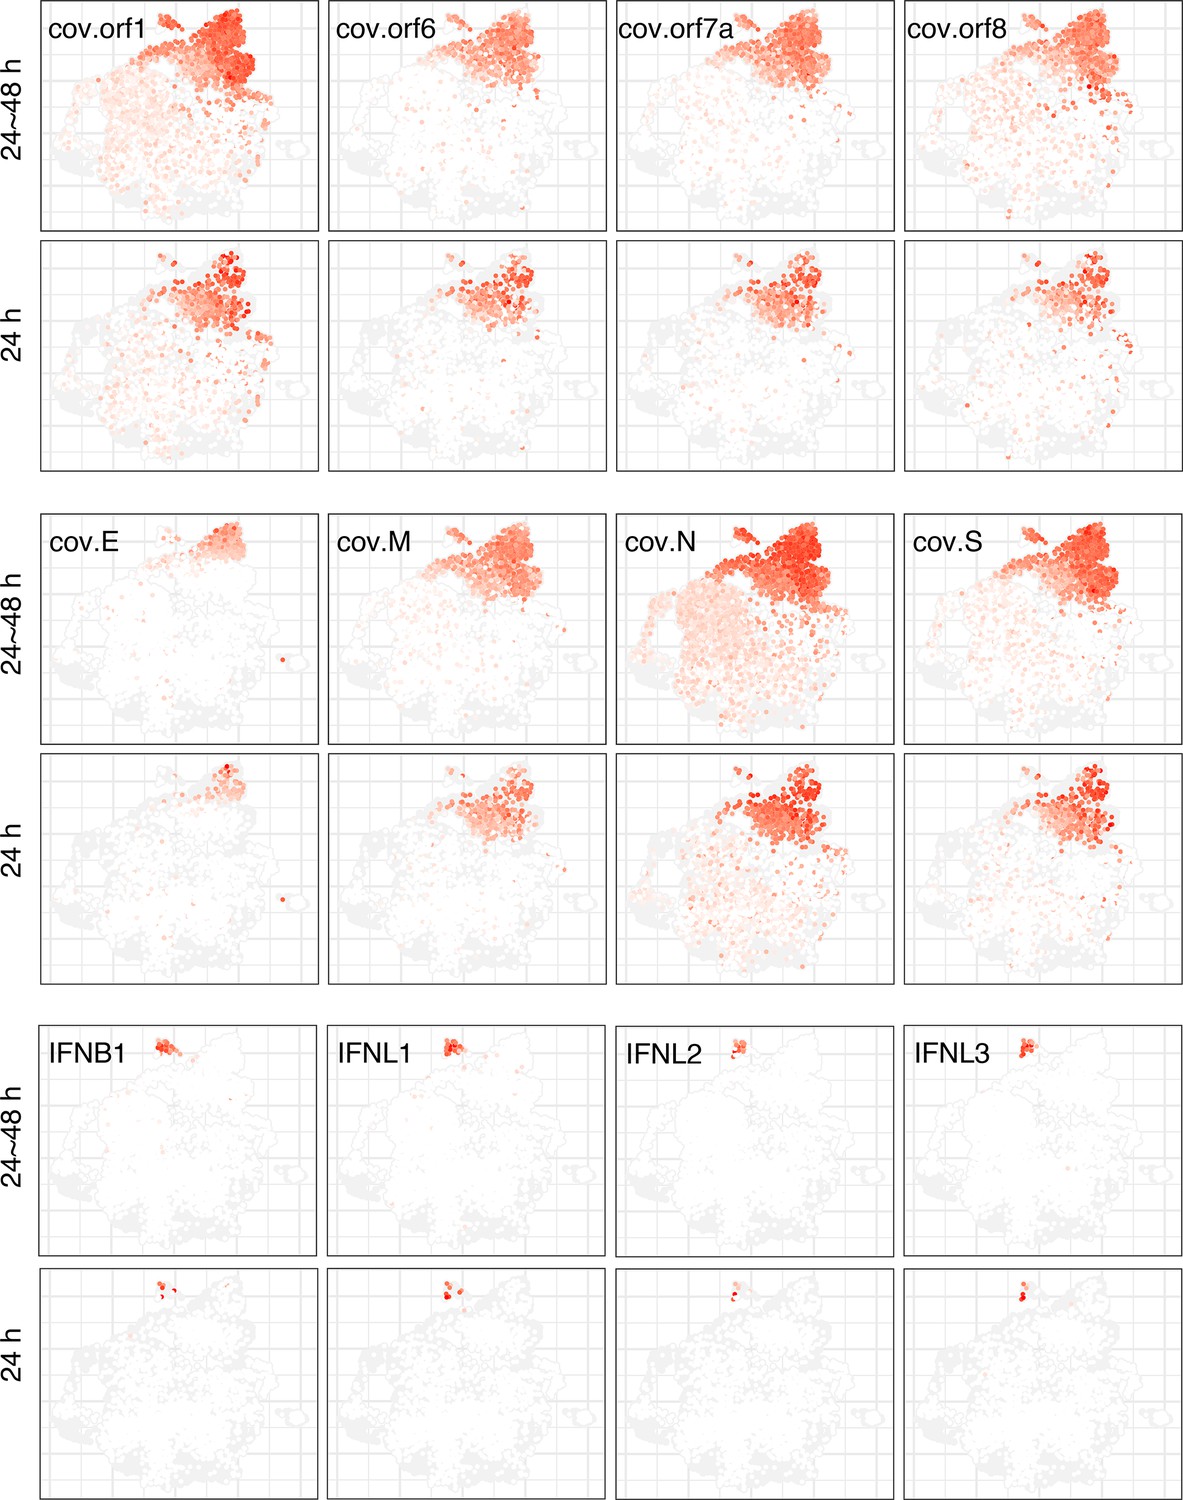
Detected viral genes and expression of IFNs at different stages of early SARS-CoV-2 infection.
Once the infection has proceeded for 2 days, viral genes (cov.*) are detected at a high level in the cells. The IFN genes are mainly expressed in cells, amounting to 0.6% at 24hr and to 4.8% at 48 hr.
Figure 2 with 1 supplement

NOVAa model.
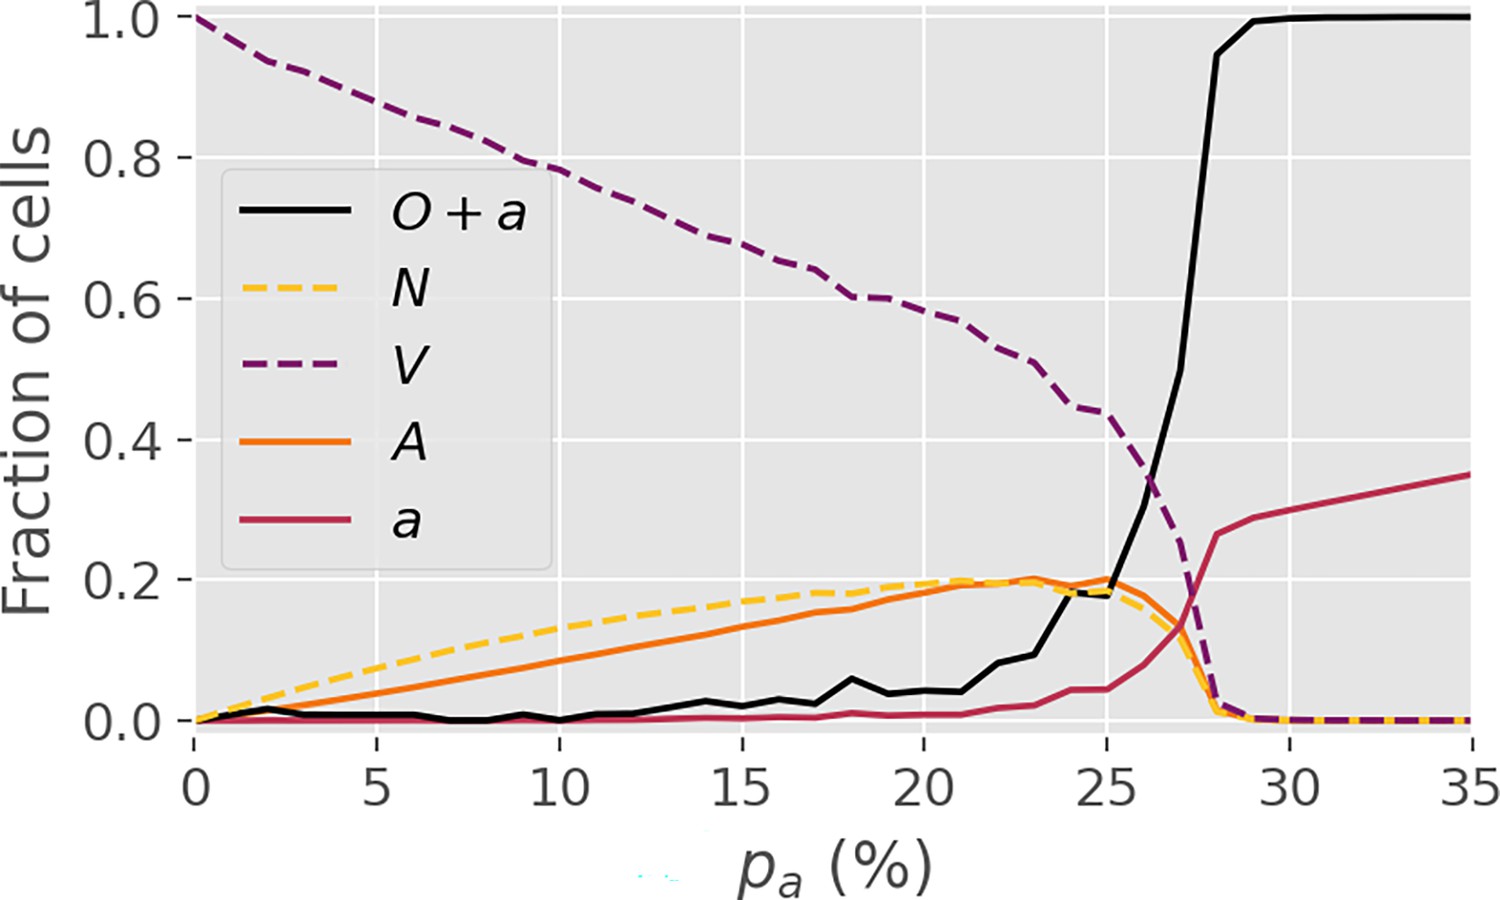
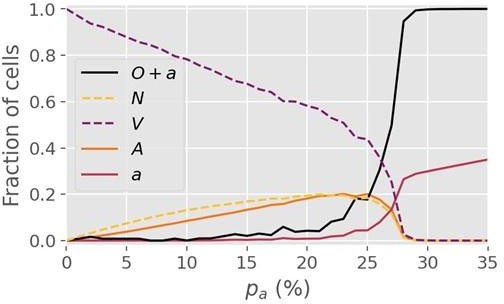
(a) The cell state transitions are included in the NOVAa model. The straight black arrows indicate transitions between cell states. The curved yellow arrows indicate the effects of IFNs on activating antiviral states. The curved purple arrows indicate viral spread to cells with and states. (b) Final states of a small lattice (50 × 50) simulations at two different values of (both at IFN spreading radius ). (c) The fraction of cells in each state in the final frozen configuration as a function of . A critical transition is observed at . At lower values of , most cells terminate in the state, representing an aggressive tissue infection. Simulations were performed on a lattice with linear dimension .
Figure 2—figure supplement 1
Stochastic conversion.
Average final-state cell fractions in a variant of the model with stochastic conversion, i.e. in which each conversion of a neighboring cell takes place with a probability . In this figure, . Note that the critical threshold is largely unaffected. The figure is based on 4000 simulations.
Figure 3 with 1 supplement
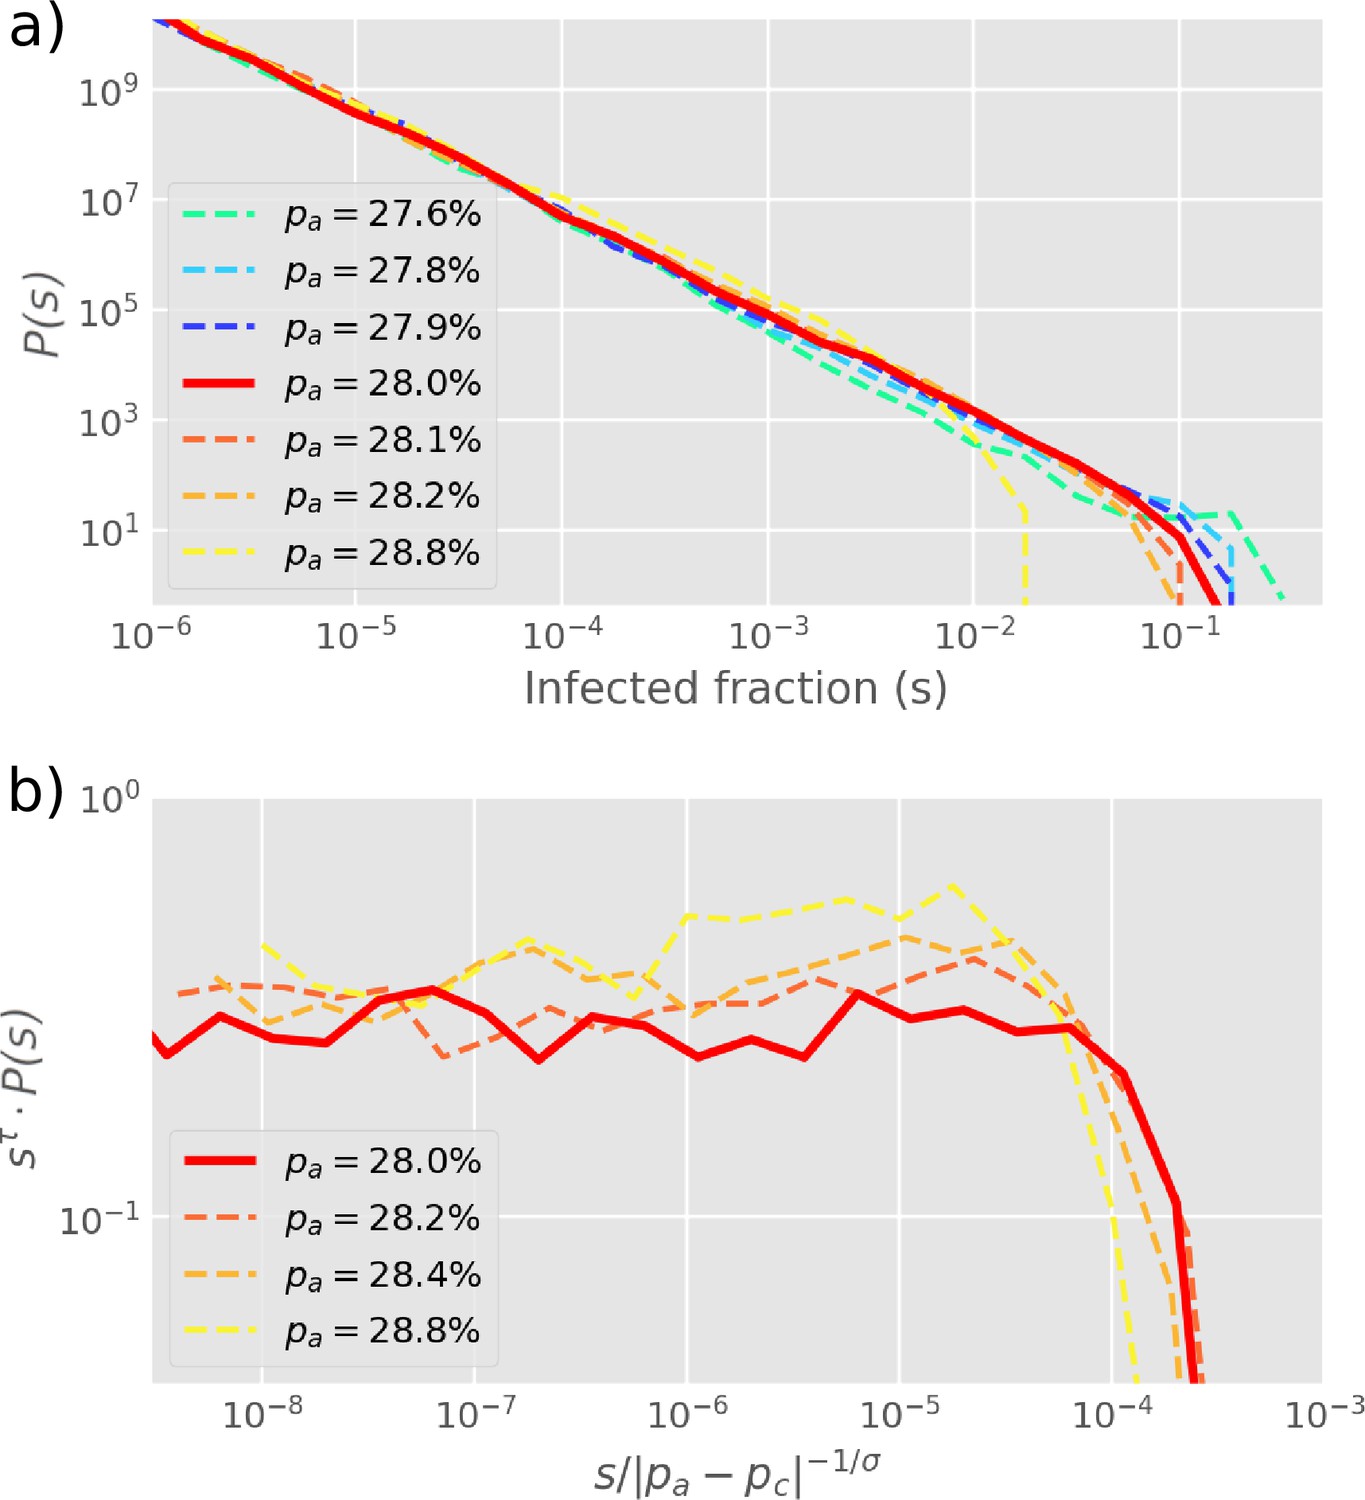
Cluster size distribution.
(a) The distribution of cluster sizes of infected cells () for different values of , simulated by starting with one infected cell in a 2D square lattice of linear extent . (b) The exponents from (a) are extracted by re-scaling as shown on the -axis, yielding . The cut-off exponent is estimated as . Simulations plot the final outbreak sizes from 10,000 initial infections of one cell. The histogram is log-binned with 5 bins per decade. The critical point at is determined as the value with the longest scaling regime.
Figure 3—figure supplement 1
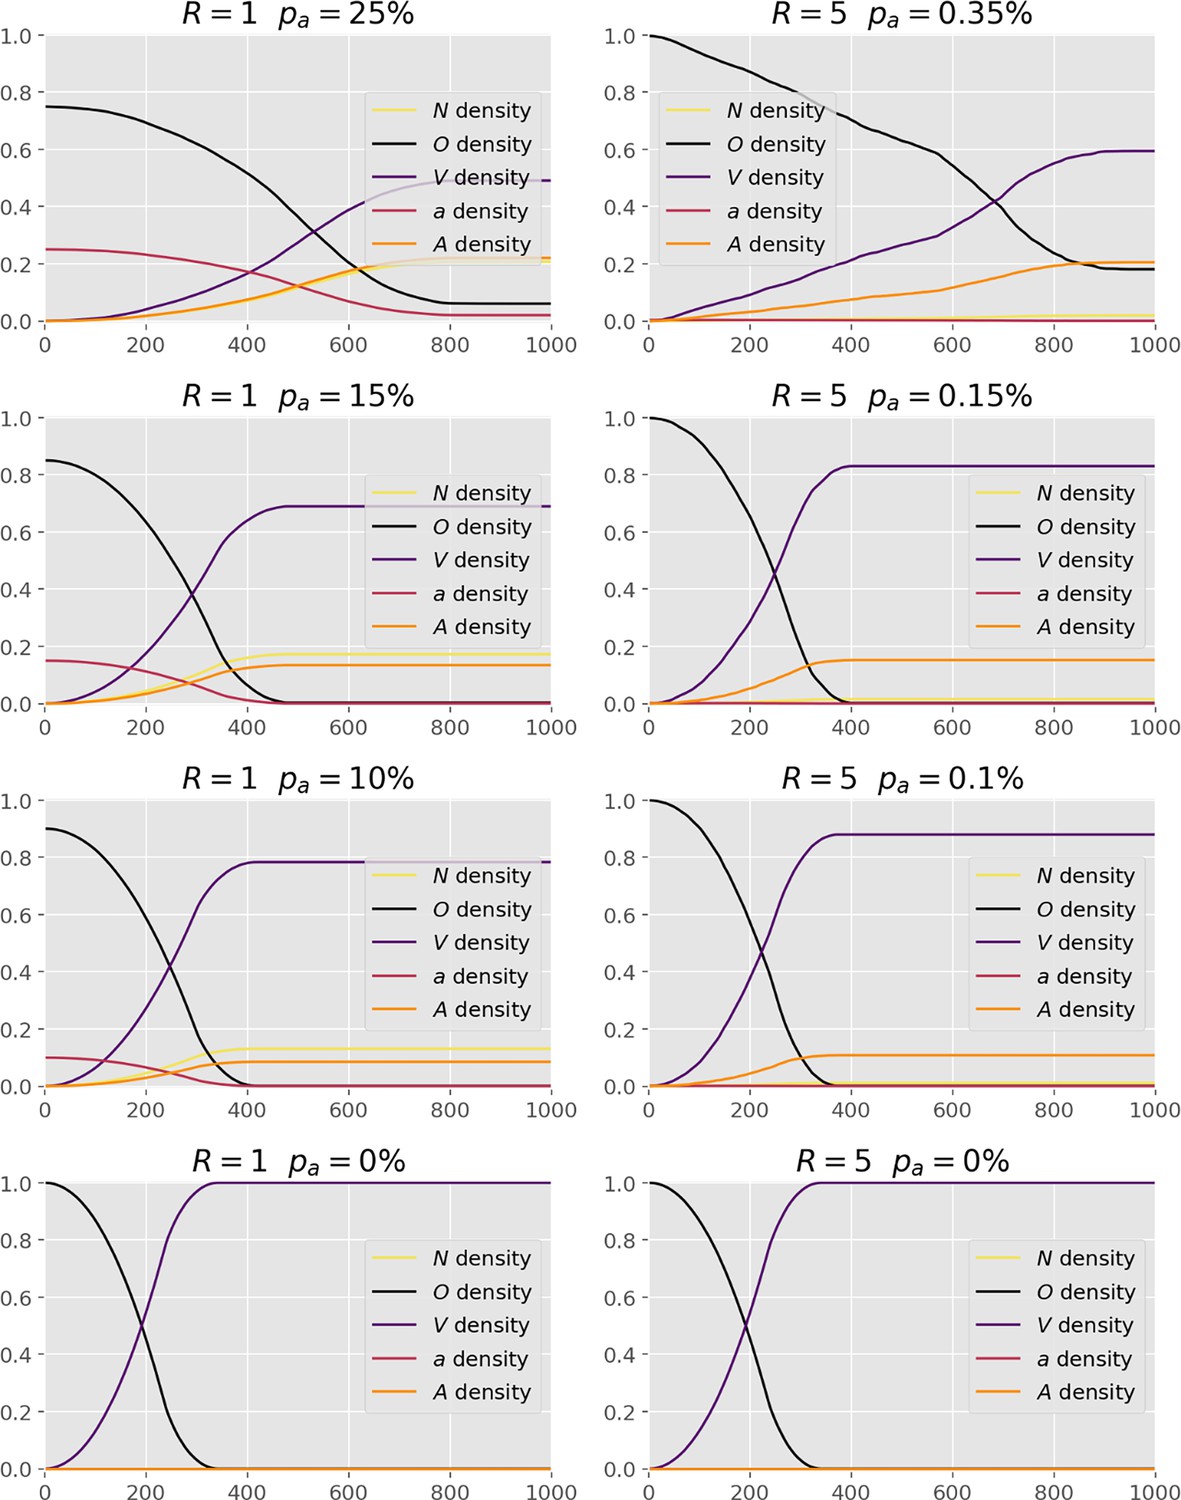
Cell fractions within the different states over times, at a range of values (below the critical value ), for two interferon spreading radii, and .
Figure 4 with 2 supplements
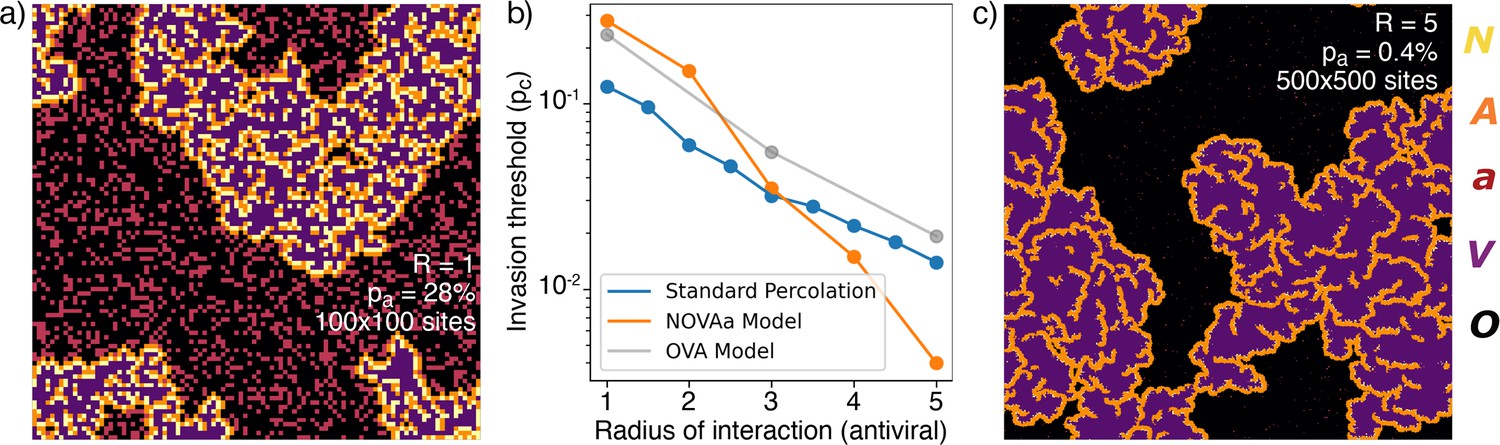
Range of IFN.
(a) Typical cluster for an simulation at . (b) The dependence of with , approximately reproduced by a fit . For comparison, the OVA model as well as percolation has . In all cases, when is above then the virus is prevented from spreading. (c) Cluster distribution for at , at a five times larger linear scale than (a).
Figure 4—figure supplement 1
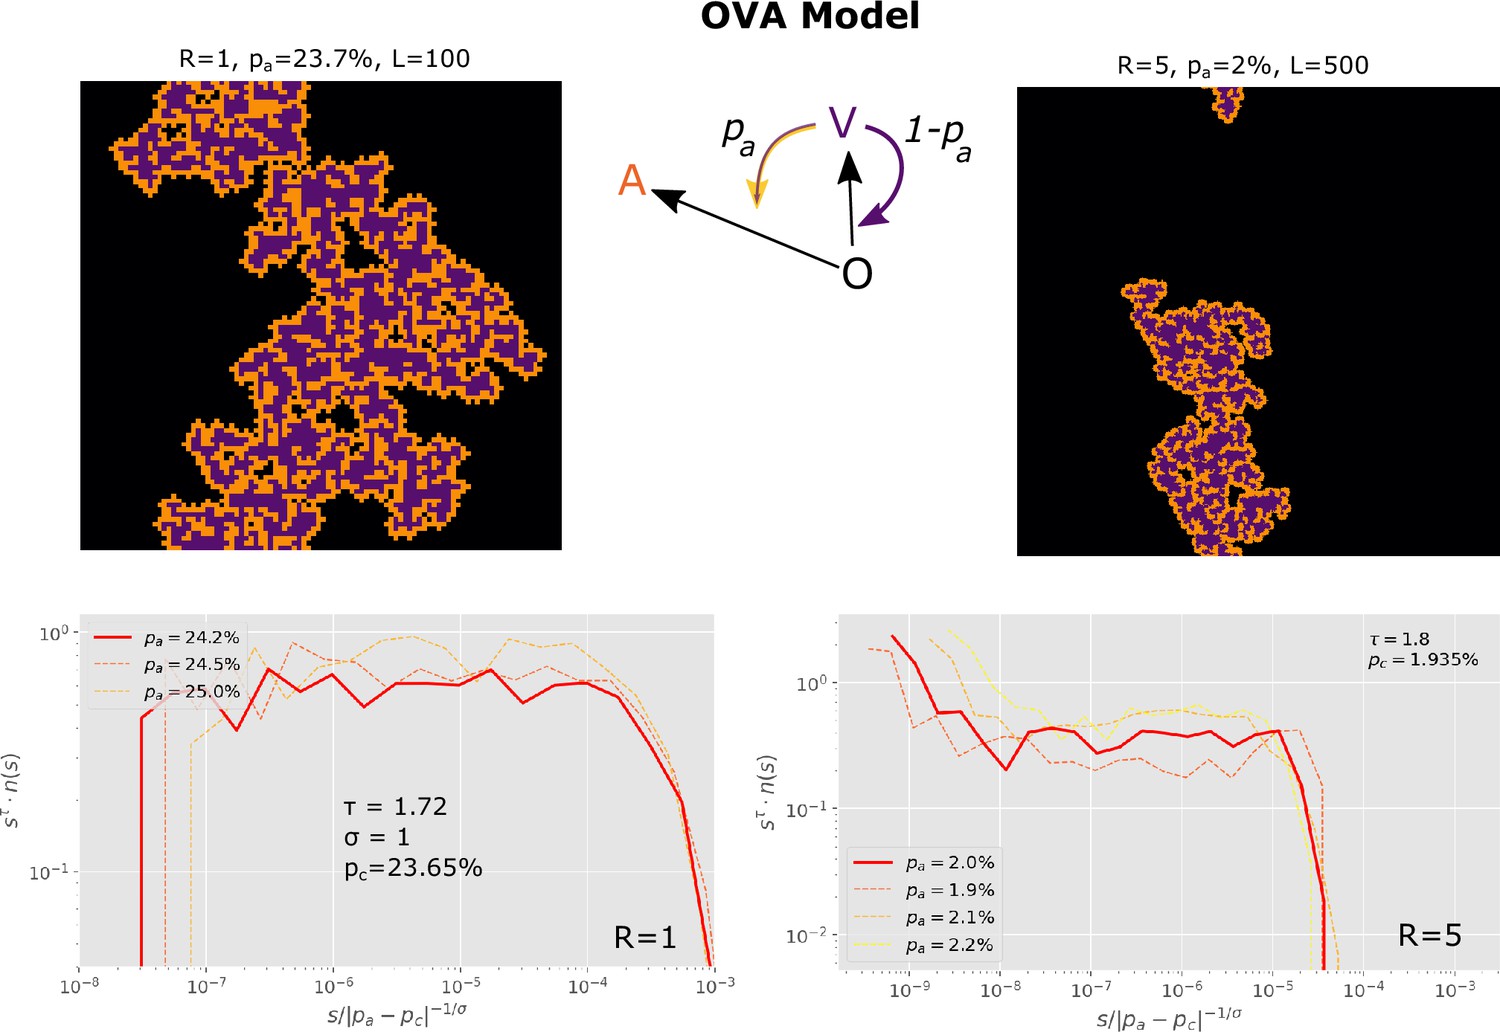
We introduced the simplified OVA model, which does not include an N state, but rather gives each susceptible cell a probability of spontaneously converting to an antiviral state in each time step.
OVA Model: In each time step, updates are made. At each update, one of the sites is randomly selected. If this site is in the state, nothing happens. If the site is state then its nearest 4 neighbors are exposed to the virus, given that they are susceptible (i.e. in the state). One then in random order selects each of the neighbors that are in state. For each selected neighbor one draws a random number . If the neighbor is flipped to state. If, on the other hand, then one converts all cells within radius around the neighbor into the state. These changes include the neighbor itself.
Figure 4—figure supplement 2
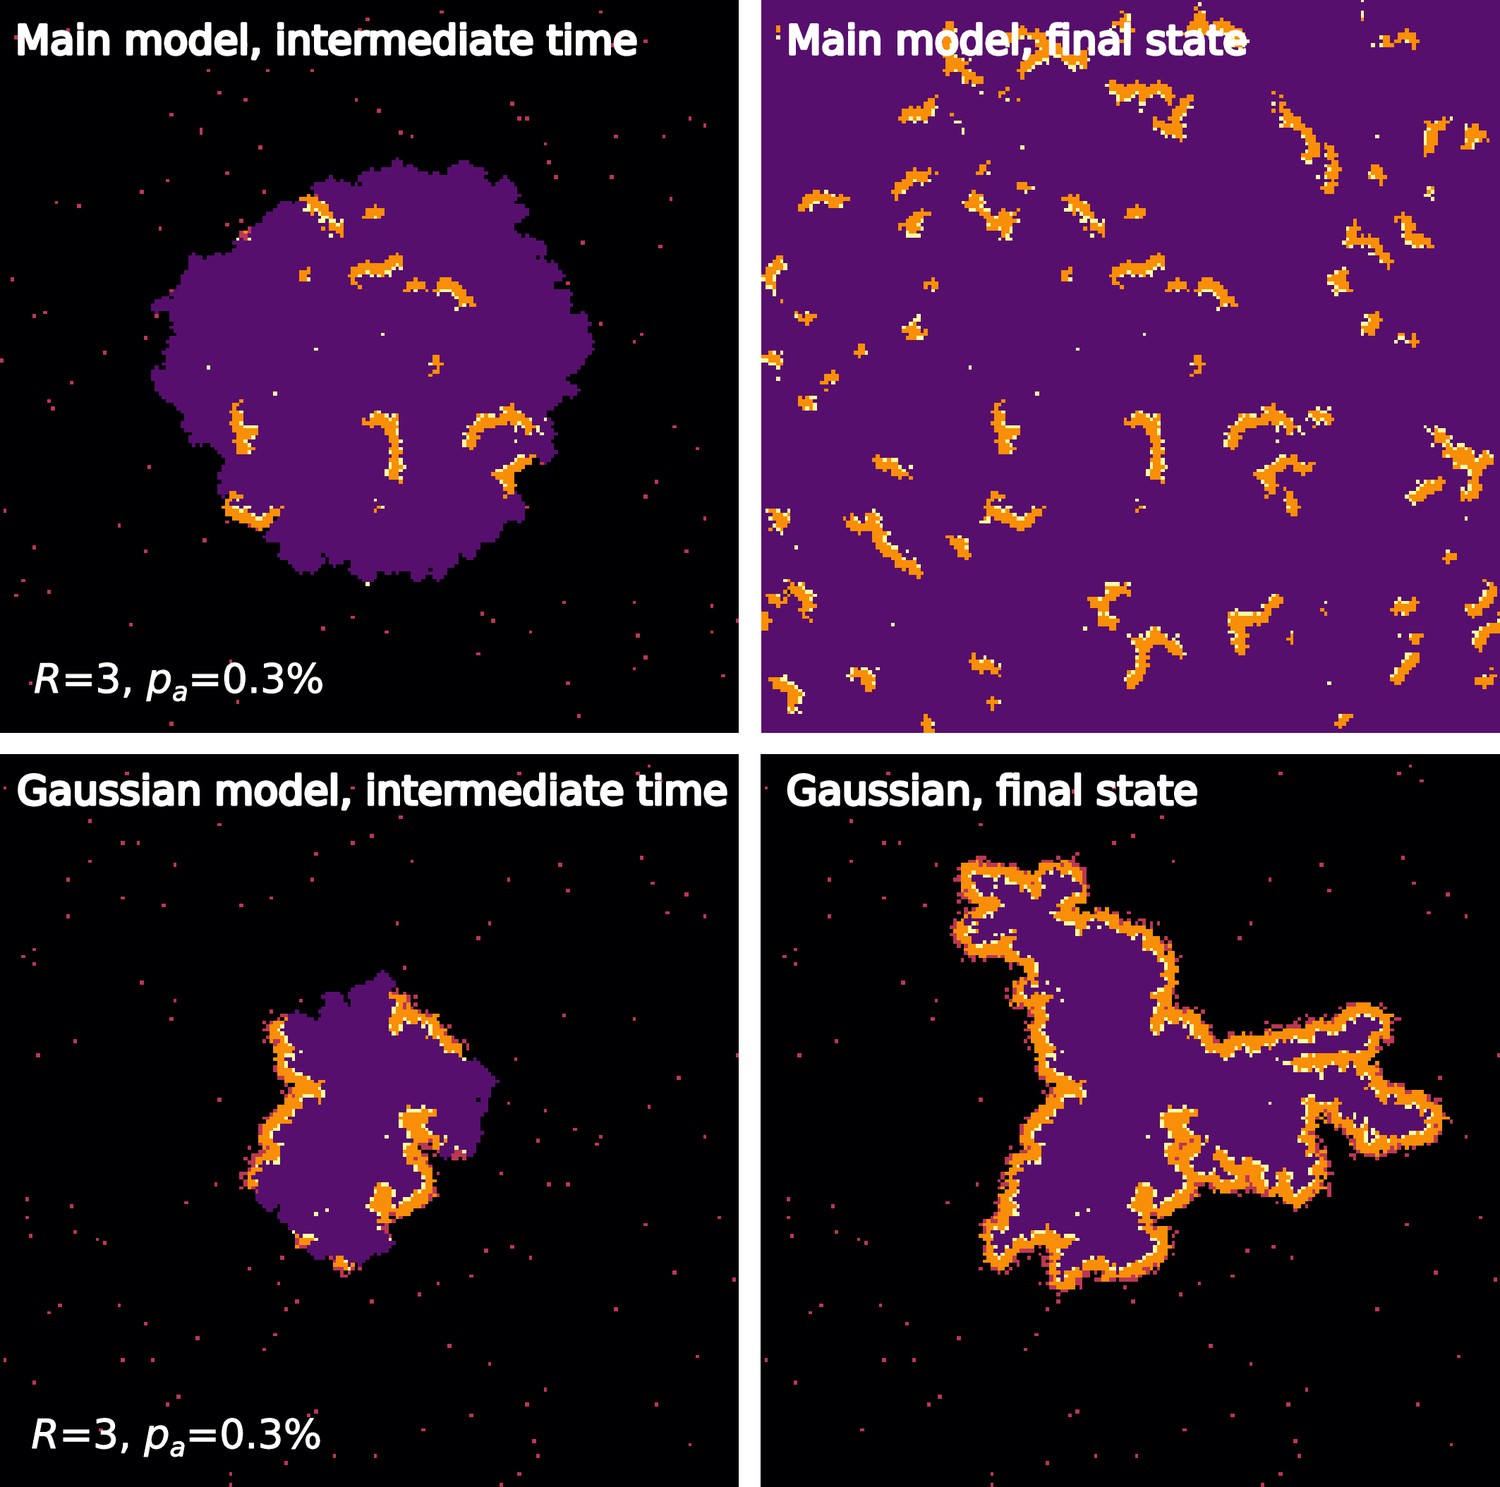
Comparison of the Gaussian Model and the main NOVAa model at identical parameters.
Author response image 1
Additional files
Download links
A two-part list of links to download the article, or parts of the article, in various formats.
Downloads (link to download the article as PDF)
Open citations (links to open the citations from this article in various online reference manager services)
Cite this article (links to download the citations from this article in formats compatible with various reference manager tools)
Self-inhibiting percolation and viral spreading in epithelial tissue
eLife 13:RP94056.
https://doi.org/10.7554/eLife.94056.3


