Chromosome structure in Drosophila is determined by boundary pairing not loop extrusion
- Lewis Sigler Institute, Princeton University, United States
- Department of Molecular Biology, Princeton University, United States
- Department of Biochemistry and Molecular Biology, Thomas Jefferson University, United States
Figures
Figure 1
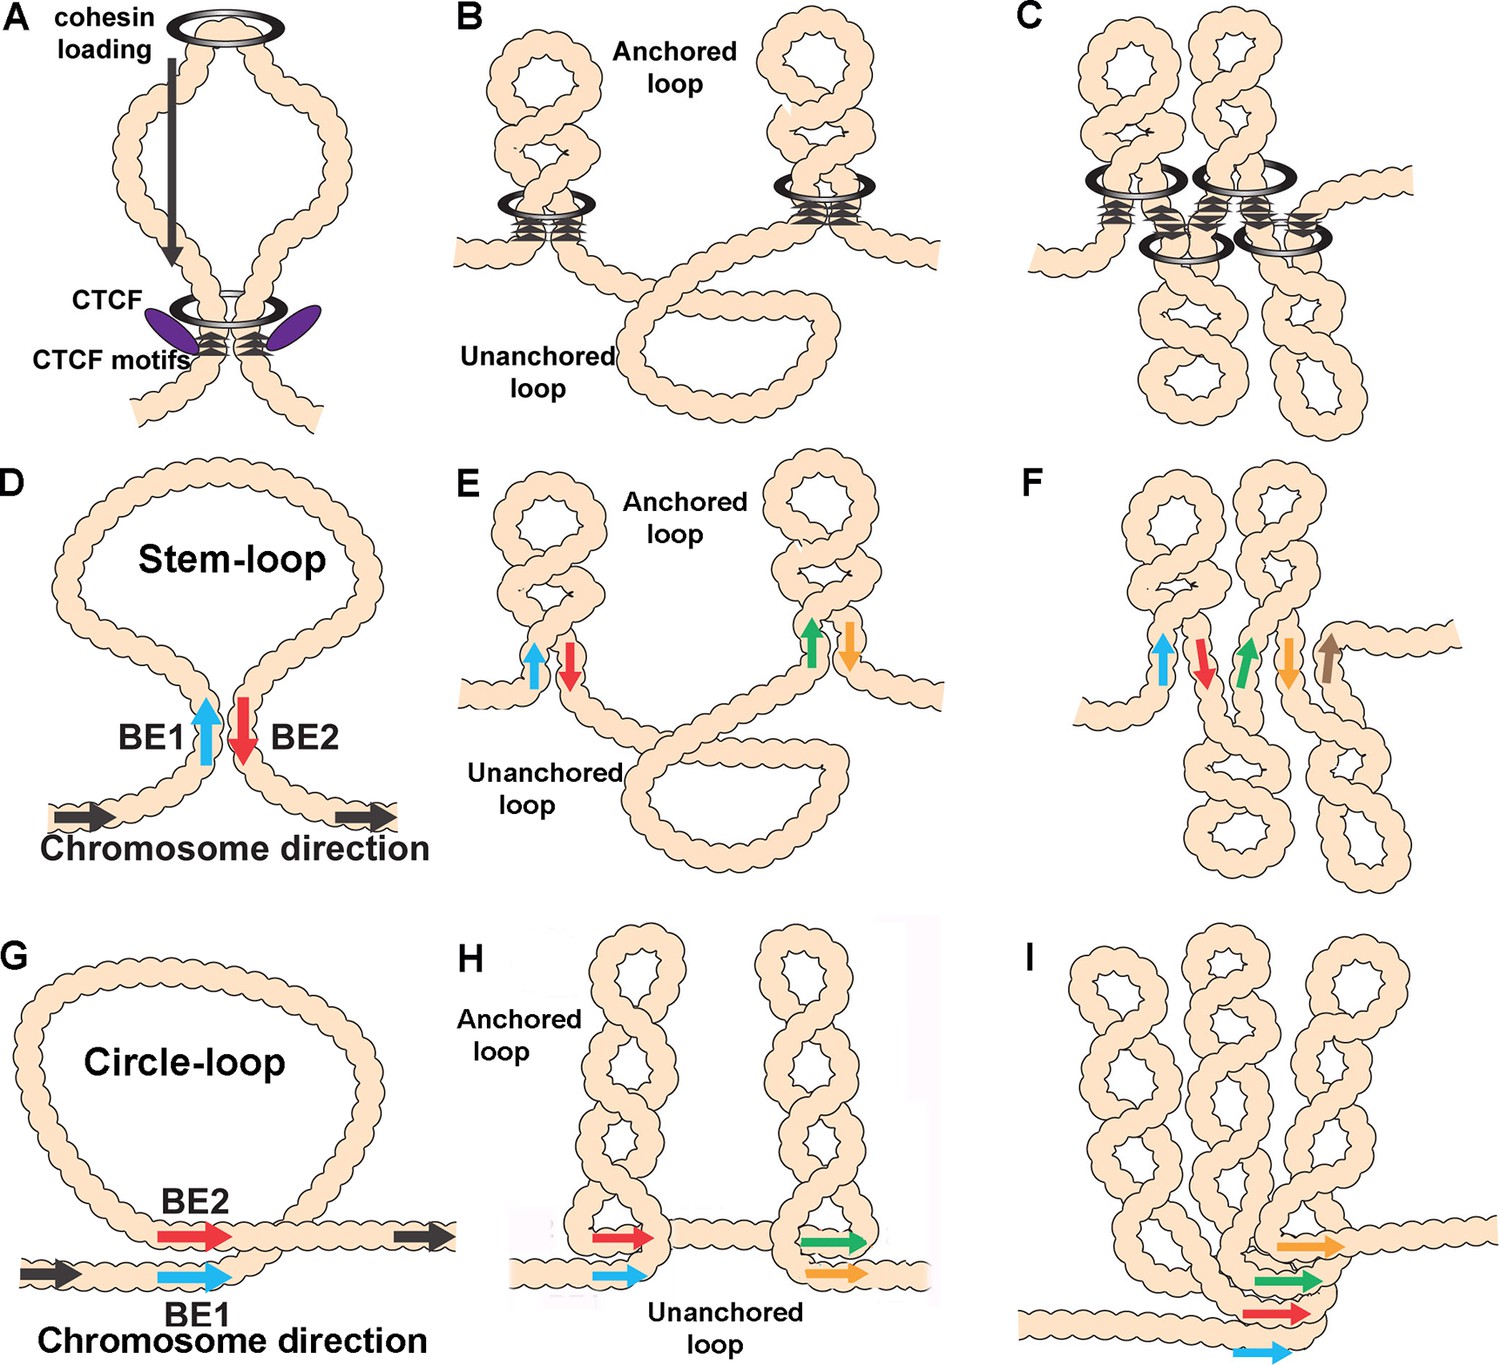
Diagrams of possible loop topologies generated by loop extrusion and boundary:boundary pairing.
(A) Cohesin embraces a loop at a loading site somewhere within the TAD-to-be, and then extrudes a loop at an equal rate on both strands. Extrusion continues until cohesin encounters boundary roadblocks on both strands. (B) In one model, the orientation of the roadblock is important. As a consequence, the chromatin fiber will be organized into a series of stem-loops separated from each other by unanchored loops. (C) If the presence of a boundary roadblock, but not its orientation, is sufficient to halt extrusion, the chromatin fiber will be organized into a series of linked stem-loops. The main axis of the chromosome will be defined by the cohesin:CTCF roadblocks. (D) The pairing of two boundaries head-to-tail generates a stem-loop. (E) If boundary pairing interactions are strictly pairwise, head-to-tail pairing will generate a series of stem-loops separated from each other by unanchored loops. (F) If boundaries can engage in multiple head-to-tail pairing interactions, the chromosome will be organized into a series of linked stem-loops. The main axis of the chromosome will be defined by a series of paired boundaries. (G) The pairing of two boundaries head-to-head generates a circle-loop. (H) If boundary pairing interactions are strictly pairwise, there will be a series of circle-loops separated from each other by unanchored loops. (I) If boundaries can engage in multiple head-to-head pairing interactions, the chromatin fiber will be organized into a series of circle-loops connected to each other at their base. Pairing interactions between boundaries #1 and #2 need not be in register with the pairing of boundaries #2 and #3. In this case, the main axis of the chromosome may bend and twist, and this could impact the relative orientations of the circle-loops.
Figure 2 with 3 supplements
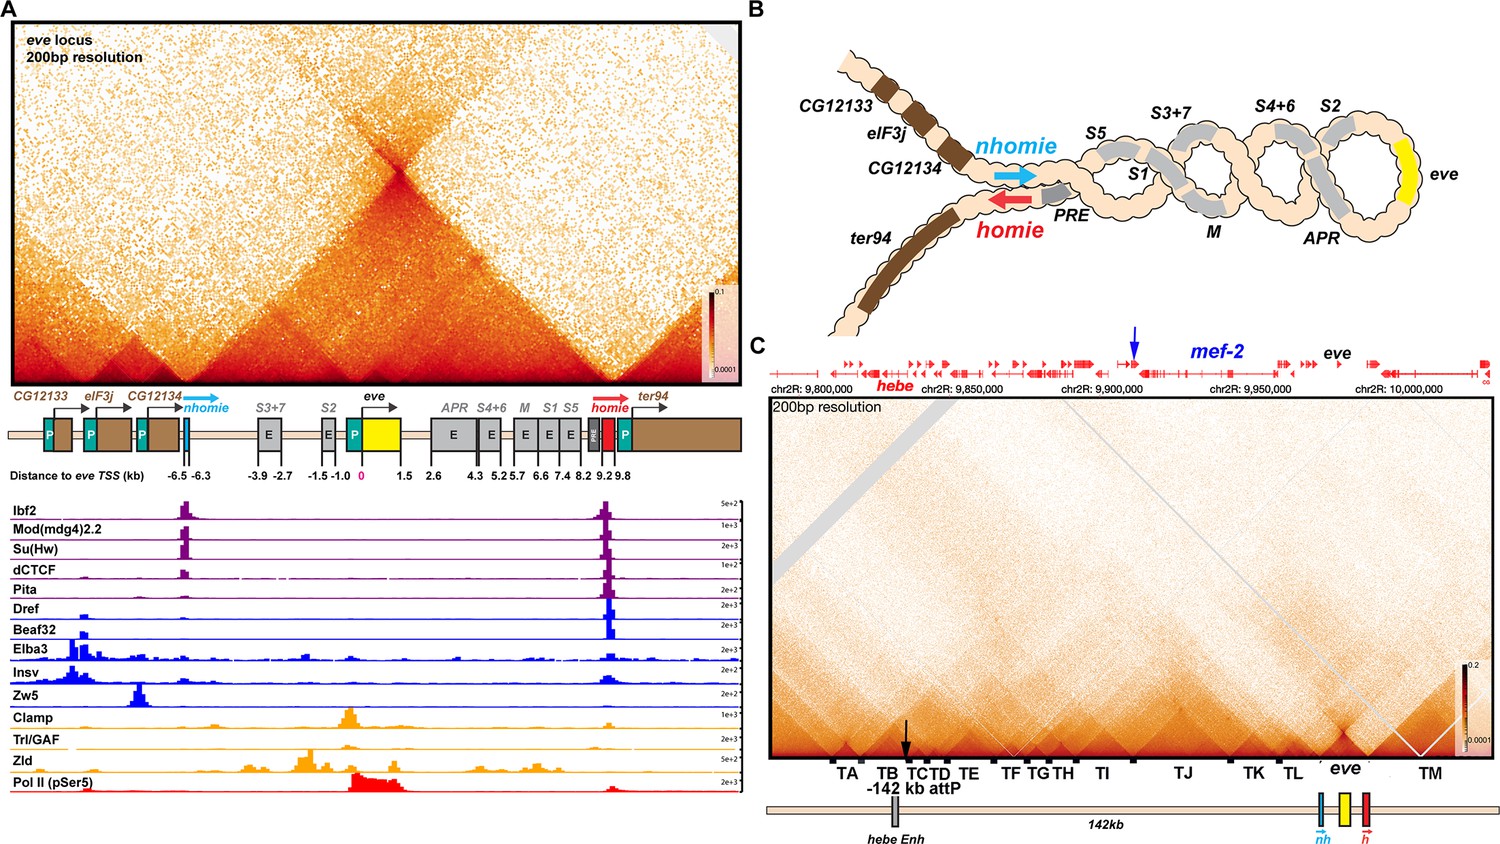
TAD organization of the even-skipped locus and neighboring sequences.
(A) The eve TAD is a volcano with a plume that is anchored by nhomie and homie. ChIP-seq data below the MicroC map indicate that many of the known fly chromosomal architectural proteins are associated with the two eve boundary elements in vivo (Cuartero et al., 2014; Duan et al., 2021; Gaskill et al., 2021; Li et al., 2015; Sun et al., 2015; Ueberschär et al., 2019; Zolotarev et al., 2016). (B) The eve locus forms a stem-loop structure. In this illustration, nhomie pairs with homie head-to-tail, and this forms a stem-loop that brings sequences upstream of nhomie and downstream of homie into contact, as is observed in insulator bypass assays (Kyrchanova et al., 2008a). The eve locus is shown assembled into a coiled ‘30 nM’ chromatin fiber. (C) MicroC contact pattern for the chromosomal region spanning the attP site at –142 kb and the eve locus. Like the eve volcano, this contact pattern was generated using aggregated previously published NC14 data (Batut et al., 2022; Levo et al., 2022). A black arrow indicates the –142 kb locus where transgenes are integrated into the genome. A blue arrow indicates the position of the Etf-QO gene. Note the numerous TADs between the –142 kb hebe locus from the eve ‘volcano TAD’. Individual TADs are labeled TA—TM. Black boxes indicate positions of sequences that, based on ChIP experiments, are bound by one or more known insulator proteins in vivo.
Figure 2—figure supplement 1
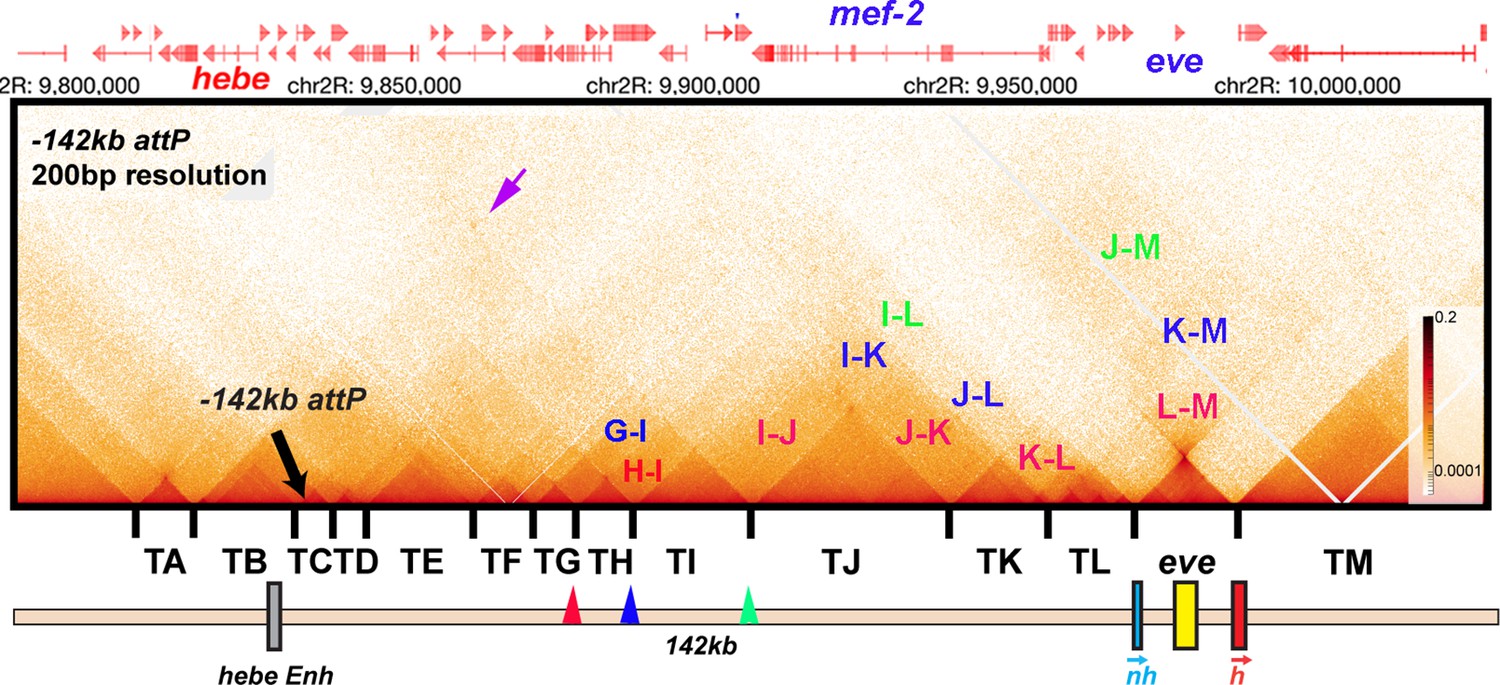
TAD organization of the even-skipped gene and upstream region.
MicroC contact pattern for the chromosomal region spanning the attP site at –142 kb and the eve locus. Like the eve volcano, this contact pattern was generated using aggregated previously published NC14 data (Batut et al., 2022; Levo et al., 2022). The large black arrow indicates the –142 kb locus where transgenes are integrated into the genome. LDC domains are labeled according to the interacting TADs: for example, H-I indicates crosslinking events generated by physical interactions between sequences in two neighboring TADs, TH and TI, while I-J indicates interactions between sequences in TI and TJ. Likewise, G-I indicates crosslinking events generated by physical interactions between sequences in TADs TG and TI, which are separated from each other by TAD TH. Note that unlike the TADs to the left of eve, the eve TAD does not interact frequently with its neighbors. The small purple arrow indicates an interaction ‘dot’ between the boundary marking the border of TA and TB and the boundary marking the border of TI and TJ. Red, blue, and green arrowheads mark boundaries that may engage in partner switching (see text).
Figure 2—figure supplement 2
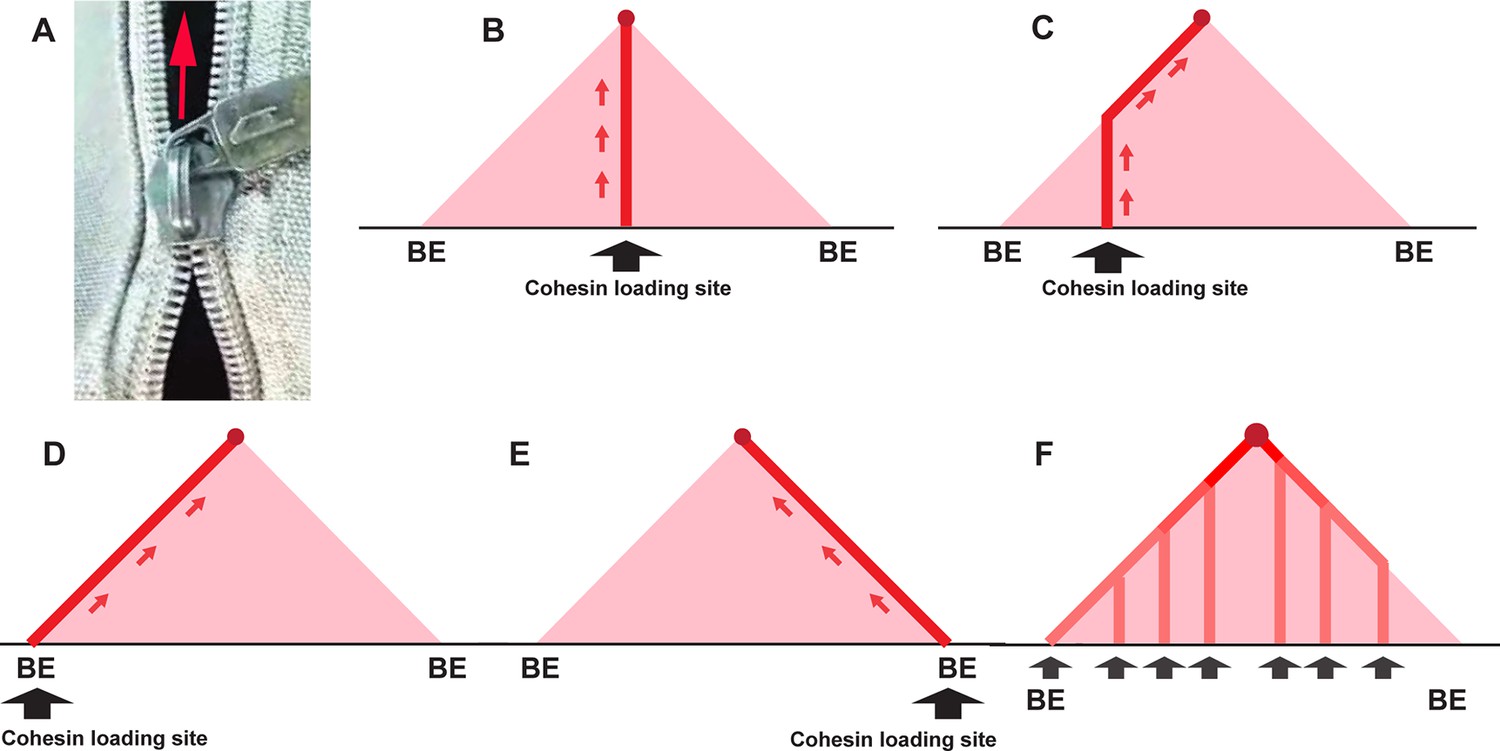
Trouble ahead, trouble behind.
(A) Illustration of a broken zipper — zipping in front but not closing behind. (B) Crosslinking pattern expected for cohesin loading at a site very close to the middle of the TAD-to-be: The vertical line of linked DNA is generated when the two chromatin fibers in the TAD-to-be are transiently linked together as cohesin passes. When cohesin bumps into the CTCF roadblocks (BE) at the boundaries of the TAD, the vertical line stops. (C) Cohesin loading site is offset from center of TAD-to-be to the left. The crosslinking initiates at the loading site and extends vertically until the cohesin complex bumps into the CTCF roadblock on the left. At that point, extrusion of the left chromatin fiber halts, while the chromatin fiber on the right continues to be extruded. The line of crosslinked sequences then extends at a 45° angle until cohesin comes to a halt at the CTCF roadblock on the right. (D, E) The loading site is at or close to the boundary on the left (D) or the right (E). In this case, extrusion will be unidirectional, and the DNAs crosslinked as cohesin passes will form a line that extends at a 45° angle until cohesin comes to a halt at the CTCF roadblock. (F) Cohesin is able to load at multiple sites in the TAD-to-be. In this case, there will be a series of vertical lines whose intensity will be correlated with the relative frequency that a given loading site is used. The vertical lines will extend in each case until cohesin comes to a halt at the closest CTCF roadblock. At that point, the line of crosslinked DNA will extend at a 45° angle until that particular cohesin complex comes to halt at the CTCF roadblock that is farther away. The 45° line of crosslinked DNA will become progressive more intense as it approaches the apex of the triangle. These vertical lines might follow other paths if the loop extrusion is not at equal rates on the two sides, or if it varies stochastically, but even in these cases, the expectation that the 45° lines will be more intense toward the top of the ‘peak’ is still valid.
Figure 2—figure supplement 3
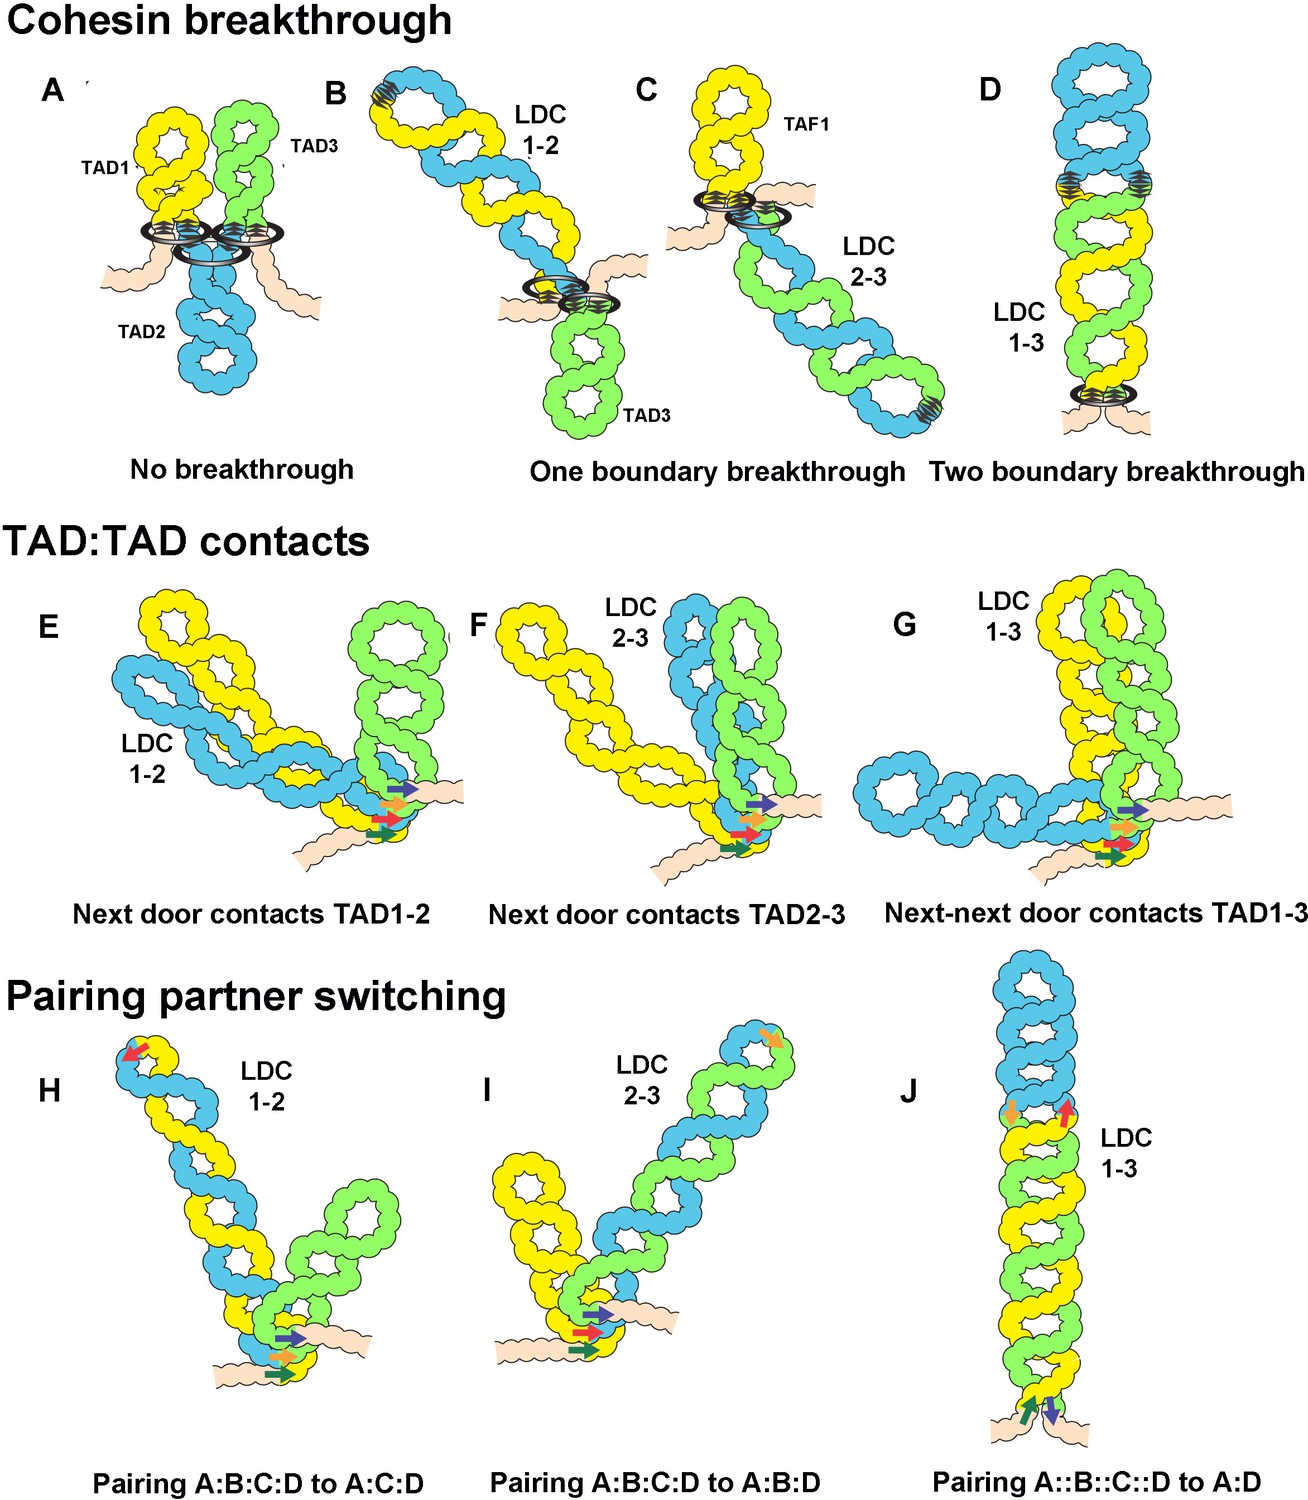
Models for the formation of LDC domains.
Several different mechanisms could explain the LDC domains. (A–D) In the loop-extrusion model, the LDC domains arise because cohesin sometimes breaks through a CTCF roadblock. In (A) there are three primary TADs,: TAD1, TAD2, and TAD3. (B, C) Occasional breakthrough events can generate a secondary TAD, LDC1:2 (TAD1+TAD2) or LDC2:3 (TAD2+TAD3). (D) Even less frequent breakthrough events can generate a tripartite TAD (TAD1+TAD2+TAD3) that will correspond to LDC1:3. (E–G) LDC domains arise because TADs sometimes bump into their neighbors. In E, TAD1 bumps into TAD2 to give LDC1:2, while in F, TAD2 bumps into TAD3 to give LDC2:3. (G) Less frequently, TAD1 bumps into TAD3 to give LDC1:3. (H–J) LDC domains arise because boundaries can switch partners. (H, I) In H, boundary A (dark green arrow) skips boundary B (red arrow) and pairs with boundary C (tan arrow). This generates a new TAD, TAD1+TAD2, which corresponds to LDC domain 1:2. In I, boundary B (red arrow) skips boundary C (tan arrow) and pairs with D (dark blue arrow). This generates a new TAD, TAD2+TAD3, which corresponds to LDC domain 2:3. In J, boundary A (dark green arrow) skips both boundary B (red arrow) and boundary C (tan arrow), which don’t pair with each other, and pairs with boundary D (dark blue arrow). This generates a new TAD, TAD1+TAD2+TAD3, which corresponds to LDC domain 1:3.
Figure 3 with 1 supplement
Schematics of boundary pairing and loop extrusion.
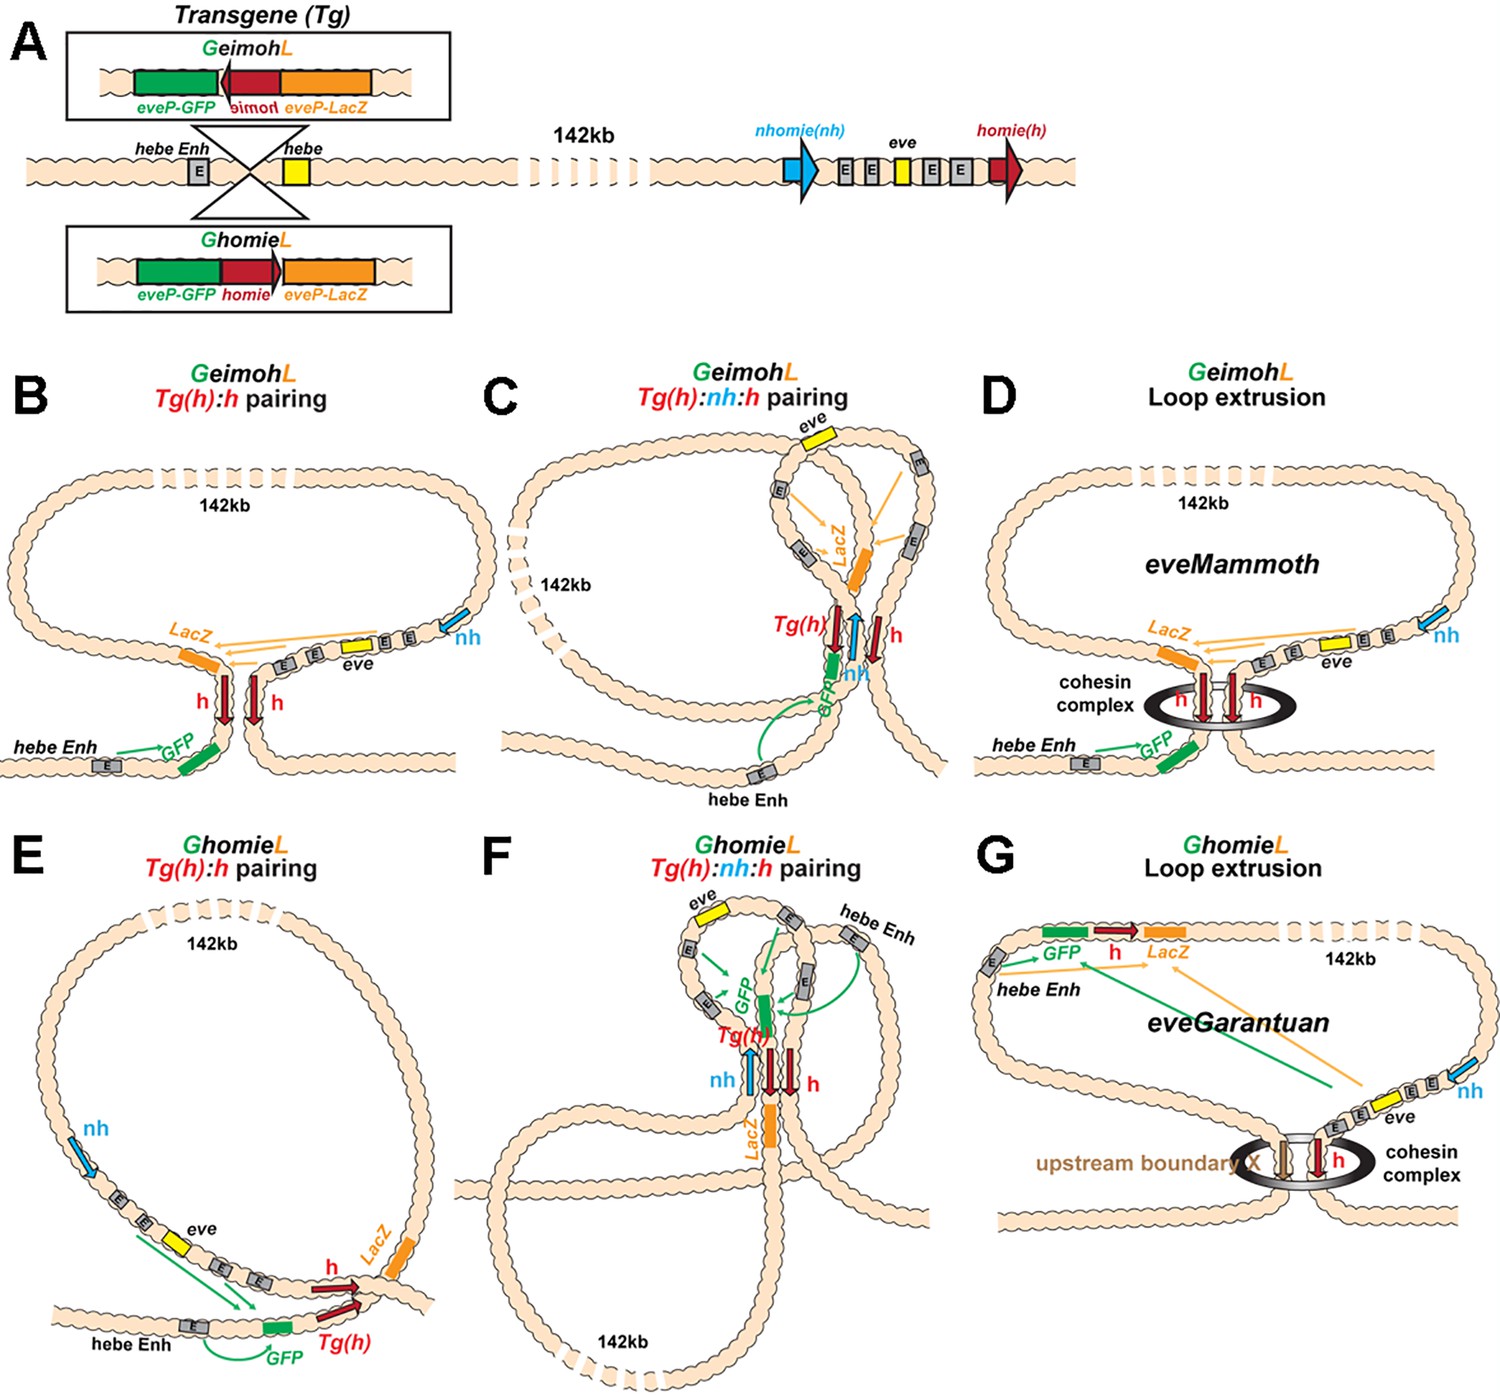
(A) GeimohL and GhomieL transgenes and the eve locus on a linear map. The same color codes are used throughout. In the eve locus, nhomie (blue arrow) and homie (red arrow) are oriented, by convention, so that they are pointing toward the right. This convention is maintained in the two transgenes. In GeimohL, homie (top) is in the opposite orientation from homie in the eve TAD and so is pointing away from the eve TAD. In GhomieL (bottom), homie is in the same orientation as homie in the eve locus, and so is pointing toward the eve TAD. (B) Predicted boundary pairing interactions between GeimohL and the eve TAD. homie in the transgene pairs with homie in the eve TAD head-to-head. Since homie in the transgene is pointing in the opposite orientation from homie in the eve TAD, a stem-loop will be generated. (C) If homie in the transgene also pairs with nhomie in the eve TAD head-to-tail, a loop structure like that shown in C will be generated. In this topology, eve-lacZ is in close proximity to the eve enhancers, and eve-gfp is in contact with the hebe enhancer. (D) Loop-extrusion model for GeimohL. Transgene homie and endogenous homie determine the endpoints of the extruded eveMammoth (eveMa) loop. As in B, the topology of eveMa is a stem-loop. This topology brings eve-lacZ into close proximity to the eve enhancers, while eve-gfp is in another loop that contains the hebe enhancers. (E) Predicted boundary pairing between GhomieL and the eve locus. The GhomieL transgene is inserted in the same chromosomal orientation as GeimohL; however, the homie boundary is inverted so that it is in the same orientation as the eve homie, and so it is pointing toward the eve TAD. homie in the transgene will pair with homie in the eve locus head-to-head, and this generates a circle-loop. (F) If homie in the transgene also pairs with nhomie in the eve TAD, a loop structure like that shown in F will be generated. In this topology, eve-gfp will be activated by both the eve and hebe enhancers. (G) Loop-extrusion model for GhomieL. The cohesin complex bypasses transgenic homie and is stopped at an upstream boundary X, to generate a novel eveGarantuan (eveGa) loop. Both eve-gfp and eve-lacZ are located within the same eveGa TAD, and thus should interact with eve. Since the hebe enhancers are within this TAD as well, they would also be able to activate both reporters.
Figure 3—figure supplement 1
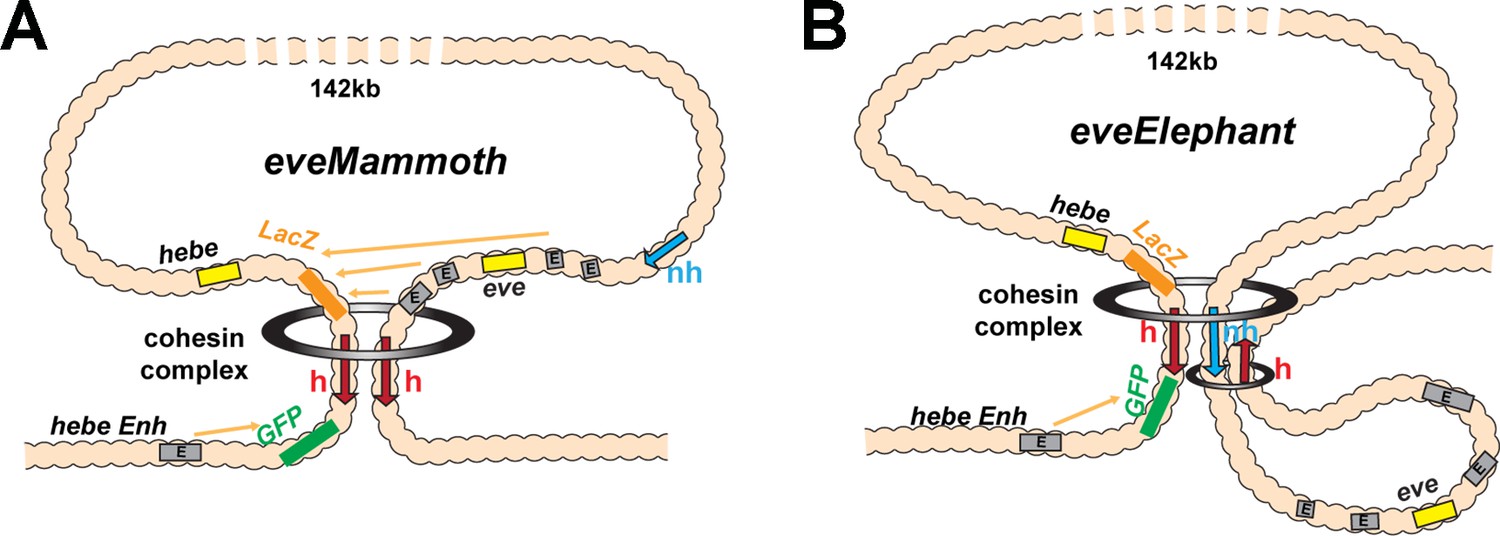
Loop extrusion: eveElephant.
(A) Loop-extrusion orientation-dependent model for LeimohG transgene, as sketched in Figure 3D. This configuration generates eveMa. (B) Instead of running through nhomie, the cohesin complex comes to a halt at the nhomie boundary, generating eveElephant. A second cohesin complex generates the eve TAD by loading at a site within the eve locus. Both eveElephant and the eve TAD are stem-loops. However, while this double stem-loop configuration would explain why the transgene homie makes contact with both nhomie and homie, the eve enhancers are isolated in their own loop and would not interact with the two reporters in the transgene.
Figure 4
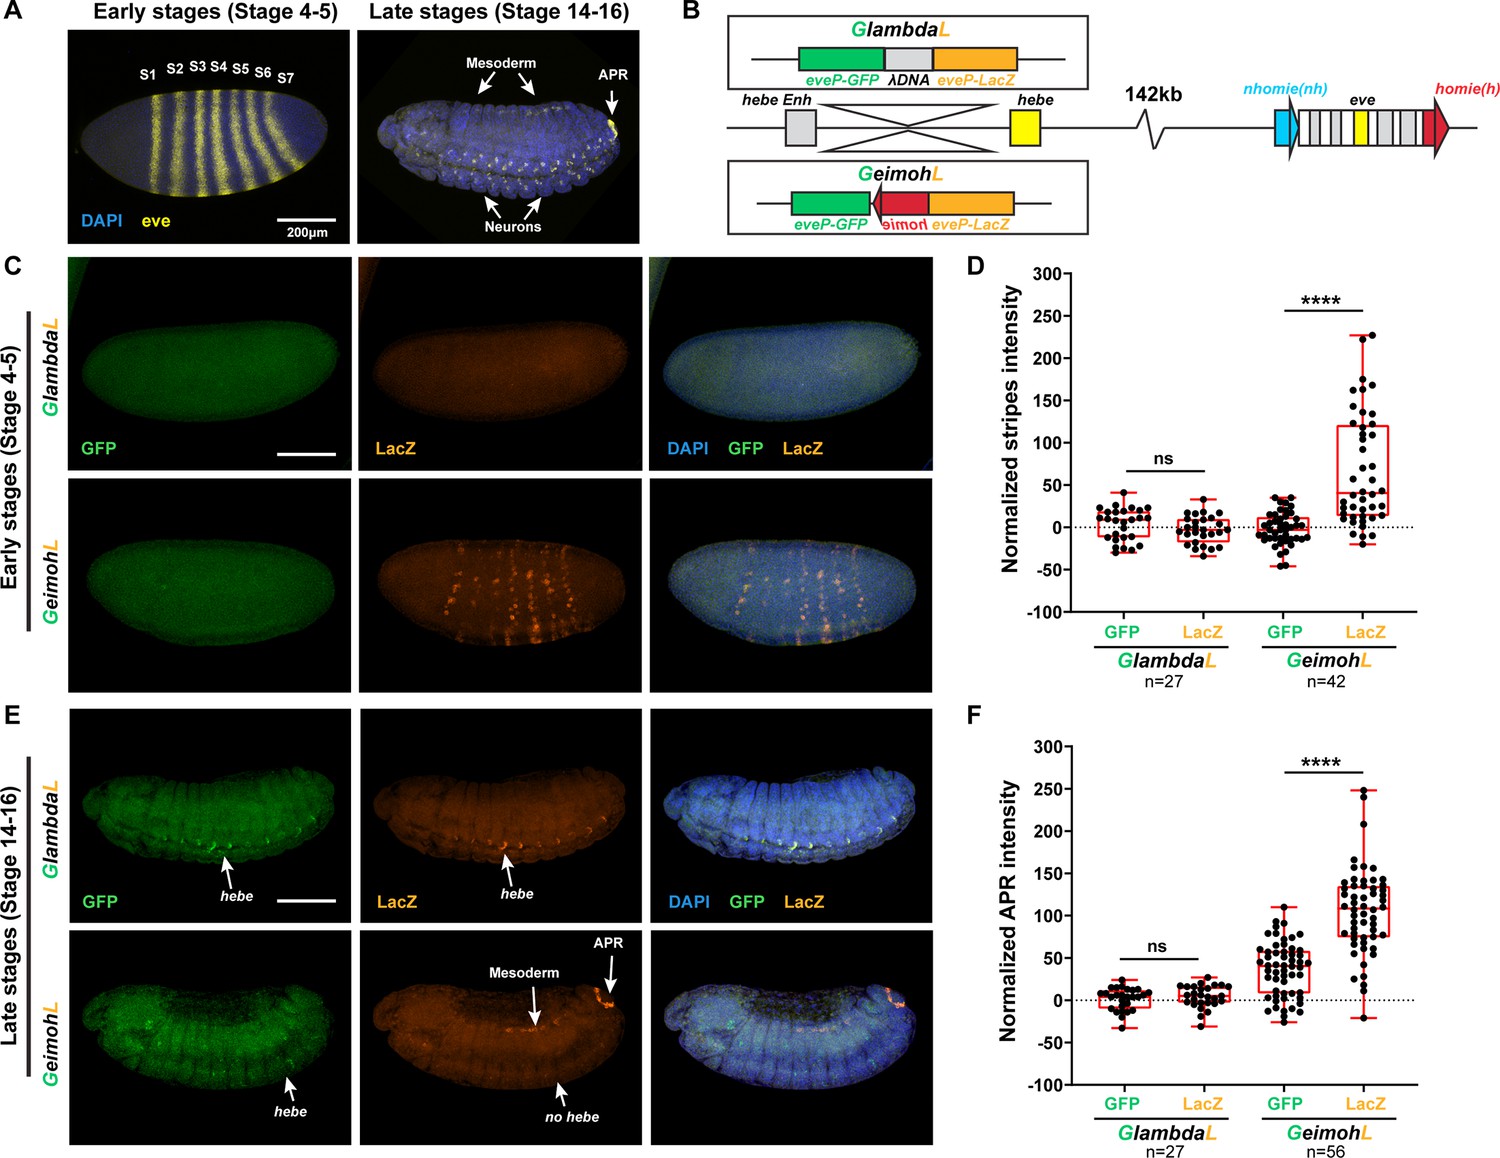
The lacZ reporter is activated by eve enhancers in the GeimohL insert.
(A) Expression patterns of endogenous eve in early (stage 4–5) and late (stage 14–16) embryos by smFISH. eve (Atto 633) probes were used to hybridize with eve mRNA. eve is shown in yellow and DAPI in blue. N>3. (B) Schematics of transgenes. (C) Expression patterns of transgenic reporters in early-stage embryos. Top: GlambdaL; bottom: GeimohL. GFP is in green, lacZ is in orange, and DAPI is in blue, here and in E. (D) Quantification of normalized stripe signals for transgenes shown in C. The reporter smFISH intensity (signal to background), here and in F, was measured, normalized, and plotted as described in Methods. N>3. n=27 for GlambdaL and n=42 for GeimohL. (E) Expression patterns of transgenic reporters in late-stage embryos. Top: GlambdaL; bottom: GeimohL. (F) Quantification of normalized stripe signals for transgenes shown in E. N>3. n=27 for GlambdaL, n=56 for GeimohL. Scale bars = 200 μm. N = # of independent biological replicates. n = # of embryos. The paired two-tailed t-test was used for statistical analysis. ****p<0.0001, ns: not significant. Raw measurements are available in Supplementary file 3.
Figure 5
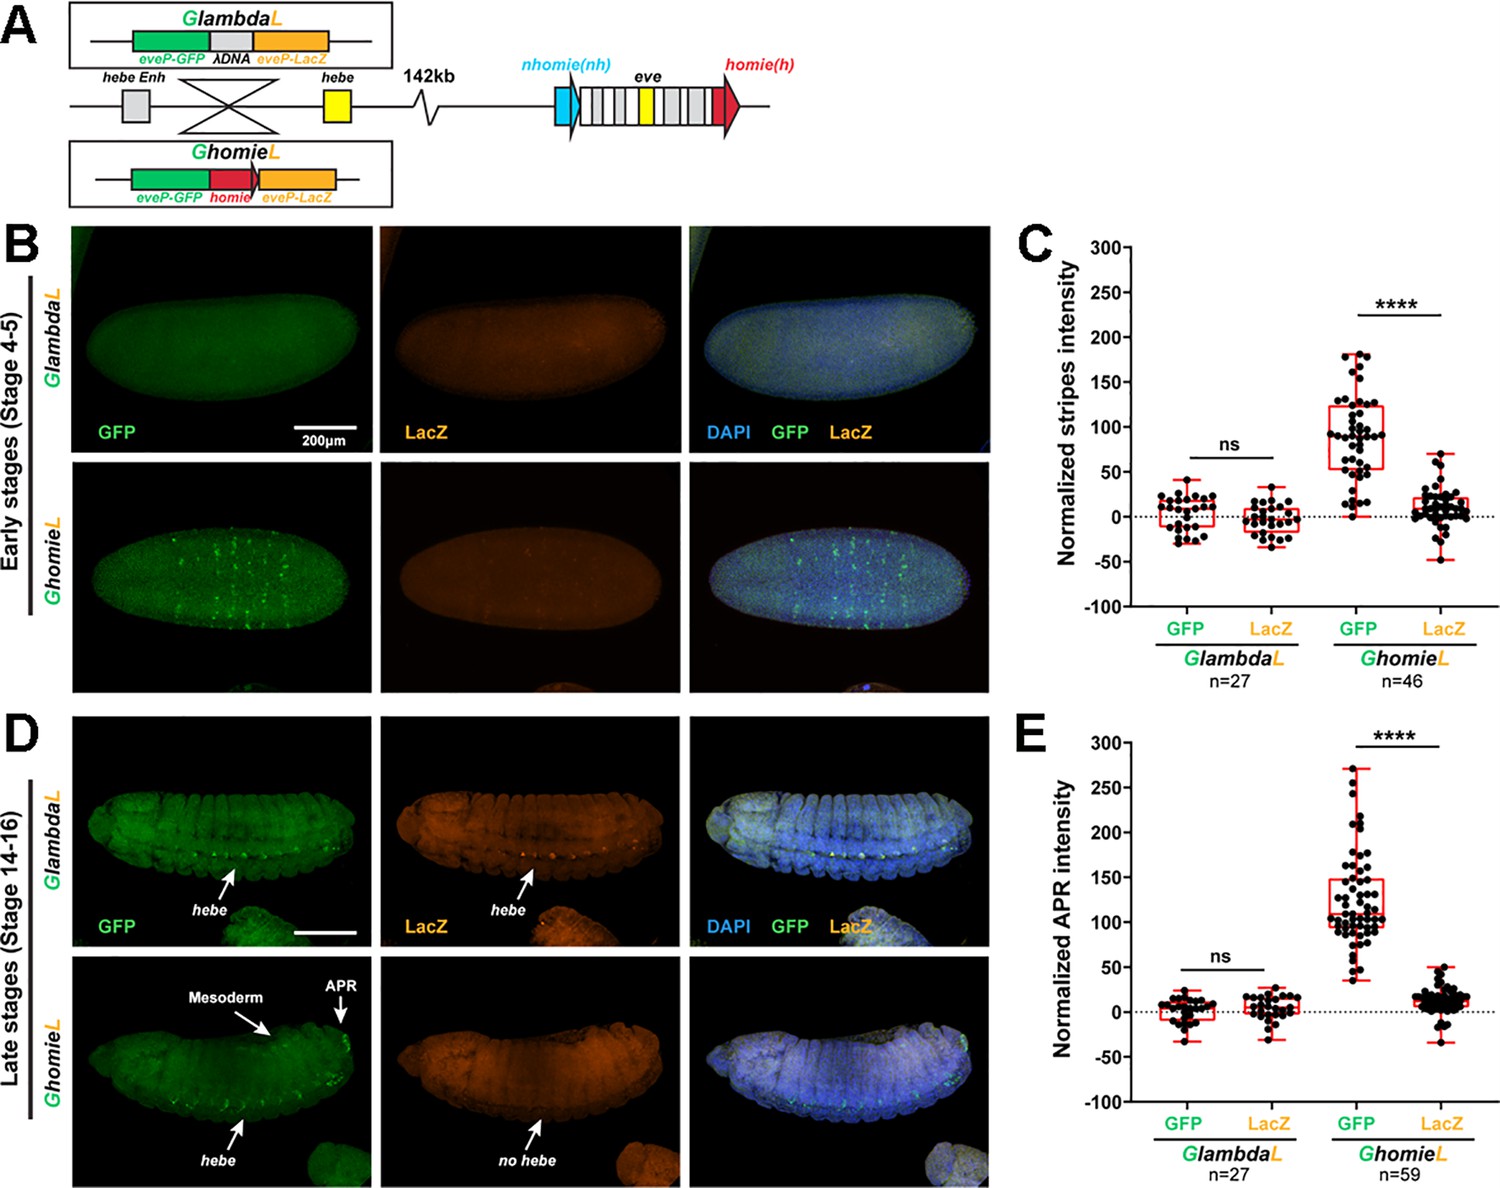
The GFP reporter is activated by both eve and hebe enhancers in the GhomieL insert.
(A) Schematics of transgenes. (B) Expression patterns of transgenic reporters in early-stage embryos. Top: GlambdaL; bottom: GhomieL. GFP is in green, lacZ is in orange, and DAPI is in blue, here and in D. (C) Quantification of normalized stripe signals as represented in B. The reporter smFISH intensity (signal to background) was measured, normalized, and plotted as described in Methods, here and in E. N>3. n=27 for GlambdaL, n=46 for GeimohL. (D) Expression patterns of transgenic reporters in late-stage embryos. Top: GlambdaL; bottom: GhomieL. (E) Quantification of normalized stripe signals for transgenes shown in D. N>3. n=27 for GlambdaL, n=59 for GeimohL. Scale bars = 200 μm. N = # of independent biological replicates. n = # of embryos. The paired two-tailed t-test was used for statistical analysis. ****p<0.0001, ns: not significant. Raw measurements are available in Supplementary file 3.
Figure 6 with 2 supplements
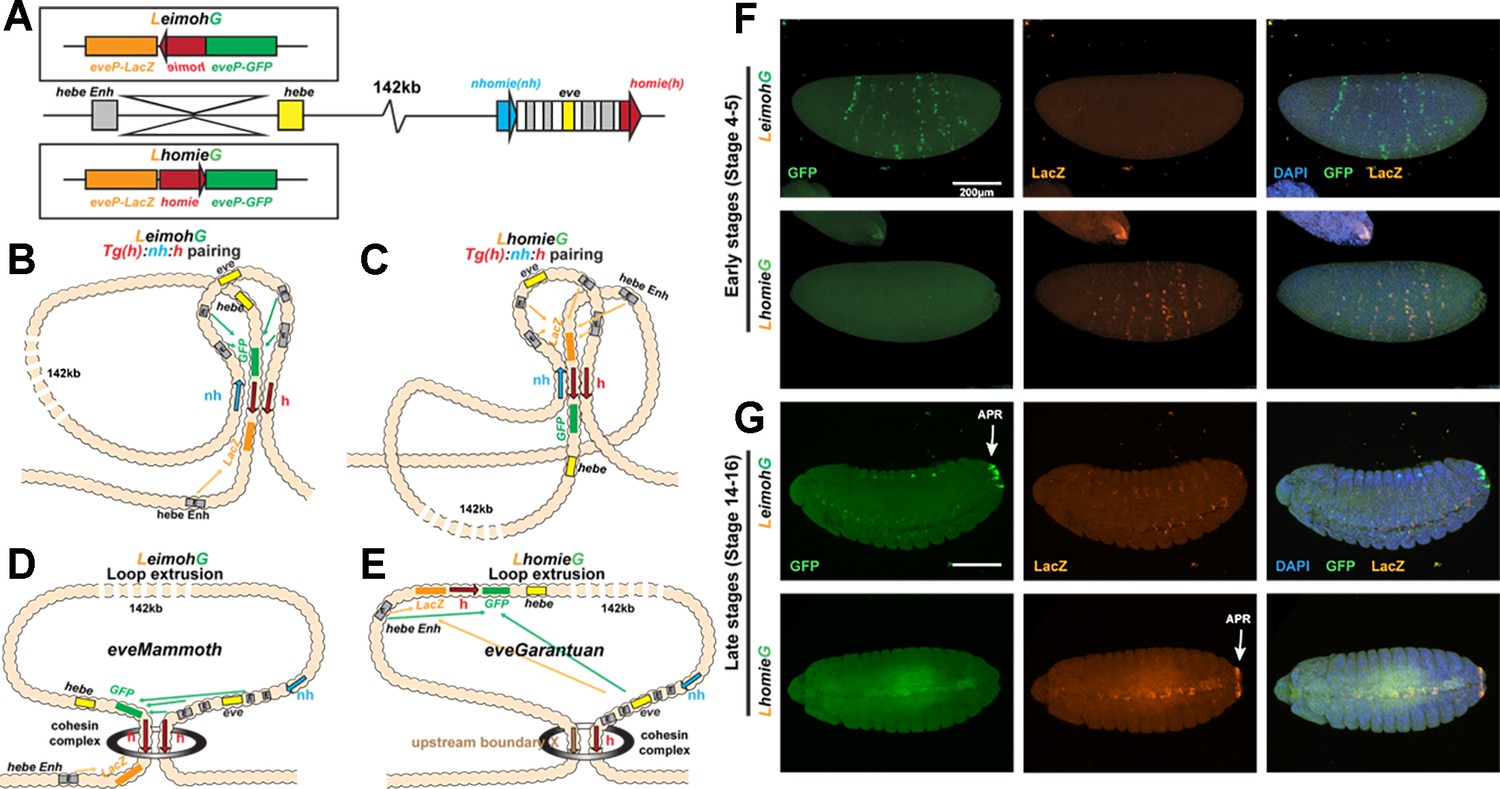
Expression of reporters in the LeimohG and LhomieG inserts.
(A) Schematics of GE transgenes. (B) Boundary pairing for LeimohG transgene long-range interactions. In this topology, GFP is in close proximity to eve enhancers, and lacZ is in contact with the hebe enhancer region. (C) Boundary pairing for the LhomieG transgene. In this topology, lacZ is in close proximity to both the eve enhancers and the hebe enhancers. (D) Loop-extrusion model for LeimohG. Transgenic homie and endogenous homie flank the eveMammoth loop. In this topology, GFP is in close proximity to eve enhancers, and lacZ is close to the hebe enhancers. (E) Loop-extrusion model for the LhomieG transgene. The cohesin complex bypasses transgenic homie and is stopped at an upstream boundary X, to create the eveGarantuan loop. Both GFP and lacZ are at a similar physical distance from eve enhancers and hebe enhancers in this topology. (F) Expression patterns of transgenic reporters in early-stage embryos. Top: LeimohG; bottom: LhomieG. GFP is in green, lacZ is in orange, and DAPI is in blue. N=3, n=24 for both LeimohG and LhomieG. (G) Expression patterns of transgenic reporters in late-stage embryos. Top: LeimohG; bottom: LhomieG. N=3, n=24 for both LeimohG and LhomieG. Scale bars = 200 μm, N = # of independent biological replicates, n = # of embryos. Statistical analysis is in Supplementary file 1.
Figure 6—figure supplement 1

MicroC of LeimohG.
(A) MicroC contact map of LhomieG. Diagram below the contact map shows the homie transgene and the eve TADs. Gray lines are masked regions due to repeat sequences. Interactions between the transgene and the eve TAD are indicated by the boxed region, and this boxed region is also shown in the inset on the right. The inset shows that the physical interactions between LhomieG and sequences in the eve TAD are biased toward the eve-gfp reporter. (B) ‘Virtual 4C’ map from either the lacZ (brown line) or GFP (green line) gene body viewpoints.
Figure 6—figure supplement 2

MicroC of LhomieG.
(A) MicroC map of LhomieG. Diagram below the contact map shows the homie transgene and the eve TADs. Gray lines are masked regions due to repeat sequences. The interaction pattern is the opposite of that observed for LeimohG (Figure 6—figure supplement 1). Instead of interacting with the eve-gfp reporter, sequences in the eve TAD interact preferentially with the eve-lacZ reporter. The relevant region is boxed, and also shown in the inset. (B) ‘Virtual 4C’ map from either the lacZ (brown line) or GFP (green line) gene body viewpoints.
Figure 7
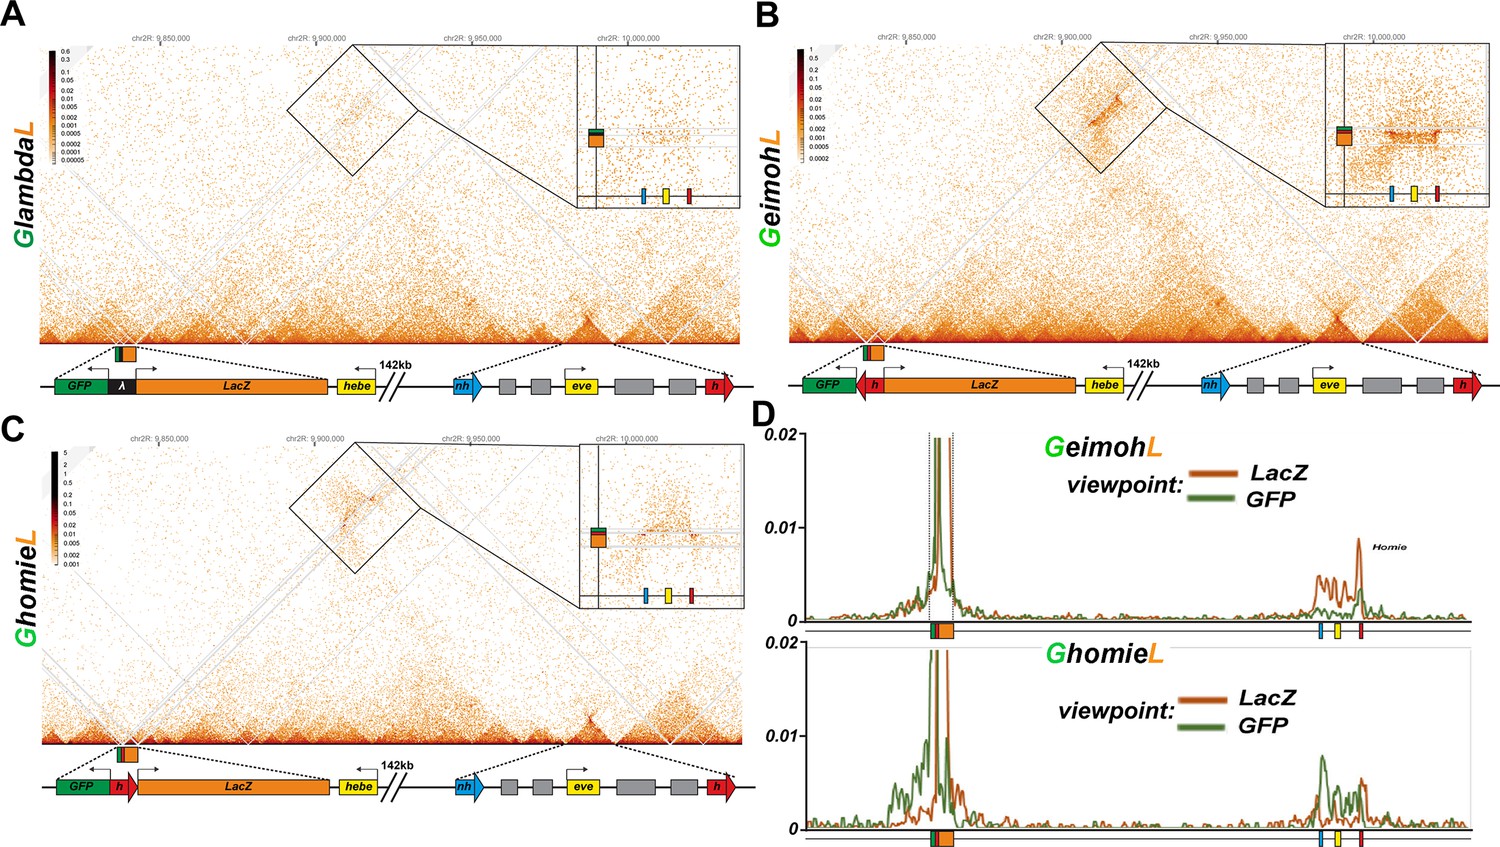
homie in transgenes GeimohL and GhomieL mediates long-range physical interactions with the eve TAD.
Diagrams for (A-C) yellow box: 5’ end of the hebe transcription unit. Transgene: green box: eve-gfp reporter, orange box: eve-lacZ reporter, black box: lambda DNA, red block arrow: homie DNA. eve TAD: blue block arrow: endogenous nhomie, red block arrow: endogenous homie; the directions of block arrows follow the established convention for nhomie and homie; gray boxes: eve enhancers, yellow box: eve transcription unit. (A) MicroC contact profile of the control GlambdaL. Inset shows a blow-up of the contacts between the GlambdaL transgene and the eve TAD. Note a slight increase in interaction frequency (compare to Figure 1A). (B, C) MicroC map of GeimohL and GhomieL, respectively. The key difference between the two inserts is the contacts between transgenes and sequences in the eve TAD. Note the changed pattern of interaction with the endogenous eve locus due to the orientation switch. (D) 'Virtual 4C’ maps obtained from MicroC maps of ‘B’ (top panel) and ‘C’ (bottom panel). Viewpoints are shown in both panels from either the lacZ gene (orange) or the GFP gene (green).
Figure 8 with 1 supplement

homie in the transgene interacts with eve homie and nhomie.
‘Virtual 4C’ maps of the GeimohL and LhomieG (A) or GhomieL and LeimohG (B) transgenes, oriented so that either lacZ (A) or gfp (B) is located upstream of the homie boundary in the transgene. (In the paired configuration, the reporter gene that is upstream of transgenic homie is the one that is brought closer to the endogenous eve enhancers, and so is the one that is expressed in an eve pattern.) Viewpoints are taken from the transgenic homie sequence. The major transgene peak (located toward the left end of each trace) is over the transgenic homie sequence in each case (it is in slightly different places in each pair of traces because the lacZ and gfp reporter genes are different sizes). Note that, in each case, transgenic homie interacts with endogenous homie (far right peak) more than it interacts with endogenous nhomie.
Figure 8—figure supplement 1
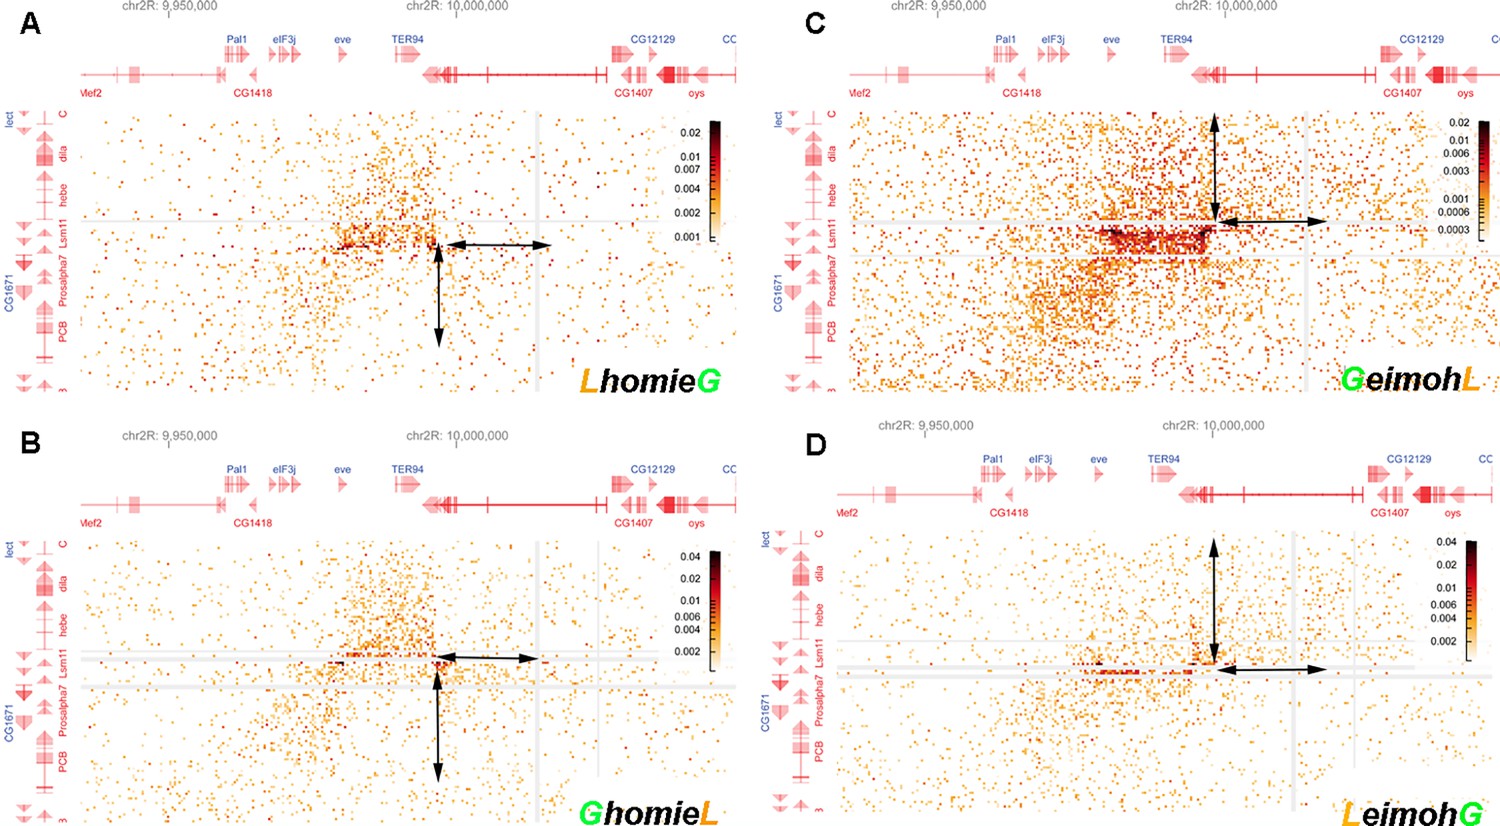
Blowup of interactions generated by the transgene with sequences neighboring –142 kb and the eve TAD.
The interaction pattern indicates that the loop topology changes along with the orientation of transgenic homie. Blow-up of off-diagonal interactions, focused on the interaction between the endogenous eve locus and the –142 kb transgenic insert with (A) LhomieG, (B) GhomieL, (C) GeimohL, or (D) LeimohG. Note the differences in preferential interaction between regions adjacent to transgenic homie and endogenous homie (indicated by the double arrow pairs). In the two cases, where transgenic homie is in the same orientation in the genome as endogenous homie (A, B), regions downstream of the transgene preferentially interact with regions downstream of endogenous homie, in the TER94 TAD. In contrast, when transgenic homie is in the opposite orientation in the genome as endogenous homie (C, D), sequences upstream of the transgene preferentially interact with sequences downstream of endogenous homie (in the TER94 TAD).
Figure 9
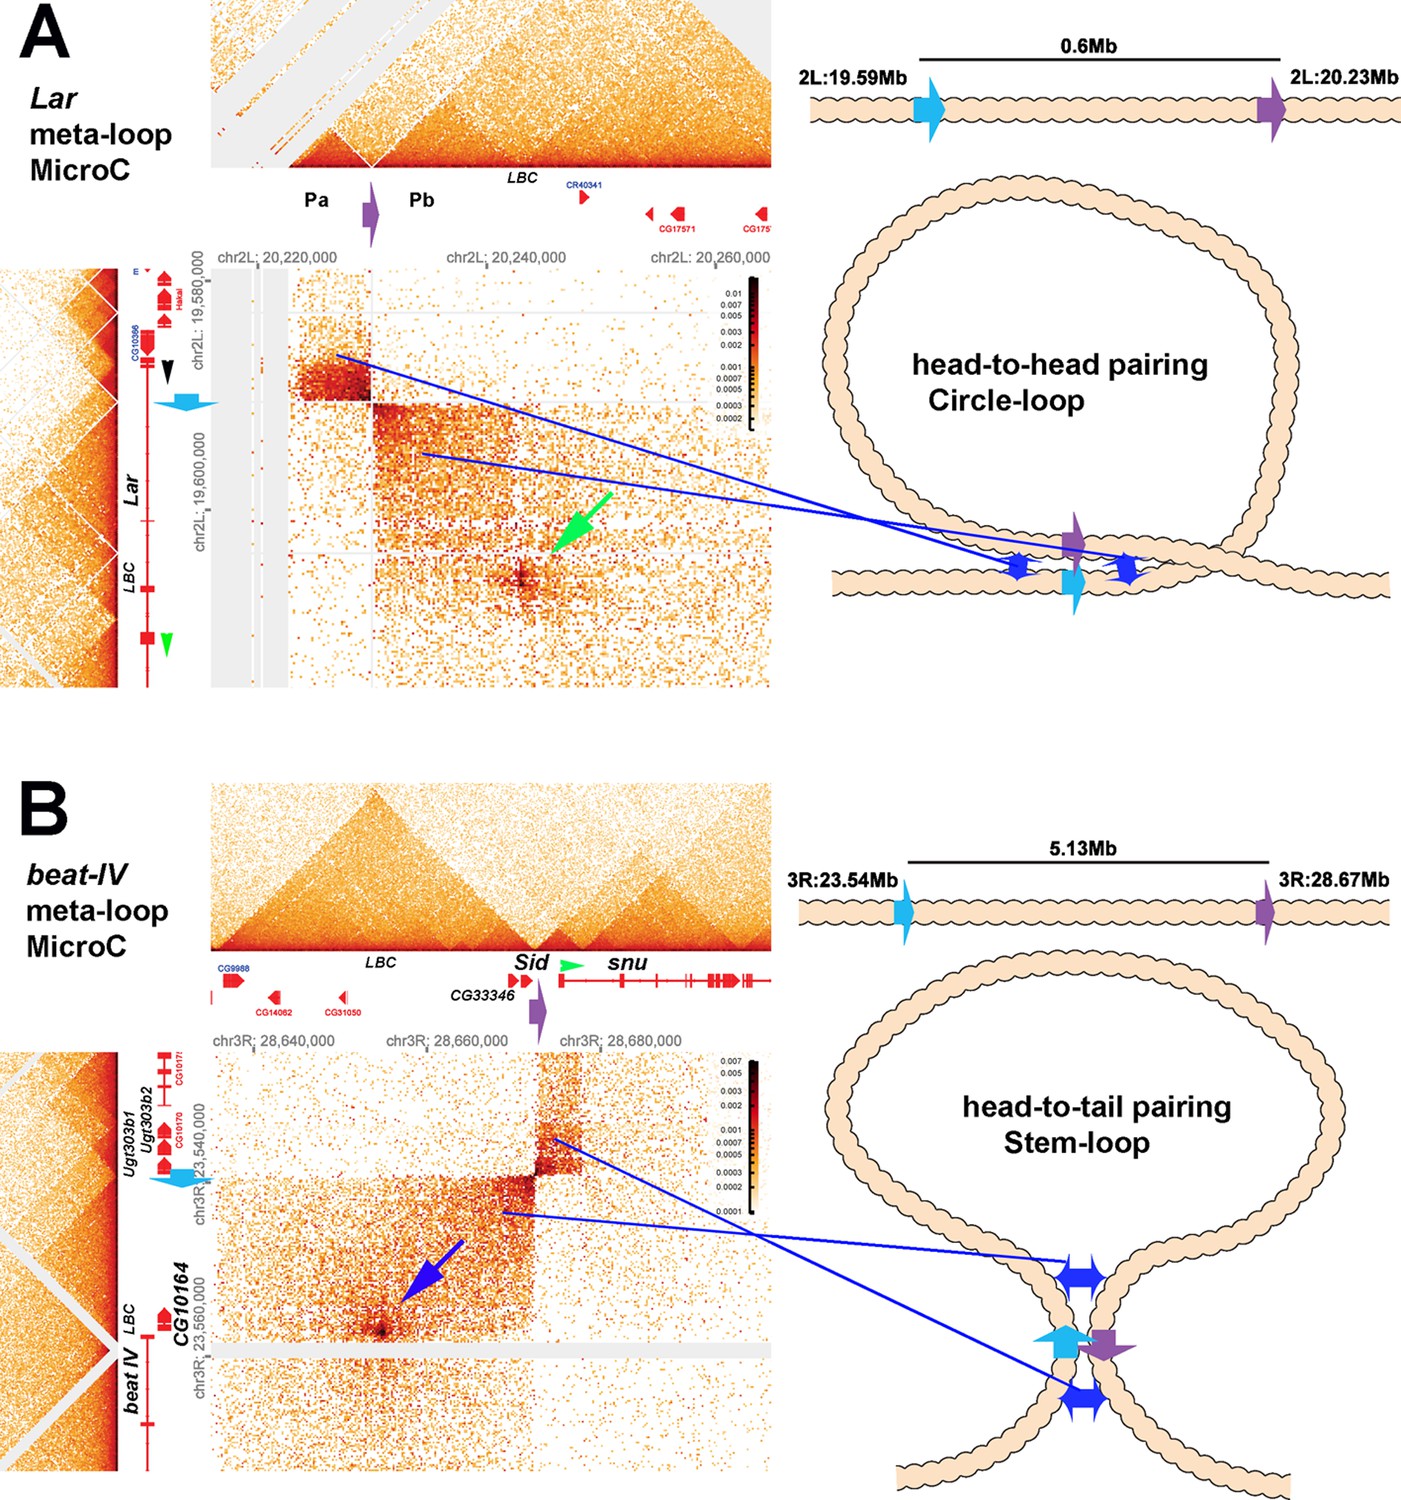
Circle-loop and stem-loop meta-loops.
Distant boundary elements can find and pair with each other, forming large meta-loops. (A) Shows a circle-loop meta-loop formed by the head-to-head pairing of the blue (blue arrow) and purple (purple arrow) boundaries. As described in the text, the blue boundary separates a small TAD that contains the most distal Lar promoter (indicated by the black arrowhead) and a larger TAD that contains part of the Lar transcription unit (and is upstream of an internal Lar promoter: green arrowhead). The purple boundary is located between two TADS, Pa and Pb, in a gene-poor region of the 2nd chromosome approximately 600 kb away, downstream of the Lar gene. When the blue and purple boundaries pair, sequences in the small TAD upstream of the blue boundary come into contact with sequences in the Pa TAD upstream of the purple boundary. This interaction generates the dark rectangle on the upper left side of the interaction plot. Sequences downstream of the blue boundary in the TAD containing part of the Lar transcription unit are also brought into contact with sequences in the Pb TAD downstream of the purple boundary. This interaction generates the larger rectangular box on the bottom right side of the interaction plot. Shown in the diagram on the right is a schematic illustrating that the head-to-head pairing of the blue and purple boundaries generates a~600 kb circle-loop. In the circle-loop configuration, sequences in the TADs upstream of the blue and purple boundaries come into contact with each other, as do sequences downstream of the blue and purple boundaries (blue double arrows). (B) Shows a stem-loop meta-loop formed by the head-to-tail pairing of a boundary (blue arrow) located upstream of the beat IV gene with another boundary (purple arrow) located ~6 Mb away, between the Sid and snu genes. The blue boundary separates a small TAD containing three UDP-glycosyltransferase genes from a larger TAD containing the CG10164 gene and the distal-most promoter of the beat IV gene. The purple boundary separates a ~20 kb TAD containing Sid and four other genes from a small TAD that contains the most distal snu promoter (green arrowhead). When the blue and purple boundaries pair with each other head-to-tail (see diagram on right), this interaction brings sequences in the large TAD downstream of the blue boundary into contact with sequences upstream of the purple boundary in the 20 kb Sid TAD, and this generates the large rectangular box to the lower left of interaction map. The stem-loop configuration also brings sequences upstream of blue boundary in the small TAD containing the three UDP-glycosyltransferase genes into contact with the TAD containing the distal-most snu promoter. This interaction gives a small rectangular box with a high contact density. Sequences in the TAD upstream of the UDP-glycosyltransferase TAD are also brought into contact with the small TAD containing the snu promoter. These two interacting ‘zones’ are indicated by blue double arrows in the diagram on right. In addition to boundary:boundary pairing, both meta-loops have a prominent dot in the larger rectangular boxes indicated by the green (panel A) and blue (panel B) arrows. Based on the ChIP signature of the sequences giving rise to these dots, they likely correspond to elements that are bound by the GAF-containing LBC complex, as indicated in the figure (‘LBC’ in both panels). LBC elements in other contexts function to bring enhancers into contact with promoters (Batut et al., 2022; Kyrchanova et al., 2023; Kyrchanova et al., 2019a; Kyrchanova et al., 2019b; Levo et al., 2022).
Author response image 1
Author response image 2
Author response image 3

Abd-B regulatory domains.
Author response image 4
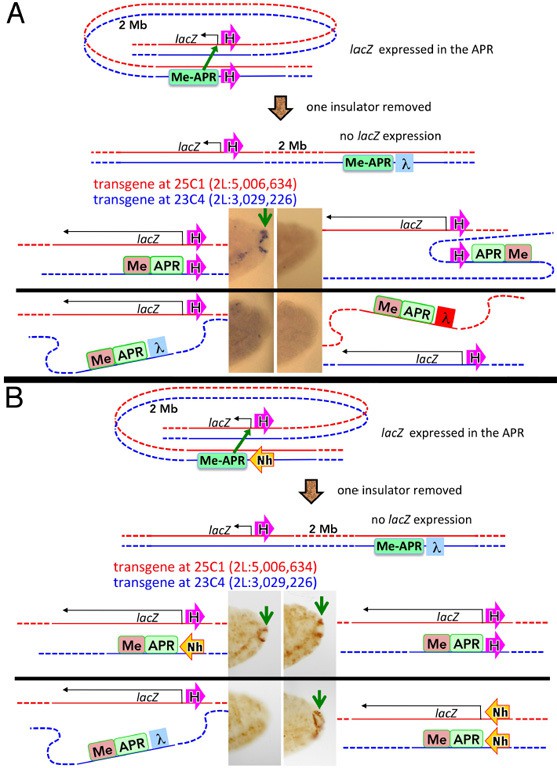
Long-distance (2 Mb) cis regulation mediated by eve insulators.
Author response image 5

Author response image 6

Author response image 7

Author response image 8

Author response image 9
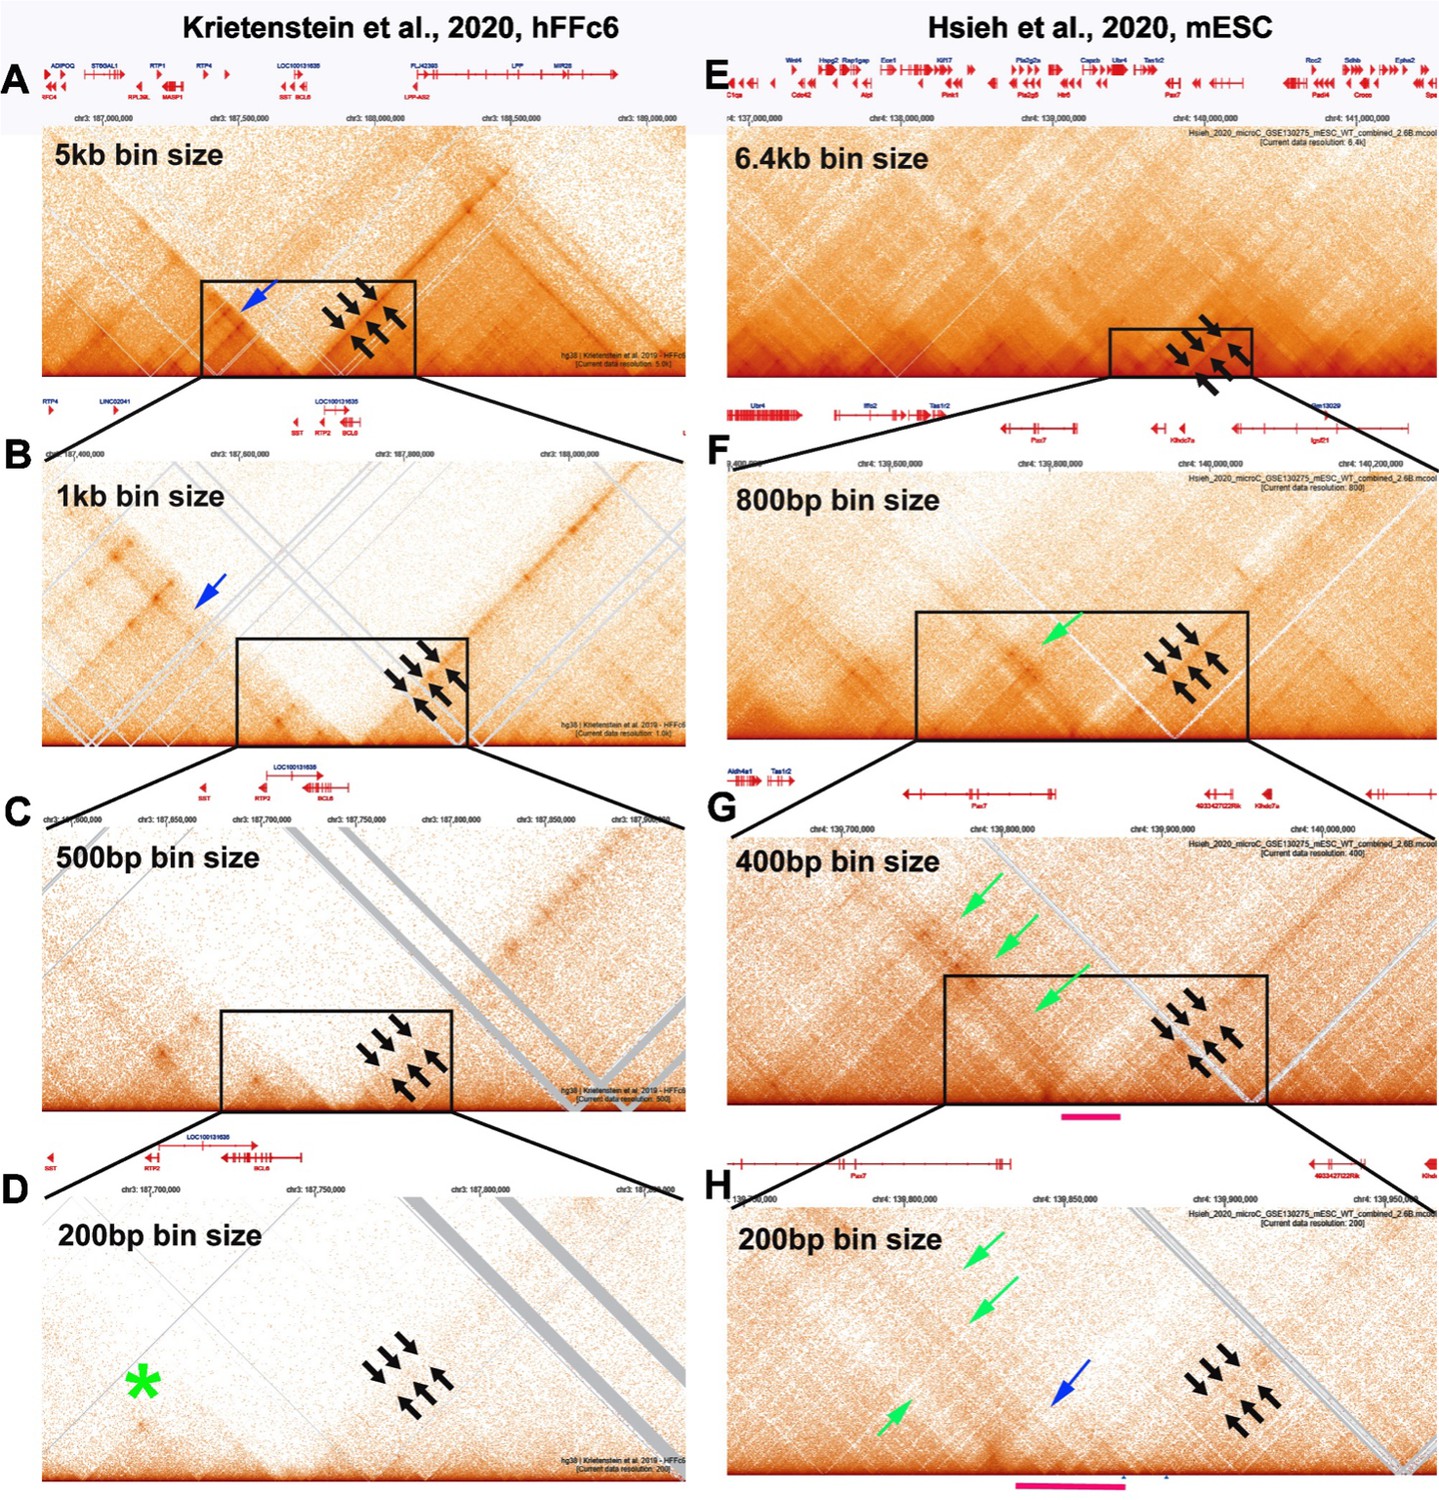
MicroC profiles at different bin sizes.
Author response image 10
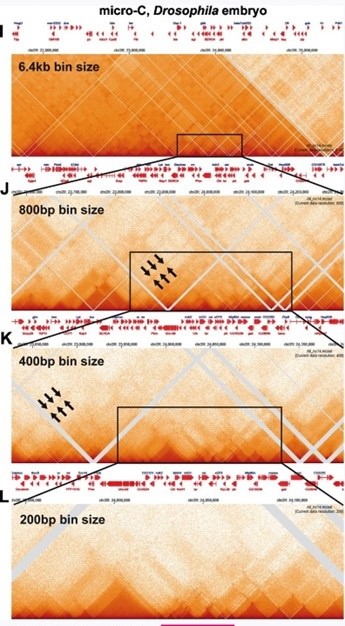
MicroC profiles at different bin sizes.
Author response image 11
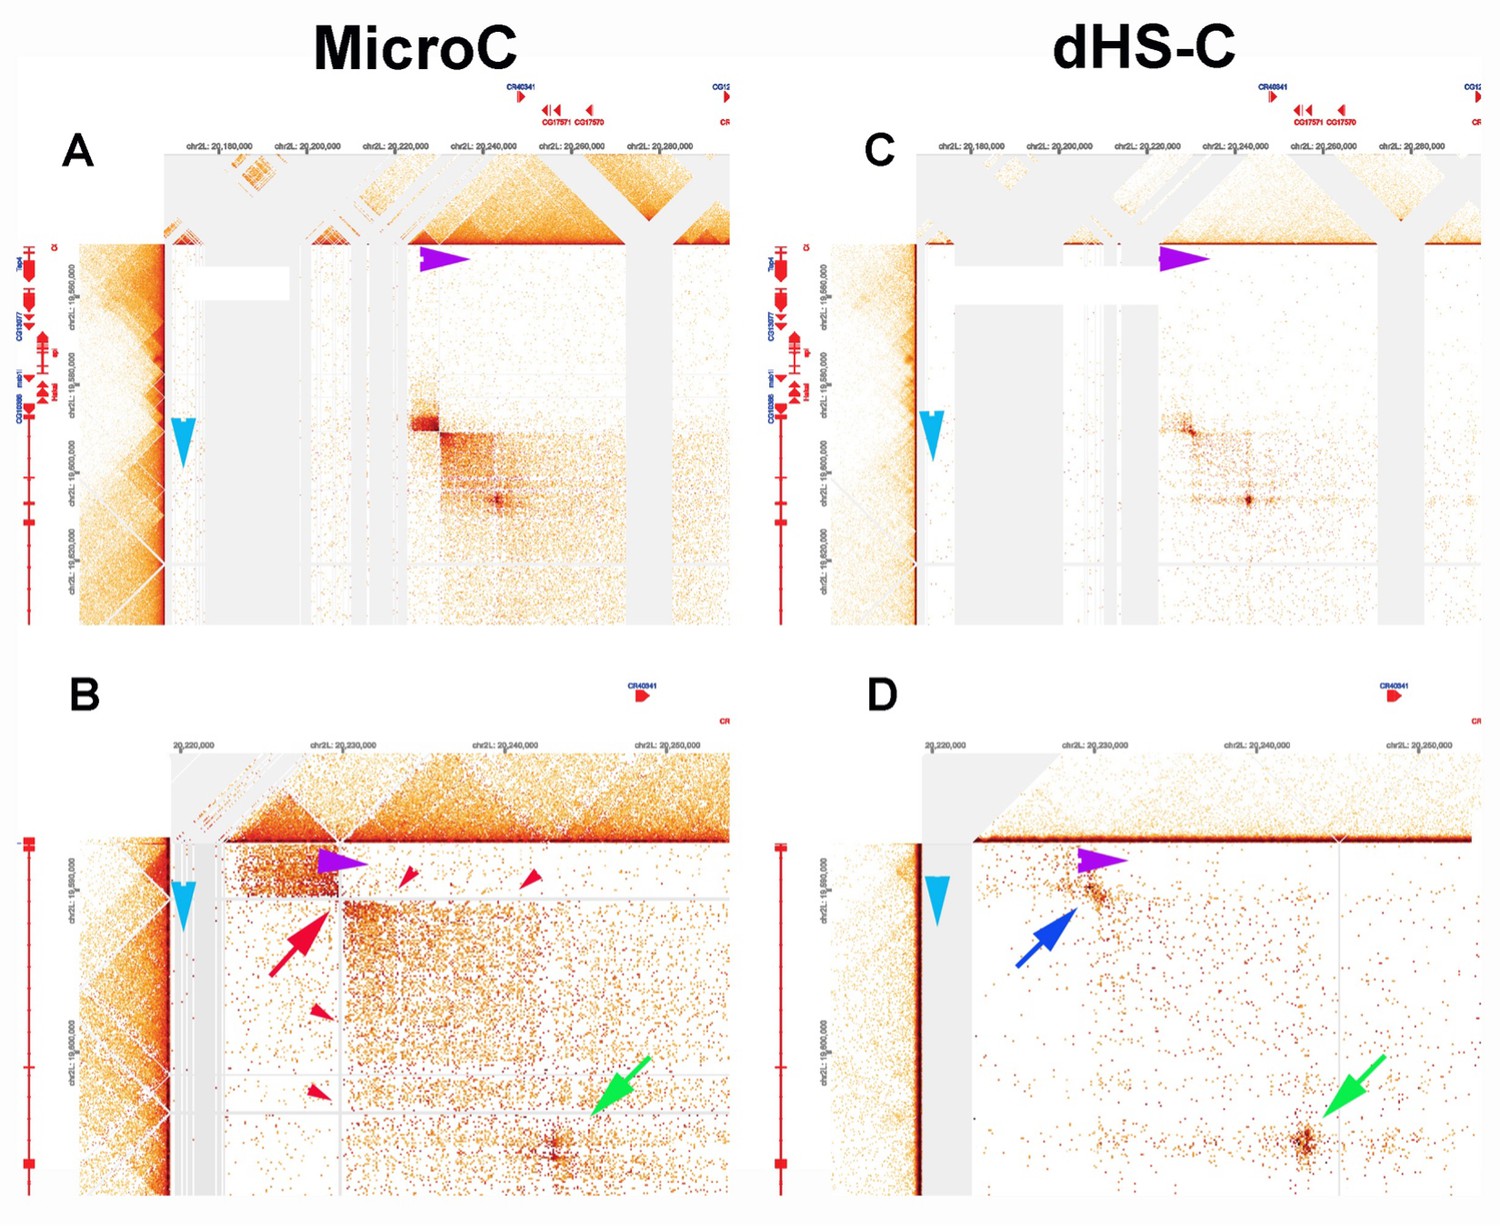
Lar metaloop.
(A, B) MicroC. (C, D) dHS-C.
Author response image 12
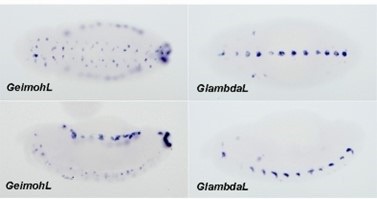
lacZ expression in GiemohL and GlambdaL embryos.
Tables
Appendix 1—key resources table
| Reagent type (species) or resource | Designation | Source or reference | Identifiers | Additional information |
|---|---|---|---|---|
| Gene (Drosophila melanogaster) | eve | Flybase | FBgn0000606 | |
| Gene (D. melanogaster) | hebe | Flybase | FBgn0033448 | |
| Genetic reagent (D. melanogaster) | eve-lacZ:homie:eve-gfp | Fujioka et al., 2016 | ||
| Genetic reagent (D. melanogaster) | eve-lacZ:eimoh:eve-gfp | Fujioka et al., 2016 | ||
| Genetic reagent (D. melanogaster) | eve-gfp:homie:eve-lacZ | Fujioka et al., 2016 | ||
| Genetic reagent (D. melanogaster) | eve-gfp:eimoh:eve-lacZ | Fujioka et al., 2016 | ||
| Chemical compound, drug, solution | n-Heptane | Fisher Chemical | O3008-4 | |
| Chemical compound, drug, solution | Paraformaldehyde 20% solution, EM Grade | Electron Microscopy Sciences | 15,713 S | |
| Chemical compound, drug, solution | Formaldehyde, 16%, methanol free, Ultra Pure | Polysciences Inc | 18814–10 | |
| Chemical compound, drug, solution | PBS - Phosphate-Buffered Saline (10 X) pH 7.4, RNase-free | Thermo Fisher | AM9624 | |
| Chemical compound, drug, solution | Tween 20 | Sigma | P1379 | |
| Chemical compound, drug, solution | Triton X-100 | Bio-Rad | 161–0407 | |
| Chemical compound, drug, solution | Tris base | Sigma | 11814273001 | |
| Chemical compound, drug, solution | Methanol | Fisher Chemical | 203403 | |
| Chemical compound, drug, solution | SSC, 20 X | Thermo Fisher | 15557044 | |
| Chemical compound, drug, solution | Formamide | Thermo Fisher | 17899 | |
| Chemical compound, drug, solution | Dextran sulfate | Sigma | D8906 | |
| Chemical compound, drug, solution | Salmon Sperm DNA | Thermo Fisher | AM9680 | |
| Chemical compound, drug, solution | Ribonucleoside Vanadyl Complex | NEB | S1402S | |
| Chemical compound, drug, solution | Nuclease-free BSA | Sigma | 126609 | |
| Chemical compound, drug, solution | Triethylammonium Acetate | Sigma | 625718 | |
| Chemical compound, drug, solution | dGTP (100 MM) | VWR | 76510–208 | |
| Chemical compound, drug, solution | dTTP (100 MM) | VWR | 76510–224 | |
| Chemical compound, drug, solution | Lonza NuSieve 3:1 Agarose | Thermo Fisher | BMA50090 | |
| Other | T4 DNA ligase | NEB | M0202L | enzyme |
| Chemical compound, drug, solution | Biotin-11-dCTP | Jena Bioscience | NU-809-BIOX | |
| Chemical compound, drug, solution | Biotin-14-dATP | Jena Bioscience | NU-835-BIO14 | |
| Commercial assay or kit | Qubit dsDNA HS Assay Kit | Life Technologies Corp. | Q32851 | |
| Chemical compound, drug, solution | Atto 633 NHS ester | Sigma | 01464 | |
| Chemical compound, drug, solution | Phase Lock Gel, QuantaBio - 2302830, Phase Lock Gel Heavy | VMR | 10847–802 | |
| Commercial assay or kit | NEBNext Ultra II DNA Library Prep Kit for Illumina | NEB | E7645S | |
| Commercial assay or kit | Ampure Xp 5 ml Kit | Thermo Fisher | NC9959336 | |
| Commercial assay or kit | Hifi Hotstart Ready Mix | Thermo Fisher | 501965217 | |
| Commercial assay or kit | Dynabeads MyOne Streptavidin C1 | Life Technologies Corp. | 65001 | |
| Chemical compound, drug, solution | cOmplete, EDTA-free Protease Inhibitor Cocktail | Sigma | 11873580001 | |
| Chemical compound, drug, solution | N,N-Dimethylformamide | Sigma | 227056 | |
| Chemical compound, drug, solution | Potassium acetate solution | Sigma | 95843 | |
| Chemical compound, drug, solution | DSG (disuccinimidyl glutarate) | Thermo Fisher | PI20593 | |
| Other | T4 Polynucleotide Kinase - 500 units | NEB | M0201S | enzyme |
| Other | DNA Polymerase I, Large (Klenow) Fragment - 1000 units | NEB | M0210L | enzyme |
| Commercial assay or kit | End-it DNA End Repair Kit | Thermo Fisher | NC0105678 | |
| Other | Proteinase K recomb. 100 mg | Sigma | 3115879001 | enzyme |
| Other | Nuclease Micrococcal (s7) | Thermo Fisher | NC9391488 | enzyme |
| Chemical compound, drug, solution | EGS (ethylene glycol bis(succinimidyl succinate)) | Thermo Fisher | PI21565 | |
| Commercial assay or kit | Atto 565 NHS ester | Sigma | 72464 | |
| Sequence-based reagent | WK_LacZ_probeset | Biosearch Technologies | Custom FISH probe set | see Supplementary file 2 |
| Sequence-based reagent | WK_GFP_probeset | Biosearch Technologies | Custom FISH probe set | see Supplementary file 2 |
| Sequence-based reagent | WK_eve_probeset | Biosearch Technologies | Custom FISH probe set | see Supplementary file 2 |
| Commercial assay or kit | NEBNext Multiplex Oligos for Illumina | NEB | E7335S | |
| Commercial assay or kit | Dig RNA labeling mixture | Roche | 11277073910 | |
| Commercial assay or kit | T7 RNA polymerase | Roche | 10881767001 | |
| Commercial assay or kit | NEB IN solution | Roche | 11383213001 | |
| Commercial assay or kit | BCIP X-PHOS IN solution | Roche | 11383221001 | |
| Commercial assay or kit | ant-digoxigenin-ap | Roche | 11093274910 | |
| Software, algorithm | Fiji (ImageJ) | Schindelin et al., 2012 | fiji.sc | |
| Software, algorithm | NIS element | Nikon | https://microscope.healthcare.nikon.com/products/software/nis-elements | |
| Software, algorithm | GraphPad Prism 8 | GraphPad Software | https://www.graphpad.com/ | |
| Software, algorithm | HiGlass | Kerpedjiev et al., 2018 | https://higlass.io/app | |
| Software, algorithm | bwa | Li and Durbin, 2009 | https://bio-bwa.sourceforge.net/ | |
| Software, algorithm | samtools | GitHub/open source | https://samtools.github.io/ | |
| Software, algorithm | pairsamtools | Goloborodko et al., 2024 | https://github.com/mirnylab/pairsamtools | |
| Software, algorithm | pairix | Lee, 2024 | https://github.com/4dn-dcic/pairix | |
| Software, algorithm | cooler | Abdennur and Mirny, 2020; Abdennur, 2016 | https://github.com/open2c/cooler | |
| Software, algorithm | Miniconda | Anaconda | https://docs.anaconda.com/miniconda.html | |
| Software, algorithm | Snakemake | GitHub/open source | https://snakemake.github.io/ |
Additional files
-
Supplementary file 1
Statistical analysis of reporter expression in the LeimohG and LhomieG transgene inserts.
- https://cdn.elifesciences.org/articles/94070/elife-94070-supp1-v1.xlsx
-
Supplementary file 2
smFISH oligo probes.
- https://cdn.elifesciences.org/articles/94070/elife-94070-supp2-v1.docx
-
Supplementary file 3
Imaging data.
- https://cdn.elifesciences.org/articles/94070/elife-94070-supp3-v1.xlsx
-
MDAR checklist
- https://cdn.elifesciences.org/articles/94070/elife-94070-mdarchecklist1-v1.pdf
Download links
A two-part list of links to download the article, or parts of the article, in various formats.
Downloads (link to download the article as PDF)
Open citations (links to open the citations from this article in various online reference manager services)
Cite this article (links to download the citations from this article in formats compatible with various reference manager tools)
Chromosome structure in Drosophila is determined by boundary pairing not loop extrusion
eLife 13:RP94070.
https://doi.org/10.7554/eLife.94070.3


