Stem-loop and circle-loop TADs generated by directional pairing of boundary elements have distinct physical and regulatory properties
- Department of Molecular Biology, Princeton University, United States
- Department of Biochemistry and Molecular Biology, Thomas Jefferson University, United States
Figures
Figure 1
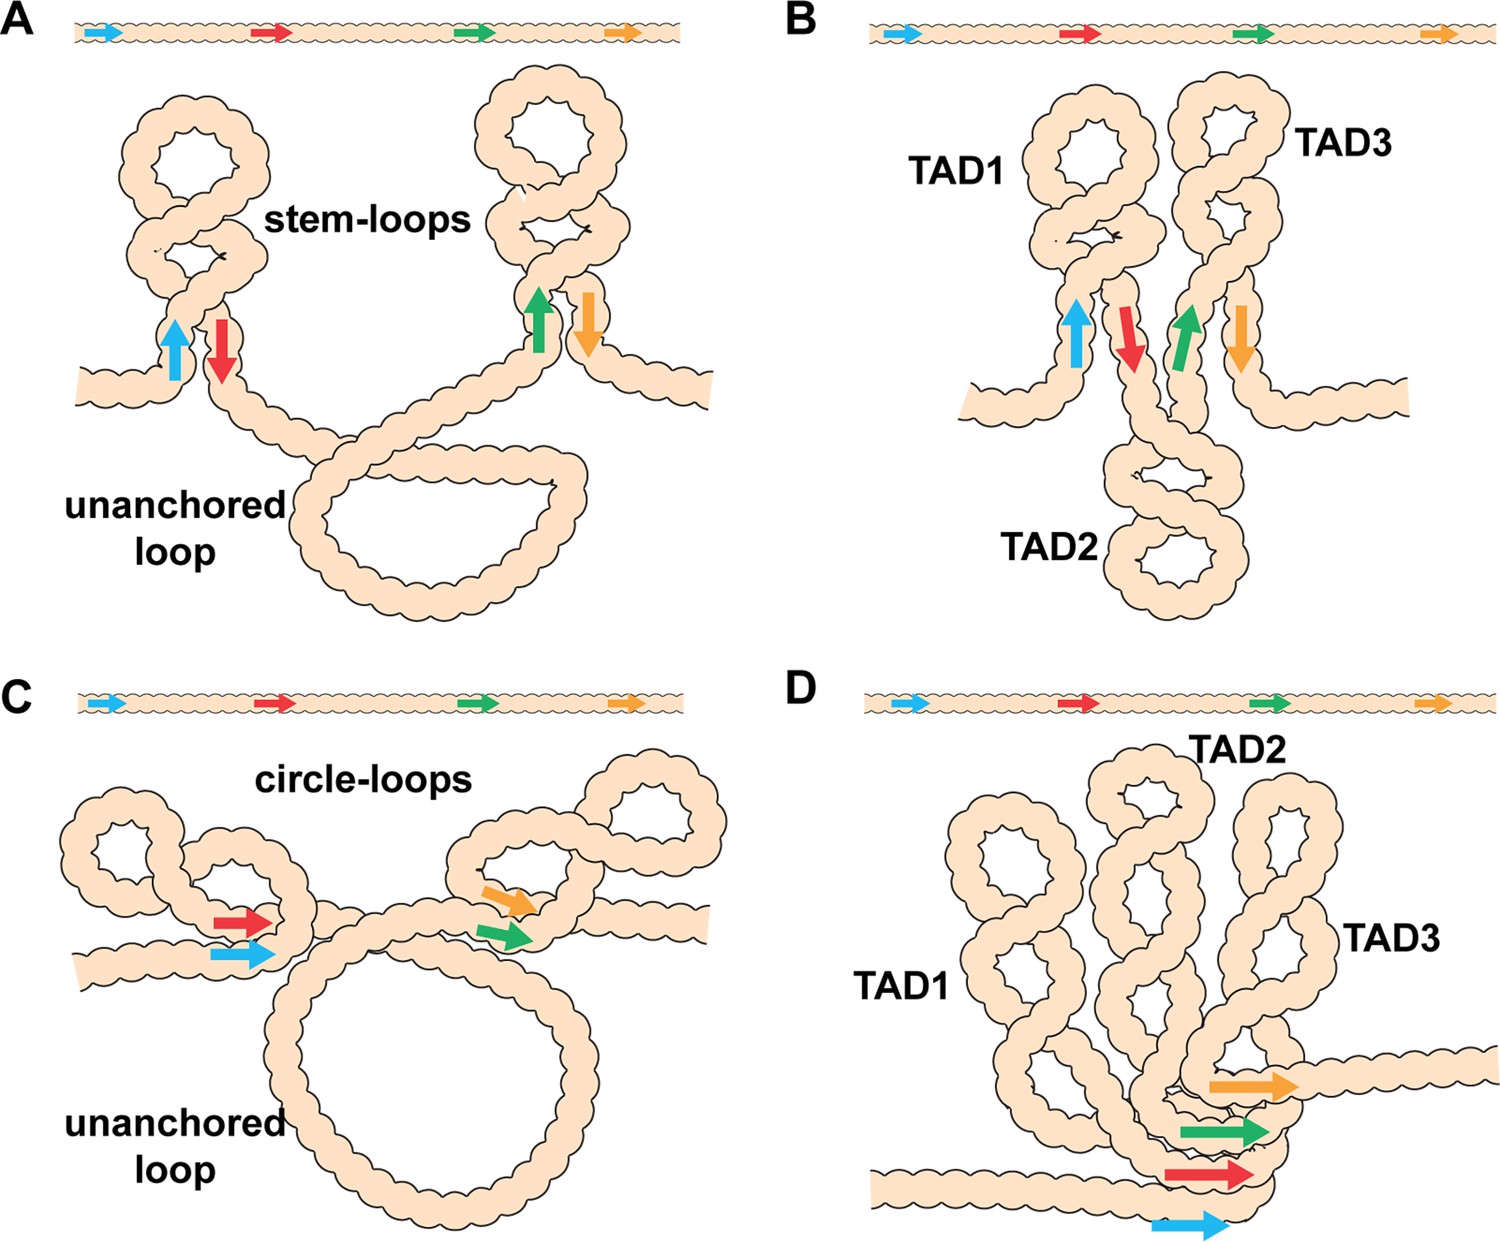
Diagram of the possible loop topologies generated by head-to-head and head-to-tail pairing.
(A) Head-to-tail boundary pairing (arrows) generates a series of stem-loops linked together by an unanchored loop. In this case, the main axis of the chromosome would correspond to the unanchored loops connecting different stem-loops. (B) If boundaries pair with both neighbors (head-to-tail), the stem-loops would be linked to each other by the paired boundaries. In this case the main axis of the chromosome would correspond to the paired boundaries. (C) Head-to-head boundary pairing generates a series of circle-loops linked together by an unanchored loop. The unanchored loop will be the main axis of the chromosome. (D) If boundaries pair with both neighbors (head-to-head), the chromatin fiber will be organized into a series of circle-loops connected to each other at their base, and these paired boundaries will define the chromosomal axis. In both (B) and (D), the pairing interactions between the blue and red boundaries need not be in register with the pairing of the red boundary to the next-door green boundary. In this case, the main axis of the chromosome may bend and twist, and this could impact the relative orientation of the stem-loops/circle-loops. More complex structures would be generated by mixtures of stem-loops and circle-loops.
Figure 2 with 1 supplement
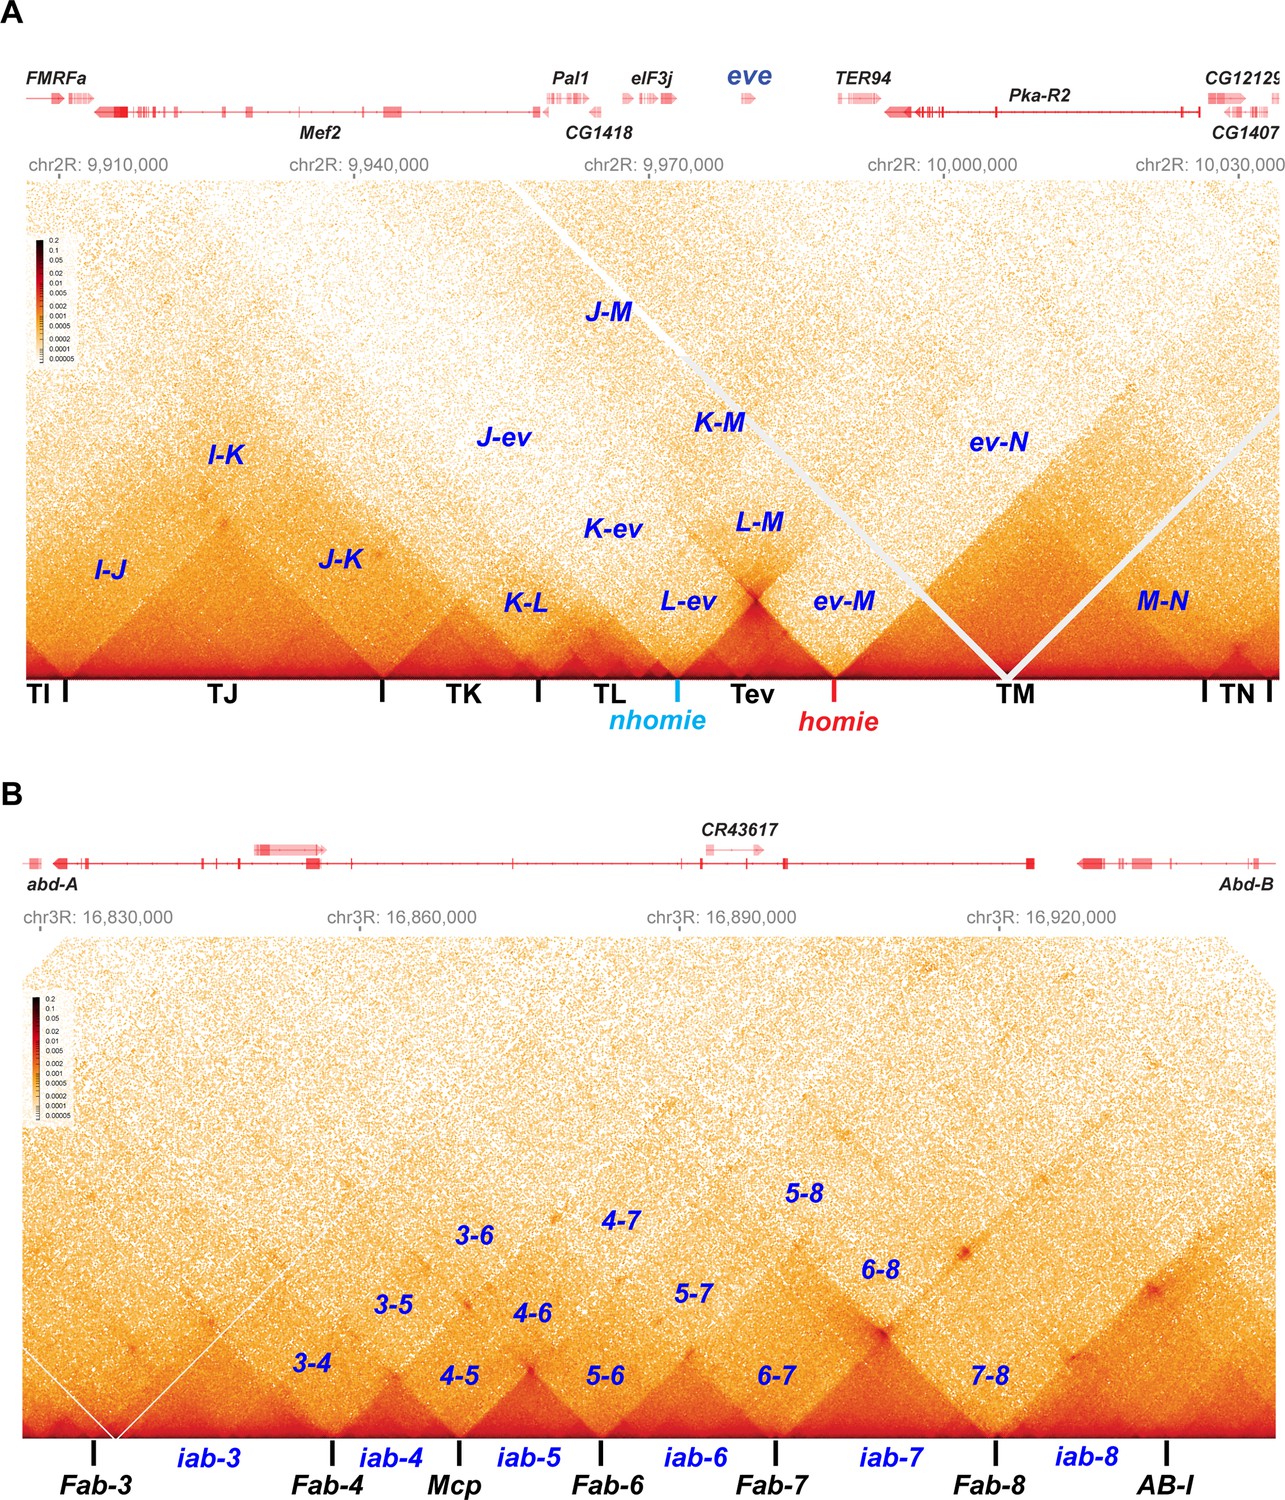
Stem-loops and circle-loops.
“Once in a while you get shown the light in the strangest of places if you look at it right.”a MicroC contact profile for Drosophila wild-type (yw) NC14 embryos. The bin size for each panel is 200 bp. (A) eve and neighboring TADs (TI, TJ, TK TL, TM, and TN). The eve TAD is a volcano with a plume that is anchored by nhomie (nh) and homie (h). The plume is generated by crosslinking of sequences in the two neighboring TADs. At the bottom of the plume, TL sequences are linked to sequences in TM close to eve, including TER94. At the next level, sequences in TK are linked to TM (region K-M). In addition, sequences in TL are linked to sequences in TM located beyond the TER94 gene. At the next level, sequences in TJ are linked to sequences in TM. Note that interactions between sequences in TL and TJ and sequences in TM close to the eve TAD are somewhat less frequent than those farther away from the eve TAD. Sequences in the neighboring TADs also interact with each other, as indicated. For example, sequences in TK and TJ interact with each other (J–K) and also interact with sequences in TI (I–K and I–J). (B) The BX-C gene Abd-B and the parasegment- (PS-) specific regulatory domains iab-3, iab-4, iab-5, iab-6, iab-7, and iab-8. iab-4 regulates the abd-A gene in PS9, while iab-5 – iab-8 regulate Abd-B in PSs 10–13, respectively. These domains are separated from each other by the boundary elements Fab-4, Mcp, Fab-6, Fab-7, and Fab-8, as indicated. The AB-I boundary is located upstream of the Abd-B promoter. Each regulatory domain corresponds to a TAD. Though partially insulated from each other, each TAD interacts with its immediate neighbors. For example, iab-5 interacts with its immediate neighbors iab-4 and iab-6 to give 4–5 and 5–6, respectively. It also interacts with the next-next-door neighbor iab-7 (5-7) and even its next-next-next-door neighbor iab-8 (5-8). (a From ‘Scarlet Begonias’ by the Grateful Dead, 1974).
Figure 2—figure supplement 1
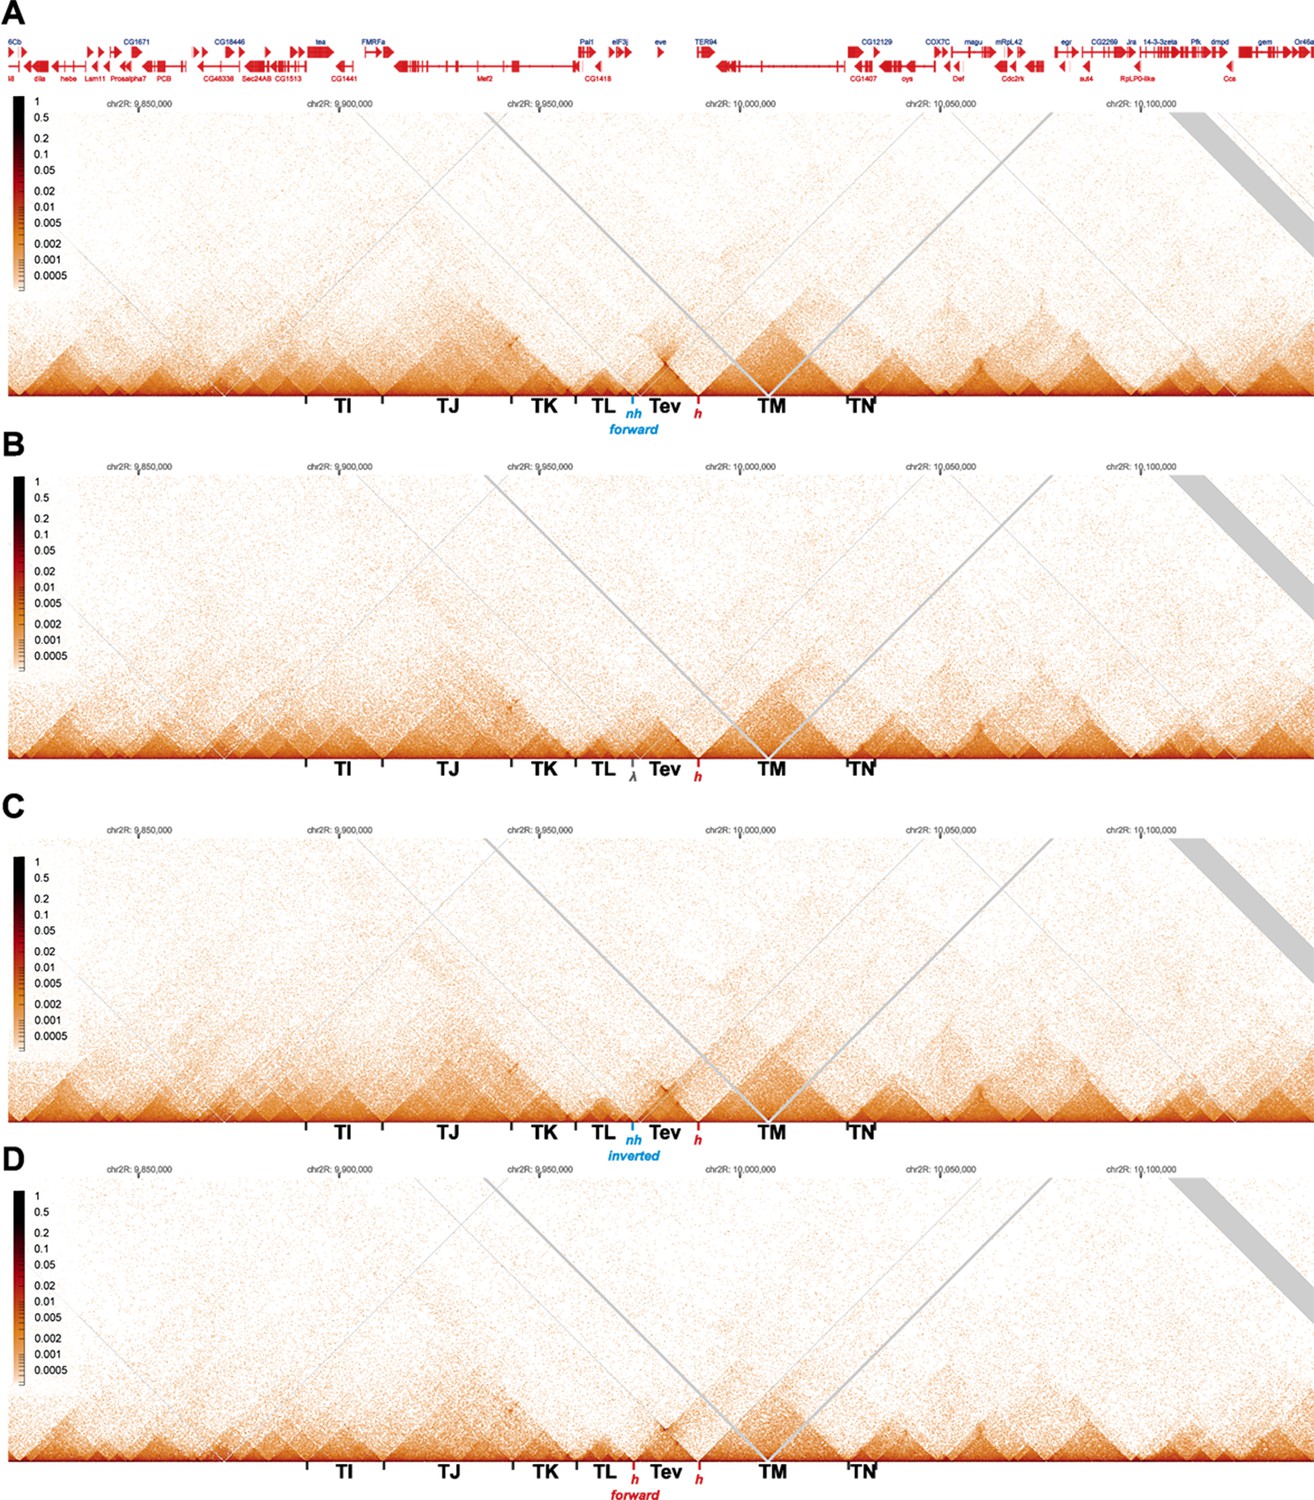
MicroC contact profiles for nhomie forward, lambda DNA, nhomie reverse, and homie forward in larger scale.
N (replicates) = 2. Resolution = 200. (A) MicroC contact maps for the nhomie forward replacement. (B) MicroC contact maps for the lambda DNA replacement. (C) MicroC profile of the nhomie reverse replacement. (D) MicroC profile of the homie forward replacement.
Figure 3
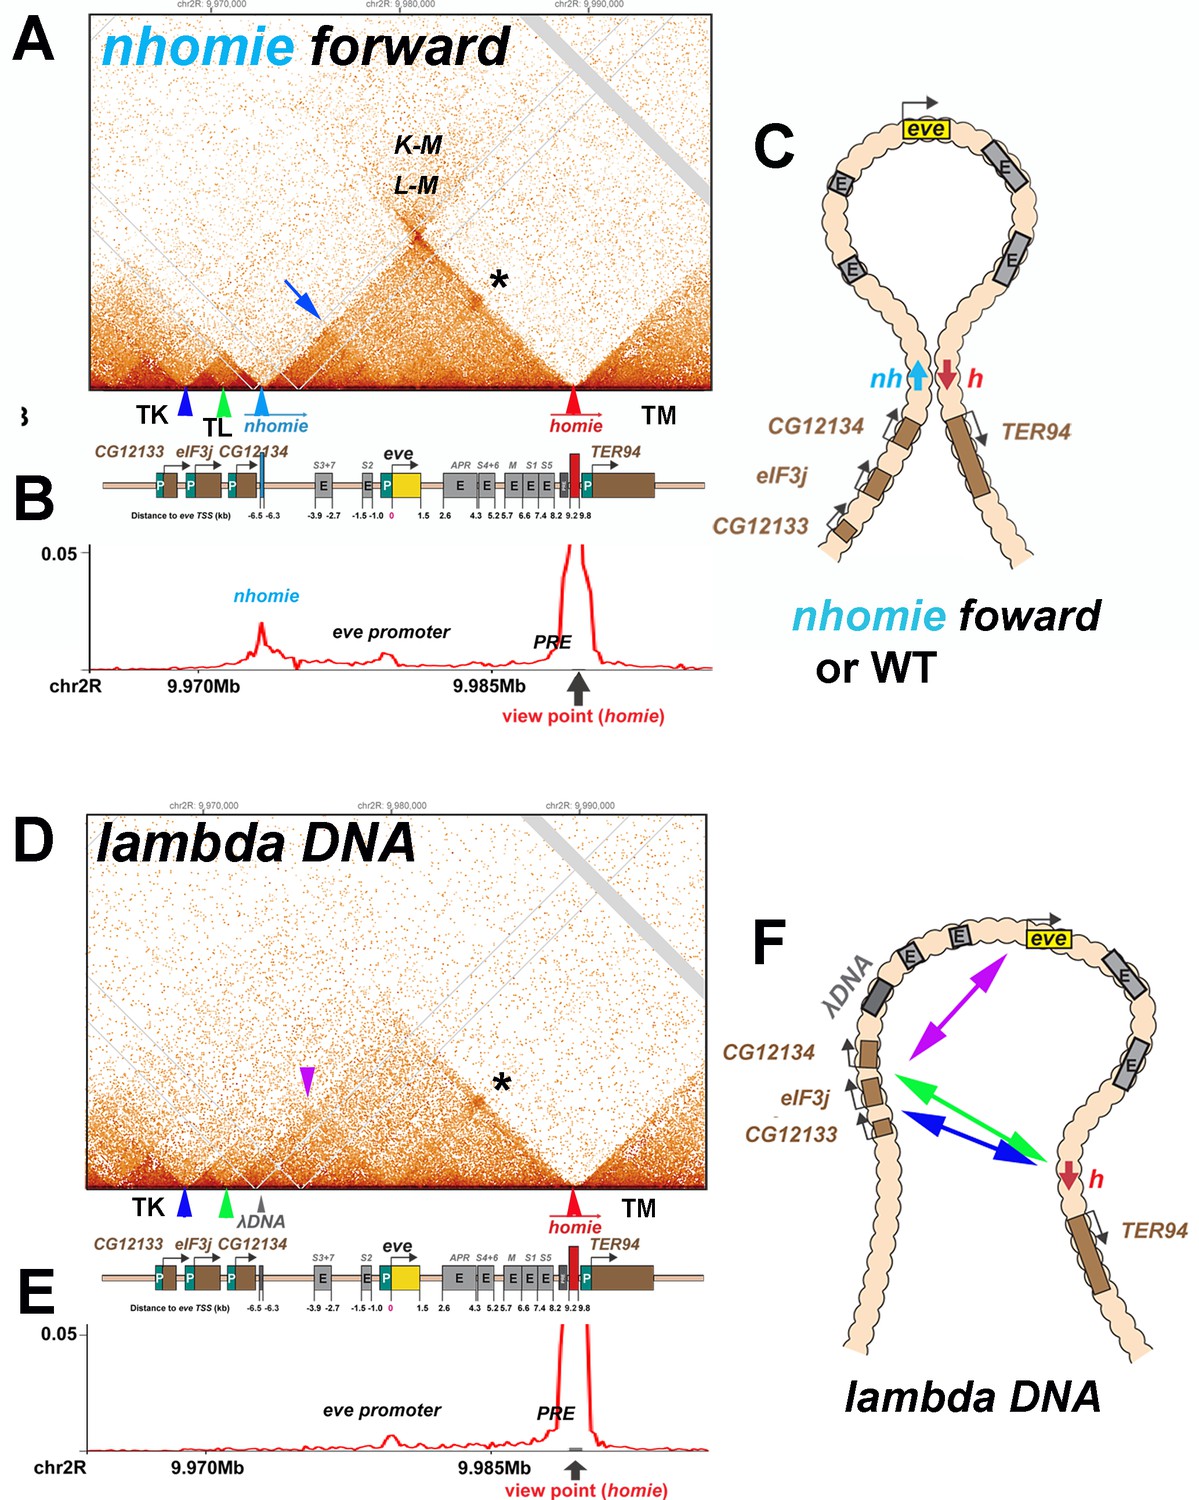
TAD organization of the nhomie forward and lambda DNA replacements.
(A) MicroC contact profile of 12–16 hr embryos (stage 12–14) nhomie forward embryos. In this, our positive control, nhomie replaces endogenous nhomie, in the same orientation. N (replicates) = 2. Resolution = 200 bp. L-M: interactions between TADs TL and TM flanking the eve locus. Asterisk: sub-TAD linking the eve promoter to the eve PRE and homie. Dark blue arrow: sub-TAD linking the eve promoter to nhomie. Light blue arrow: nhomie. Red arrow: homie. Green arrowhead: sub-TAD boundary formed by the CG12134 promoter region. Dark blue arrowhead: sub-TAD boundary formed by eIF3j promoter region. Diagram: map of eve locus and surrounding genes. (B) Virtual 4C with viewpoint from homie (black arrow) in nhomie forward embryos. (C) Diagram of the eve stem-loop TAD. (D) MicroC contact profile of 12–16 hr λ DNA embryos. In this replacement, λ DNA is inserted in place of nhomie. N (replicates) = 3. Resolution = 200 bp. Asterisk: sub-TAD linking the eve promoter to the eve PRE and homie. Purple arrowhead: sub-TAD linking CG12134 promoter region to the eve promoter. The eIF3j sub-TAD TL3 (between the blue and green arrowheads) is still present. (E) Virtual 4C with viewpoint from homie (black arrow) in λ DNA embryos. (F) Diagram of the ‘unanchored’ eve TAD. Double arrows show novel interactions.
Figure 4 with 2 supplements
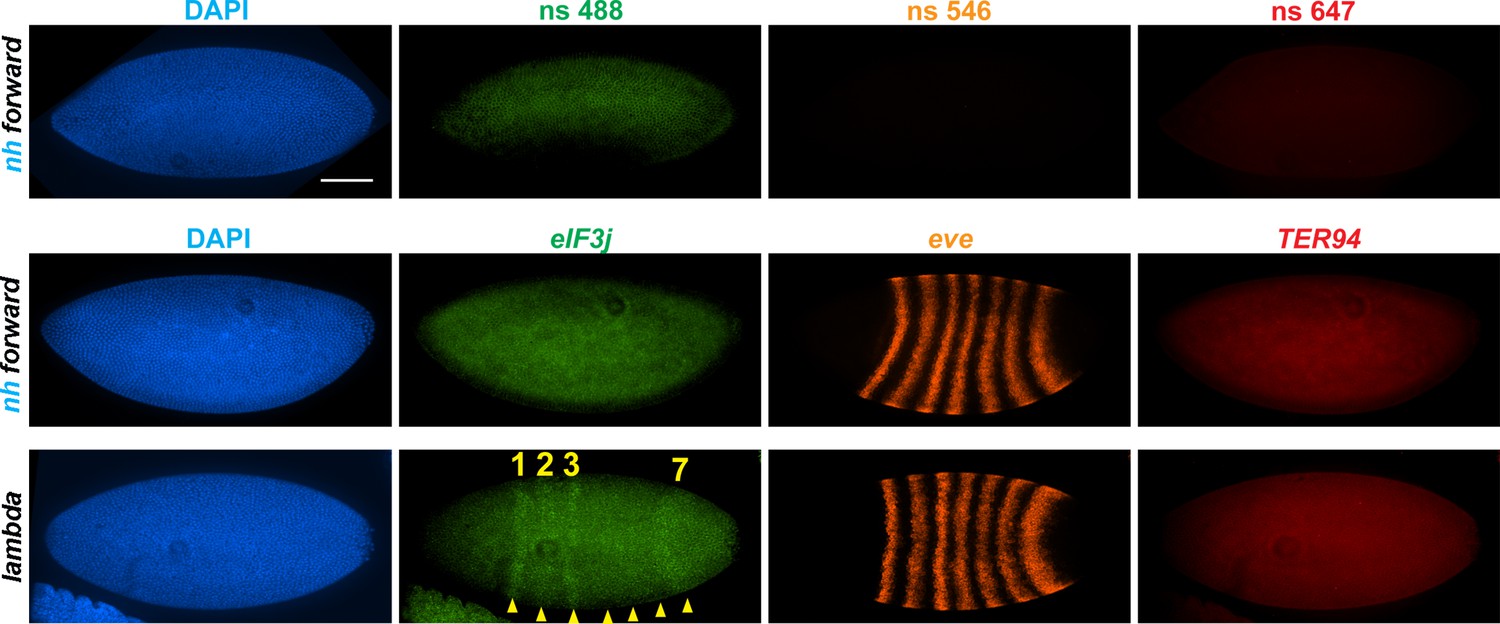
nhomie deletion (λ DNA replacement) exposes eIF3j to the eve enhancers.
nh forward: positive control, as in Figure 3. λ DNA: nhomie is replaced with λ DNA. At the syncytial blastoderm stage, a series of stripe-specific enhancers upstream (stripes 1, 2, 3, 7) and downstream (stripes 1, 4, 5, 6) of the eve gene drive eve expression. During cellularization of the blastoderm and gastrulation, a single enhancer located upstream of eve drives expression of all seven stripes. DAPI: DNA stained with DAPI (blue). eIF3j: embryo hybridized with probe complementary to eIF3j mRNA. eve: embryo hybridized with probe complementary to eve mRNA. TER94: embryo hybridized with probe complementary to TER94. Yellow arrowheads: eve-enhancer-driven eIF3j stripes. Control nonspecific probes for each channel indicate autofluorescence background in the top panel. Scale bar = 100 µm.
Figure 4—figure supplement 1
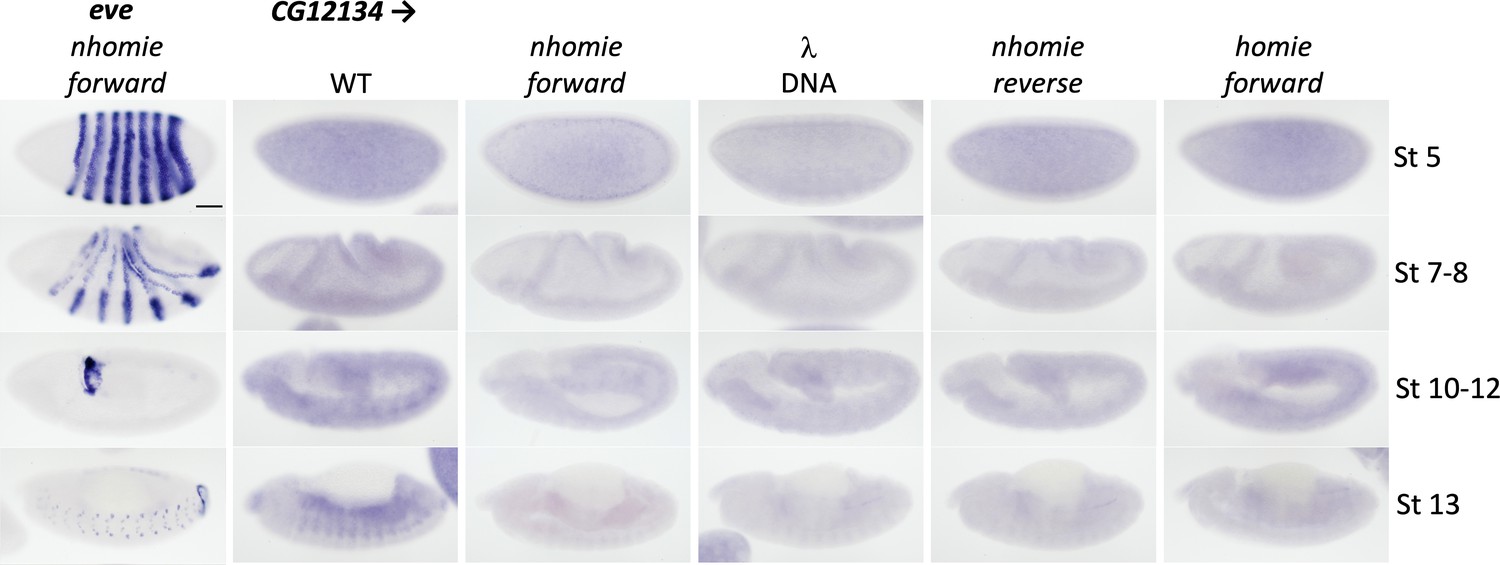
Expression of CG12134 in WT (yw) and the four nhomie replacements.
Digoxigenin in situ hybridization was used to detect expression of CG12134 during development in the indicated genetic backgrounds. Approximate developmental stages of the embryos in each genetic background are shown on the right. As controls, embryos of similar stages were hybridized with an eve probe. Scale bar = 50 µm.
Figure 4—figure supplement 2
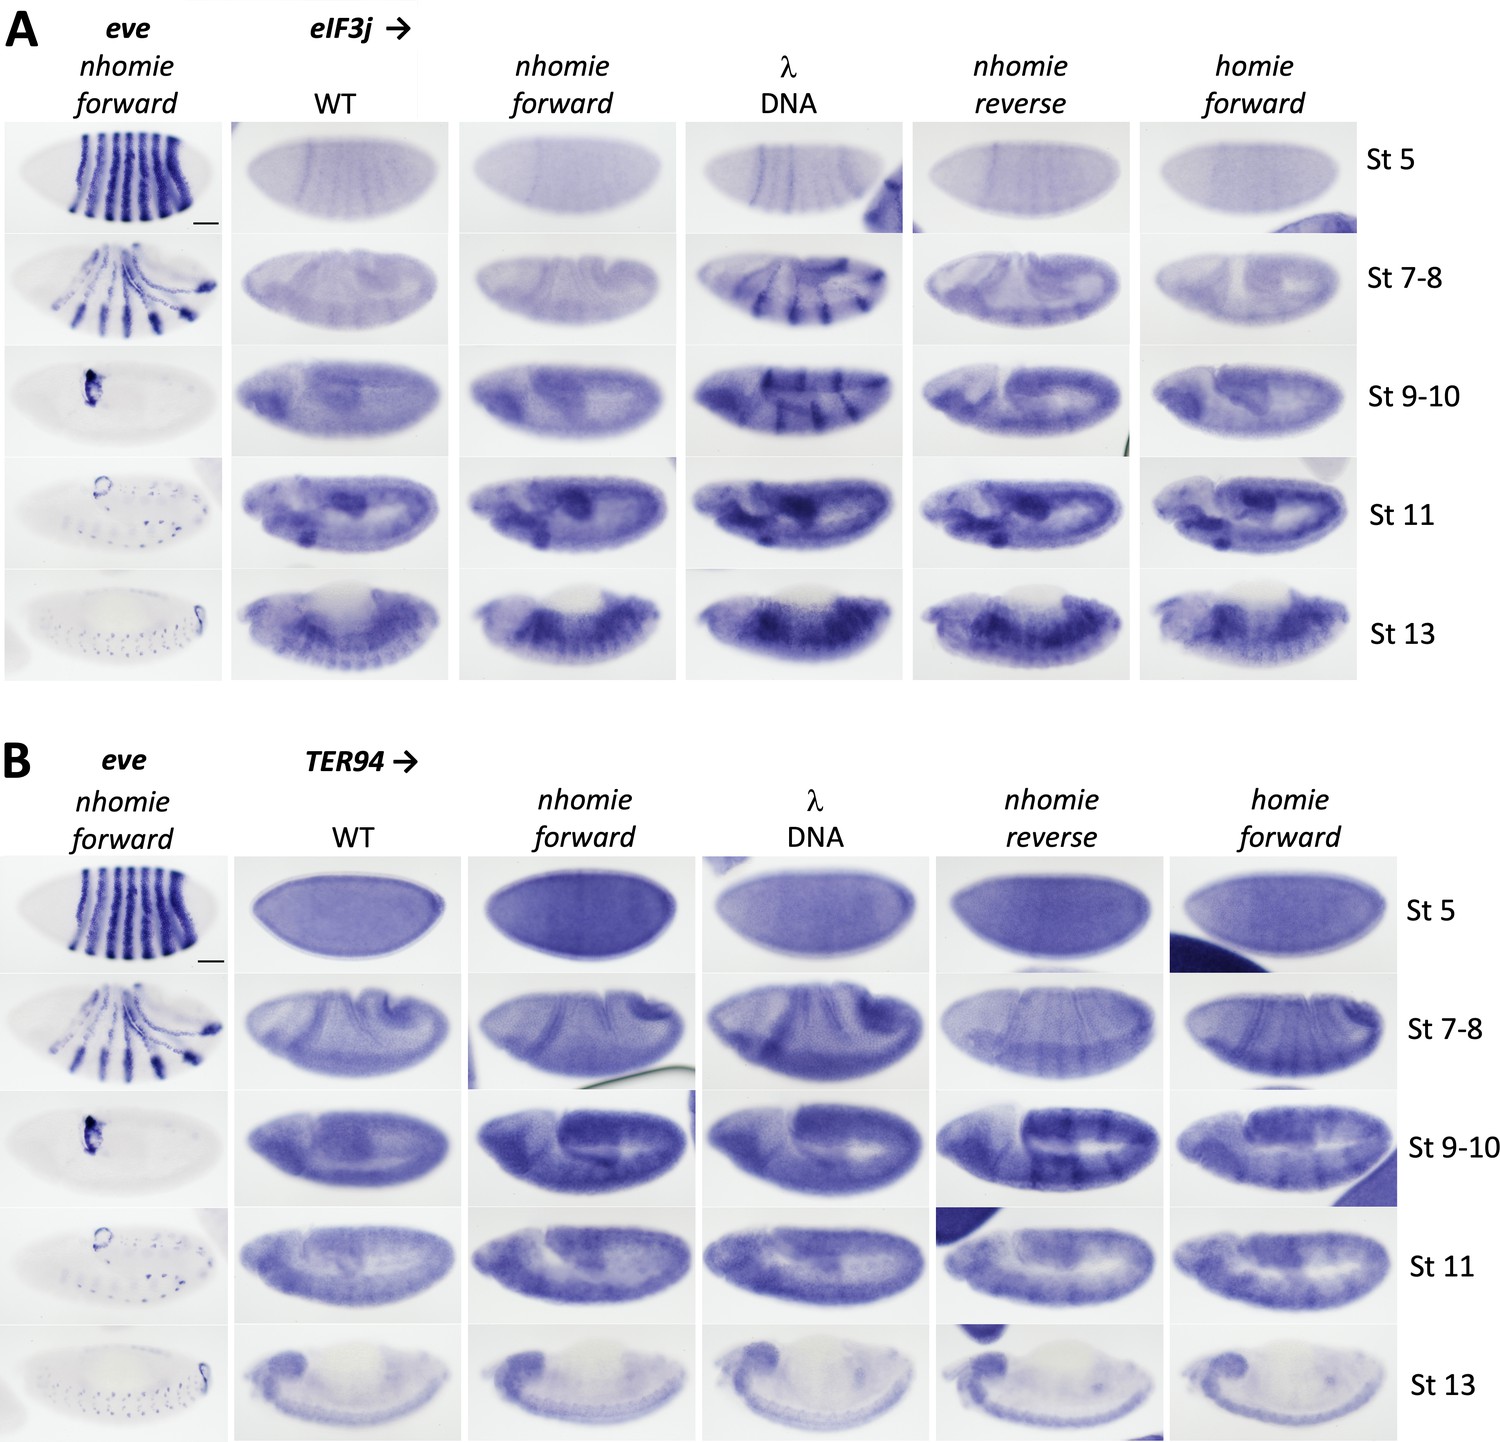
Expression of eIF3j (Adam) and TER94 in WT (yw) and the four nhomie replacements.
Digoxigenin in situ hybridization was used to detect expression of (A) eIF3j and (B) TER94 during development in the indicated genetic backgrounds. Approximate developmental stages of the embryos in each genetic background are shown on the right. As controls, embryos of a similar stage were hybridized with an eve probe. Note that unlike the HCR-FISH results shown in Figure 4, we can detect a low level of eIF3j stripe expression in WT (yw) and nhomie forward stage 5 embryos. The difference is likely due to the fact that signal amplification in the digoxigenin in situ hybridization procedure is nonlinear, resulting in greater contrast between background and signal when staining conditions are optimal. Scale bars = 50 µm.
Figure 5
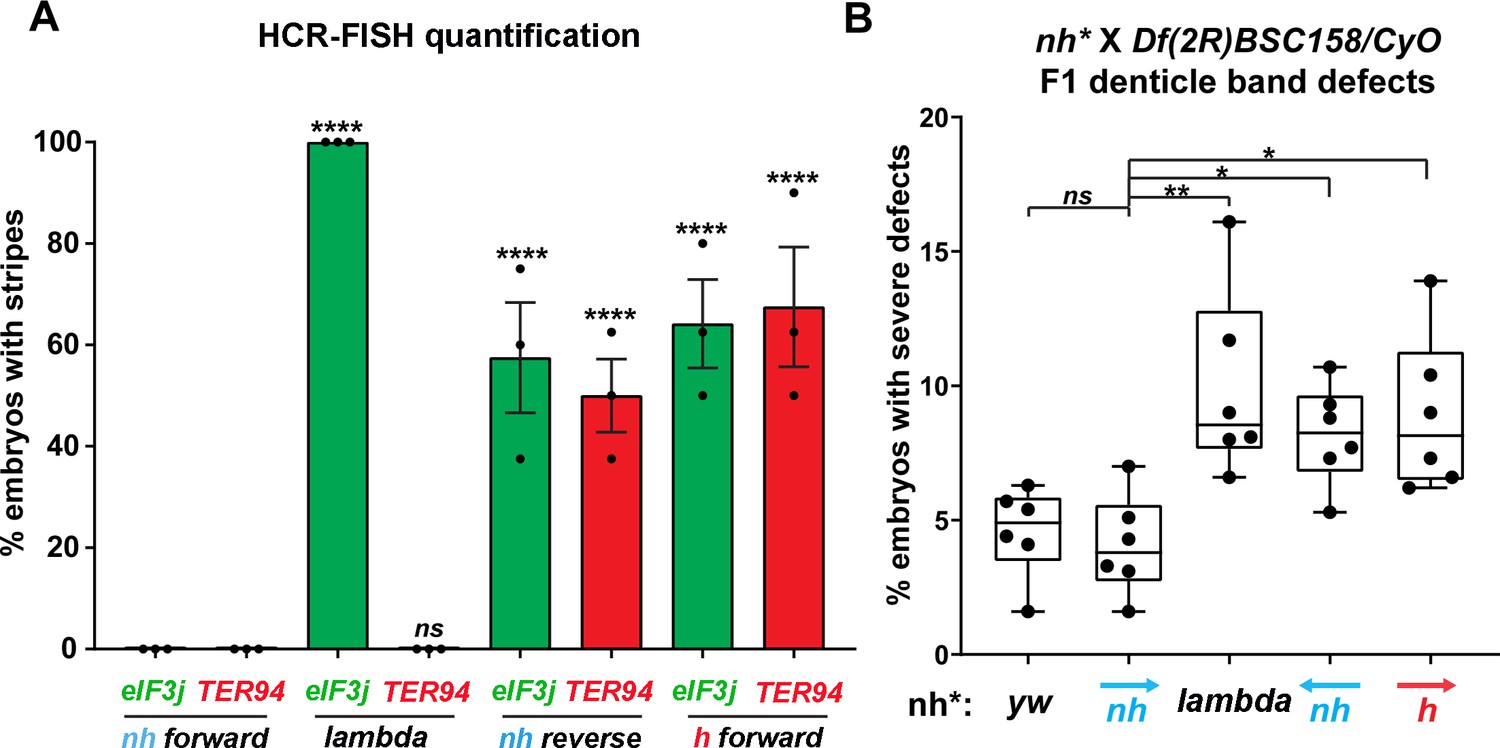
Manipulating the nhomie boundary impacts the regulatory landscape.
N = # of independent replicates, n = # of embryos. Two-way ANOVA with Tukey’s multiple comparisons test for each pair of groups was used to determine the statistical significance. *p≤0.05, **p≤0.01, ***p≤0.001, and ****p≤0.0001. (A) Quantitation of the number of embryos showing stripe patterns in HCR-FISH for eIF3j and TER94, as shown in Figures 4 and 7. N = 3. n = 45 for each group. (B) Quantitation of the number of missing ventral denticle bands in larvae from a cross of BSC/CyO,hb-lacZ deficiency females to males of the indicated genotypes (N = 6): wild-type control (yw), n = 767. For the nhomie forward replacement, n = 1099; for the λ DNA replacement, n = 1175; for the nhomie reverse replacement, n = 1083; for the homie forward replacement, n = 1137.
Figure 6
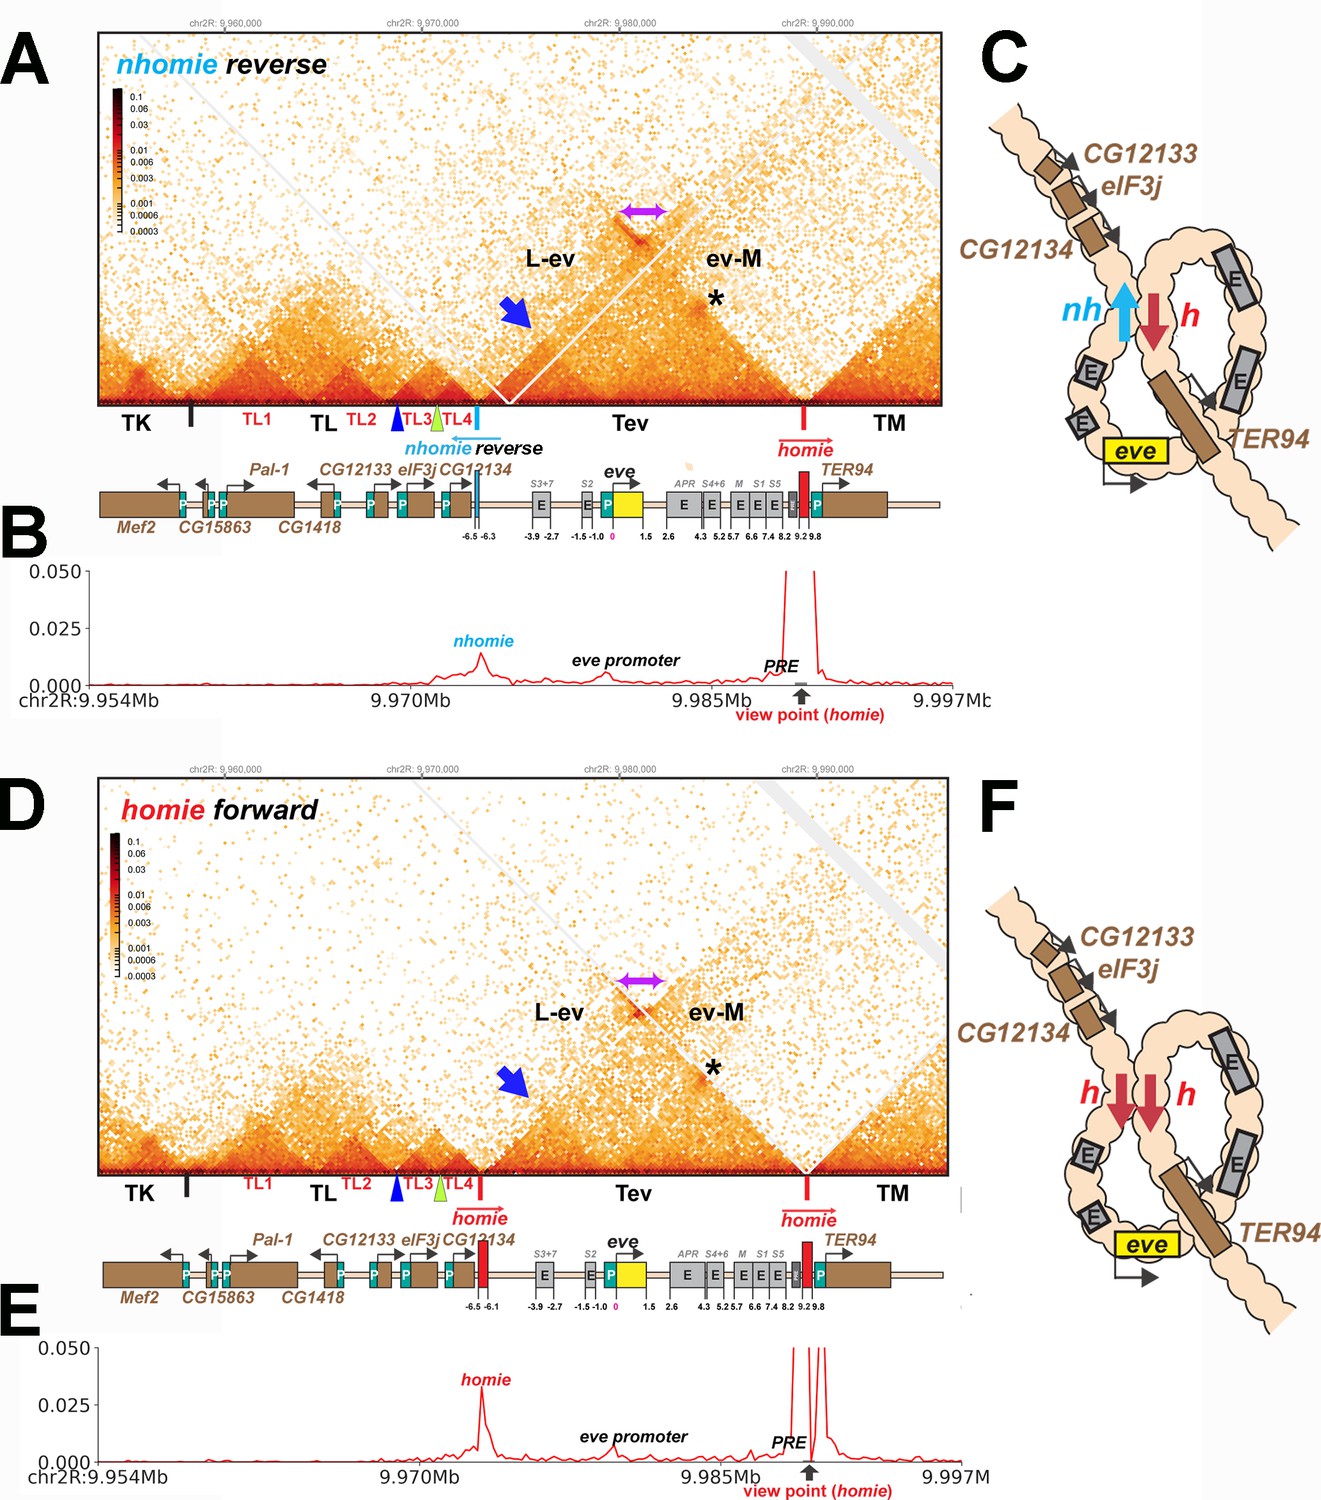
TAD organization of the nhomie reverse and homie forward replacements.
(A) MicroC contact profile of 12–16 hr nhomie reverse embryos. In this replacement, nhomie is inserted in the reverse orientation compared to WT nhomie. N (replicates) = 3. Resolution = 200 bp. (B) Virtual 4C with viewpoint from homie (black arrow) in nhomie reverse embryos. (C) Diagram of the nhomie reverse:homie circle-loop. (D) MicroC contact profile of 12–16 hr homie forward embryos. In this replacement, homie is inserted in the forward orientation (the same as the endogenous homie): N (replicates) = 3, resolution = 200 bp. (E) Virtual 4C with viewpoint from homie (black arrow) in homie forward embryos. (F) Diagram of the homie forward:homie circle-loop. (A, C) Note that interactions between the TADs flanking the eve locus (purple double arrow) are suppressed compared to nhomie forward (see Figure 3), while interactions of the eve TAD (Tev) with TL and TM are enhanced (L-ev and ev-M). Asterisk: sub-TAD linking the eve promoter to the eve PRE and homie. Dark blue arrow: sub-TAD linking the eve promoter to nhomie reverse. Light blue arrow: nhomie reverse. Red arrow: homie. Green arrowhead: sub-TAD boundary formed by the CG12134 promoter region. Dark blue arrowhead: sub-TAD boundary formed by the eIF3j promoter region.
Figure 7
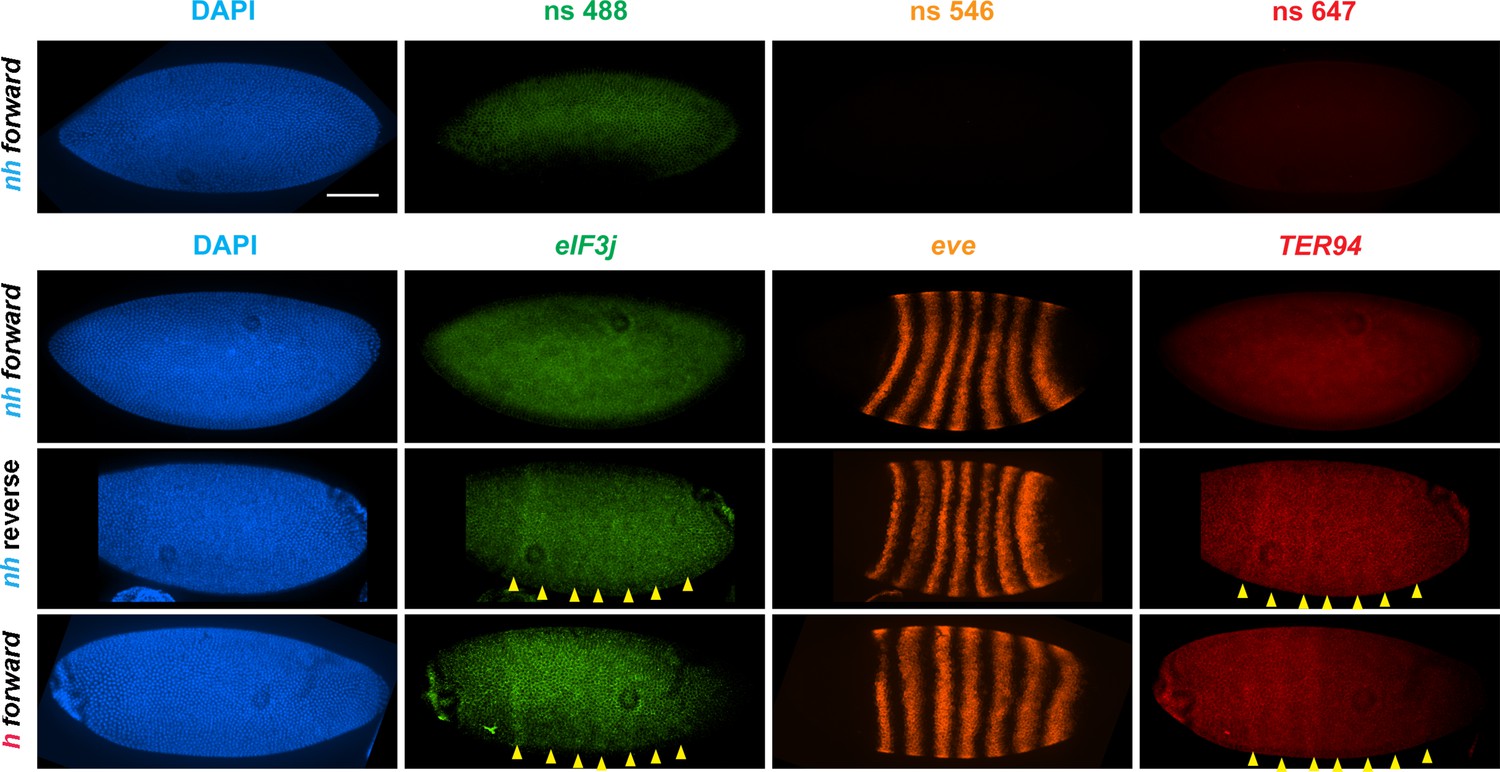
eve enhancers activate neighboring genes when the eve TAD is a circle-loop.
HCR-FISH hybridization to mRNA expressed by eIF3j, eve and TER94 at the blastoderm stage (embryonic stage 5). nh forward: nhomie is replaced with nhomie in the forward (normal) orientation (positive control, as in Figure 3). nh reverse: nhomie is replaced with nhomie in the reverse orientation. h forward: nhomie is replaced with homie in the forward orientation. Yellow arrowheads: positions of stripes. DAPI (blue): DNA stained with DAPI. eIF3j (green): embryo is hybridized with probe complementary to eIF3j mRNA. eve (orange): embryo is hybridized with probe complementary to eve mRNA. TER94 (red): embryo is hybridized with probe complementary to TER94. Control nonspecific probes for each channel indicate autofluorescence background in the top panel. Scale bar = 100 µm.
Figure 8 with 1 supplement
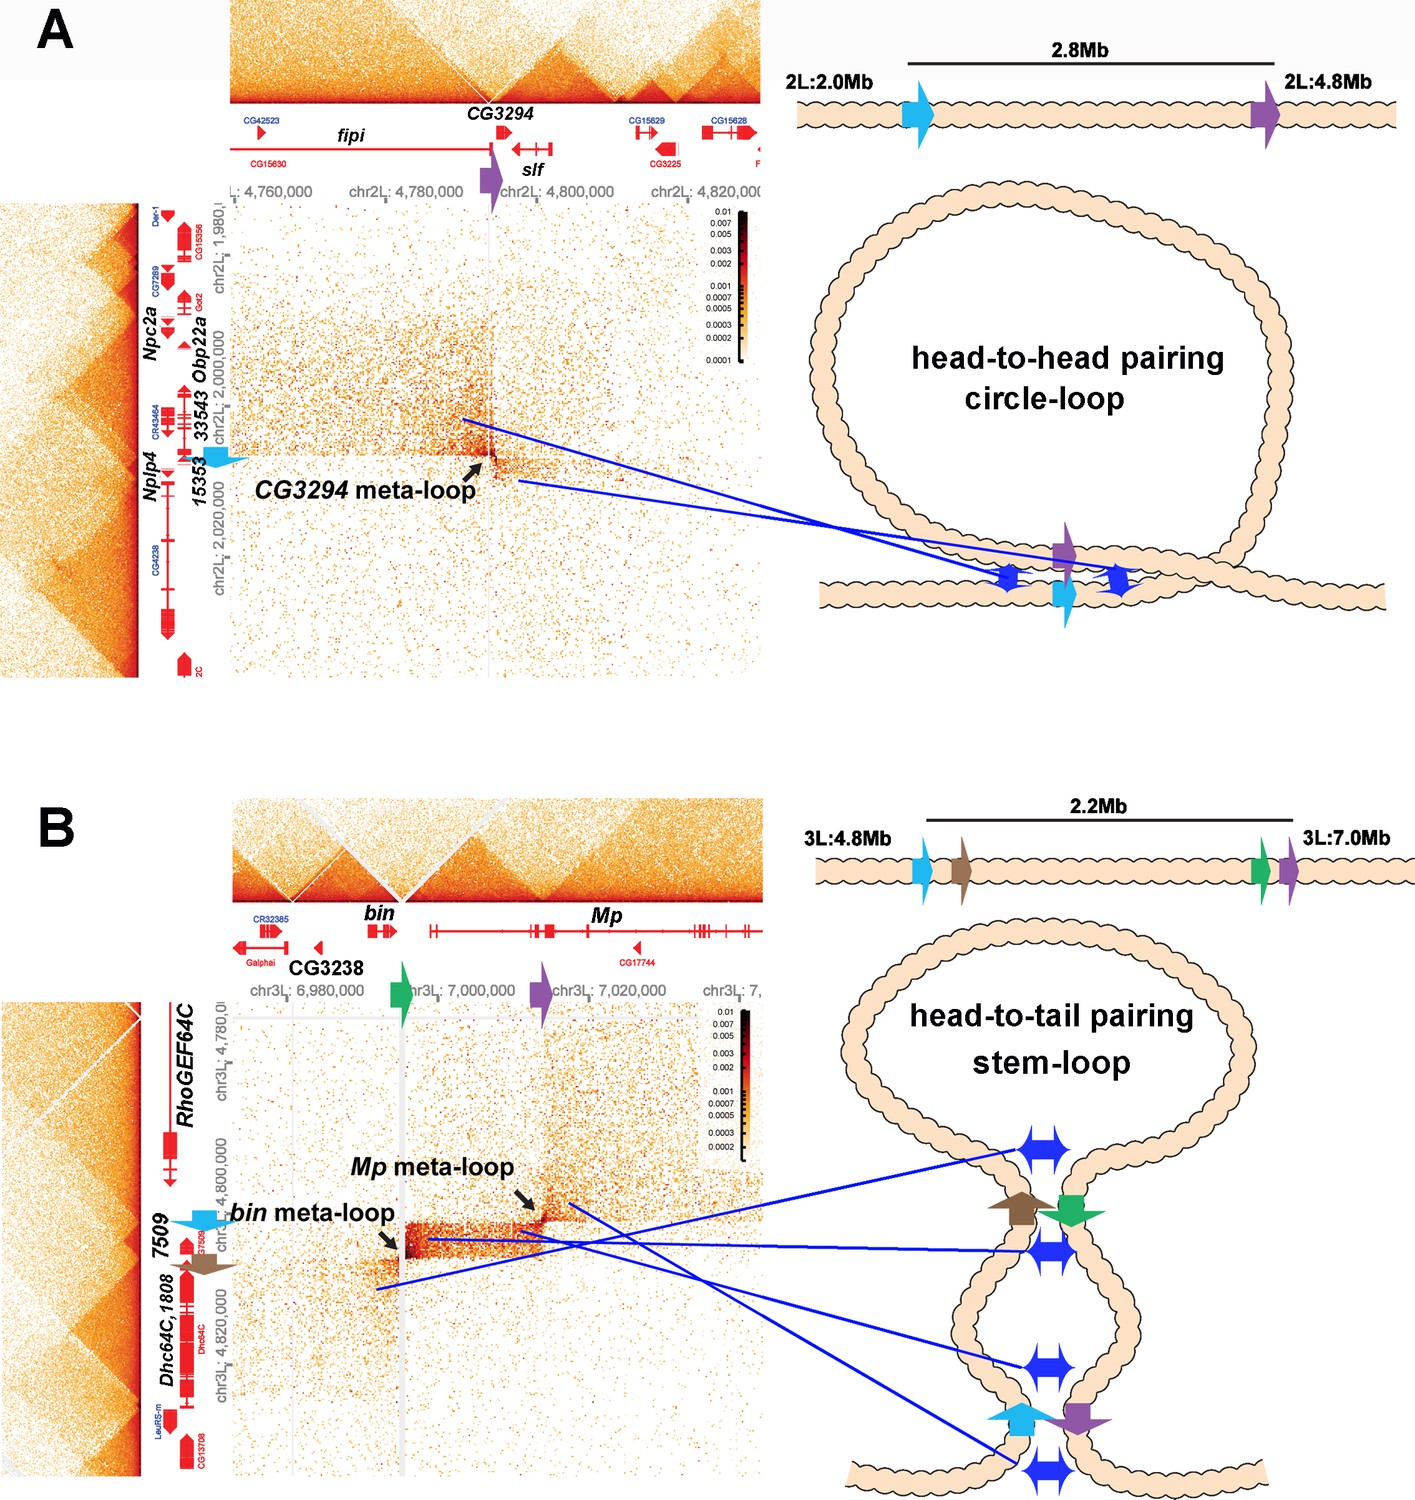
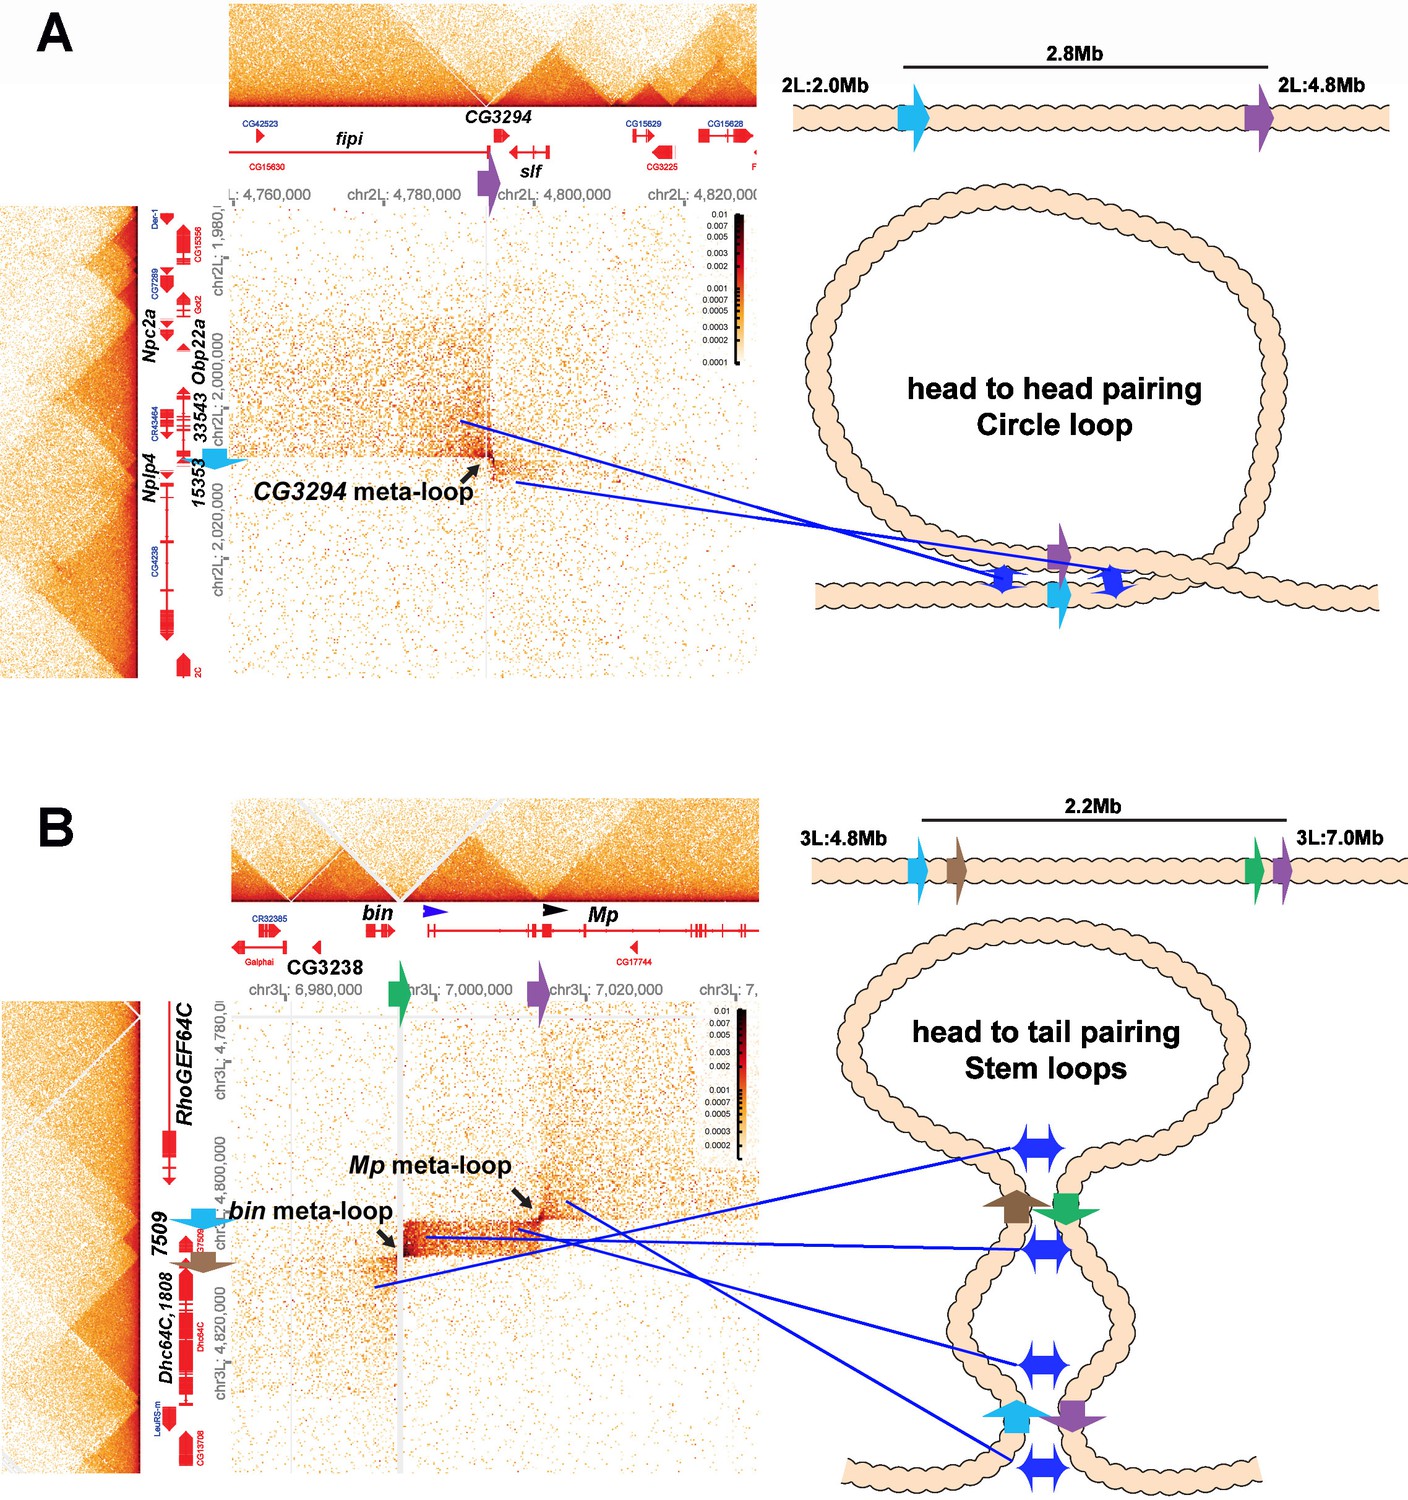
Circle-loop and stem-loop meta-loops.
(A) CG3294 circle-loop meta-loop. In this meta-loop, a TAD boundary (blue arrow) located at ~2.0 Mb on chromosome 2L pairs head-to-head with a TAD boundary (purple arrow) located ~2.8 Mb away. As indicated in the diagram, head-to-head pairing generates a circle-loop. In the circle-loop topology, the TAD upstream of the blue boundary is brought into contact with the TAD upstream of the purple boundary, as indicated the diagram (blue double arrows). This generates a rectangular box of enhanced contacts between sequences in the TAD containing the CG33543, Obp22a, and Npc2a genes and sequences in a TAD that contains the fipi gene. This box is located on the upper left of the contact map (above and to the left of the black arrow). Sequences in TADs downstream of the blue and purple boundaries are also linked, and this generates a small rectangular box representing sequences in the small Nplp4 and CG15353 TAD ligated to sequences in the TAD containing CG3294 and slf (below and to the right of the black arrow). (B) The bin/Mp meta-loops on the left arm of the third chromosome are generated by the head-to-tail pairing of two sets of boundaries, indicated by the blue, brown, green, and purple arrows. Pairing of the brown and green boundaries generates an ~2.2 Mb stem-loop. Sequences in the TAD downstream of the brown boundary (which contains the Dhc64C and CG1808 genes) are linked to sequences in the TAD upstream of the green boundary (which contains CG2328 and bin). This generates the rectangular box of enhanced contacts on the lower left of the contact map. Pairing of the blue and purple boundaries head-to-tail generates a small stem-loop ‘bubble’ (see diagram). This bubble brings sequences in the TAD containing the most distal Mp promoter (blue arrowhead) into contact with sequences in the small TAD containing CG7509 (see diagram on the right). Interactions between these two TADs generates the small rectangular box of enhanced contacts in the center of the contact map. The head-to-tail pairing of the blue and purple boundaries also bring sequences in the TAD upstream of the blue boundary that contains the RhoGEF64C gene into contact with the TAD containing one of the internal Mp promoters (black arrowhead). This interaction generates the box of enhanced contacts in the upper-right portion of the contact map. The bin size for each panel is 200 bp; embryos are 12–16 hr old.
Figure 8—figure supplement 1
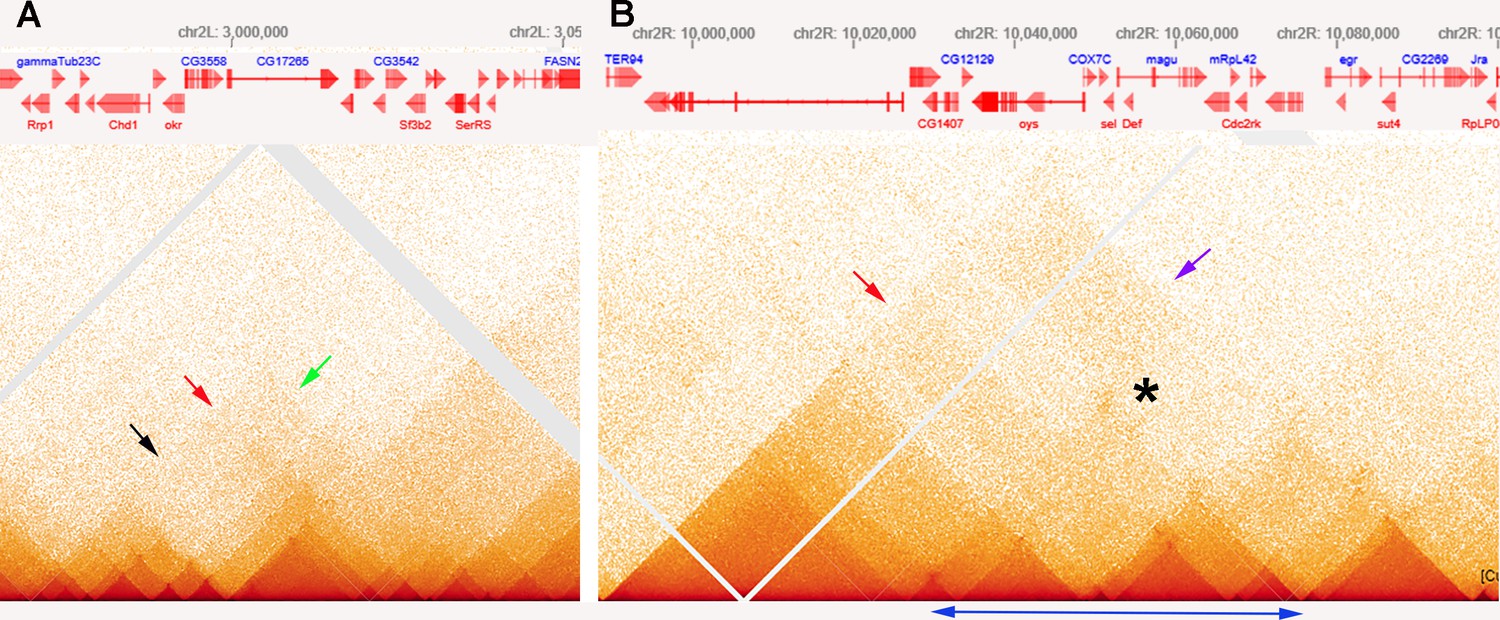
MicroC patterns of DNA segments on the left and right arm of chromosome 2.
(A) MicroC contact profiles of the left arm of chromosome 2 around 3,000,000 bp. The black arrow indicates where interactions between neighboring TADs are suppressed, as might be expected for a stem-loop configuration. The red arrow just above and to the right of the black arrow points to contacts between next-next-(next)-door neighbors that are enhanced. However, the plume that is formed is one-sided, as indicated by the green arrow. (B) MicroC contact profiles for TADs in a portion of the right arm of chromosome 2. The TADs indicated by the double-headed blue arrow at the bottom have a complex pattern of neighbor interactions. The asterisk and purple arrow indicate a potential volcano plume; however, unlike the eve volcano triangle and plume, this plume appears to be generated by crosslinking between sequences to either side of the collection of TADs indicated by the double-headed blue arrow. The TAD-to-TAD interaction patterns are further complicated by a band of enhanced crosslinking (red arrow).
Author response image 1

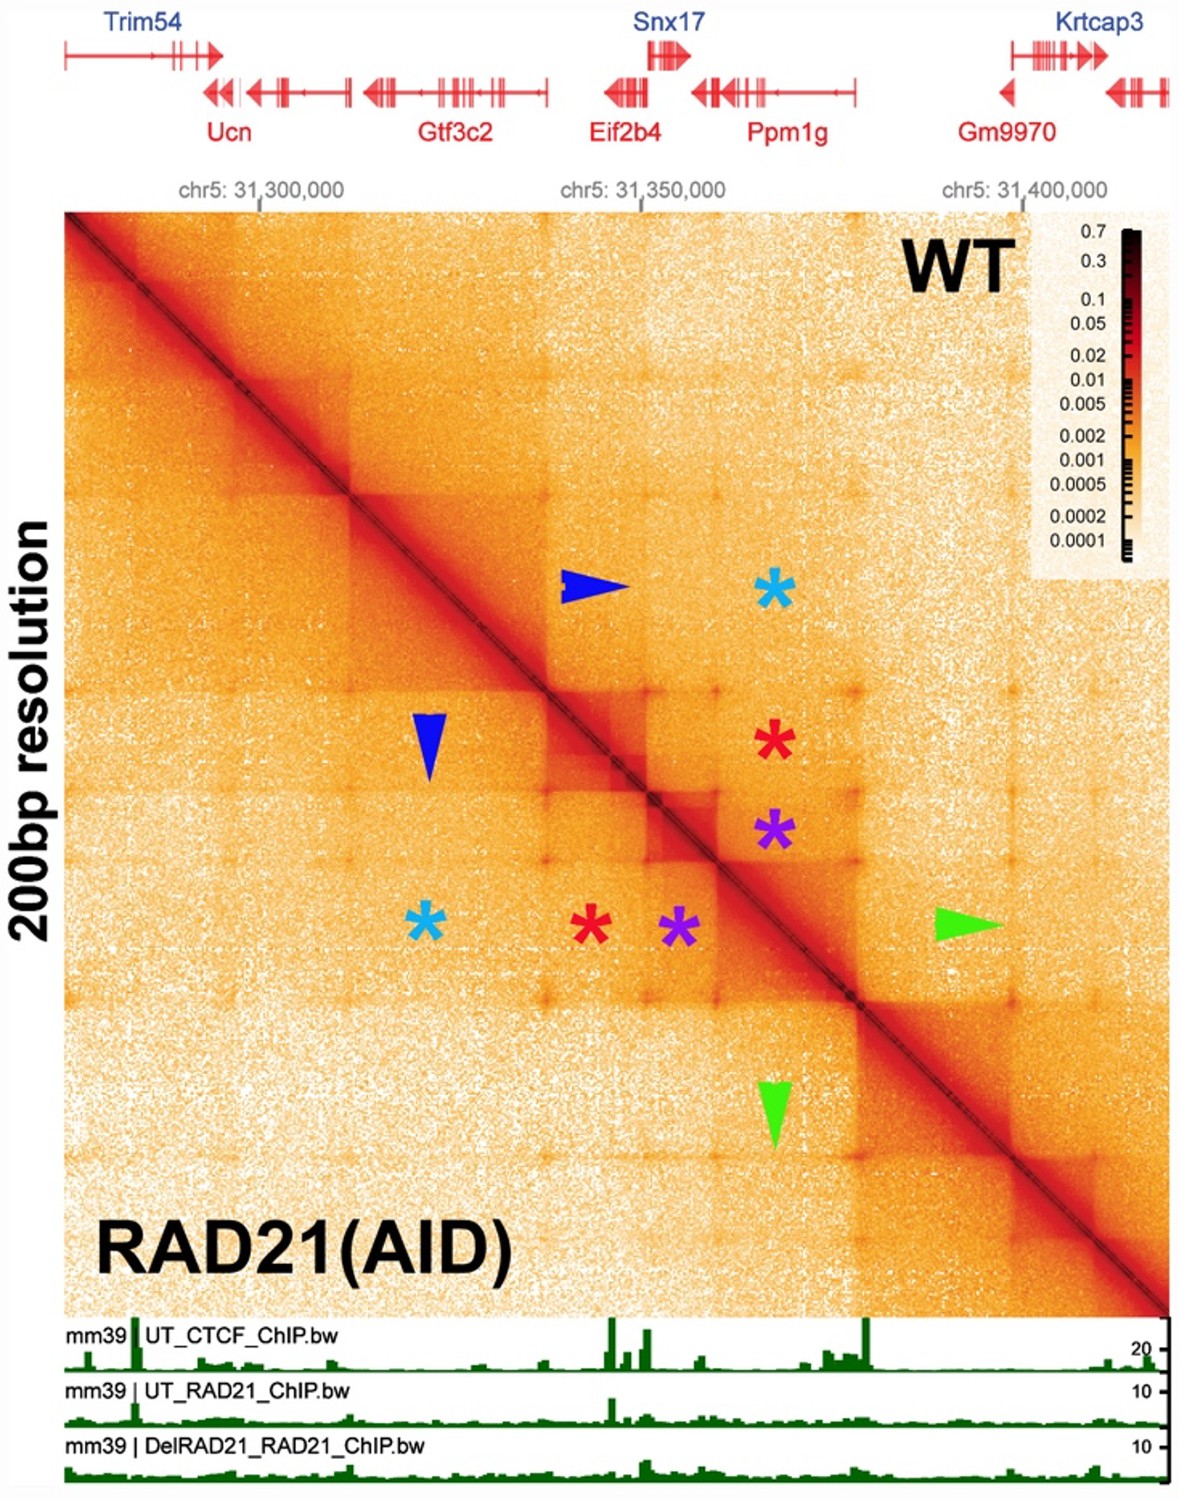
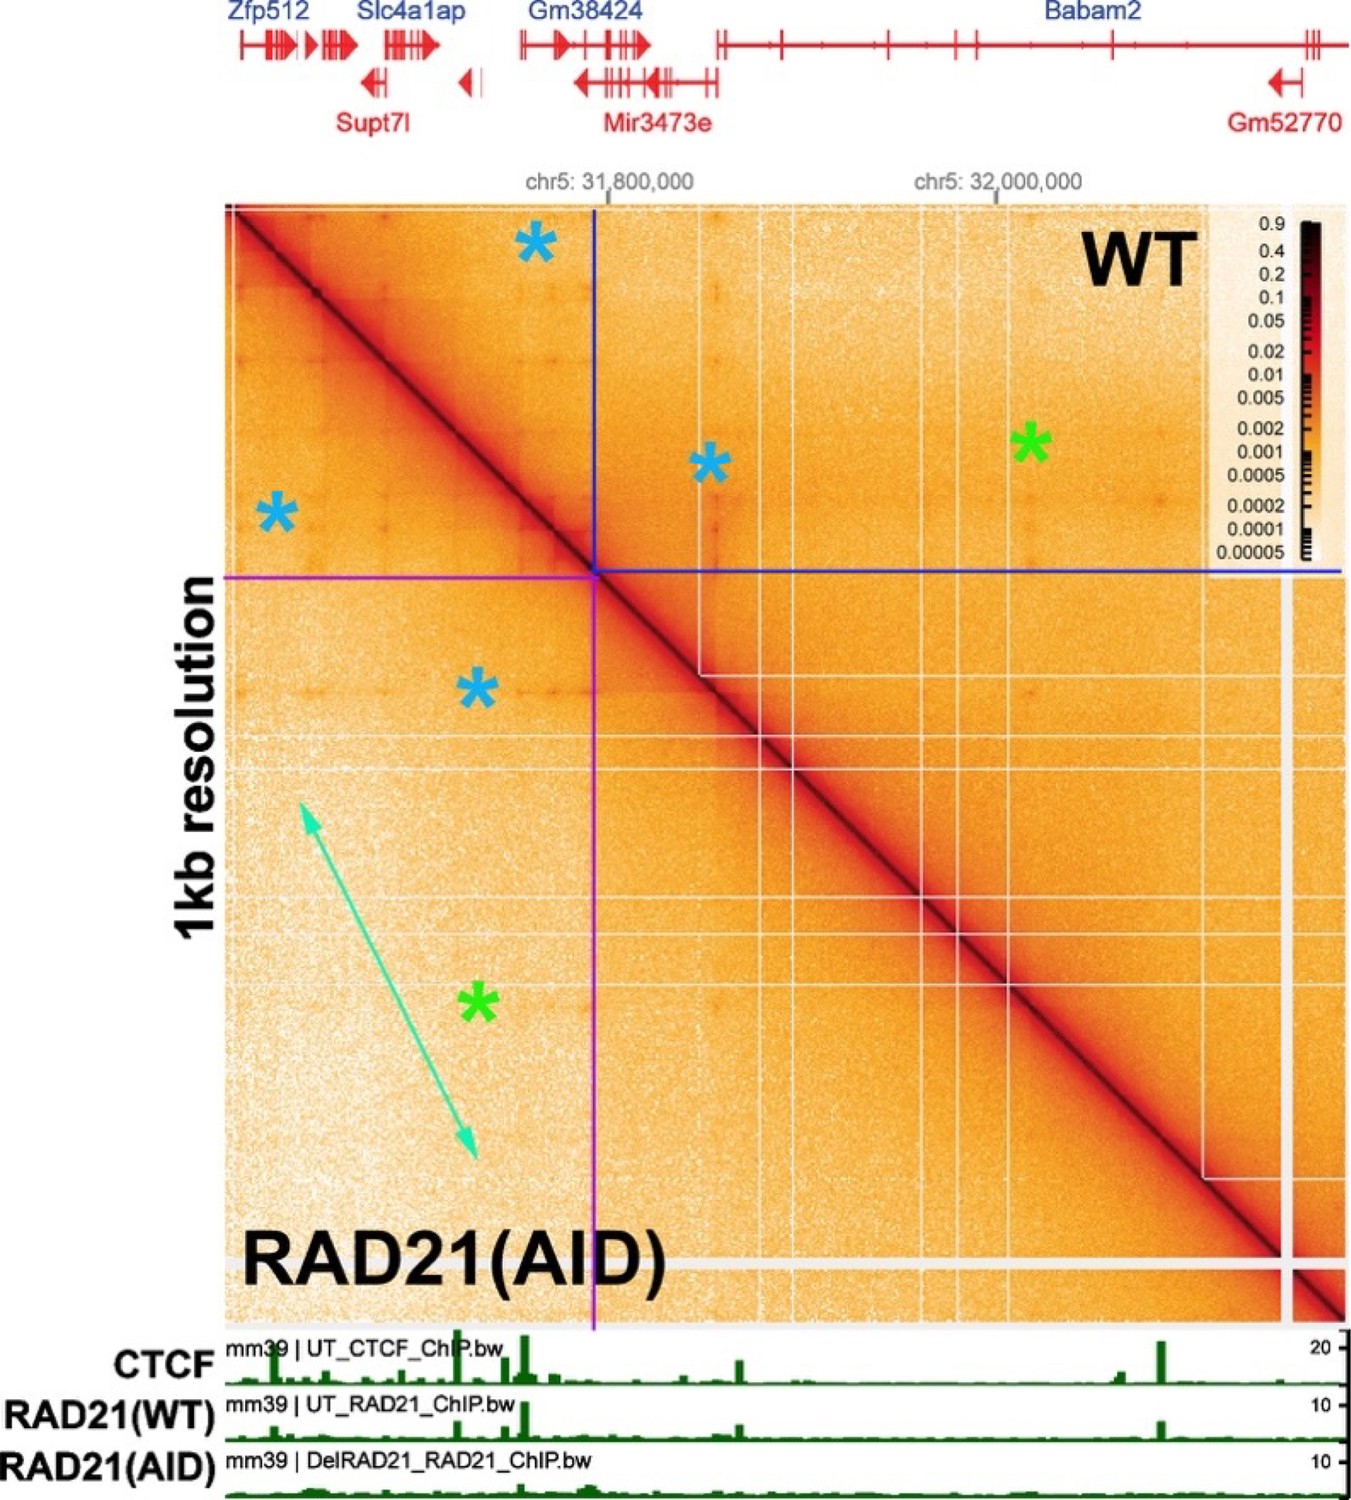
Mammalian MicroC profiles at different bin sizes.
Author response image 2
Author response image 3
Author response image 4

Author response image 5

Long-distance pairing-sensitive silencing between transgenes inserted on 3R.
Transgene insertion sites are shown in Author response image 4.
Author response image 6

Author response image 7
Metaloops on the 2nd and 3rd chromosomes: circle-loops and multiple stem-loops.
Author response image 8
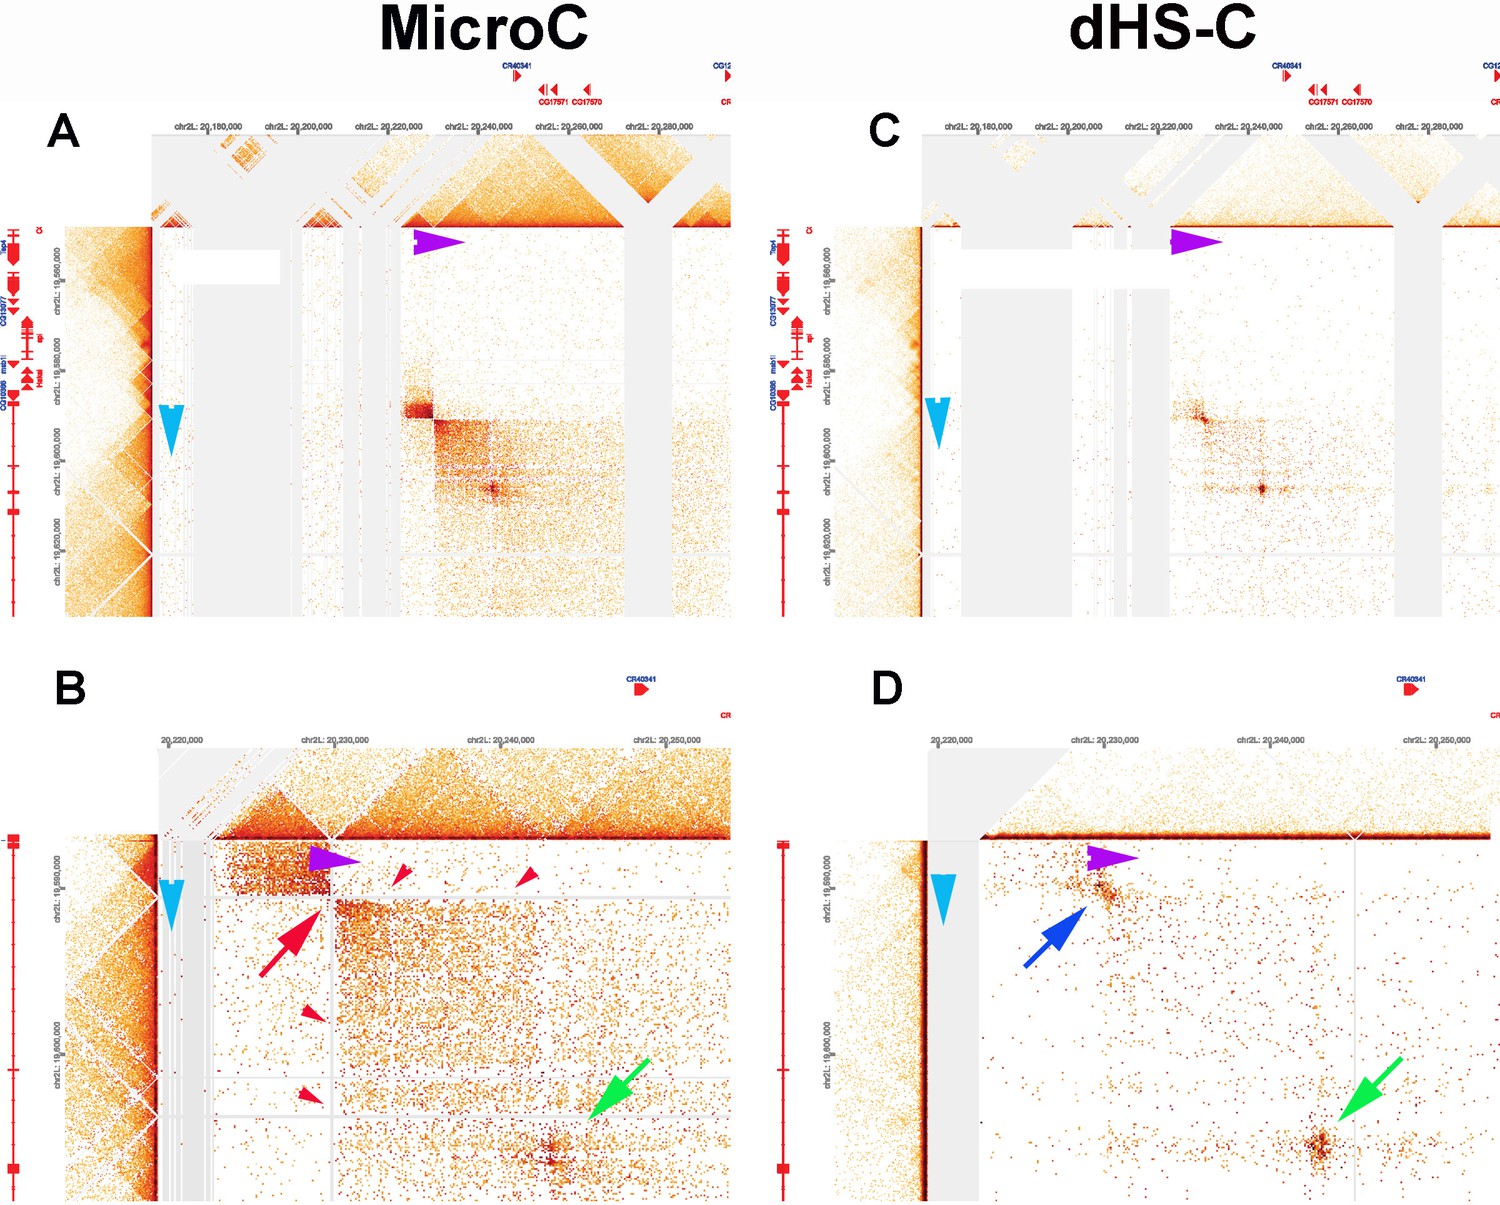
Lar metaloop.
(A, B) MicroC. (C, D) dHS-C.
Author response image 9

Tables
Appendix 1—key resources table
| Reagent type (species) or resource | Designation | Source or reference | Identifiers | Additional information |
|---|---|---|---|---|
| Gene (Drosophila melanogaster) | eve | FlyBase | FBgn0000606 | |
| Gene (D. melanogaster) | CG12134 | FlyBase | FBgn0033471 | |
| Gene (D. melanogaster) | eIF3j | FlyBase | FBgn0027619 | |
| Gene (D. melanogaster) | TER94 | FlyBase | FBgn0286784 | |
| Genetic reagent (D. melanogaster) | y1 M{vas-Cas9}ZH-2A w1118/FM7c | Bloomington Drosophila Stock Center | 51323 | |
| Recombinant DNA reagent (plasmid) | pCFD4-U6:1_U6:3tandemgRNAs | Addgene | 49411 | |
| Chemical compound, drug | n-Heptane | Fisher Chemical | O3008-4 | |
| Chemical compound, drug | Paraformaldehyde 20% solution, EM Grade | Electron Microscopy Sciences | 15713S | |
| Chemical compound, drug | Formaldehyde, 16%, methanol free, Ultra Pure | Polysciences Inc | 18814-10 | |
| Chemical compound, drug | PBS – phosphate-buffered saline (10×) pH 7.4, RNase-free | Thermo Fisher | AM9624 | |
| Chemical compound, drug | Tween 20 | Sigma | P1379 | |
| Chemical compound, drug | Triton X-100 | Bio-Rad | 161-0407 | |
| Chemical compound, drug | Tris base | Sigma | 11814273001 | |
| Chemical compound, drug | Methanol | Fisher Chemical | 203403 | |
| Chemical compound, drug | SSC, 20× | Thermo Fisher | 15557044 | |
| Chemical compound, drug | Formamide | Thermo Fisher | 17899 | |
| Chemical compound, drug | Dextran sulfate | Sigma | D8906 | |
| Chemical compound, drug | Salmon Sperm DNA | Thermo Fisher | AM9680 | |
| Chemical compound, drug | Ribonucleoside Vanadyl Complex | NEB | S1402S | |
| Chemical compound, drug | Nuclease-free BSA | Sigma | 126609 | |
| Chemical compound, drug | Triethylammonium acetate | Sigma | 625718 | |
| Chemical compound, drug | dGTP (100 MM) | VWR | 76510-208 | |
| Chemical compound, drug | dTTP (100 MM) | VWR | 76510-224 | |
| Chemical compound, drug | Lonza NuSieve 3:1 Agarose | Thermo Fisher | BMA50090 | |
| Other | T4 DNA ligase | NEB | M0202L | Enzyme |
| Chemical compound, drug | Biotin-11-dCTP | Jena Bioscience | NU-809-BIOX | |
| Chemical compound, drug | Biotin-14-dATP | Jena Bioscience | NU-835-BIO14 | |
| Commercial assay or kit | Qubit dsDNA HS Assay Kit | Life Technologies Corp. | Q32851 | |
| Chemical compound, drug | Atto 633 NHS ester | Sigma | 01464 | |
| Chemical compound, drug | Phase Lock Gel, QuantaBio - 2302830, Phase Lock Gel Heavy | VMR | 10847-802 | |
| Commercial assay or kit | NEBNext Ultra II DNA Library Prep Kit for Illumina | NEB | E7645S | |
| Commercial assay or kit | Ampure Xp 5 ml Kit | Thermo Fisher | NC9959336 | |
| Commercial assay or kit | Hifi Hotstart Ready Mix | Thermo Fisher | 501965217 | |
| Commercial assay or kit | Dynabeads MyOne Streptavidin C1 | Life Technologies Corp. | 65001 | |
| Chemical compound, drug | cOmplete, EDTA-free Protease Inhibitor Cocktail | Sigma | 11873580001 | |
| Chemical compound, drug | N,N-Dimethylformamide | Sigma | 227056 | |
| Chemical compound, drug | Potassium acetate solution | Sigma | 95843 | |
| Chemical compound, drug | DSG (disuccinimidyl glutarate) | Thermo Fisher | PI20593 | |
| Other | T4 Polynucleotide Kinase – 500 units | NEB | M0201S | Enzyme |
| Other | DNA Polymerase I, Large (Klenow) Fragment – 1000 units | NEB | M0210L | Enzyme |
| Commercial assay or kit | End-it DNA End Repair Kit | Thermo Fisher | NC0105678 | |
| Other | Proteinase K recomb. 100 mg | Sigma | 3115879001 | Enzyme |
| Other | Nuclease Micrococcal (s7) | Thermo Fisher | NC9391488 | Enzyme |
| Chemical compound, drug | EGS (ethylene glycol bis(succinimidyl succinate)) | Thermo Fisher | PI21565 | |
| Commercial assay or kit | Atto 565 NHS ester | Sigma | 72464 | |
| Commercial assay or kit | HCR RNA-FISH Custom Probe Set: eve | Molecular Instruments | Custom probes | |
| Commercial assay or kit | HCR RNA-FISH Custom Probe Set: ter94 | Molecular Instruments | Custom probes | |
| Commercial assay or kit | HCR RNA-FISH Custom Probe Set: CG12134 | Molecular Instruments | Custom probes | |
| Commercial assay or kit | HCR RNA-FISH Custom Probe Set: eIF3j | Molecular Instruments | Custom probes | |
| Commercial assay or kit | HCR Amplifier B1, 488 | Molecular Instruments | Custom probes | |
| Commercial assay or kit | HCR Amplifier B2, 564 | Molecular Instruments | Custom probes | |
| Commercial assay or kit | HCR Amplifier B3, 647 | Molecular Instruments | Custom probes | |
| Commercial assay or kit | HCR Buffers | Molecular Instruments | Custom probes | |
| Commercial assay or kit | NEBNext Multiplex Oligos for Illumina | NEB | E7335S | |
| Software, algorithm | Fiji (ImageJ) | Schindelin et al., 2012 | fiji.sc | |
| Software, algorithm | NIS element | Nikon | microscope.healthcare.nikon.com/products/software/nis-elements | |
| Software, algorithm | GraphPad Prism 8 | GraphPad Software | https://www.graphpad.com/ | |
| Software, algorithm | HiGlass | Kerpedjiev et al., 2018 | https://higlass.io/app | |
| Software, algorithm | bwa | Li and Durbin, 2009 | https://bio-bwa.sourceforge.net/ | |
| Software, algorithm | samtools | GitHub/open source | https://samtools.github.io | |
| Software, algorithm | pairsamtools | Goloborodko et al., 2024 | https://github.com/mirnylab/pairsamtools | |
| Software, algorithm | pairix | Lee, 2024 | https://github.com/4dn-dcic/pairix | |
| Software, algorithm | cooler | Abdennur and Mirny, 2020; Abdennur, 2016 | https://github.com/open2c/cooler | |
| Software, algorithm | Miniconda | Anaconda | https;//docs.conda.io/en/latest/miniconda/ | |
| Software, algorithm | Snakemake | GitHub/open source | https://snakemake.github.io |
Additional files
Download links
A two-part list of links to download the article, or parts of the article, in various formats.
Downloads (link to download the article as PDF)
Open citations (links to open the citations from this article in various online reference manager services)
Cite this article (links to download the citations from this article in formats compatible with various reference manager tools)
Stem-loop and circle-loop TADs generated by directional pairing of boundary elements have distinct physical and regulatory properties
eLife 13:RP94114.
https://doi.org/10.7554/eLife.94114.3


