Visual working memories are abstractions of percepts
- Department of Psychology, New York University, United States
- Center for Neural Science, New York University, United States
Figures
Figure 1
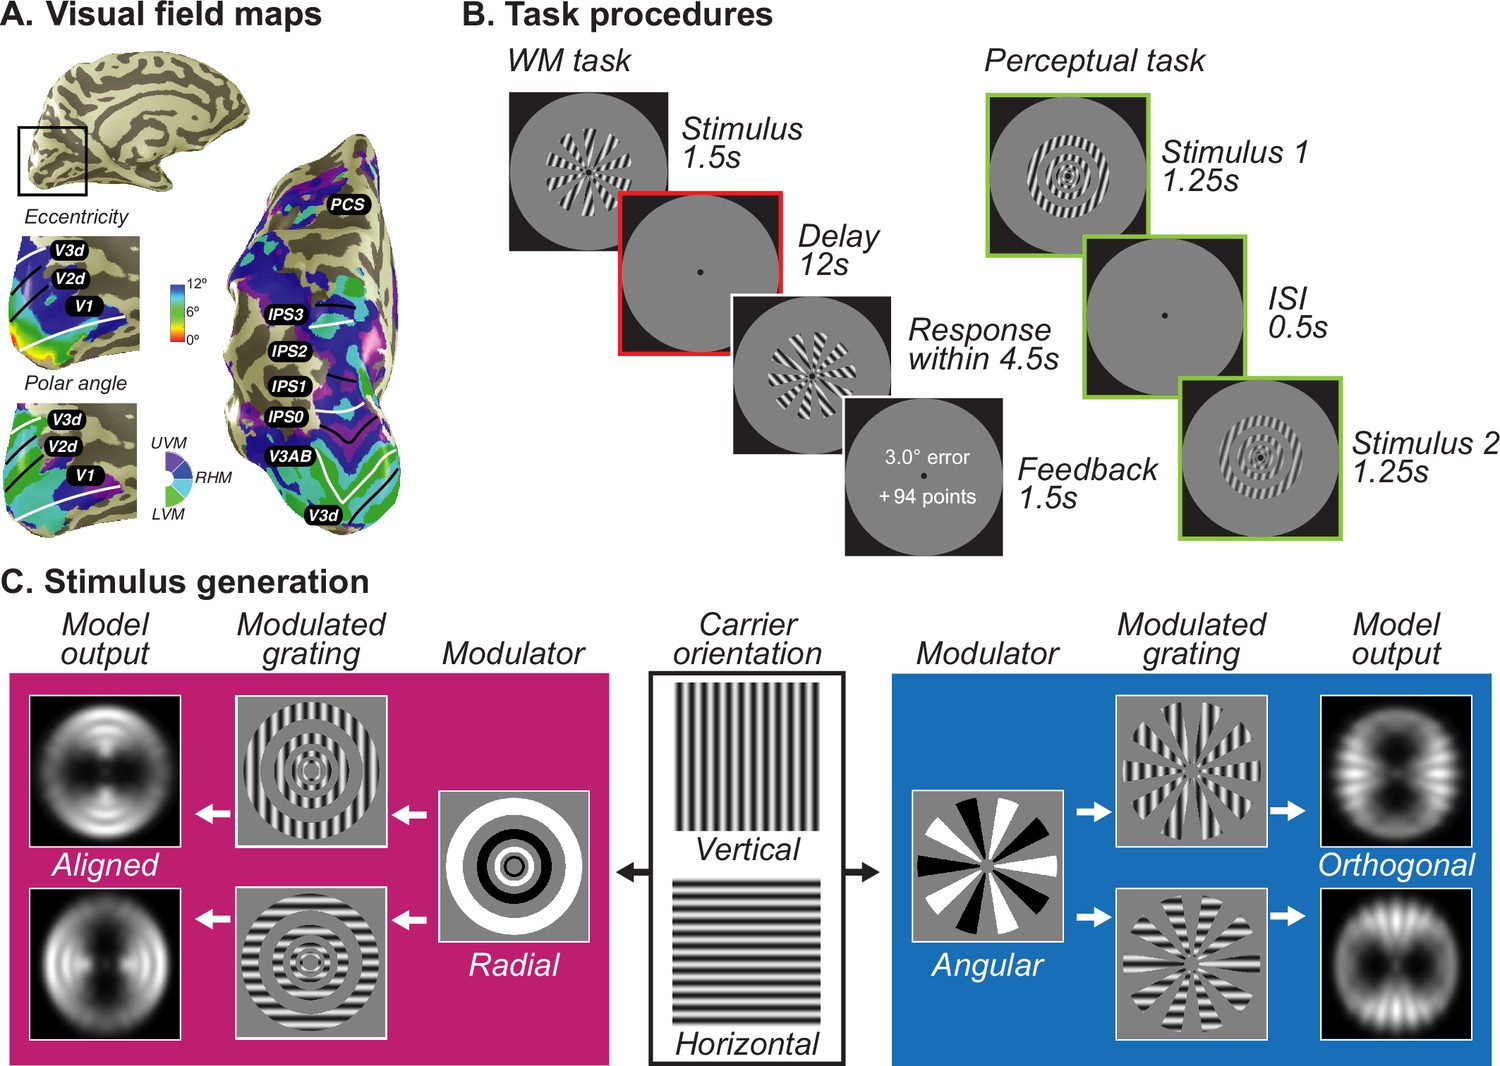
Population receptive field mapping, trial design, and stimuli generation schema.
(A) A separate retinotopic mapping session was used to estimate voxel receptive field parameters for defining visual field maps in visual, parietal, and frontal cortices. Example participant’s left hemisphere is shown.White lines denote the boundaries at the upper vertical meridian (UVM) and black lines denote the lower vertical meridian (LVM). (B) For the WM task (left), participants maintained the oriented stimuli over a 12 s retention interval and rotated a recall probe to match their memory. More points were awarded for less errors. For the perceptual control task (right), participants viewed the stimuli twice in a row with a short ISI and asked to decide which one has a higher contrast; it places no demand on remembering orientation. Colors denote different epoch of interests, green denotes stimulus epoch while red denotes delay epoch. (C) Each of the stimuli was created by multiplying a vertical or horizontal grating by a radial or angular modulator. These stimuli were used as input to the model. For radial modulated gratings (left in magenta), the model exhibits a radial preference: larger responses to vertical gratings along the vertical meridian and larger responses to horizontal gratings along the horizontal meridian. However, for angular modulated gratings (right in blue), the orientation preference is tangential: larger responses to vertical gratings along the horizontal meridian and larger responses to horizontal gratings along the vertical meridian. Here, we demonstrate the stimulus and aperture bias using vertical and horizontal carrier orientations. In the experiment, the carrier orientations were 15°, 75°, and 135° clockwise from vertical with random jitter (<7°).
Figure 2 with 3 supplements
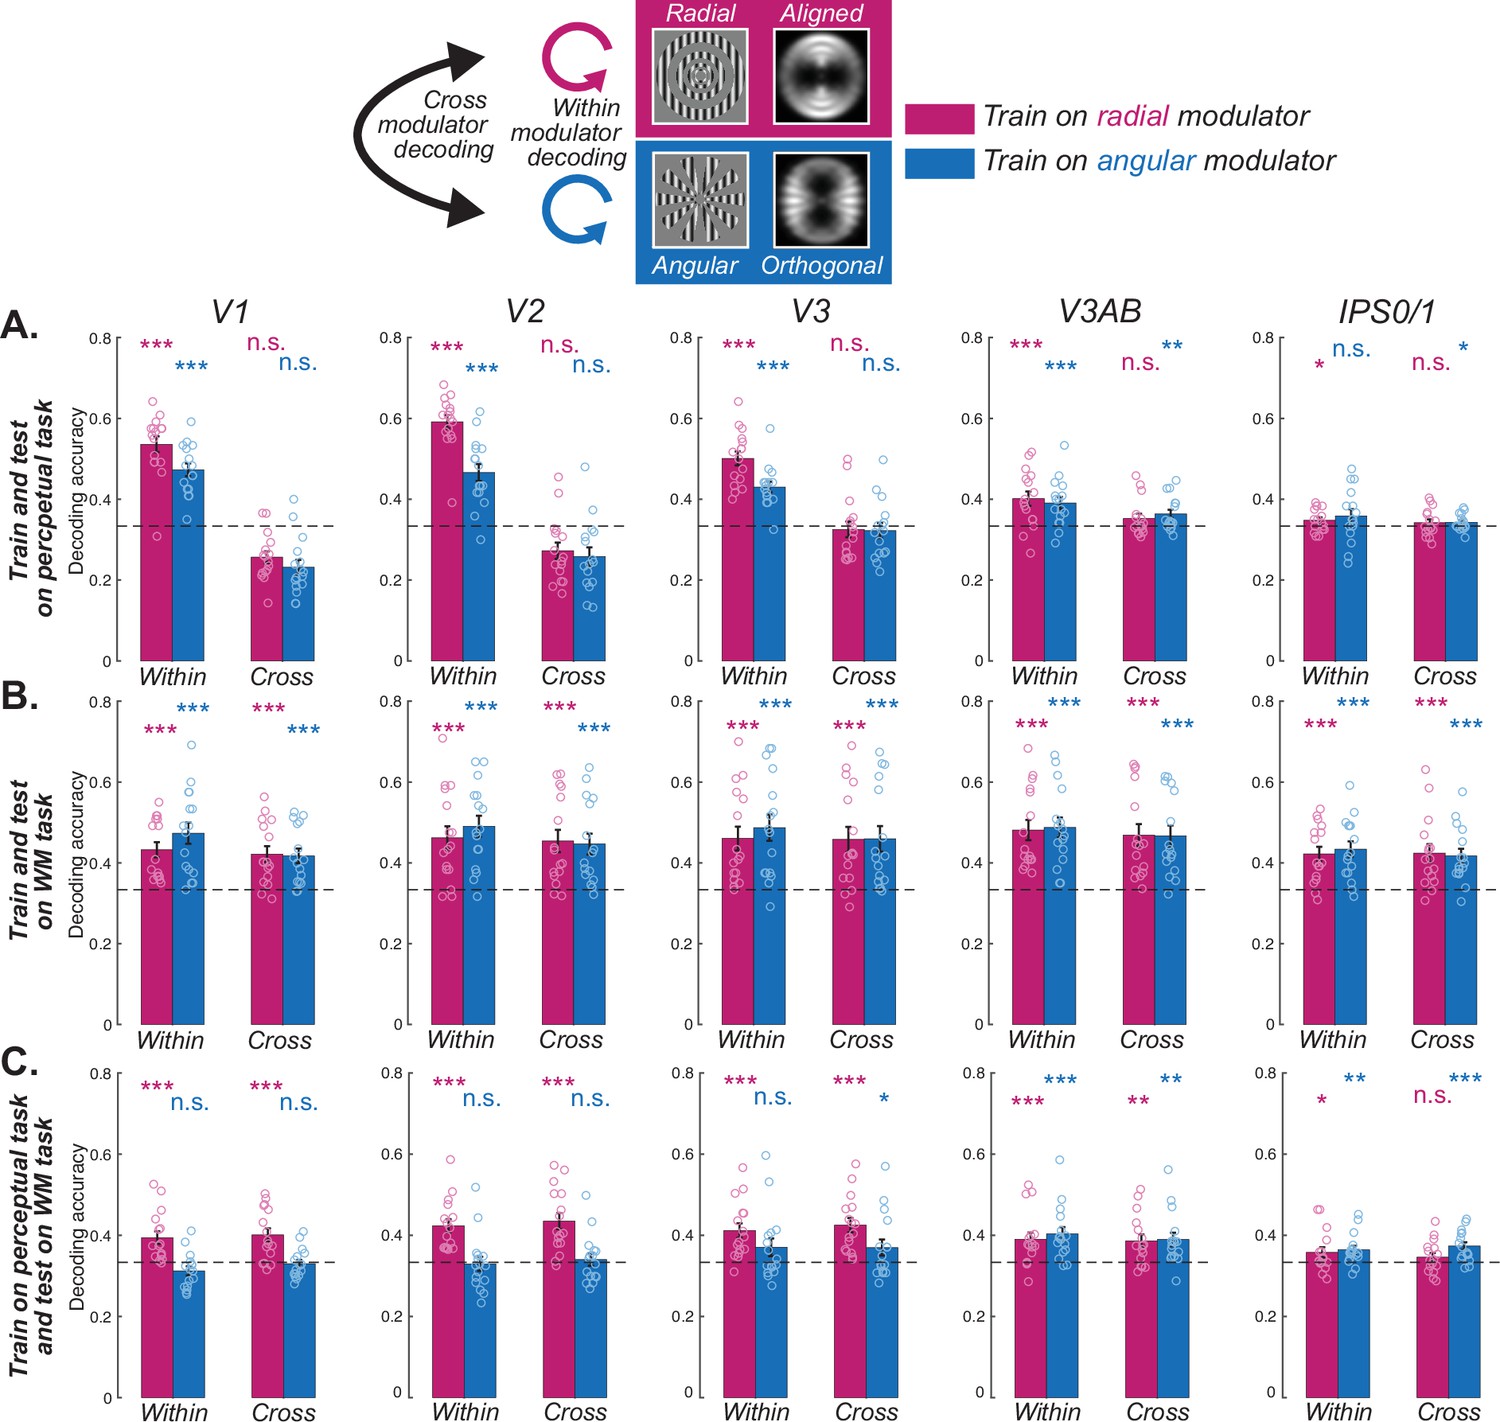
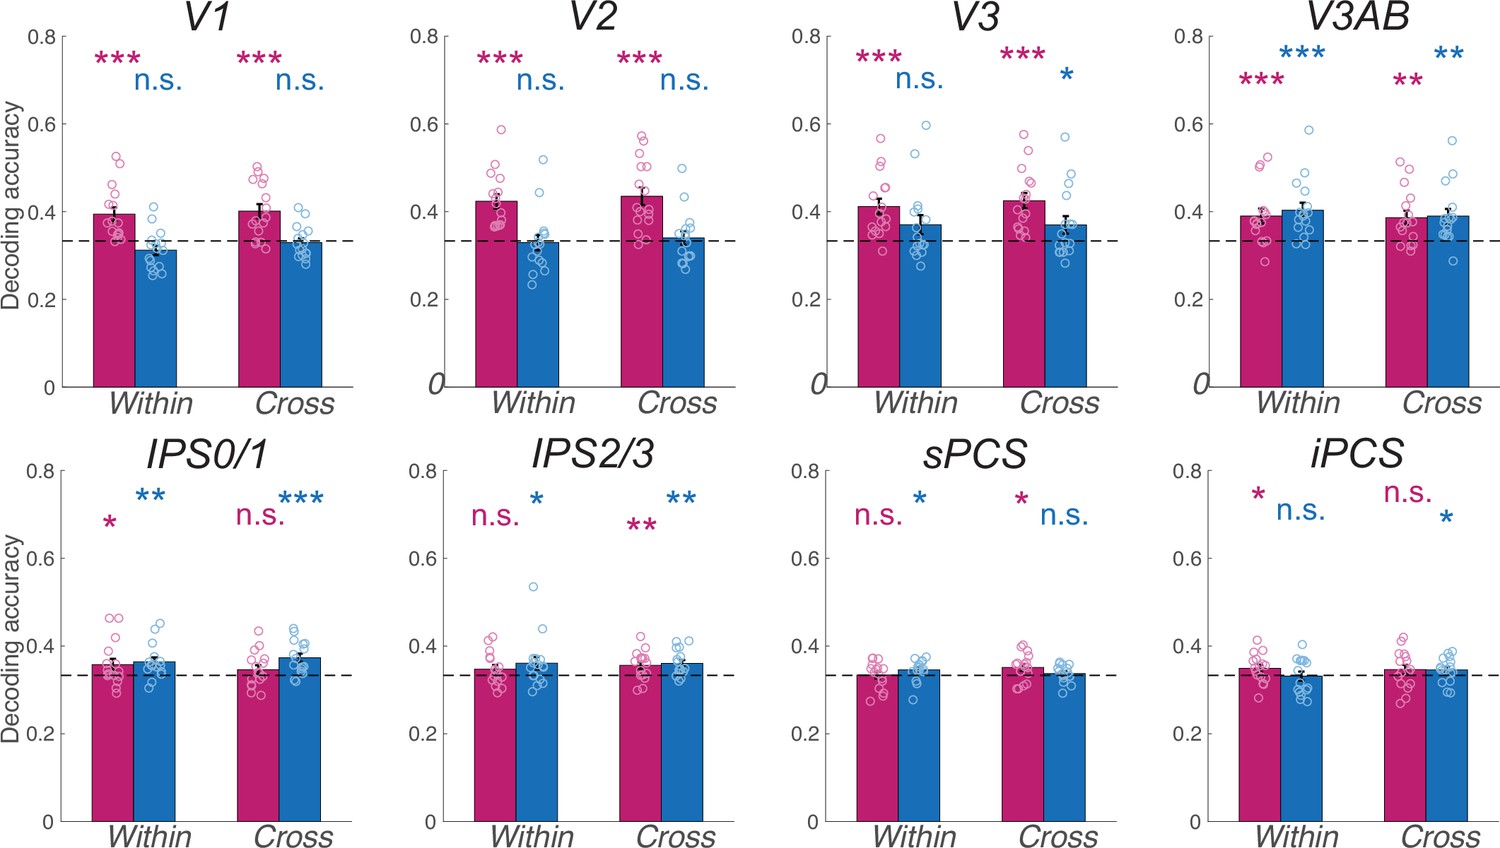
Decoding orientation during WM and perception.
(A) Orientations could be decoded only within each kind of modulator, but not across different modulators in visual cortex, indicating the influence of the aperture bias on the stimulus in the perceptual task. (B) Orientations could be decoded both within and cross modulators in both visual and parietal cortices, suggesting a shared format during the late delay epoch in the WM task. (C) When training the classifier based on the neural pattern of the radial modulator (magenta) in the perceptual task, orientations of both radial (within) and angular (cross) modulators could be decoded during the WM late delay epoch in the visual cortex. However, training the classifier based on the angular modulator (blue) could not be generalized, except for V3AB. Results suggest that neural patterns during WM late delay are only similar to perceptual representations when their aperture bias aligns with the orientation bias (radial modulator) in early visual cortex (V1–V3). *p<0.05, **p<0.01, ***p<0.001, n.s. Not significant. Error bars represent ±1 SEM. Small circles for each bar represent individual data (n=16). Dashed horizontal line denotes theoretical chance level (1/3), but results are based on non-parametric permutation tests. Results for all ROIs can be seen in Figure 2—figure supplements 1–3. Statistical results can be seen in Supplementary file 1a-c.
Figure 2—figure supplement 1
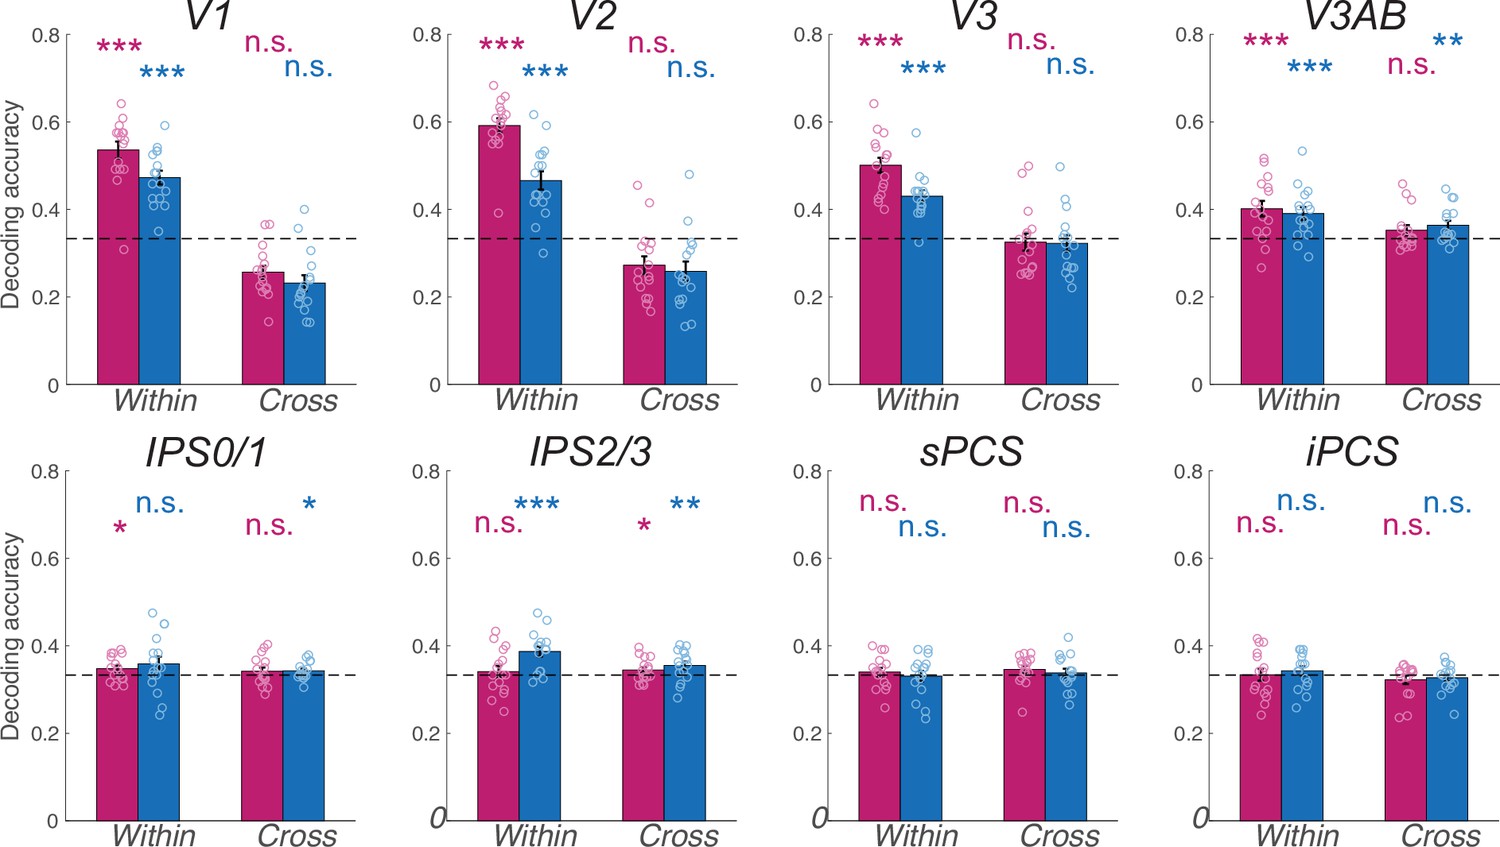
Within and cross-modulator decoding results by using the stimulus period of the perceptual control task for all ROIs.
*p<0.05, **p<0.01, ***p<0.001, n.s. Not significant. Error bars represent ±1 SEM. Small circles for each bar represent individual data (n=16). Dashed horizontal line denotes theoretical chance level (1/3), but results are based on non-parametric permutation tests.
Figure 2—figure supplement 2
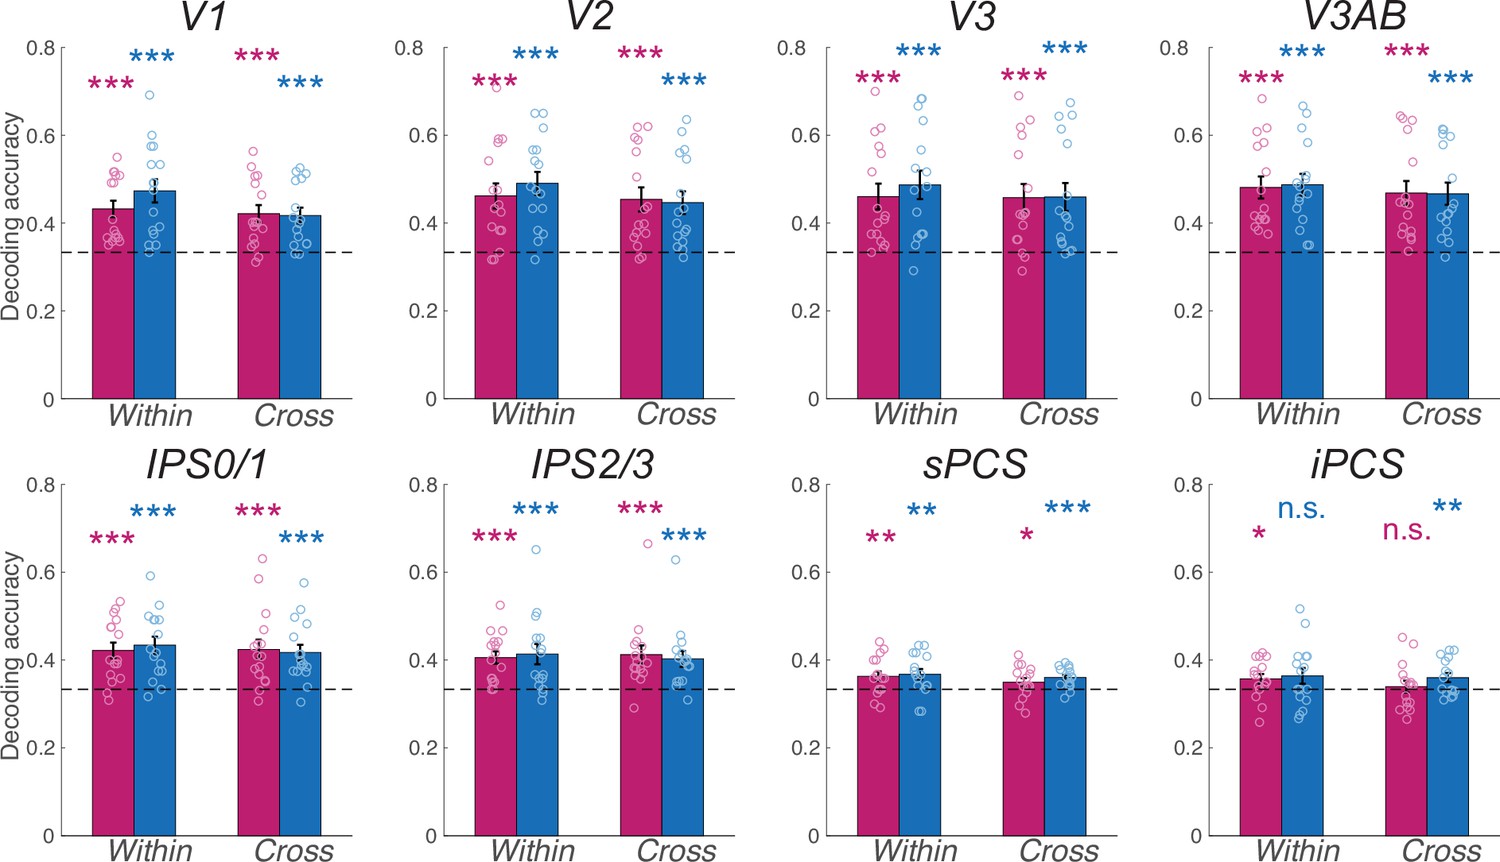
Within and cross-modulator decoding results by using the late delay period of the WM task for all ROIs.
*p<0.05, **p<0.01, ***p<0.001, n.s. Not significant. Error bars represent ±1 SEM. Small circles for each bar represent individual data (n=16). Dashed horizontal line denotes theoretical chance level (1/3), but results are based on non-parametric permutation tests.
Figure 2—figure supplement 3
Within and cross-modulator decoding results by training classifiers based on the stimulus period of the control task and testing them on the late delay period of the WM task for all ROIs.
*p<0.05, **p<0.01, ***p<0.001, n.s. Not significant. Error bars represent ±1 SEM. Small circles for each bar represent individual data (n=16). Dashed horizontal line denotes theoretical chance level (1/3), but results are based on non-parametric permutation tests.
Figure 3 with 2 supplements
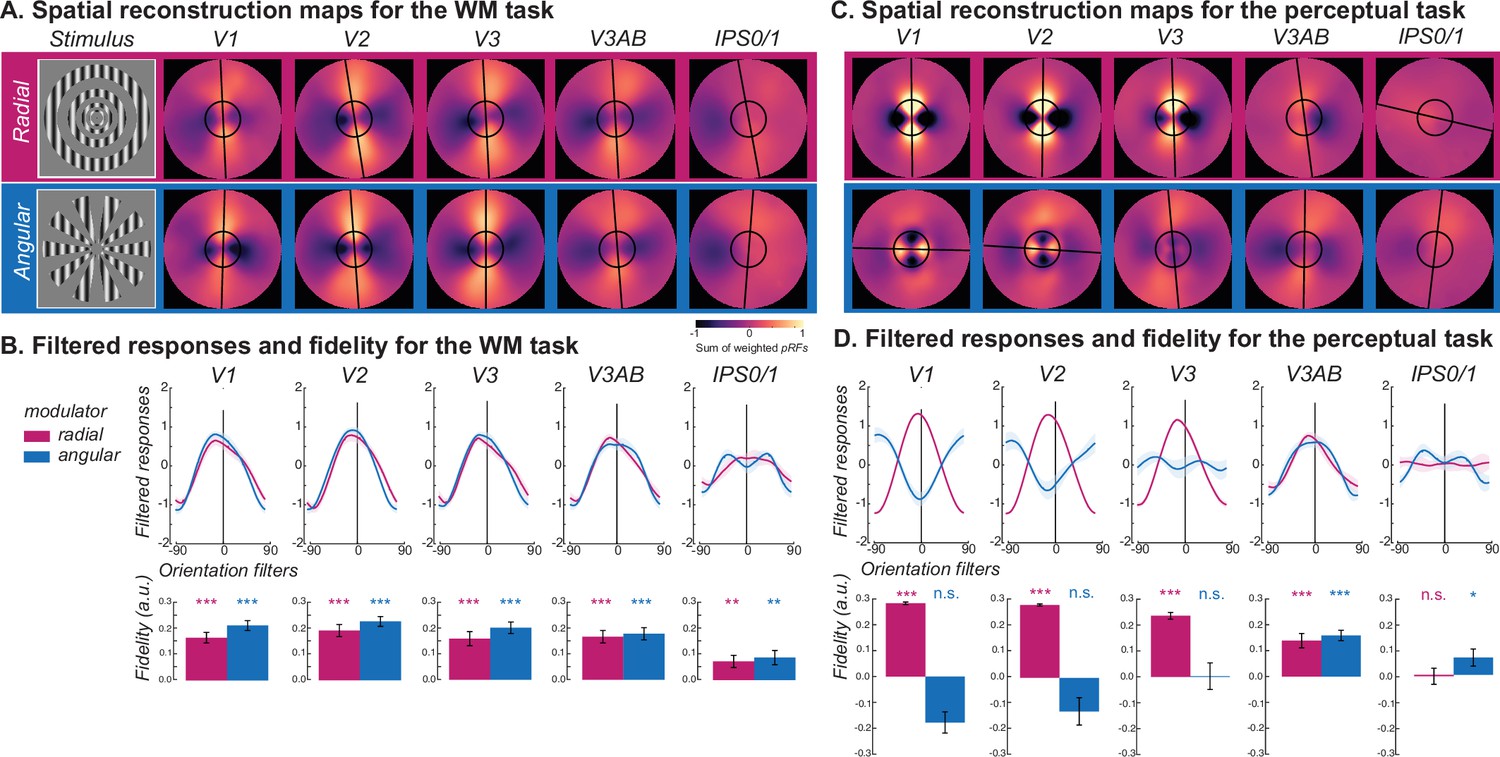
Visualizing WM and perception of radial and angular modulated oriented gratings.
(A) Line-like patterns emerged across maps of visual space matching the memorized orientation of carrier gratings regardless of the type of modulator (radial - magenta; angular - blue) during the late delay period of the WM task. Spatial maps were rotated such that all orientations were aligned at 0° (top). The warmer colors correspond to increased amplitude of BOLD activity in voxels with receptive fields corresponding to that portion of the visual field. Best fitting lines (black lines) and the size of the stimulus (black circles) are overlaid. (B) Quantitative analysis confirmed the line-like patterns being aligned with the carrier orientation in the WM task. Filtered responses (top row) represent the sum of pixel values within the area of a line-shaped mask (12° length) oriented –90°–90°, where 0° represents the true orientation. Fidelity values (bottom row) are the result of projecting the filtered responses to 0° (see Methods), where higher fidelity values indicate stronger stimulus orientation representations. (C) Unlike the WM task, during the perception task the angle of the line-like patterns depended on the type of modulator in early visual areas (V1 and V2), where the line matched the orientation of the aperture bias, not the carrier. Note how the line is orthogonal to the angular modulated carrier in early visual cortex (V1 and V2) but not in later visual field maps (e.g. V3A/B). (D) During the perception task, the line-like representations in early visual cortex for radial but not angular modulated orientations result in strong filtered responses and fidelities. *p<0.05, **p<0.01, ***p<0.001. Error bars represent±1SEM (n=16). Results for all ROIs can be seen in Figure 3, Figure 3—figure supplements 1 and 2. Statistical results can be seen in Supplementary file 1d-e.
Figure 3—figure supplement 1
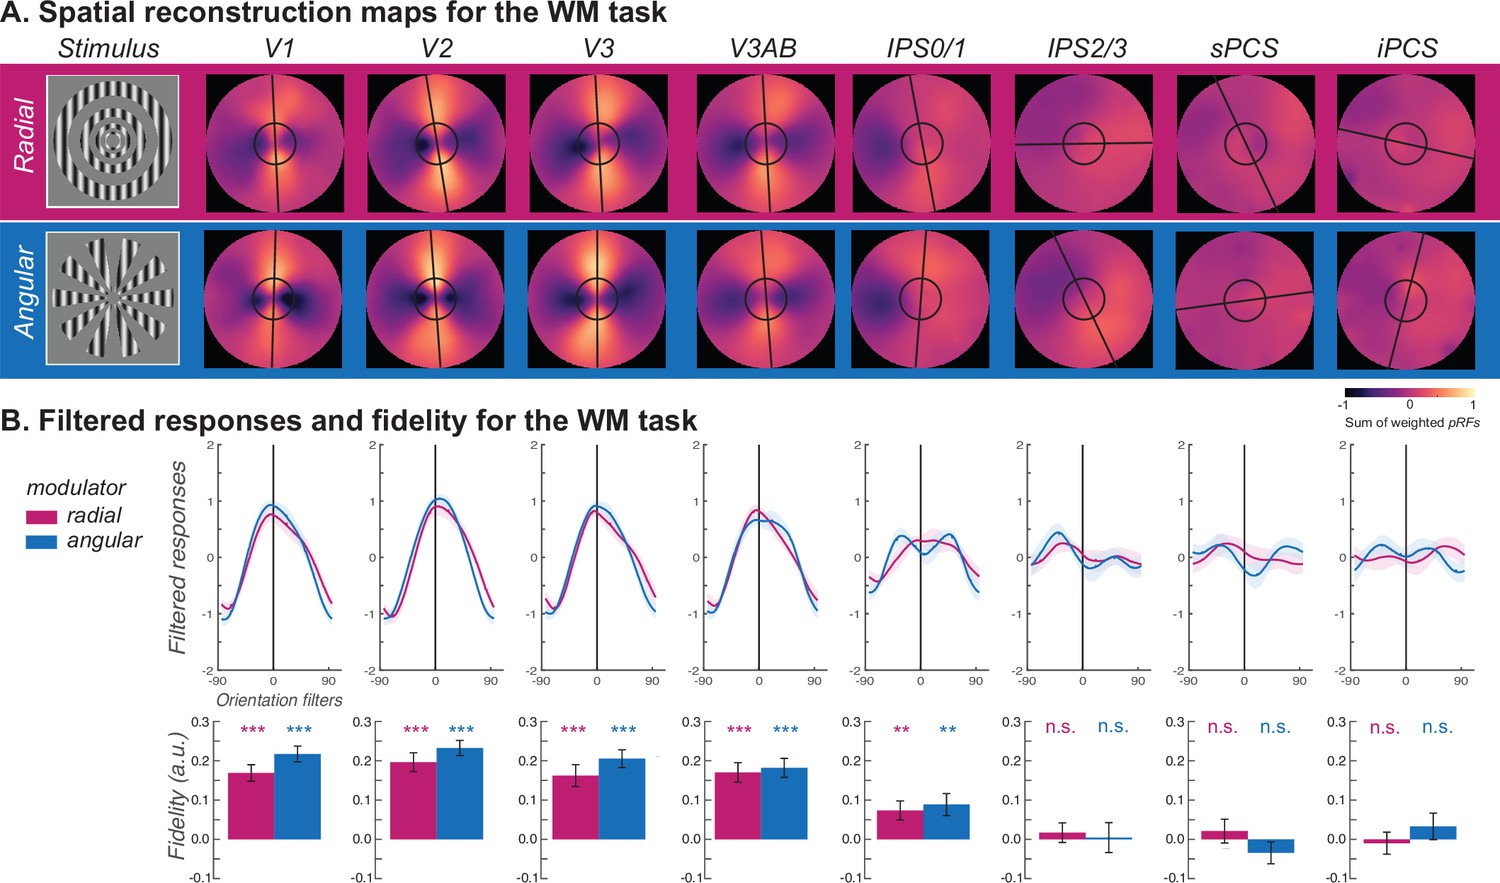
Spatial reconstruction results for the WM task across all ROIs.
(A) Line-like patterns emerged across maps of visual space matching the memorized orientation of carrier gratings regardless of the type of modulator (radial - magenta; angular - blue) during the late delay period of the WM task. Spatial maps were rotated such that all orientations were aligned at 0° (top). The warmer colors correspond to increased amplitude of BOLD activity in voxels with receptive fields corresponding to that portion of the visual field. Best fitting lines (black lines) and the size of the stimulus (black circles) are overlaid. (B) Filtered responses (top row) represent the sum of pixel values within the area of a line-shaped mask (12° length) oriented –90°–90°, where 0° represents the true orientation. Fidelity values (bottom row) are the result of projecting the filtered responses to 0° (see Methods), where higher fidelity values indicate stronger stimulus orientation representations. *p<0.05, **p<0.01, ***p<0.001. Error bars represent±1SEM (n=16).
Figure 3—figure supplement 2
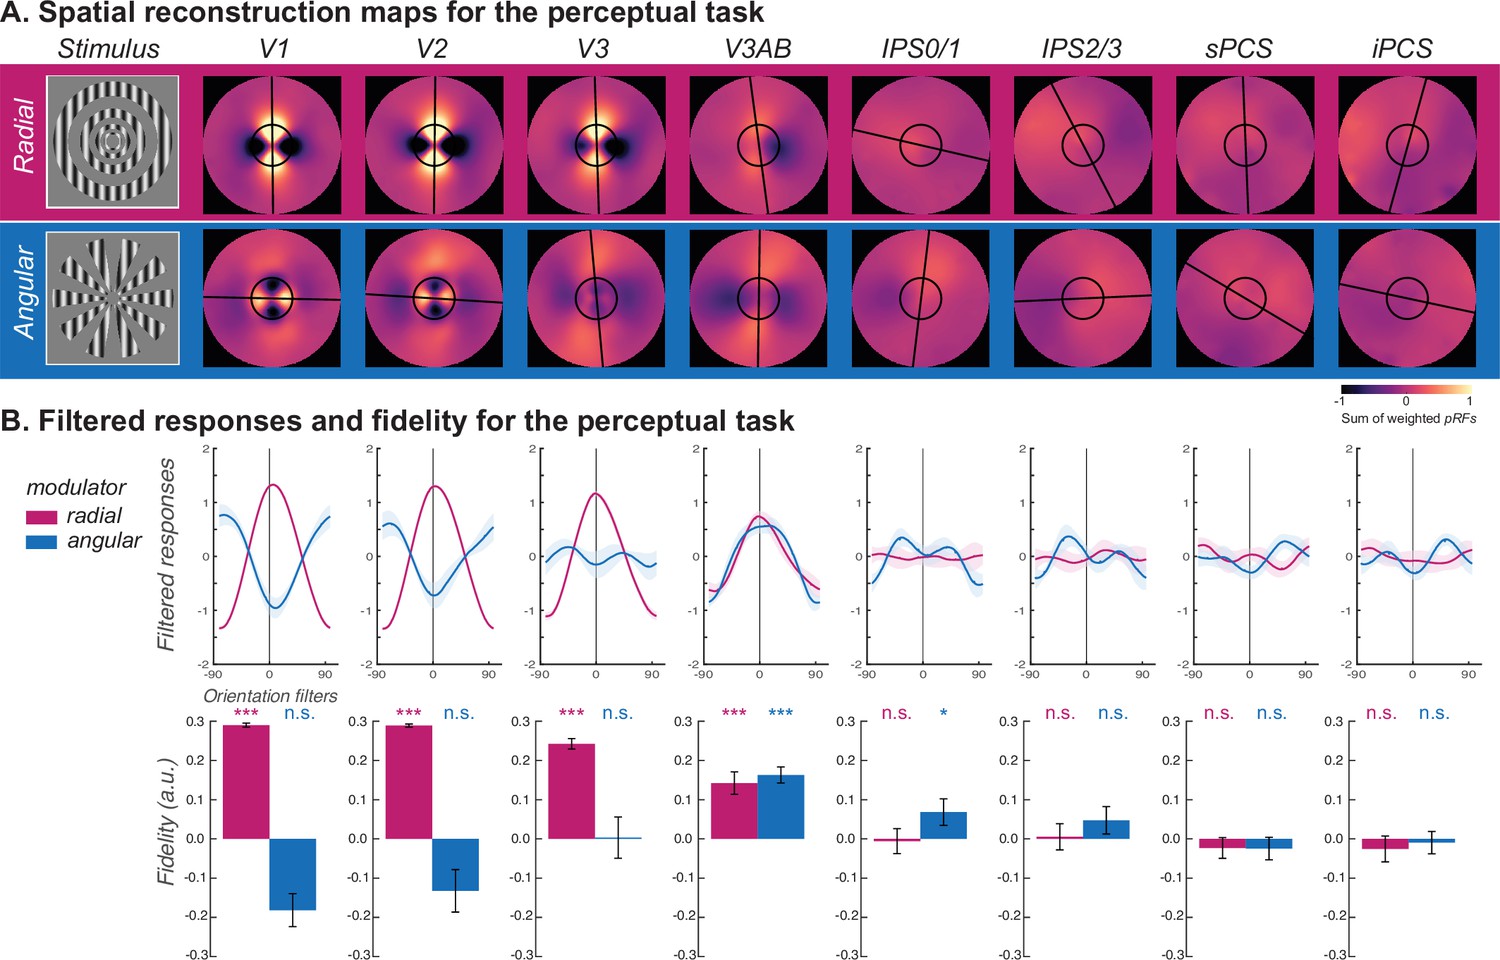
Spatial reconstruction results for the perceptual control task across all ROIs.
(A) Line-like patterns emerged across maps of visual space matching the memorized orientation of carrier gratings regardless of the type of modulator (radial - magenta; angular - blue) during the delay period of the perceptual task. Spatial maps were rotated such that all orientations were aligned at 0° (top). The warmer colors correspond to increased amplitude of BOLD activity in voxels with receptive fields corresponding to that portion of the visual field. Best fitting lines (black lines) and the size of the stimulus (black circles) are overlaid. (B) Filtered responses (top row) represent the sum of pixel values within the area of a line-shaped mask (12° length) oriented –90°–90°, where 0° represents the true orientation. Fidelity values (bottom row) are the result of projecting the filtered responses to 0° (see Methods), where higher fidelity values indicate stronger stimulus orientation representations. *p<0.05, **p<0.01, ***p<0.001. Error bars represent±1SEM (n=16).
Figure 4
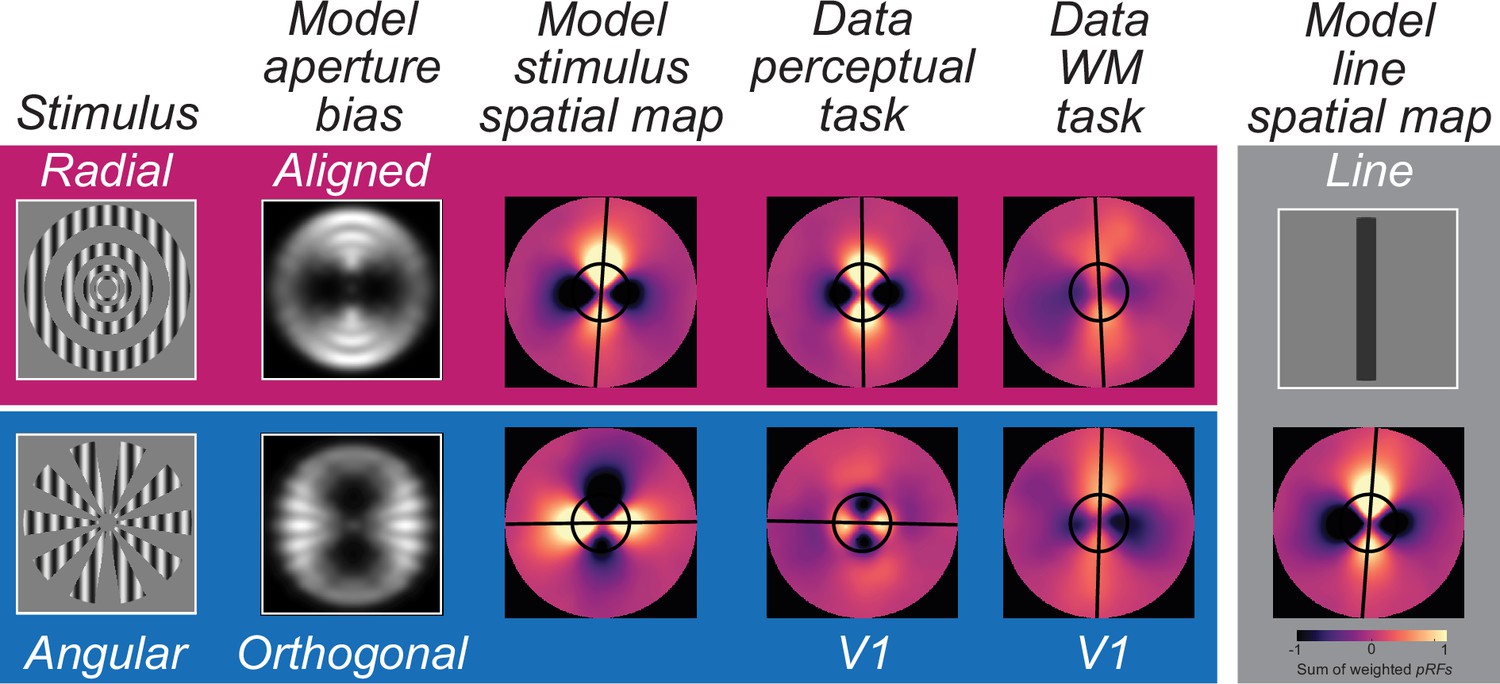
Modeling and reconstructing spatial maps of perceptual and mnemonic representations in V1.
At the left, we illustrate the output of the model of V1 depicting the aperture biases aligned and orthogonal to the carrier orientation for radial and angular modulators, respectively. Using these modeled responses as inputs, we visualized the population code employing the measured pRF parameters from V1 (see Methods). In the modeled stimulus spatial map, line-like representations match the aperture biases, which in turn matches the observed data from V1 during the perception task. Critically, during WM storage, the line-like representations are aligned with the memorized carrier orientation in V1, regardless of modulator type. At the right and using the same model of V1, we visualize a WM representation in V1 assuming that participants are maintaining in WM a simple line that matches the carrier orientation.
Author response image 1

Reconstruction maps for the dot image at the edge of 15°, 75°, 135°, and the combined across three orientation conditions.
Additional files
-
Supplementary file 1
Decoding accuracy tables with statistical results.
(a) Decoding accuracy for the stimulus-presenting epoch in the perceptual control task. (b) Decoding accuracy for the late delay epoch in the WM task. (c) Decoding accuracy for the cross-task decoding by training the classifier in the perceptual control task and testing it in the WM task. (d) Reconstruction fidelity values for the late delay epoch in the WM task. (e) Reconstruction fidelity values for the stimulus-presenting epoch in the perceptual control task.
- https://cdn.elifesciences.org/articles/94191/elife-94191-supp1-v1.docx
-
MDAR checklist
- https://cdn.elifesciences.org/articles/94191/elife-94191-mdarchecklist1-v1.docx
Download links
A two-part list of links to download the article, or parts of the article, in various formats.
Downloads (link to download the article as PDF)
Open citations (links to open the citations from this article in various online reference manager services)
Cite this article (links to download the citations from this article in formats compatible with various reference manager tools)
Visual working memories are abstractions of percepts
eLife 13:RP94191.
https://doi.org/10.7554/eLife.94191.3


