Speech-induced suppression and vocal feedback sensitivity in human cortex
- Neurology Department, New York University, United States
- Max Planck Institute for Psycholinguistics, Netherlands
- Biomedical Engineering Department, New York University, United States
- Neurosurgery Department, New York University, United States
Figures
Figure 1
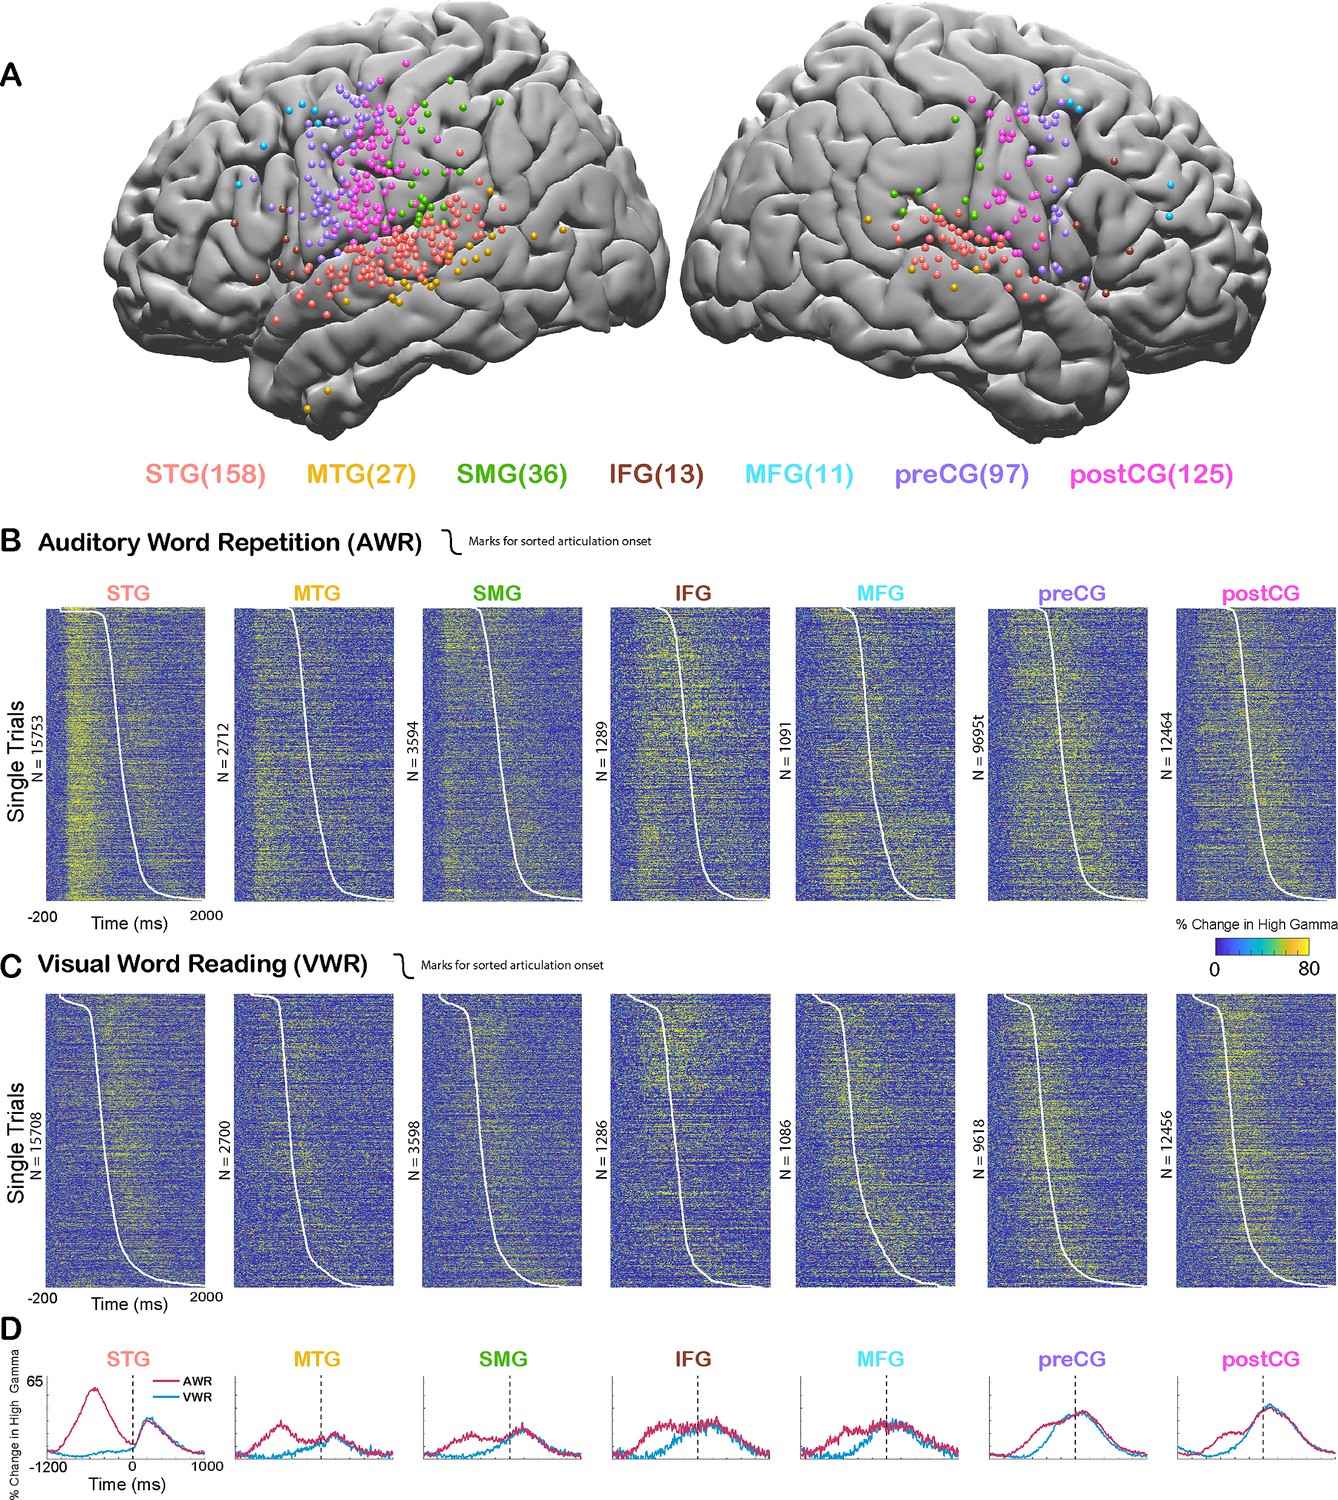
Cortical responses during speech tasks.
(A) Electrodes from all participants (n=35) are shown on a template brain with different colors corresponding to different regions (number of electrodes in each region denoted in the parentheses). (B) High gamma broadband responses (70–150 Hz) for individual trials in an auditory word repetition task are shown for each region. (C) High gamma responses for individual trials in a visual word reading task are shown for each region. Trials are sorted with respect to speech onset (white line). (D) Mean high gamma broadband responses averaged across trials are shown for each region with the width representing the standard error of the mean across electrodes. Time = 0 indicates speech production onset.
Figure 2
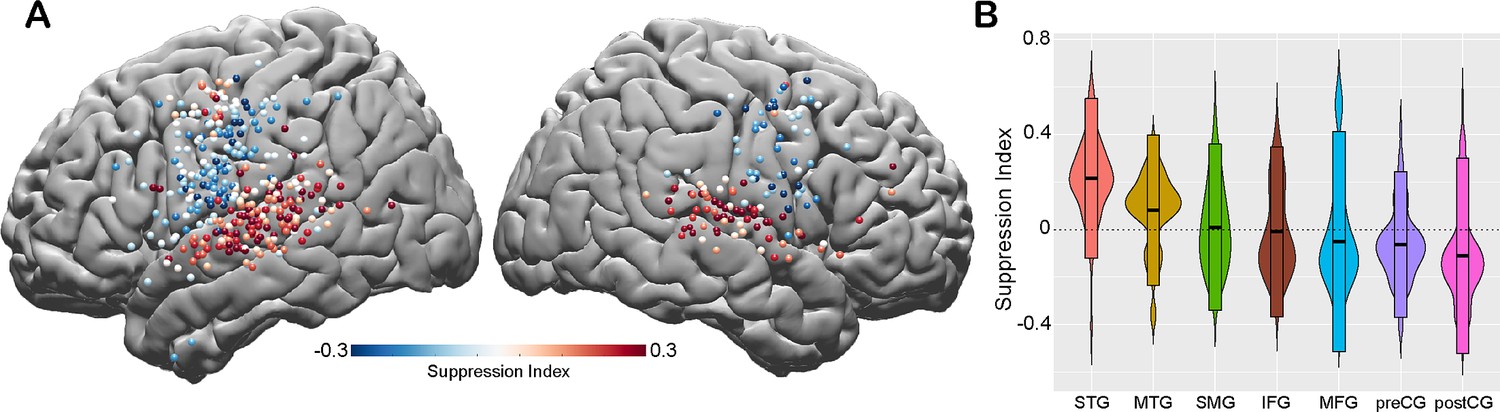
Spatial topography of speech-induced auditory suppression.
(A) Suppression indices for all electrodes are shown on a template brain. Red color tones indicate smaller neural activity during speaking, while blue electrodes indicate larger neural activity during speaking compared to listening in the auditory word repetition task. (B) Suppression indices averaged across electrodes are shown for each region sorted from largest to smallest mean suppression index. Boxplots indicate mean ± SD.
Figure 3
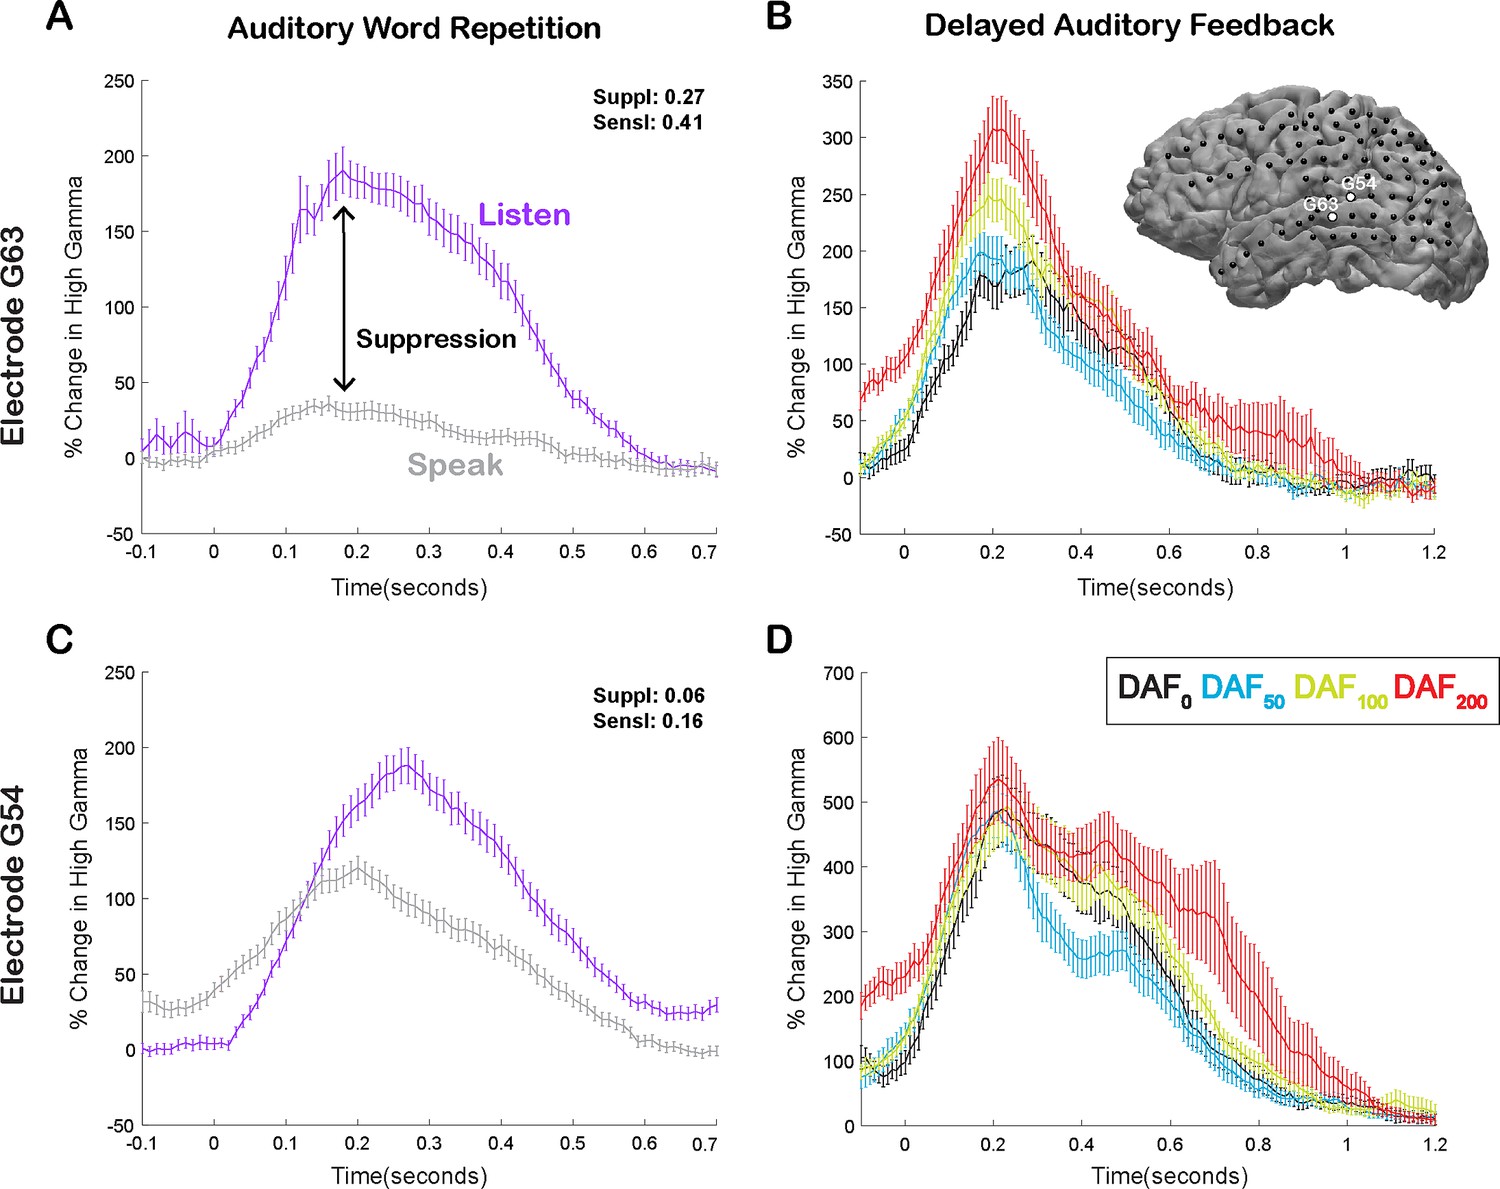
Speech-induced auditory suppression and sensitivity to delayed auditory feedback (DAF) in representative electrodes in a single participant.
(A) High gamma broadband response (70–150 Hz) in electrode G63 showing a large amount of auditory suppression during speaking words compared to listening to the same words. Error bars indicate SEM over trials. (B) High gamma responses in electrode G63 to articulation of words with DAF. 0 s indicate the onset of the perceived auditory feedback. Inset figure shows the cortical surface model of the left hemisphere brain of a single participant. Black circles indicate the implanted electrodes. White highlighted electrodes are located on the middle (G63) and caudal (G54) superior temporal gyrus (STG). (C) High gamma response in electrode G54 showing a small degree of auditory suppression during speaking words compared to listening. (D) High gamma response in electrode G54 locked to articulation of words during DAF. 0 s indicate the onset of the perceived auditory feedback.
Figure 4
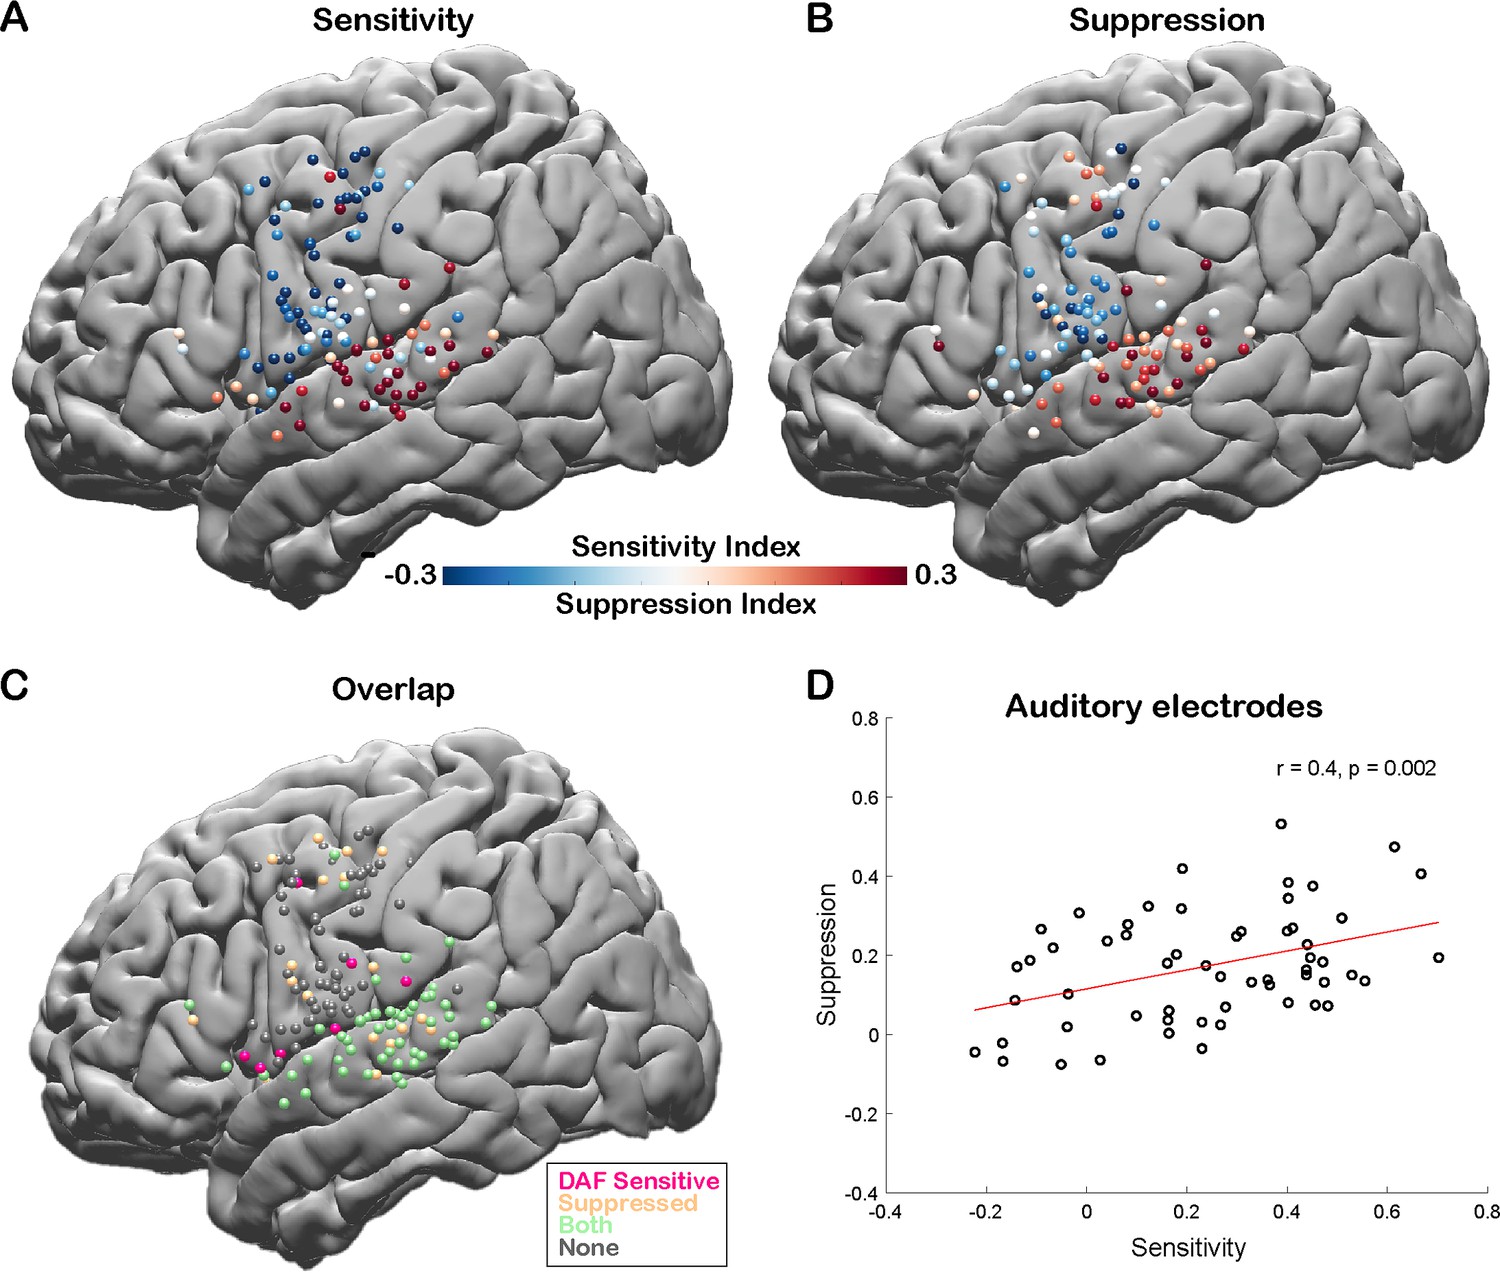
Correlation between speech-induced auditory suppression and sensitivity to delayed auditory feedback (DAF).
(A) Sensitivity indices (SensI) for all electrodes are shown on a template brain (both right and left hemisphere electrodes were shown on the left hemisphere). Red tones indicate larger neural activity to increasing amount of delays in the DAF task, while blue tones indicate the opposite. (B) Suppression indices (SuppI) for all electrodes are shown on a template brain. Red tones indicate larger neural activity during listening compared to speaking in the auditory word repetition task, while blue tones indicate the opposite. (C) Electrodes that show either sensitivity to DAF (positive SensI value) or speech-induced auditory suppression (positive SuppI value), or both are shown on a template brain. (D) Scatter plot and fitted regression showing a significant correlation between sensitivity to DAF and speech-induced auditory suppression across auditory electrodes. Each circle represents an electrode’s SensI and SuppI.
Figure 5
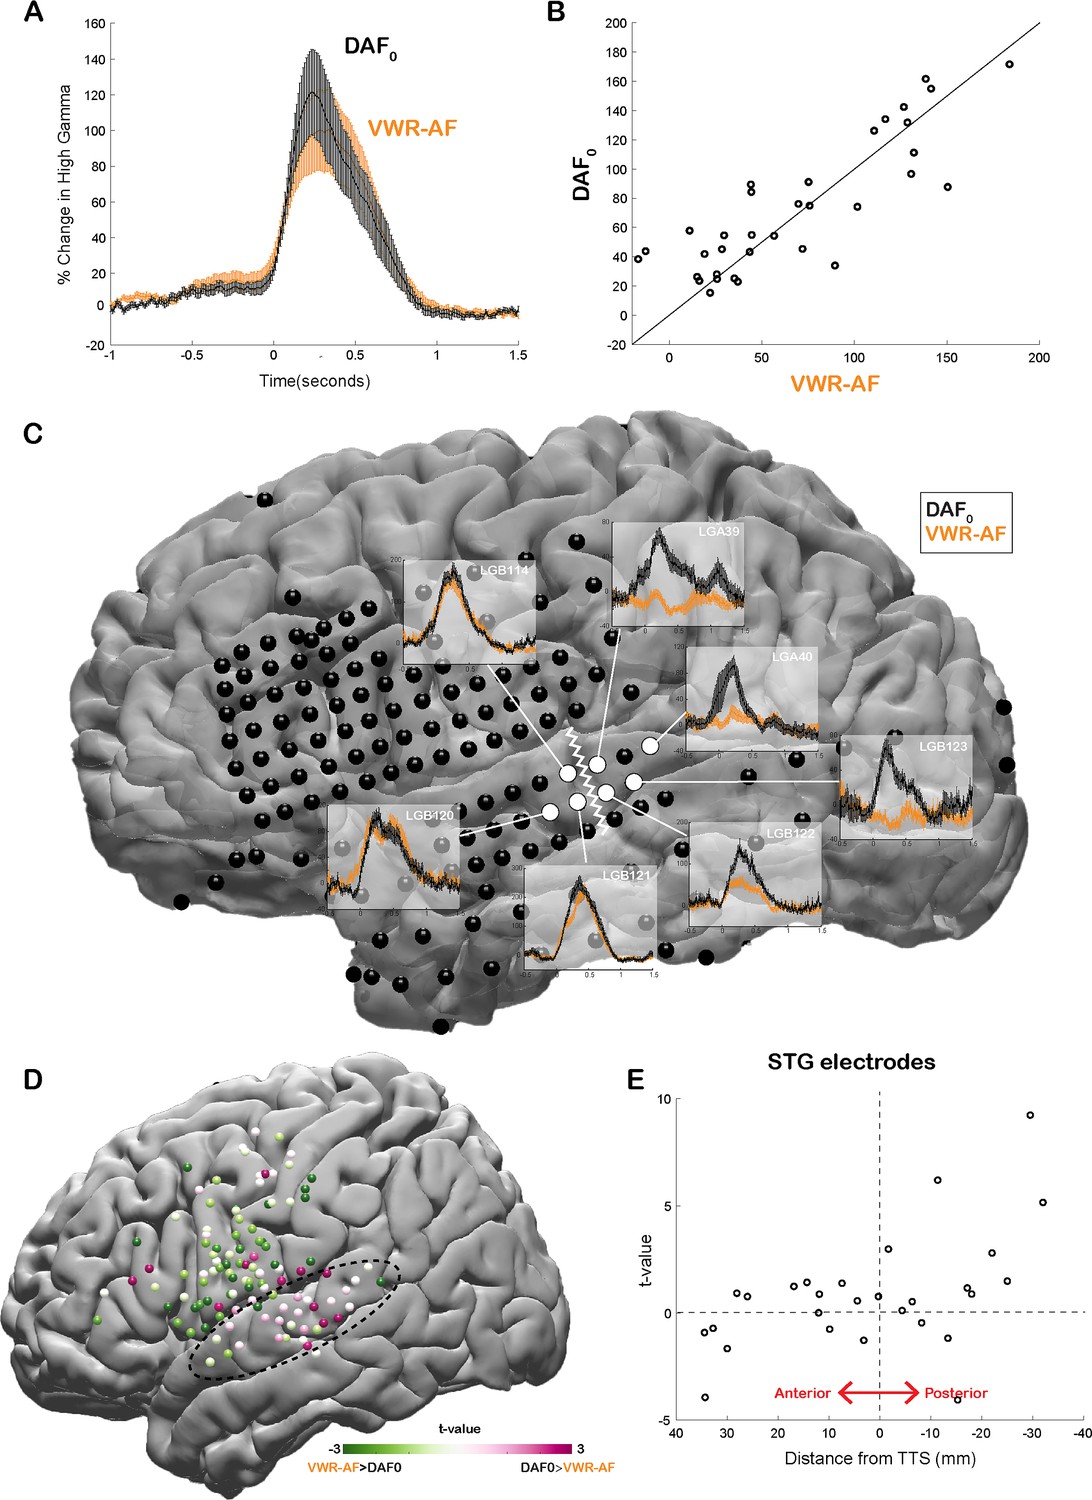
Effect of the delayed auditory feedback (DAF) paradigm on neural responses during speech.
(A) High gamma broadband responses (70–150 Hz) averaged across auditory electrodes are similar during no-delay condition in the DAF task (DAF0) and during visual word reading with auditory feedback (VWR-AF). Error bars indicate SEM across electrodes. (B) Scatter plot shows averaged high gamma responses (0–500 ms) for VWR-AF versus DAF0 conditions for auditory electrodes. (C) High gamma responses for DAF0 and VWR-AF are shown in representative auditory electrodes in a single participant. Electrodes that are posteriorly located on the superior temporal gyrus (STG) show larger responses to DAF0 condition, while electrodes that are anteriorly located on the STG show similar responses to the two conditions. The lateral termination of the transverse temporal sulcus (TTS) is identified as a landmark (white zigzagged line) that separates the two different response patterns. (D) High gamma responses for DAF0 and VWR conditions were compared and resulting t-values are shown for all electrodes on a template brain. Pink color tones indicate larger responses to DAF0, while green color tones indicate larger responses to VWR condition. (E) t-values calculated by comparing responses to DAF0 and VWR conditions are shown for all auditory electrodes with respect to their anterior-to-posterior positions to the TTS.
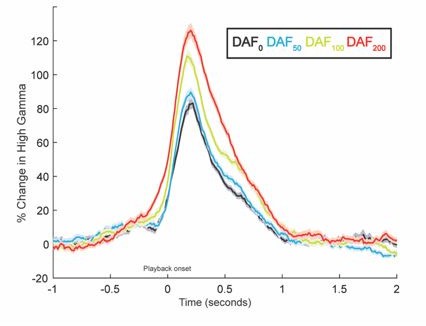
Author response image 1

Author response image 2
Additional files
Download links
A two-part list of links to download the article, or parts of the article, in various formats.
Downloads (link to download the article as PDF)
Open citations (links to open the citations from this article in various online reference manager services)
Cite this article (links to download the citations from this article in formats compatible with various reference manager tools)
Speech-induced suppression and vocal feedback sensitivity in human cortex
eLife 13:RP94198.
https://doi.org/10.7554/eLife.94198.3


