A scale-invariant log-normal droplet size distribution below the critical concentration for protein phase separation
- Department of Physics and Astronomy, University of Padova, Italy
- Centre for Misfolding Diseases, Department of Chemistry, University of Cambridge, United Kingdom
- National Institute for Nuclear Physics (INFN), Padova Section, Italy
- Department of Biomedical Sciences, University of Padova, Italy
Figures
Figure 1
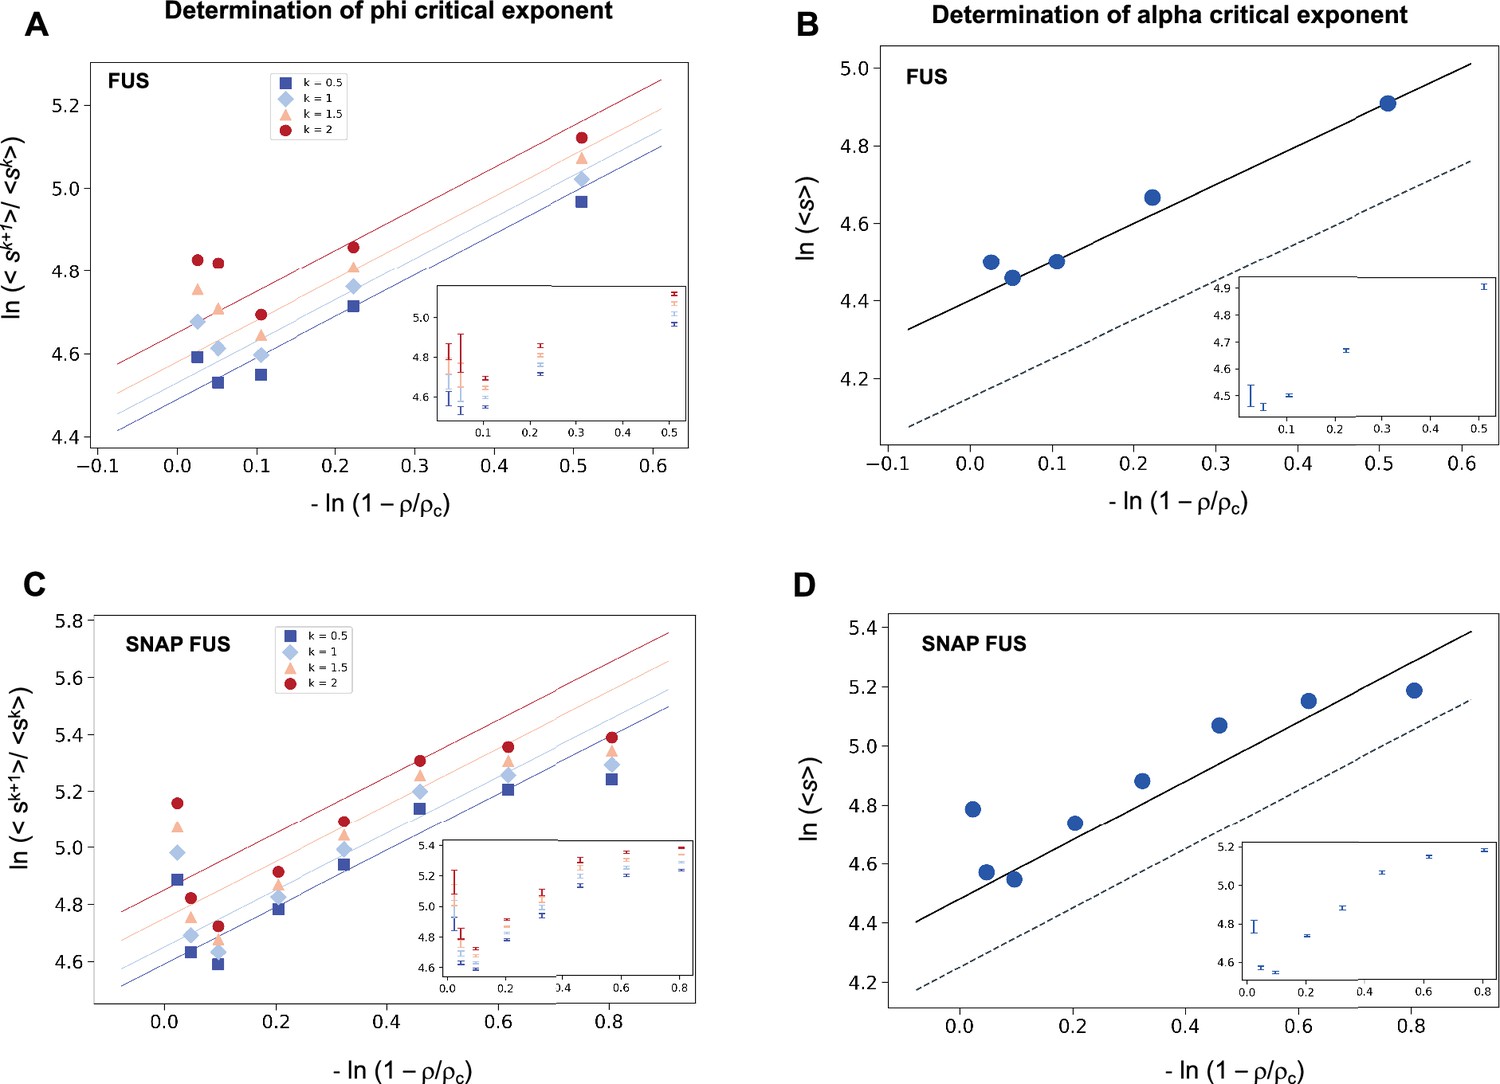
Determination of the critical exponents for FUS of the scaling invariance.
Determination of the exponent φ for FUS (A) and SNAP-tagged FUS (C). The ratios of the average moments of the droplet sizes (<sk+1>/<sk > , at k = 0.5, 1, 1.5, 2, Equation 4) are represented at various distances from the critical concentration (). The exponent φ for each value of k was determined by error-weighted linear regressions. The exponent φ and its error were determined as mean and standard deviation of the three independent measurements (Equations 15 and 16). Error bars are shown in inset for graphical clarity. Determination of the exponent α for FUS (B) and SNAP-tagged FUS (D). The mean of the droplet size distributions is plotted at various distances from the critical concentration (). The value of the exponent m was determined by error-weighted linear regression (Equation 6), using , where the errors were standard deviations of the three independent measurements (Equation 16). Error bars, which were obtained as the standard deviation of the three independent measurements are shown in inset for graphical clarity. Error-weighted linear regressions are performed in both cases excluding the data point at the lowest concentration ρ = 0.125 μM. The fit corresponding to the scaling ansatz, compatible with φ = 1 and α = 0, is represented by a dashed grey line with a slope of 1.
Figure 2
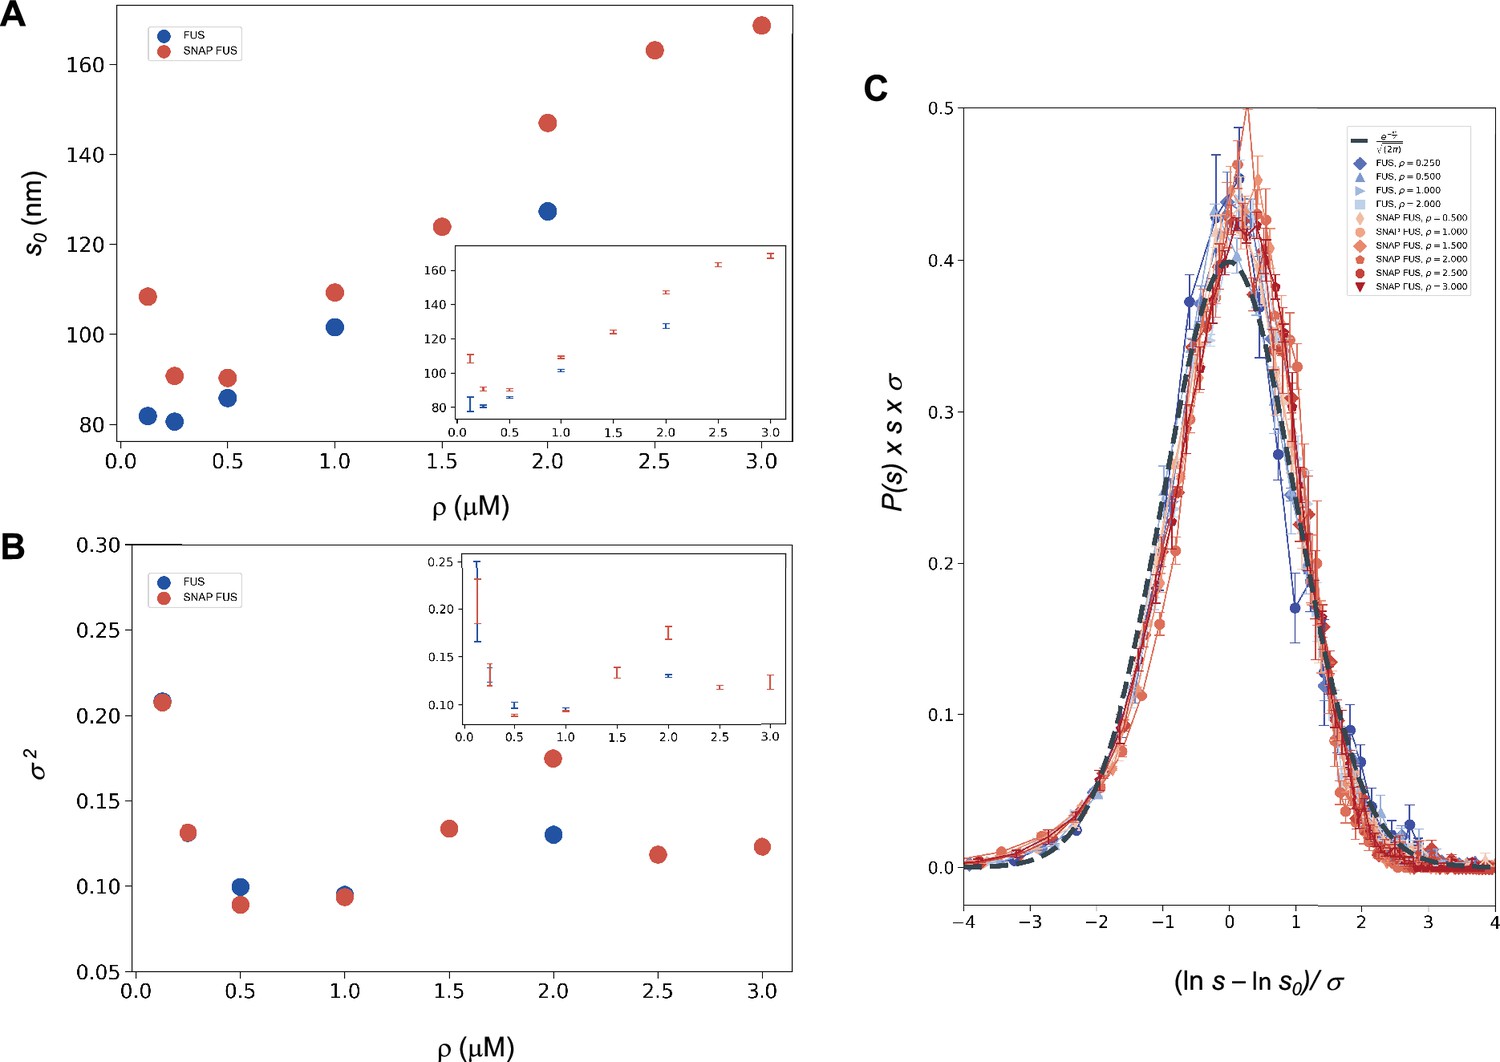
Log-normal behaviour of FUS and SNAP-tagged FUS size distributions below the critical concentration.
Variation of the size distribution with protein concentration: ln s0 (A) and σ (B). lns0 and σ (inset) were computed for FUS (blue) and SNAP-tagged FUS (red) using Equation 11. Error bars (in inset for graphical clarity) are estimated from three independent measurements. While droplet sizes increase with concentration, the width of distribution does not change considerably. (C) The collapse of the droplet size distribution functions is consistent with a log-normal behaviour. The droplet size distribution functions for both untagged FUS (blue) and SNAP-tagged FUS (red) are plotted after rescaling the sizes by the ln s0 and σ values, the first and second moments of the logarithm of the droplet size distribution, which are a function of the concentration. The rescaled curves for both the untagged and the tagged protein collapse to the normal distribution (grey dashed), as expected when the non-rescaled droplet sizes follow a log-normal distribution.
Figure 3
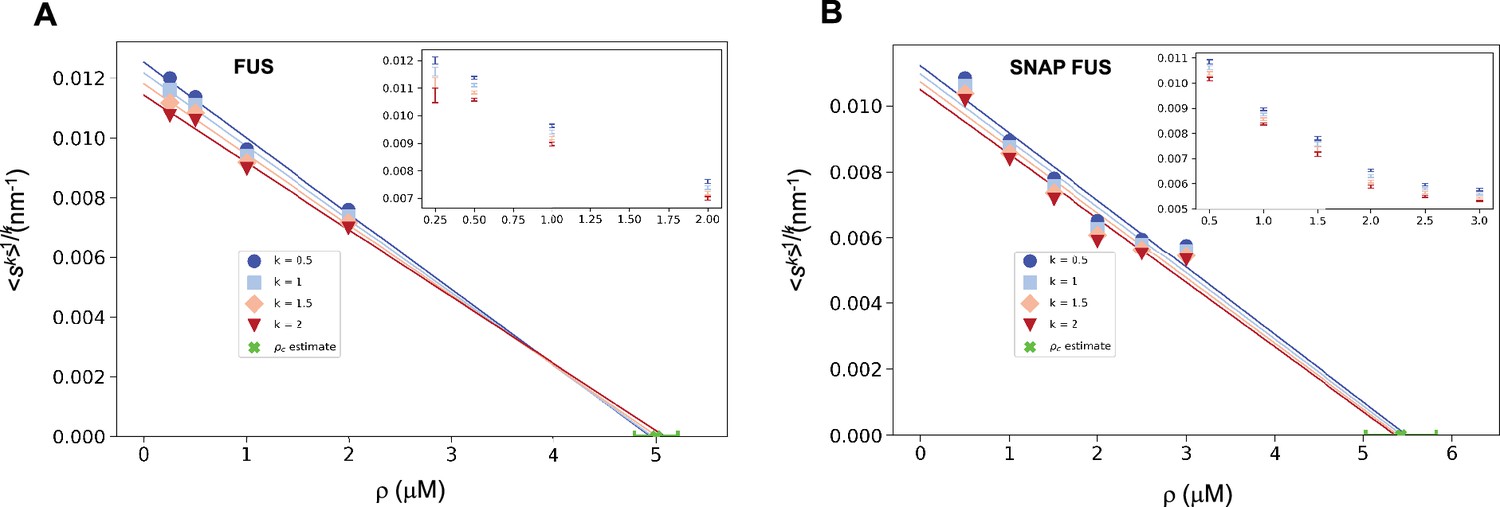
Estimation of the critical concentration of FUS using the scale invariance.
Critical concentration of FUS (5.0 ± 0.2 μM) (A) and SNAP-tagged FUS (5.4 ± 0.4 μM) (B). The scaling model predicts that the function of the moments plotted versus the concentration ρ becomes a straight line near the critical concentration ρc and intersects the ρ-axis at ρc, independently of the value of k. Error-weighted linear regressions are performed in both cases excluding the data point at the lowest concentration ρ = 0.125 μM. The resulting estimate of the critical concentration is shown in green along with the corresponding standard deviation, estimated from three independent measurements.
Figure 4
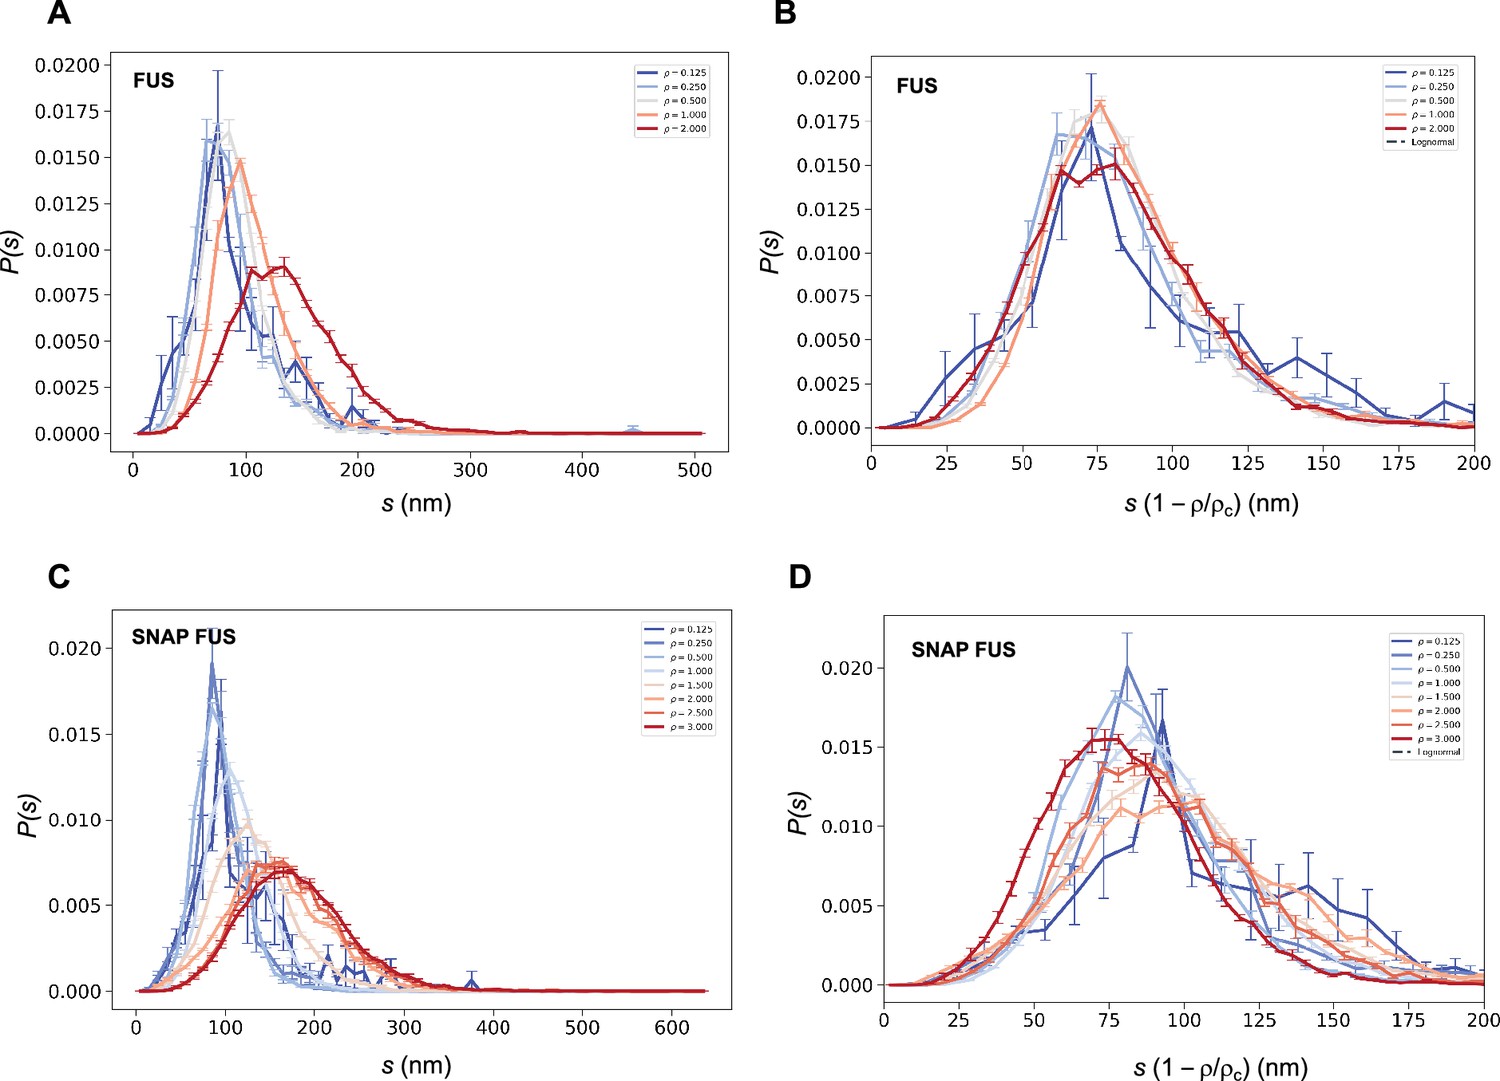
Collapse of the droplet size distributions of FUS as predicted by the scale invariance.
If the scaling ansatz of Equation 2 holds, the standard deviation σ of the log-normal distribution should not depend on the distance from the critical concentration, and a collapse should be achieved by rescaling the size with the distance from the critical concentration. (A, C) Droplet size distributions derived from the experimental data of untagged FUS at 0.125, 0.25, 0.5, 1.0, and 2.0 μM concentrations (A) and SNAP-tagged FUS at 0.125, 0.25, 0.5, 1.0, 1.5, 2.0, 2.5, and 3.0 μM concentrations (C), and their standard error of the mean from three independent measurements (Stender et al., 2021). (B, D) Collapse of the droplet size distributions rescaled by the estimated critical concentration. The error bars show the standard error of the mean from the three independent measurements (Stender et al., 2021).
Figure 5
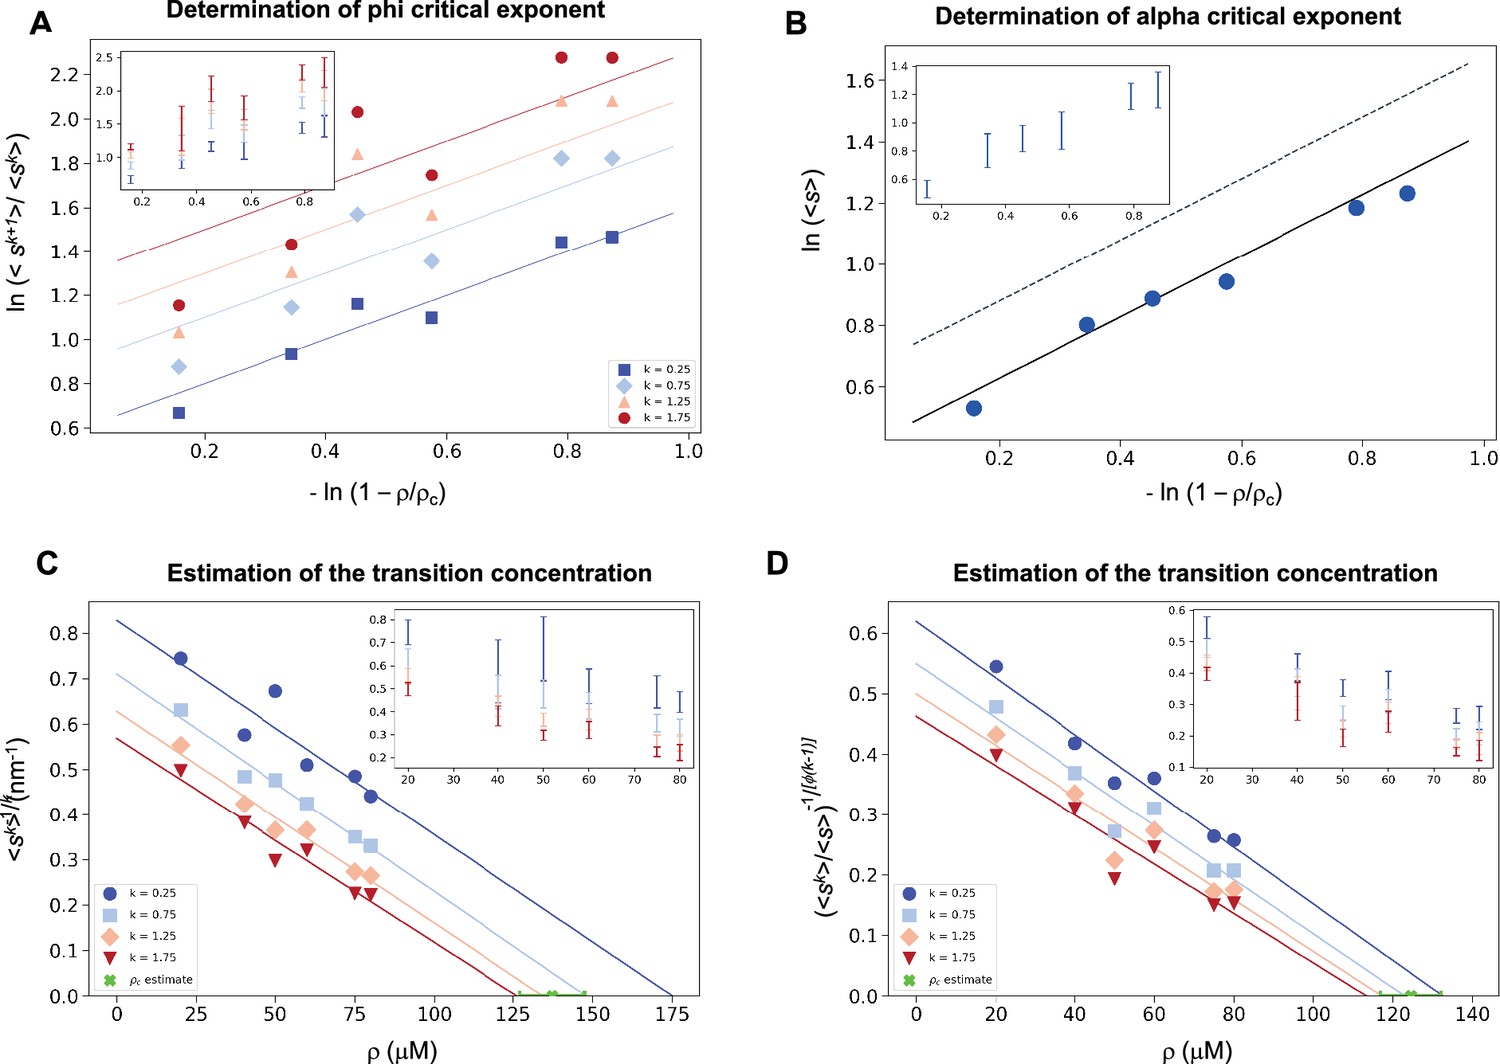
Estimation of the critical concentration of α-synuclein using the scale invariance.
(A) Determination of the critical exponent φ. The ratios of the average moments of the droplet sizes (<sk+1>/<sk>, at k = 0.25, 0.75, 1.25, 1.75, Equation 4) are represented at various distances from the critical concentration. The exponent φ and its error for each value of k were determined as a mean and standard deviation of the three independent measurements (Equations 15 and 16). Error bars are shown in inset for clarity. (B) Determination of the critical exponent m. The mean of the droplet size distributions is plotted at various distances from the critical concentration. The value of the exponent α was determined by error-weighted linear regression (Equation 6), using , where the errors were standard deviations of the five independent measurements (Equation 16). Error bars, which were obtained as the standard deviation of the five independent measurements are shown in inset for clarity. Error-weighted linear regressions were performed. The fit corresponding to the scaling ansatz, compatible with φ = 1 and α = 0, is represented by a scattered grey line with a slope of 1. Determination of the critical concentration for α-synuclein using the scaling ansatz in two different ways, either using Equation 18 (C), resulting in ρc = 137 ± 10 μM, or Equation 19 (D), resulting in ρc = 125 ± 7 μM, which are consistent within errors. The scaling model predicts that the function of the moments plotted versus the concentration ρ becomes a straight line near the critical concentration ρc and intersects the ρ-axis at ρc, independently of the value of k. Error-weighted linear regressions were performed. The resulting estimates of the critical concentration are shown in green along with the corresponding standard deviation, estimated from four independent measurements. In panel D, φ was constrained to 1.0 using Equation 19.
Figure 6
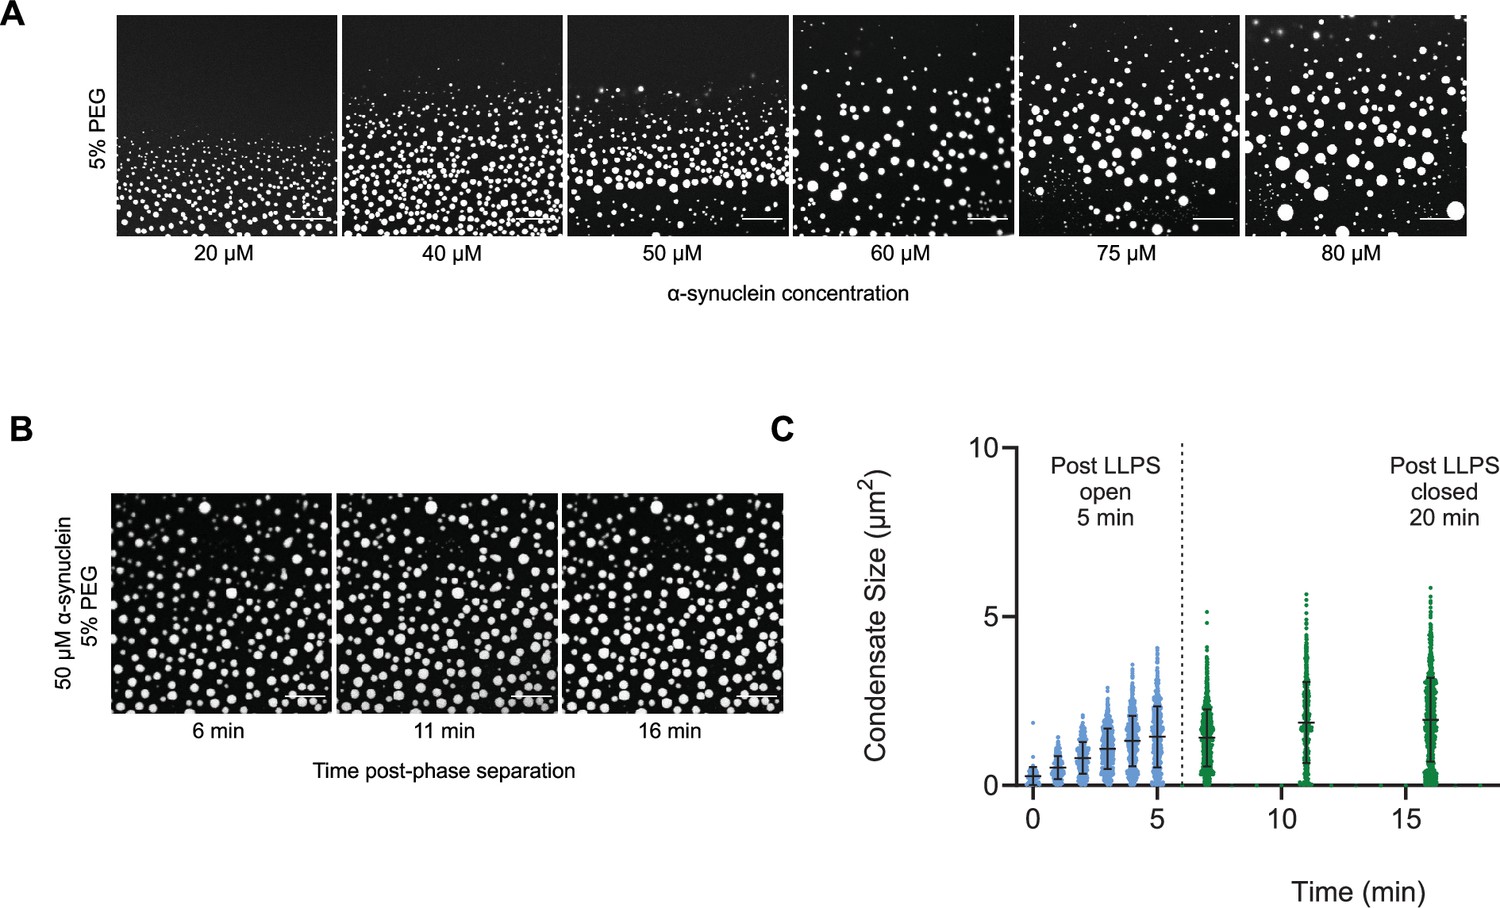
The droplet size distribution is stationary below the critical concentration.
(A) Images of α-synuclein droplets at increasing concentrations of α-synuclein. (B, C) After an initial transient of 5 min, the droplet size distributions remain approximately stationary below the critical concentration, as shown for the case of 50 μM α-synuclein concentration. Results are reported for five replicates.
Additional files
-
Supplementary file 1
Table S1.
Size distributions of FUS and SNAP-FUS condensates below their critical concentrations.
- https://cdn.elifesciences.org/articles/94214/elife-94214-supp1-v1.xlsx
-
Supplementary file 2
Table S2.
Size distributions of α-synuclein condensates below their critical concentration.
- https://cdn.elifesciences.org/articles/94214/elife-94214-supp2-v1.xlsx
-
Supplementary file 3
Table S.
Size distributions of α-synuclein condensates at 50 μM concentration as a function of the time.
- https://cdn.elifesciences.org/articles/94214/elife-94214-supp3-v1.xlsx
-
MDAR checklist
- https://cdn.elifesciences.org/articles/94214/elife-94214-mdarchecklist1-v1.docx
Download links
A two-part list of links to download the article, or parts of the article, in various formats.
Downloads (link to download the article as PDF)
Open citations (links to open the citations from this article in various online reference manager services)
Cite this article (links to download the citations from this article in formats compatible with various reference manager tools)
A scale-invariant log-normal droplet size distribution below the critical concentration for protein phase separation
eLife 13:RP94214.
https://doi.org/10.7554/eLife.94214.3


