Neurexins control the strength and precise timing of glycinergic inhibition in the auditory brainstem
- Guangzhou National Laboratory, China
- Bioland Laboratory, China
- School of Basic Medical Sciences, Guangzhou Medical University, China
- Department of Neurobiology, School of Basic Medicine, Army Medical University, China
- Advanced Institute for Brain and Intelligence, School of Medicine, Guangxi University, China
Figures
Figure 1
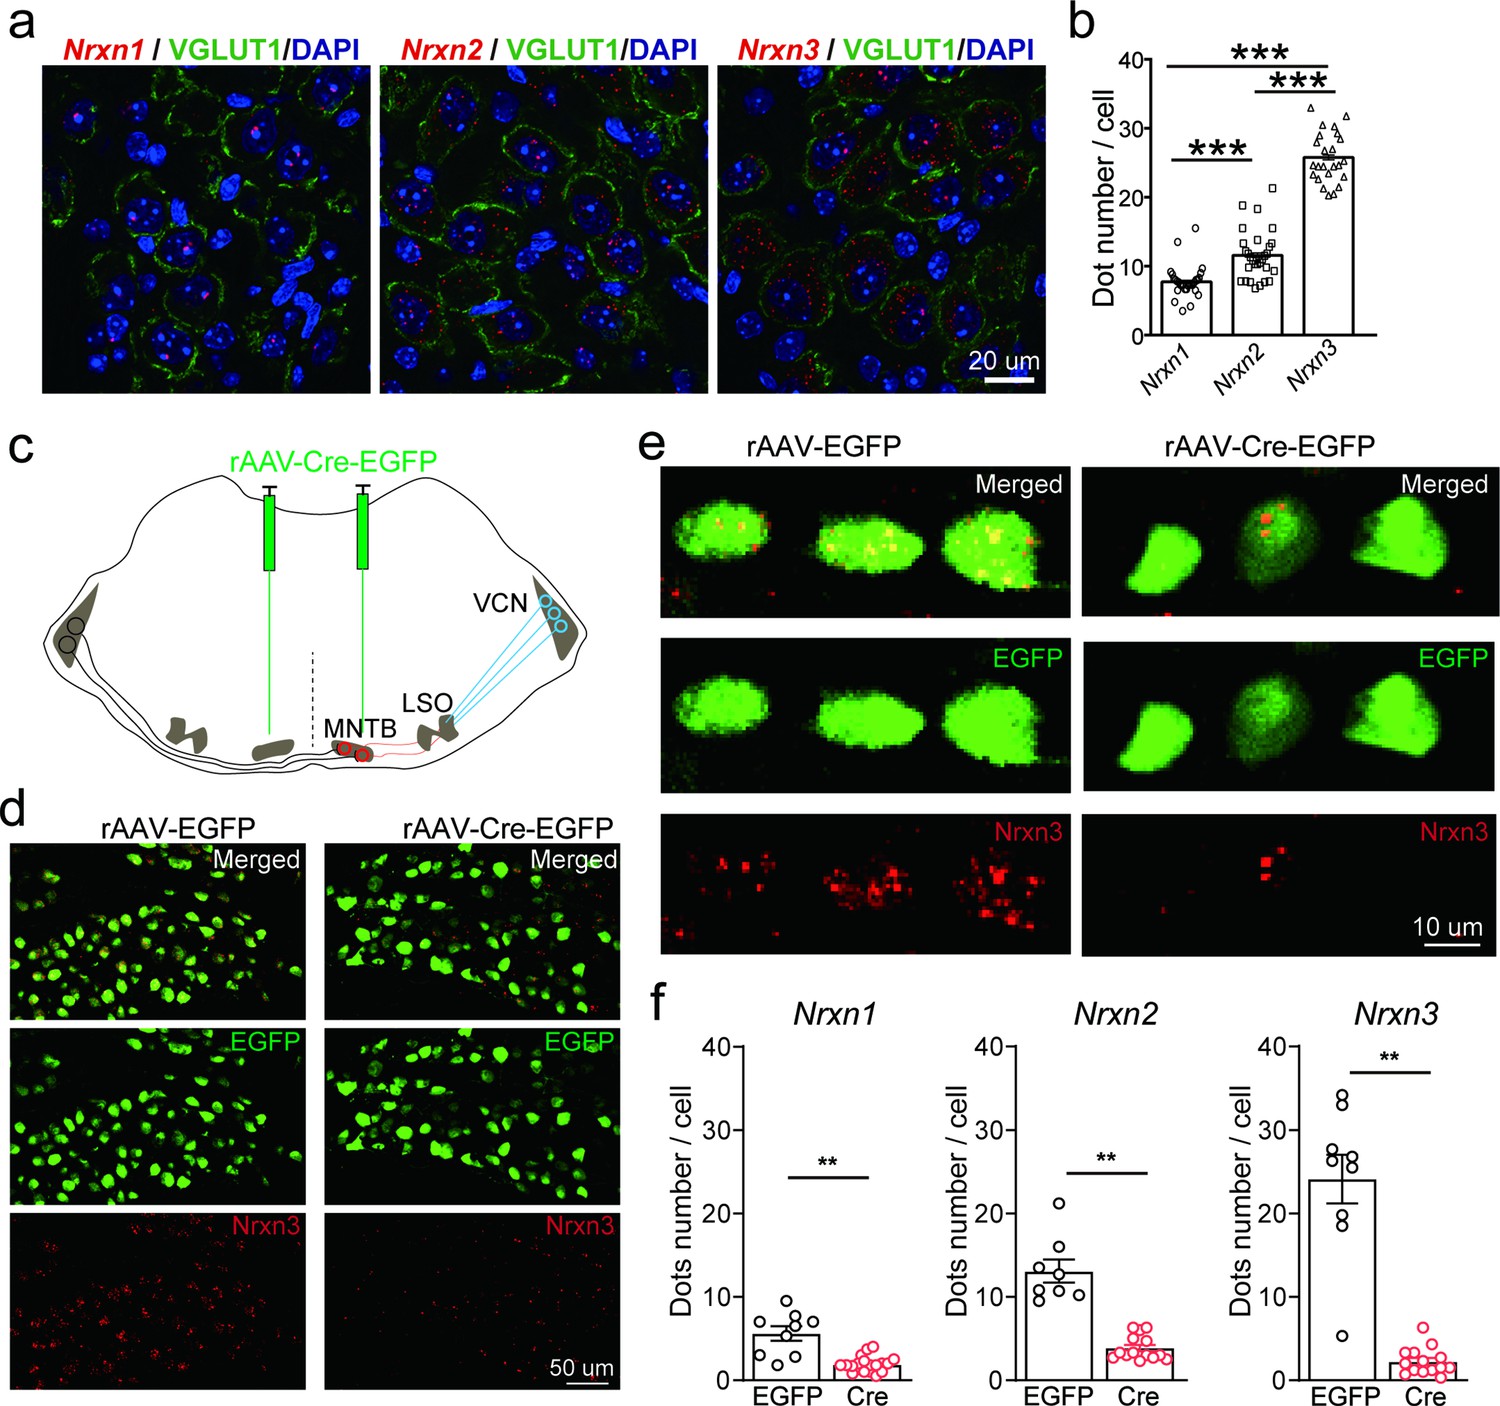
Neurexins are highly expressed in medial nucleus of the trapezoid body (MNTB) neurons.
(a) Immunohistochemistry and RNAscope fluorescent in situ hybridization (FISH) showing expression of various isoforms of neurexins in the MNTB, which make glycinergic synapses with lateral superior olive (LSO) neurons. (b) Summary of expression of various isoforms of neurexins in the MNTB of wild-type (WT) mice. Nrxn1 (n = 29), Nrxn2 (n = 29), p = 0.0001; Nrxn1 (n = 29), Nrxn3 (n = 24), p = 0.0001; Nrxn2 (n = 29), Nrxn3 (n = 24), p = 0.0001. (c) Diagram of auditory brainstem and virus injection in Nrxn123 cTKO mice. (d) Representative images of Nrxn3 FISH in the MNTB of mice injected with AAV-EGFP or AAV-Cre-EGFP. Scale bar: 50 μm. (e) Selected ROI(region of interest) in high magnification showing Nrxn3 FISH in MNTB neurons expressing EGFP or Cre-EGFP. Scale bar: 10 μm. (f) Summary of expression of various neurexins in the MNTB of Nrxn123 cTKO mice injected with AAV-EGFP and AAV-Cre-EGFP. Nrxn1: EGFP (n = 9), Cre (n = 19), p = 0.0053; Nrxn2: EGFP (n = 8), Cre (n = 14), p = 0.0038; Nrxn3: EGFP (n = 9), Cre (n = 14), p = 0.0016. Data are means ± standard error of the mean (SEM). Number of sections analyzed are indicated in the bars (b, f); statistical differences were assessed by Student’s t-test (**p < 0.01, ***p < 0.001). Source data are provided as a Source Data file.
Figure 2 with 2 supplements
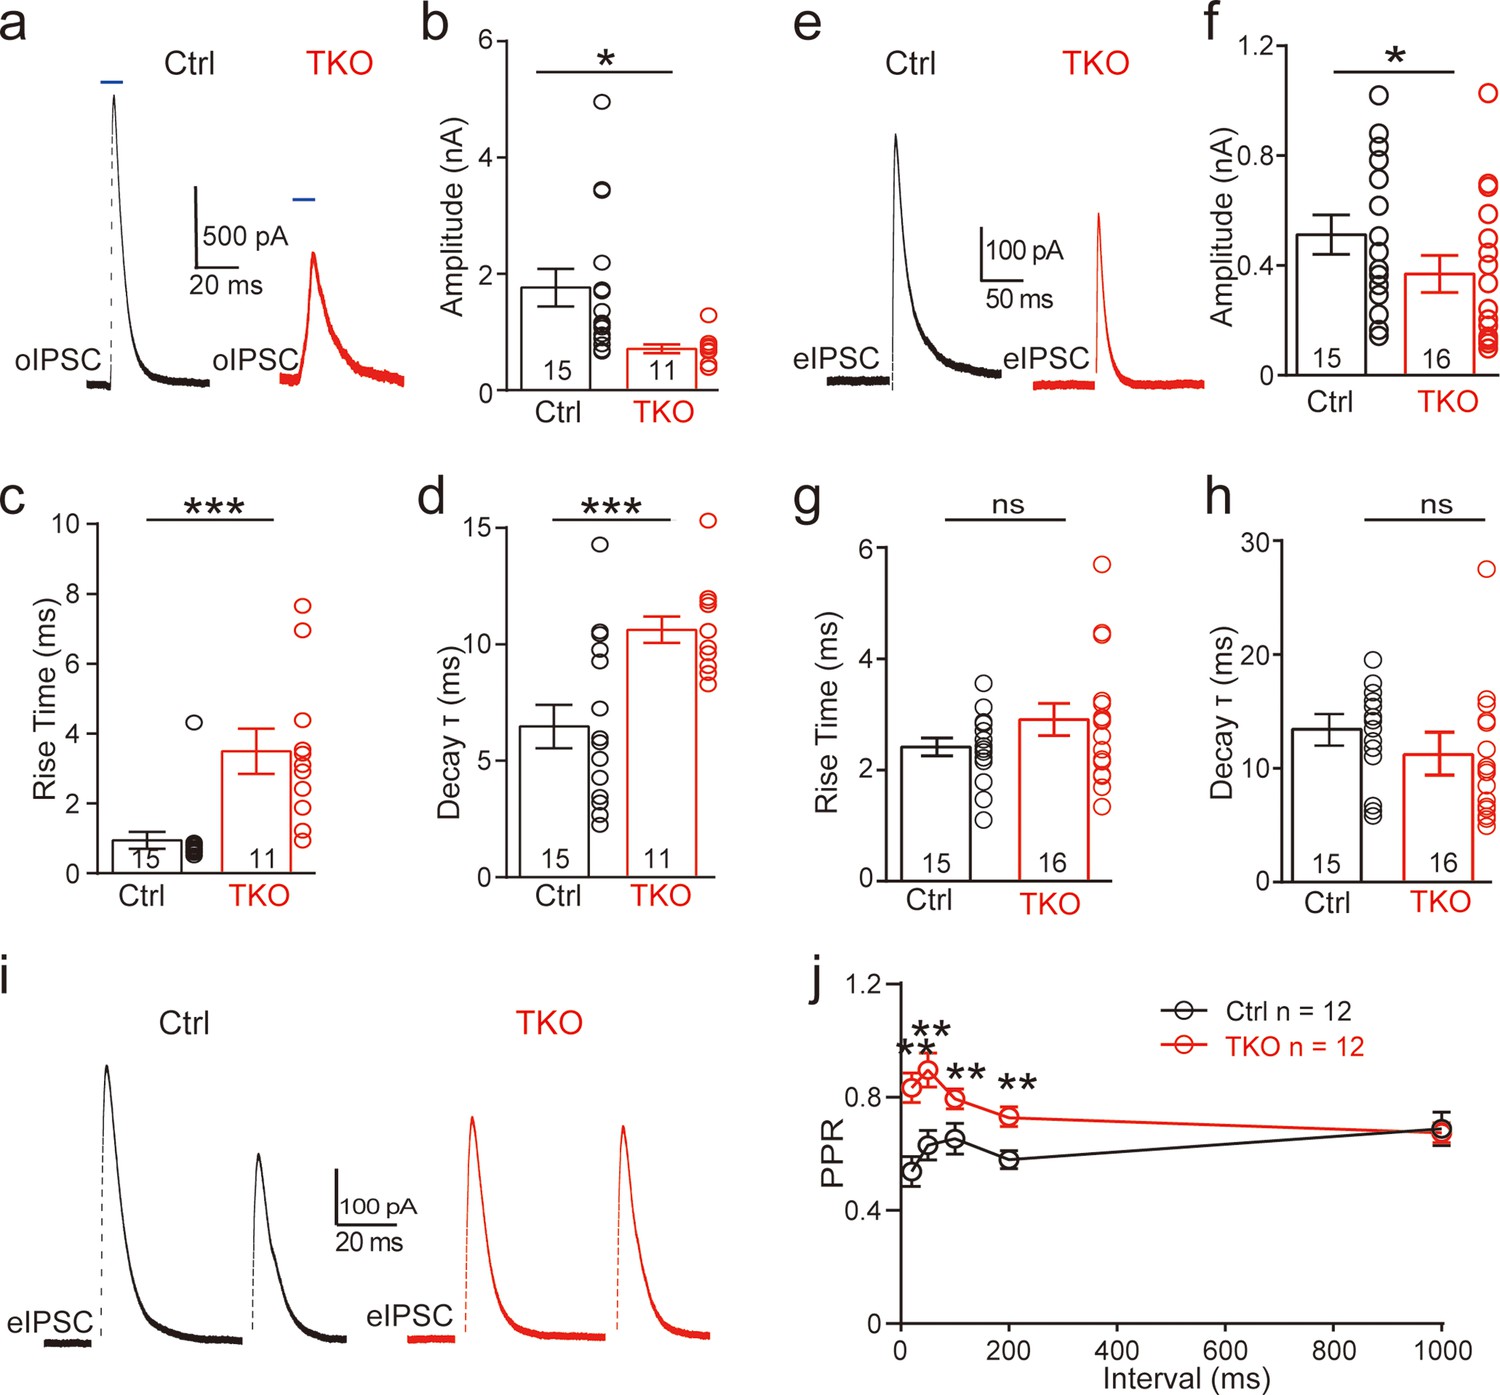
Deletion of neurexins reduces the strength and kinetics of glycinergic synapse.
(a) Representative inhibitory postsynaptic current (IPSC) traces of lateral superior olive (LSO) neurons evoked by optogenetic stimulation of ChR2 expressed in medial nucleus of the trapezoid body (MNTB) neurons. (b–d) Summary of IPSC amplitude, rise time, and decay time constant. Ctrl (n = 15), TKO (n = 11), p = 0.0119, p = 0.0004, p = 0.002. Unpaired two-sided t-test. (e–h) Same as a–d, except that IPSCs were evoked by afferent fiber stimulation. Ctrl (n = 15), TKO (n = 16), p = 0.0267, p = 0.152, p = 0.241. (i) Representative IPSCs traces of LSO neurons evoked by a pair of fiber stimulation at 50-ms interval. (j) Summary of paired-pulse ratio (PPR) of IPSCs in relationship to different paired-pulse intervals. Ctrl (n = 12), TKO (n = 12), p < 0.0001, two-way analysis of variance (ANOVA). Data are means ± standard error of the mean (SEM). Number of neurons are indicated in the bars (b–d, f–h) or graph (j). Statistical differences were assessed by Student’s t-test or two-way ANOVA test (*p < 0.05, **p < 0.01, ***p < 0.001).
Figure 2—figure supplement 1
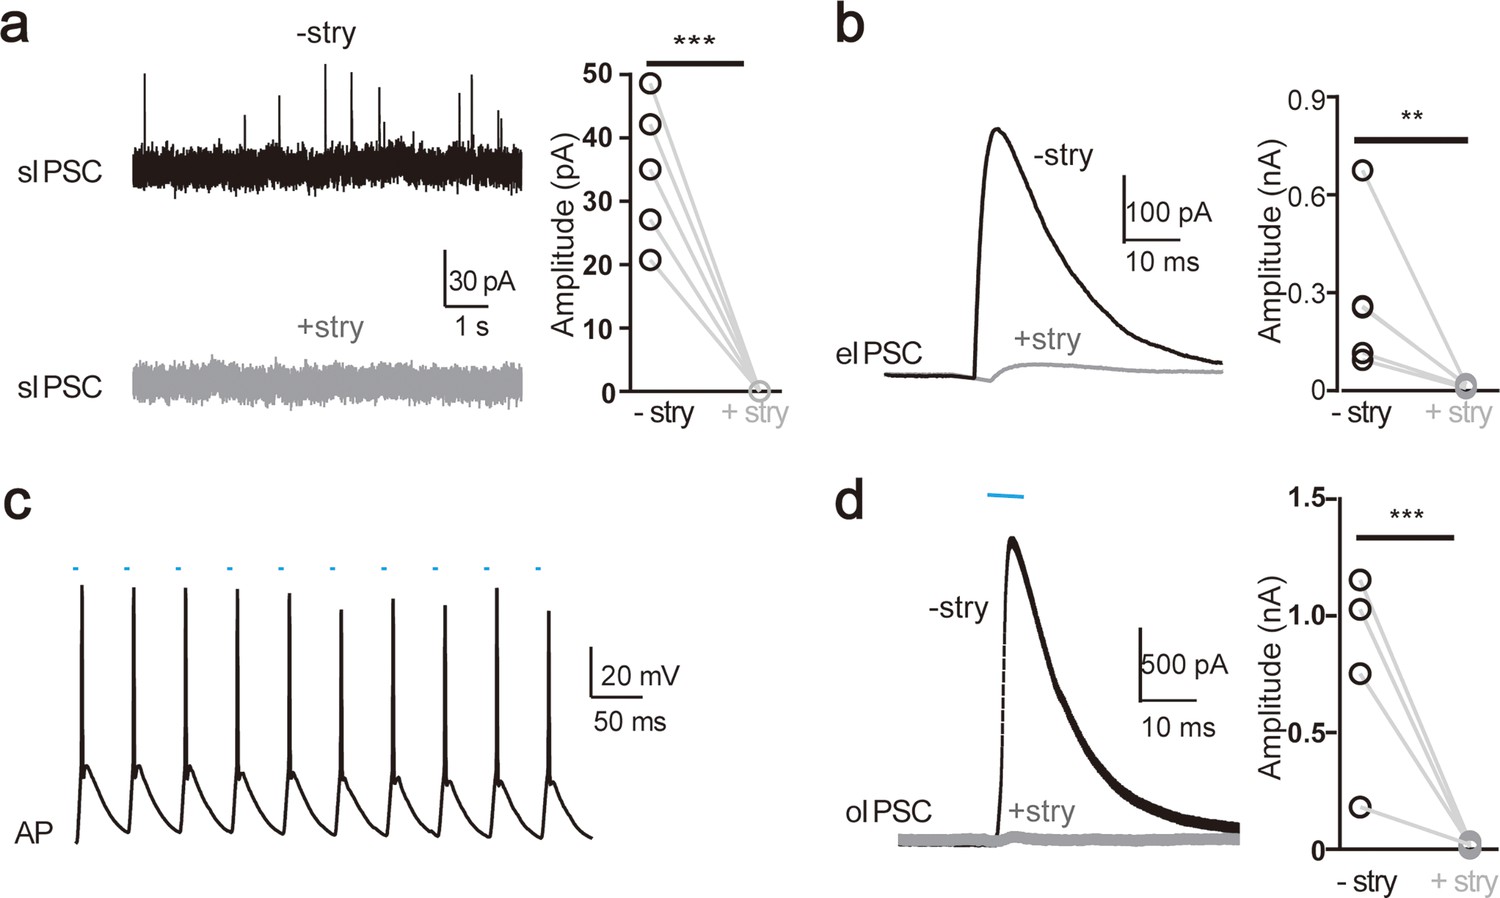
The medial nucleus of the trapezoid body (MNTB)–lateral superior olive (LSO) synapse is predominantly glycinergic in mice.
(a) Representative sIPSC(spontaneous IPSC) traces of LSO neurons before and after application of potent glycine receptor blocker strychine (stry) (left) and summary of sIPSC amplitude without and with stry (right). (b) Representative eIPSC(evoked IPSC) traces of LSO neurons before and after stry application (left) and summary of eIPSC amplitude without and with stry (right). (c) Representative action potential (AP) firing of MNTB neurons infected with ChR2 during high-frequency repetitive pulse stimulation of 473 nm. (d) Representative oIPSC(optogenetically-evoked IPSC) traces of LSO neurons before and after stry application (left) and summary of oIPSC amplitude without and with stry (right). Statistical differences were assessed by Student’s t-test (**p < 0.01, *** p < 0.001).
Figure 2—figure supplement 2
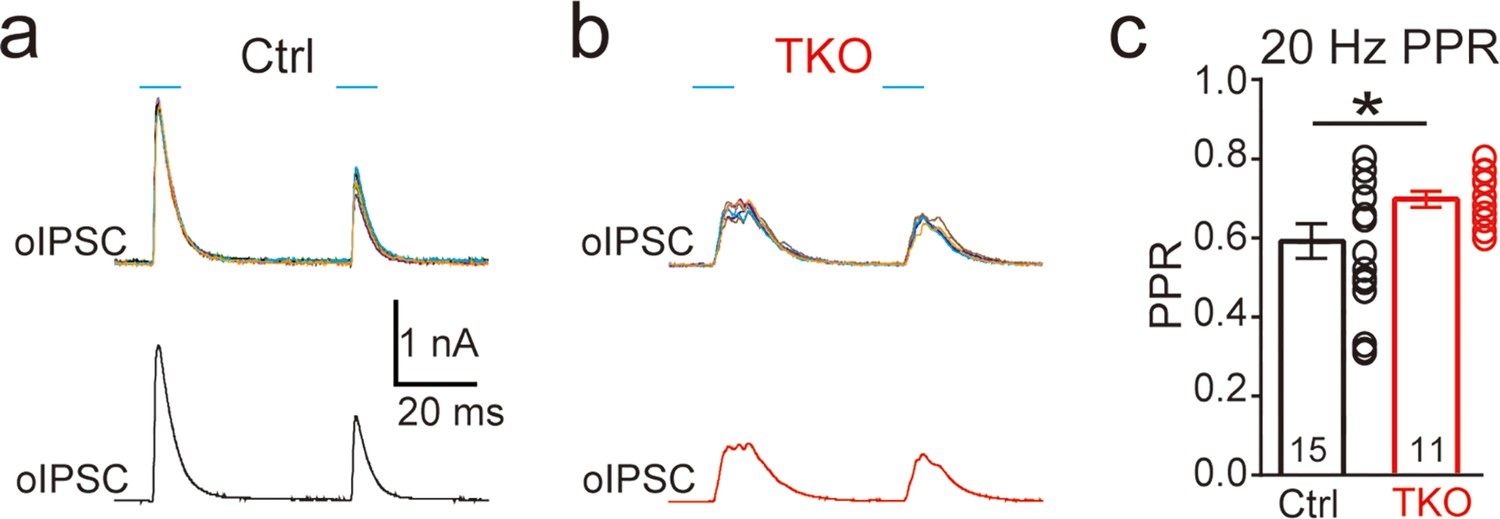
Deletion of neurexins increases the paired-pulse ratio (PPR) of optogenetic-evoked inhibitory postsynaptic currents (IPSCs) at the glycinergic synapse.
Representative IPSC traces of lateral superior olive (LSO) neurons evoked by paired-pulse (20 Hz) optogenetic stimulation of ChR2 expressed in medial nucleus of the trapezoid body (MNTB) neurons in control (a) and Nrxn TKO (b) mice. Top, individual trials. Bottom, averaged trace of IPSC. (c) Summary of PPR of IPSC amplitude. Statistical differences were assessed by Student’s t-test (*p < 0.05).
Figure 3
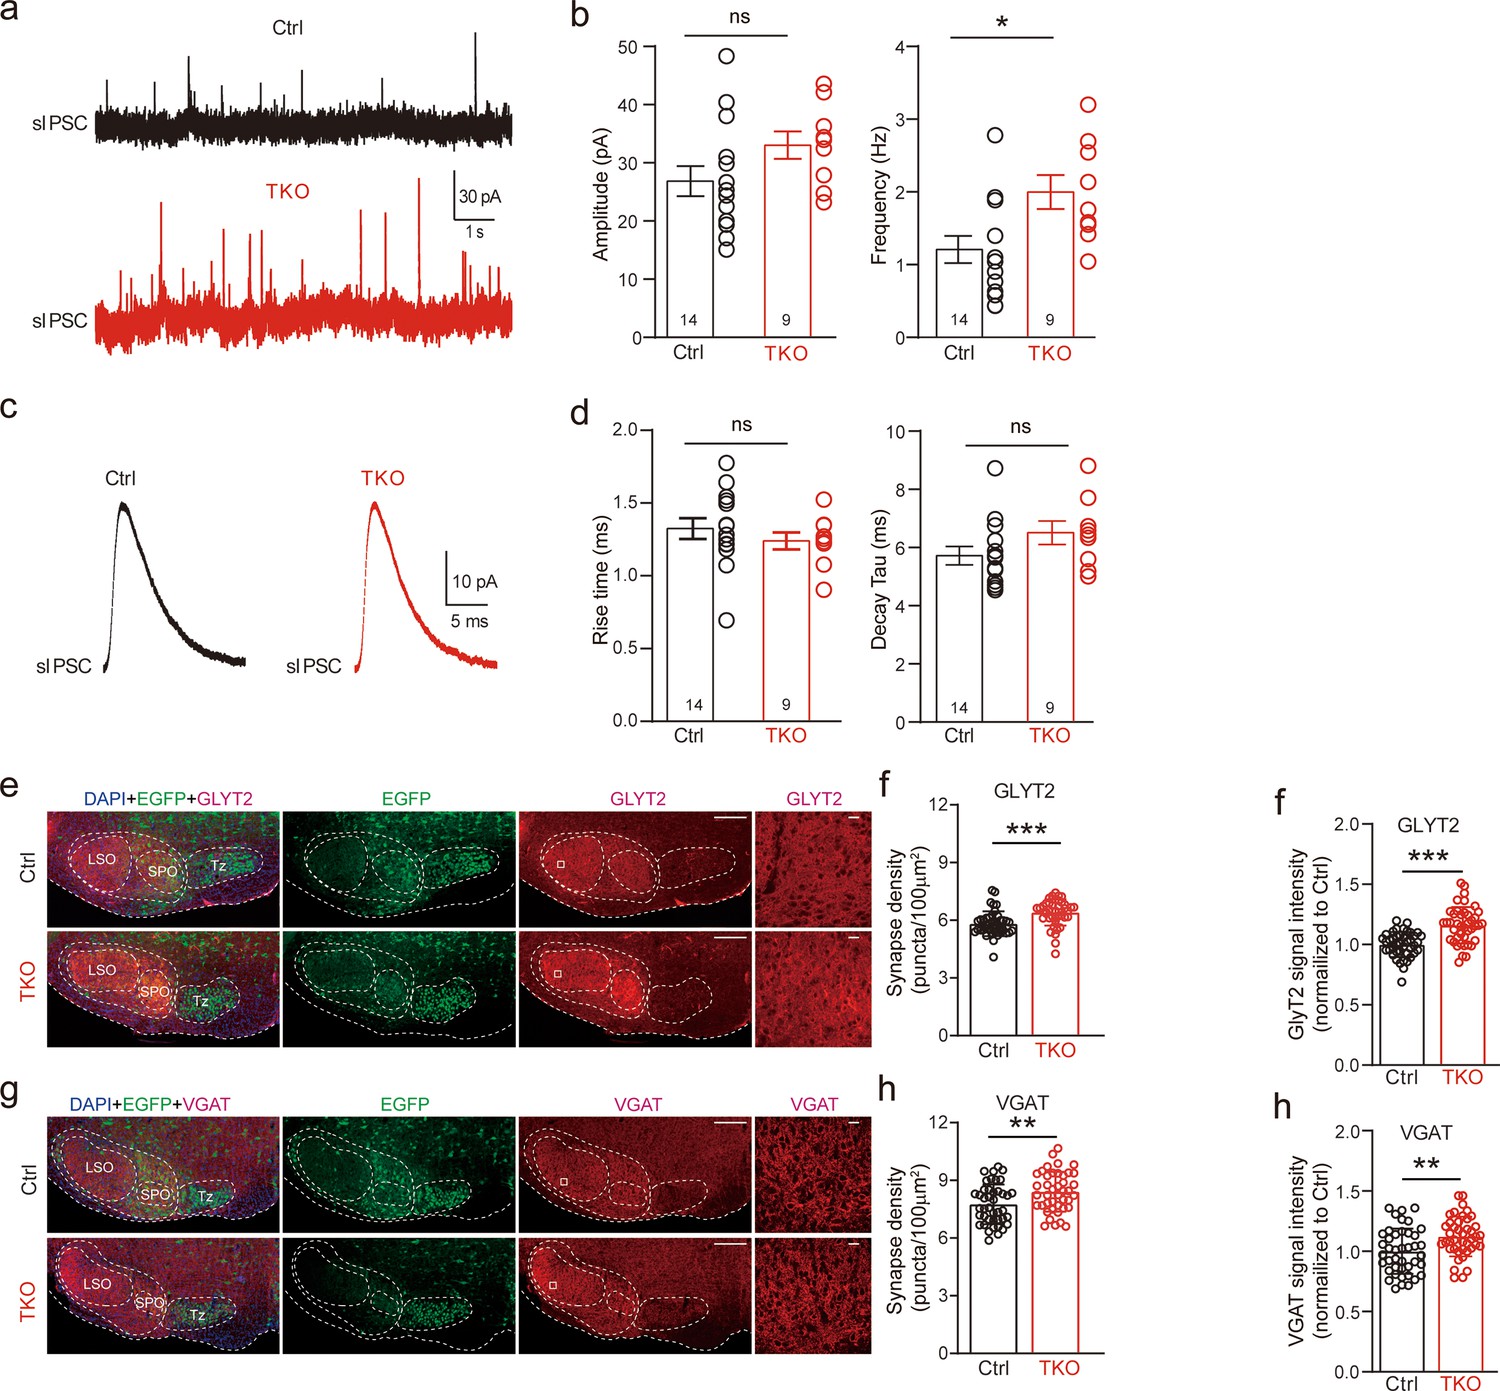
Deletion of neurexins increases sIPSC frequency and glycinergic synapse density of lateral superior olive (LSO) neurons.
(a) Representative sIPSC traces of LSO neurons. (b) Summary of sIPSC amplitude and frequency. Ctrl (n = 14), TKO (n = 9), p = 0.057, p = 0.015, unpaired two-sided t-test. (c) Representative sIPSC waveforms of LSO neurons. (d) Summary of sIPSC rise time and decay time constant. Ctrl (n = 14), TKO (n = 9), p = 0.376, p = 0.82, unpaired two-sided t-test. (e) Representative confocal microscopy images of medial nucleus of the trapezoid body (MNTB)–LSO-containing brainstem slice with specific labeling of GlyT2 (red) and EGFP (green) from both control and Nrxn123 TKO mice at P14. Scale bar, 10 µm. (f) Summary of glycinergic synaptic density quantified by GlyT2 immunostaining. Ctrl (n = 42), TKO (n = 42), p = 0.0001, unpaired two-sided t-test. (g, h) Same as (e, f) except for specific labeling of VGAT (red) and EGFP (green). Ctrl (n = 42), TKO (n = 42), p = 0.0047, unpaired two-sided t-test. Data are means ± standard error of the mean (SEM). Number of neurons or sections/animals for immunostaining are indicated in the bars (b, d, f, h). Statistical differences were assessed by Student’s t-test (*p < 0.05, **p < 0.01, ***p < 0.001). Source data are provided as a Source Data file.
Figure 4 with 1 supplement
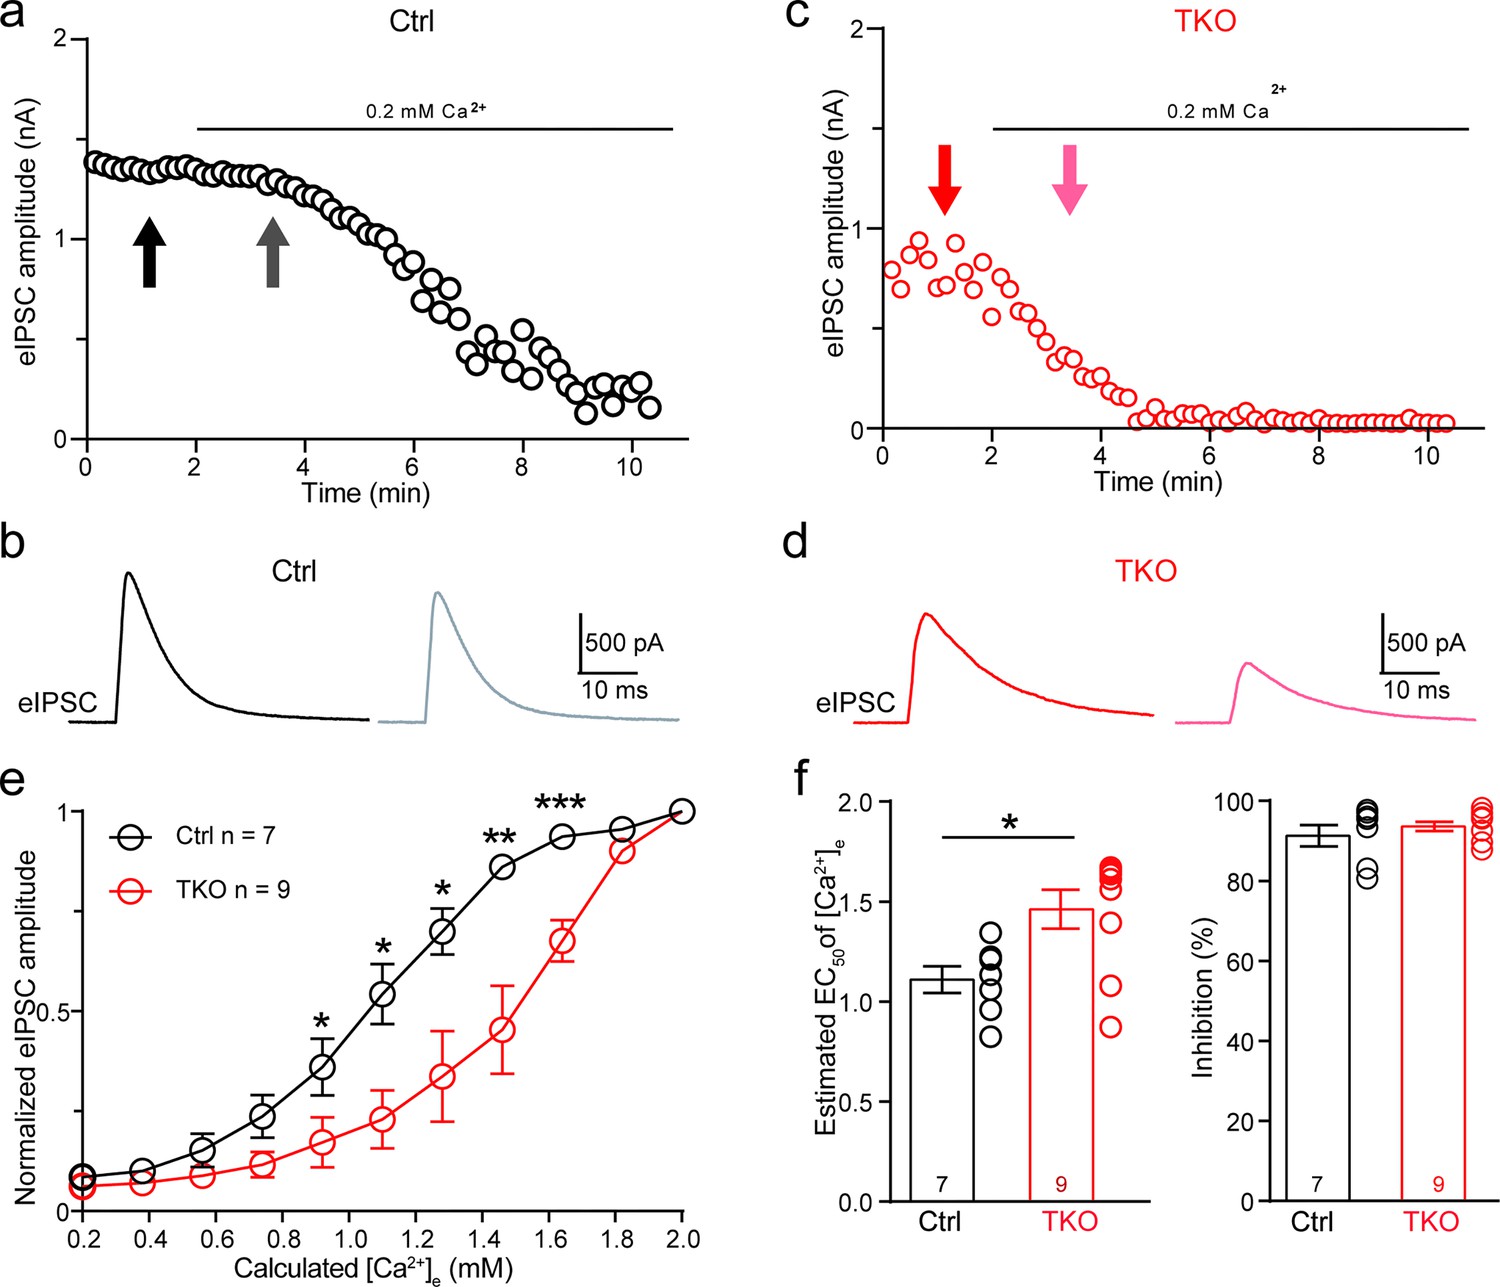
Deletion of neurexins increases the Ca2+ sensitivity of release at the glycinergic synapse.
(a) Representative time courses of inhibitory postsynaptic current (IPSC) amplitudes for individual lateral superior olive (LSO) neurons of control mice during the perfusion of low Ca2+ ACSF. (b) Representative IPSC traces of control mice before and during low Ca2+ perfusion at the indicated points in a. (c, d) Same as (a, b), except of TKO mice. (e) Summary of normalized IPSC amplitudes plotted against the calculated extracellular Ca2+ concentration for control and TKO mice. Ctrl (n = 7), TKO (n = 9), p = 0.0311 for 0.92 mM Ca2+, p = 0.0104 for 1.10 mM Ca2+, p = 0.0208 for 1.28 mM Ca2+, p = 0.0067 for 1.46 mM Ca2+, p = 0.0007 for 1.64 mm Ca2+, unpaired two-sided t-test. (f) Summary of EC50 of Ca2+ for half-blocking of IPSCs and the blocking effect of 0.2 mM Ca2+ on IPSC amplitude. Ctrl (n = 7), TKO (n = 9), p = 0.0139, p = 0.3985, unpaired two-sided t-test. Data are means ± standard error of the mean (SEM). Number of neurons are indicated in the graph (e) or bars (f). Statistical differences were assessed by Student’s t-test (*p < 0.05, **p < 0.01, ***p < 0.001). Source data are provided as a Source Data file.
Figure 4—figure supplement 1
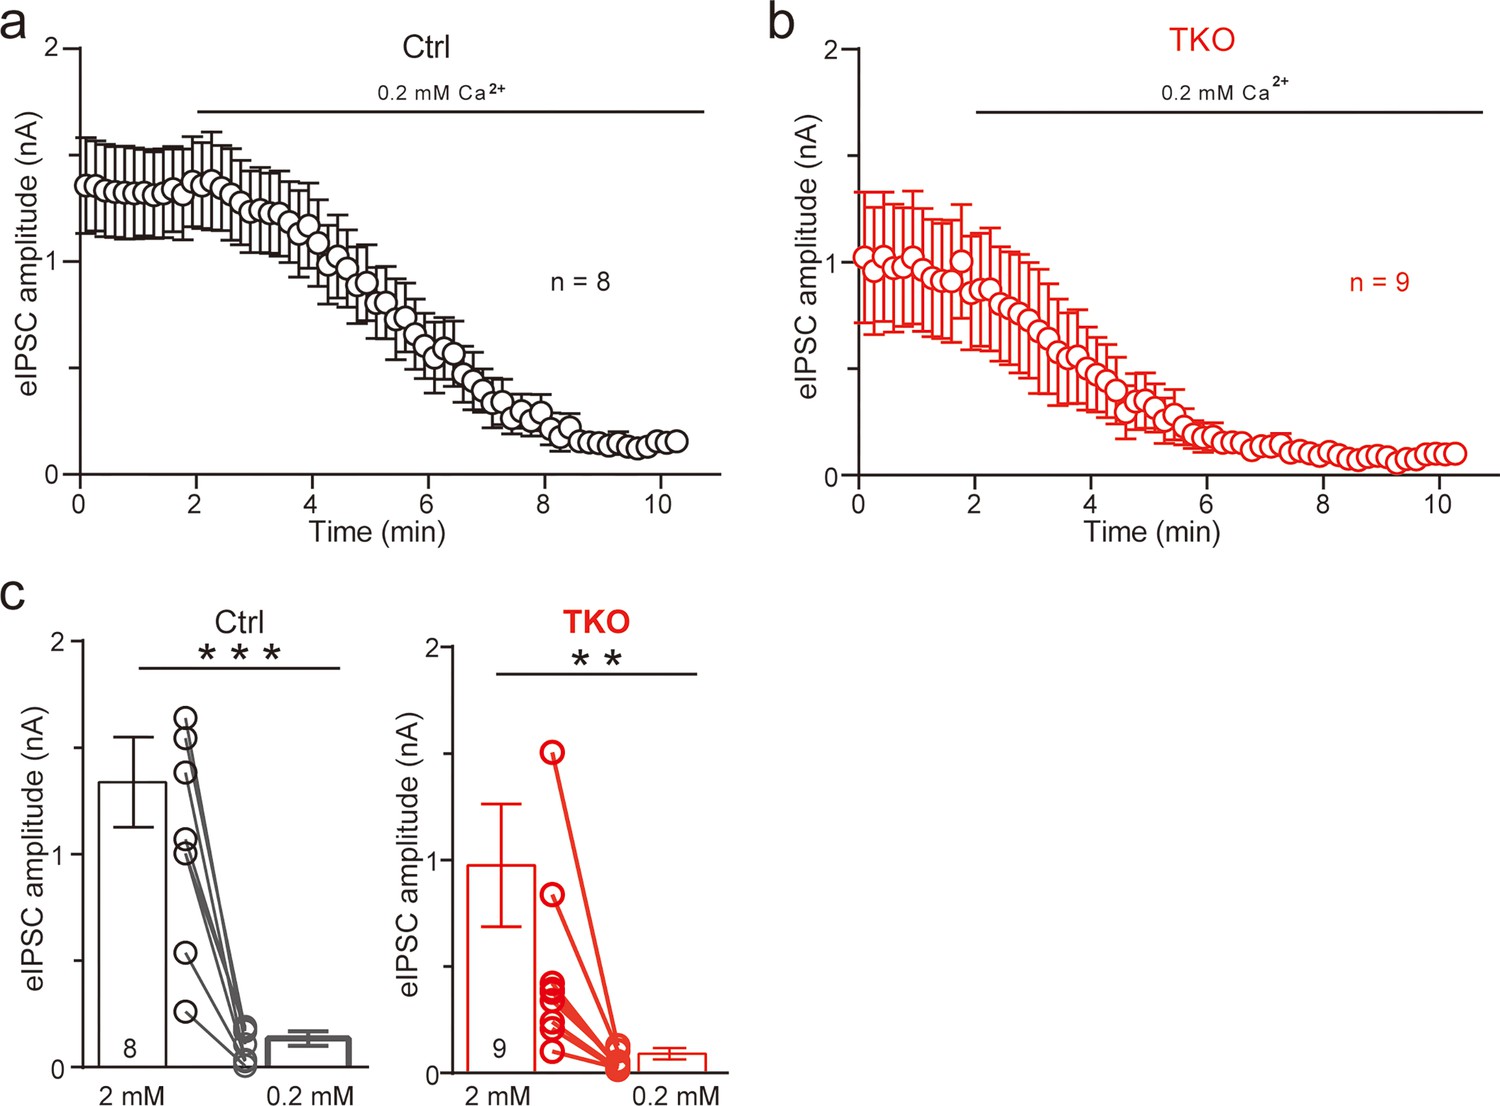
Pan-neurexin deletion enhances the blocking effects of reducing extracellular Ca2+ on glycinergic synaptic transmission.
(a) Summary of eIPSC amplitude of control during 0.2 mM Ca2+ perfusion. Mean ± standard error of the mean (SEM). (b) Summary of eIPSC amplitude of TKO during 0.2 mM Ca2+ perfusion. Mean ± SEM. (c) Average of eIPSC amplitude before and after 0.2 mM Ca2+ perfusion. Mean ± SEM (**p < 0.01, ***p < 0.001), paired t-test.
Figure 5 with 1 supplement
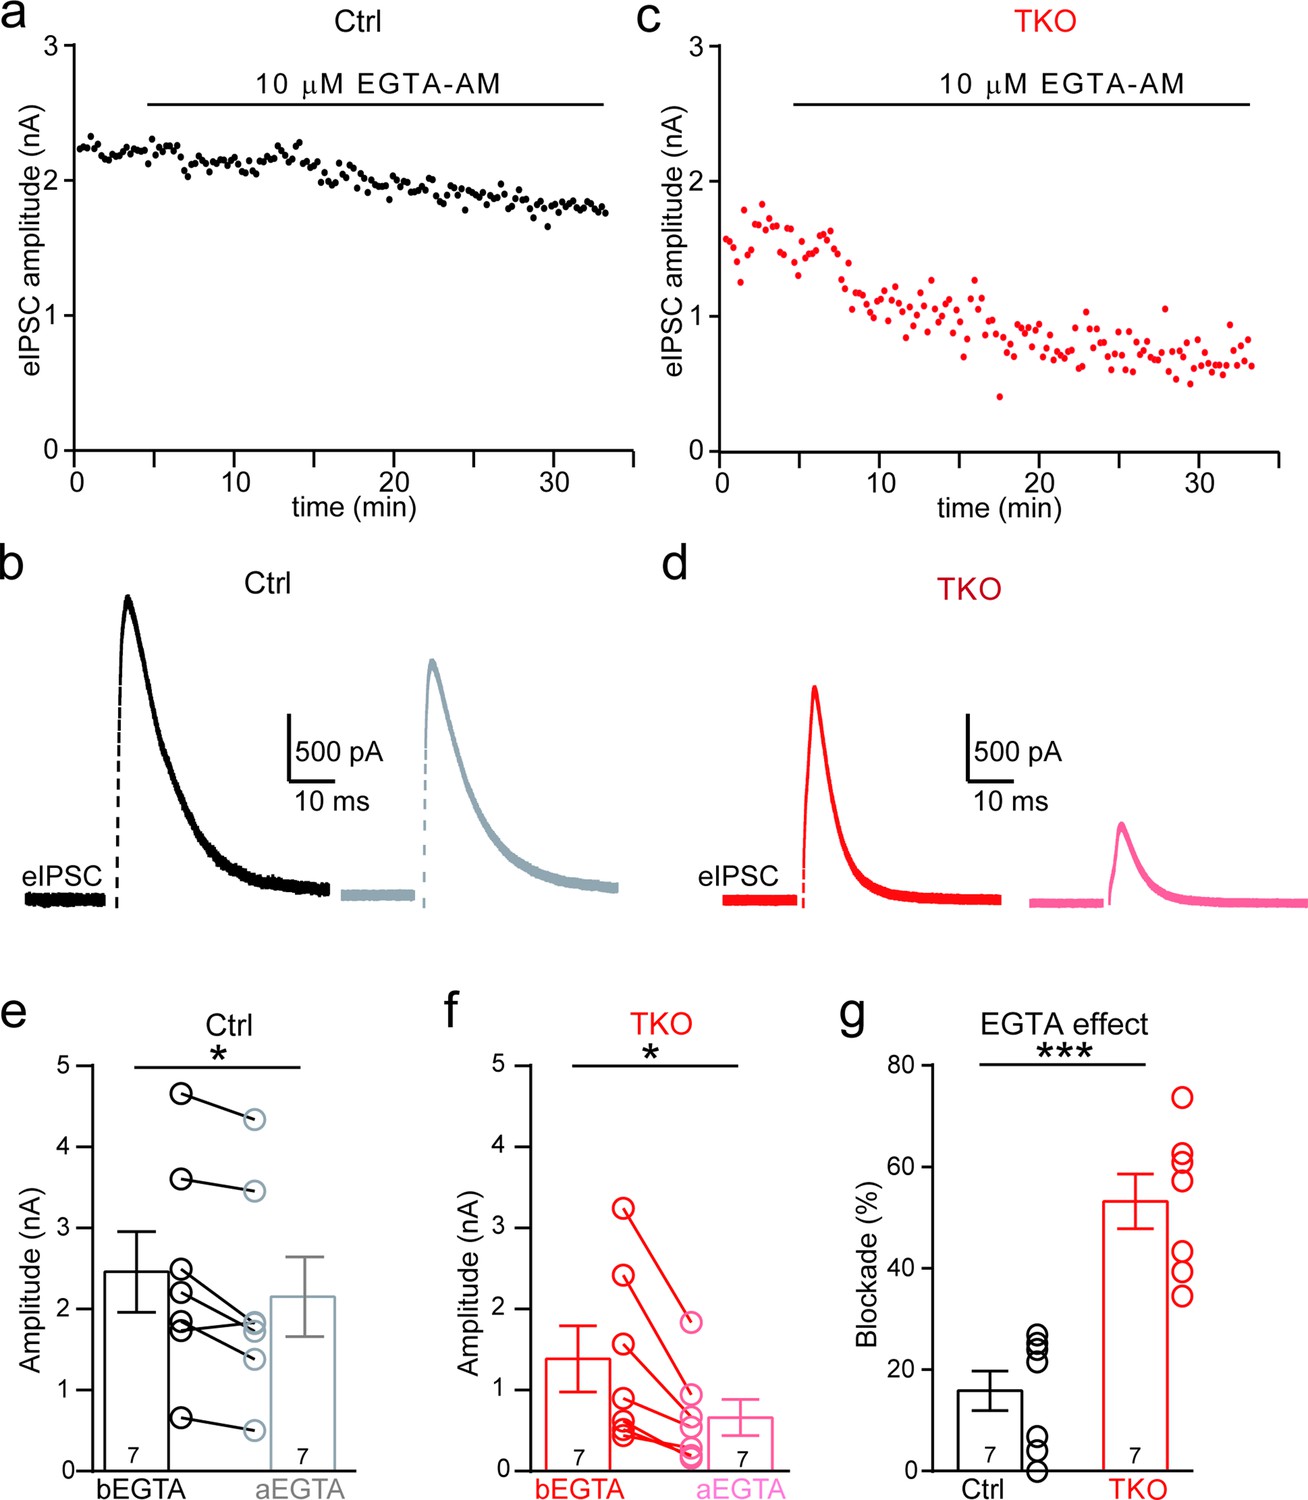
Deletion of neurexins increases the blocking effect of EGTA on glycinergic inhibitory postsynaptic currents (IPSCs).
(a) Representative time courses of IPSC amplitudes for individual lateral superior olive (LSO) neurons of control mice during the treatment of high concentration of EGTA-AM. (b) Representative IPSC traces of control mice before and after EGTA. (c, d) Same as a, b, except of TKO mice. (e) Summary of IPSC amplitude before and after EGTA treatment of control mice. Ctrl (n = 7), TKO (n = 7), p = 0.0201, paired two-sided t-test. (f) Summary of IPSC amplitude before and after EGTA treatment of TKO mice. Ctrl (n = 7), TKO (n = 7), p = 0.0123, paired two-sided t-test. (g) Summary of the blocking percentage of IPSCs by EGTA. Ctrl (n = 7), TKO (n = 7), p = 0.0001, unpaired two-sided t-test. Data are means ± standard error of the mean (SEM). Number of neurons are indicated in the bars (e–g). Statistical differences were assessed by Student’s t-test (*p < 0.05, ***p < 0.001). Source data are provided as a Source Data file.
Figure 5—figure supplement 1
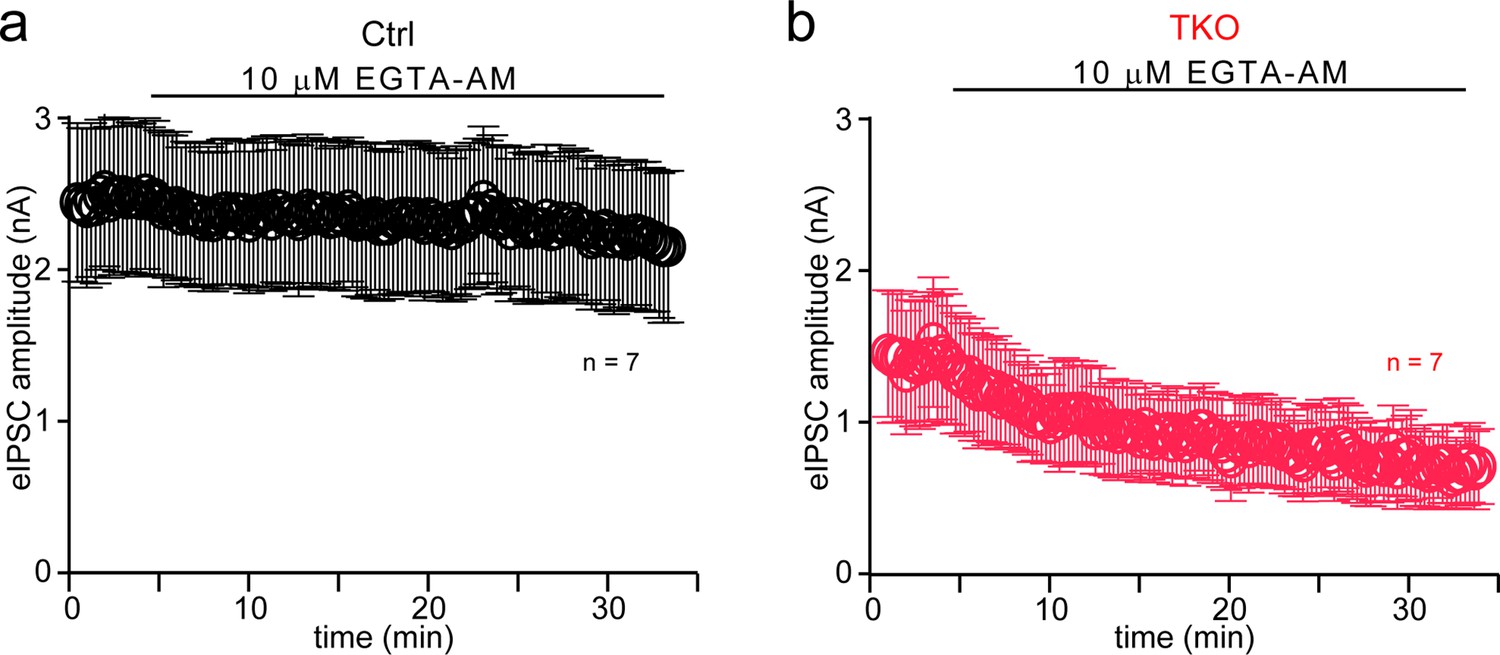
Pan-neurexin deletion enhances the blocking effects of intracellular Ca2+ buffer on glycinergic synaptic transmission.
(a) Summary of eIPSC amplitude of control during 10 mM EGTA-AM treatment. Mean ± standard error of the mean (SEM). (b) Summary of eIPSC amplitude of TKO during 10 mM EGTA-AM treatment. Mean ± SEM.
Additional files
-
MDAR checklist
- https://cdn.elifesciences.org/articles/94315/elife-94315-mdarchecklist1-v1.docx
-
Source data 1
All raw data presented in the article are included in the source data file.
- https://cdn.elifesciences.org/articles/94315/elife-94315-data1-v1.xlsx
Download links
A two-part list of links to download the article, or parts of the article, in various formats.
Downloads (link to download the article as PDF)
Open citations (links to open the citations from this article in various online reference manager services)
Cite this article (links to download the citations from this article in formats compatible with various reference manager tools)
Neurexins control the strength and precise timing of glycinergic inhibition in the auditory brainstem
eLife 13:RP94315.
https://doi.org/10.7554/eLife.94315.3


