Prolonged cell cycle arrest in response to DNA damage in yeast requires the maintenance of DNA damage signaling and the spindle assembly checkpoint
- Department of Biology and Rosenstiel Basic Medical Sciences Research Center, Brandeis University, United States
- Department of Molecular Genetics & Cell Biology, University of Chicago, United States
Figures
Figure 1
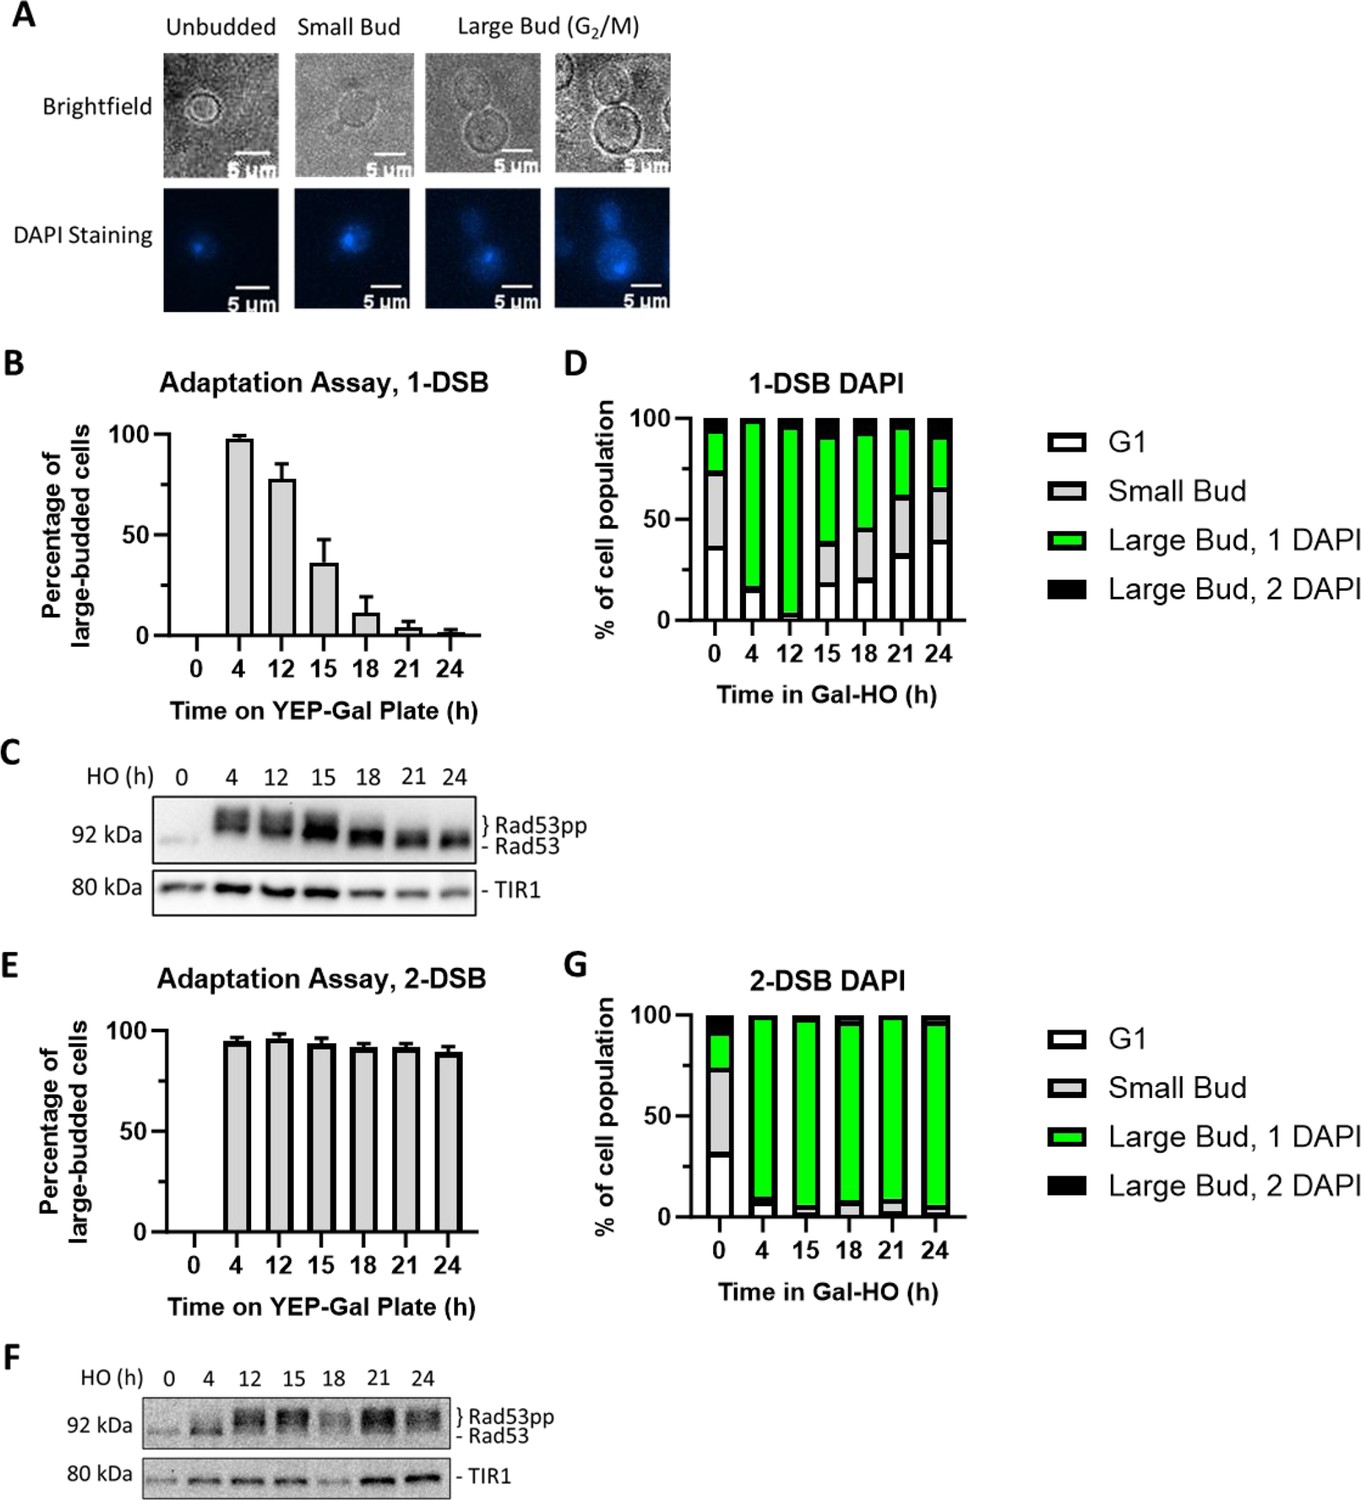
Measuring checkpoint arrest in 1-DSB and 2-DSB strains.
(A) Morphological categories of budding yeast cells using brightfield microscopy and DAPI staining were used to determine G2/M arrest. Cells that arrest at G2/M shift toward a large bud state. G2/M-arrested cells that progress into anaphase. (B) Adaptation assay with 1-DSB strain on a YEP-Gal plate. G2/M arrest was determined based on cell morphology as shown in (A). Data are shown from three independent experiments, error bars represent standard error of the mean (SEM). (C) Profile of DAPI-stained cells in a 1-DSB strain after DNA damage induction in liquid culture. Cells were grouped based on cell morphology and DAPI staining profiles, as explained below the graphs. (D) Rad53 phosphorylation kinetics in 1-DSB strain by western blotting. Samples collected after the induction of DNA damage during the time-course experiment and blotted with α-Rad53 to monitor DDC signaling. α-Rad53 can both detect unphosphorylated and hyperphosphorylated Rad53 species. TIR1-Myc was detected with α-Myc and serves as a loading control. (E) Same as (B) for a 2-DSB strain. (F) Same as (C) with a 2-DSB strain. (G) Same as (D) with a 2-DSB strain.
-
Figure 1—source data 1
Original membranes corresponding to Figure 1C.
- https://cdn.elifesciences.org/articles/94334/elife-94334-fig1-data1-v1.zip
-
Figure 1—source data 2
Original files corresponding to Figure 1C.
- https://cdn.elifesciences.org/articles/94334/elife-94334-fig1-data2-v1.zip
-
Figure 1—source data 3
Original membranes corresponding to Figure 1F.
- https://cdn.elifesciences.org/articles/94334/elife-94334-fig1-data3-v1.zip
-
Figure 1—source data 4
Original files corresponding to Figure 1F.
- https://cdn.elifesciences.org/articles/94334/elife-94334-fig1-data4-v1.zip
Figure 2 with 3 supplements
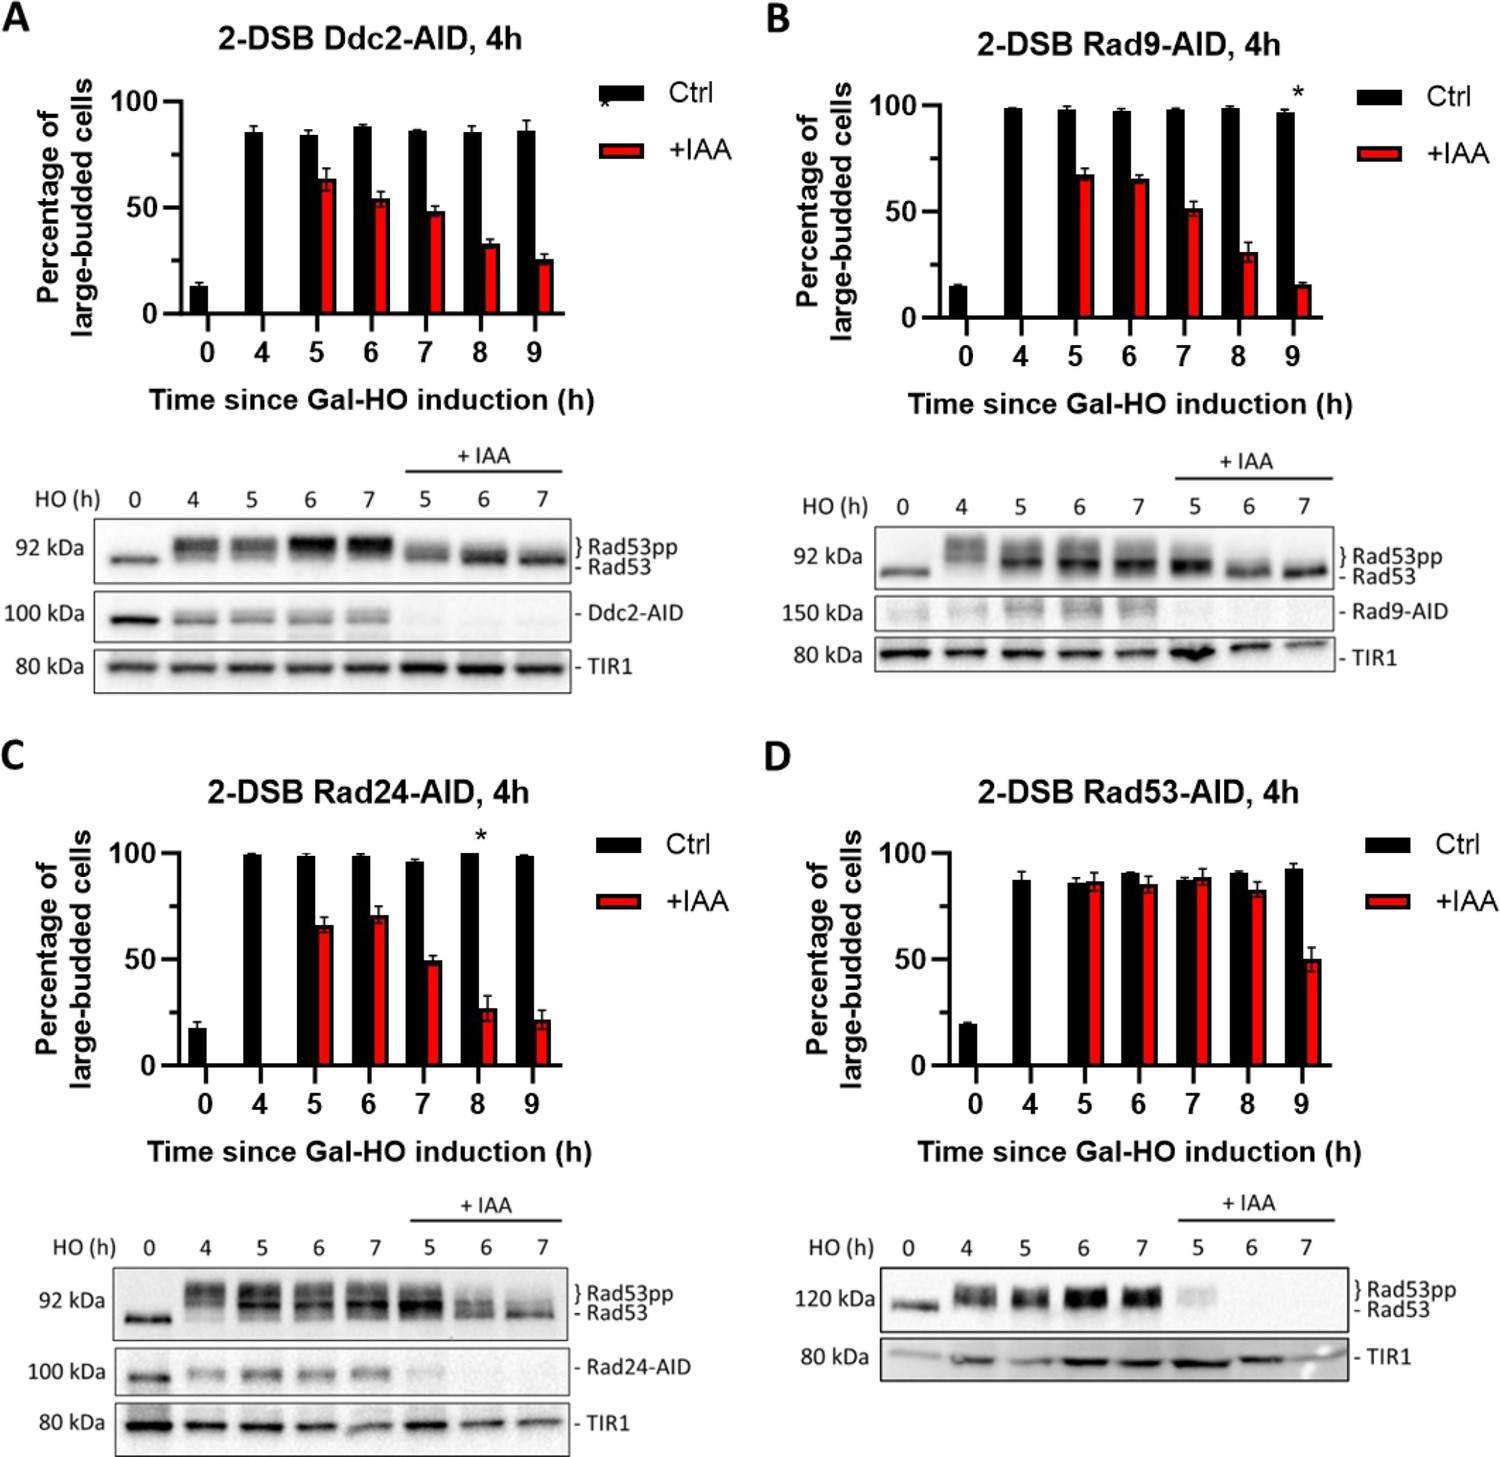
Checkpoint maintenance requires Ddc2, Rad9, Rad24, and Rad53 activity.
(A) Above: percentage of G2/M-arrested cells in a 2-DSB DDC2-AID strain after DNA damage induction in a liquid culture. Cultures were split 4 hr after galactose treatment to induce DNA damage by GAL::HO and treated either with auxin (+IAA) (1 mM) or with ethanol (Ctrl). Data are shown from three independent experiments, with error bars representing standard error of the mean (SEM). The asterisk marks the timepoint when the percentage of large-budded G2/M cells returned to pre-damage levels. Below: western blots ran with samples collected at various timepoints during the same time course, probed with α-Rad53, to determine DDC status, and α-Myc, to determine Ddc2-AID-Myc protein abundance and TIR1-Myc as a loading control. (B) Same as (A) for 2-DSB RAD9-AID. (C) Same as (A) for 2-DSB RAD24-AID. (D) Same as (A) for 2-DSB RAD53-AID.
-
Figure 2—source data 1
Original membranes corresponding to Figure 2A.
The 7 hr ± IAA samples were added to the last two wells.
- https://cdn.elifesciences.org/articles/94334/elife-94334-fig2-data1-v1.zip
-
Figure 2—source data 2
Original files corresponding to Figure 2A.
- https://cdn.elifesciences.org/articles/94334/elife-94334-fig2-data2-v1.zip
-
Figure 2—source data 3
Original membranes corresponding to Figure 2B.
- https://cdn.elifesciences.org/articles/94334/elife-94334-fig2-data3-v1.zip
-
Figure 2—source data 4
Original files corresponding to Figure 2B.
- https://cdn.elifesciences.org/articles/94334/elife-94334-fig2-data4-v1.zip
-
Figure 2—source data 5
Original membranes corresponding to Figure 2C.
- https://cdn.elifesciences.org/articles/94334/elife-94334-fig2-data5-v1.zip
-
Figure 2—source data 6
Original files corresponding to Figure 2C.
- https://cdn.elifesciences.org/articles/94334/elife-94334-fig2-data6-v1.zip
-
Figure 2—source data 7
Original membranes corresponding to Figure 2D.
- https://cdn.elifesciences.org/articles/94334/elife-94334-fig2-data7-v1.zip
-
Figure 2—source data 8
Original files corresponding to Figure 2D.
- https://cdn.elifesciences.org/articles/94334/elife-94334-fig2-data8-v1.zip
Figure 2—figure supplement 1
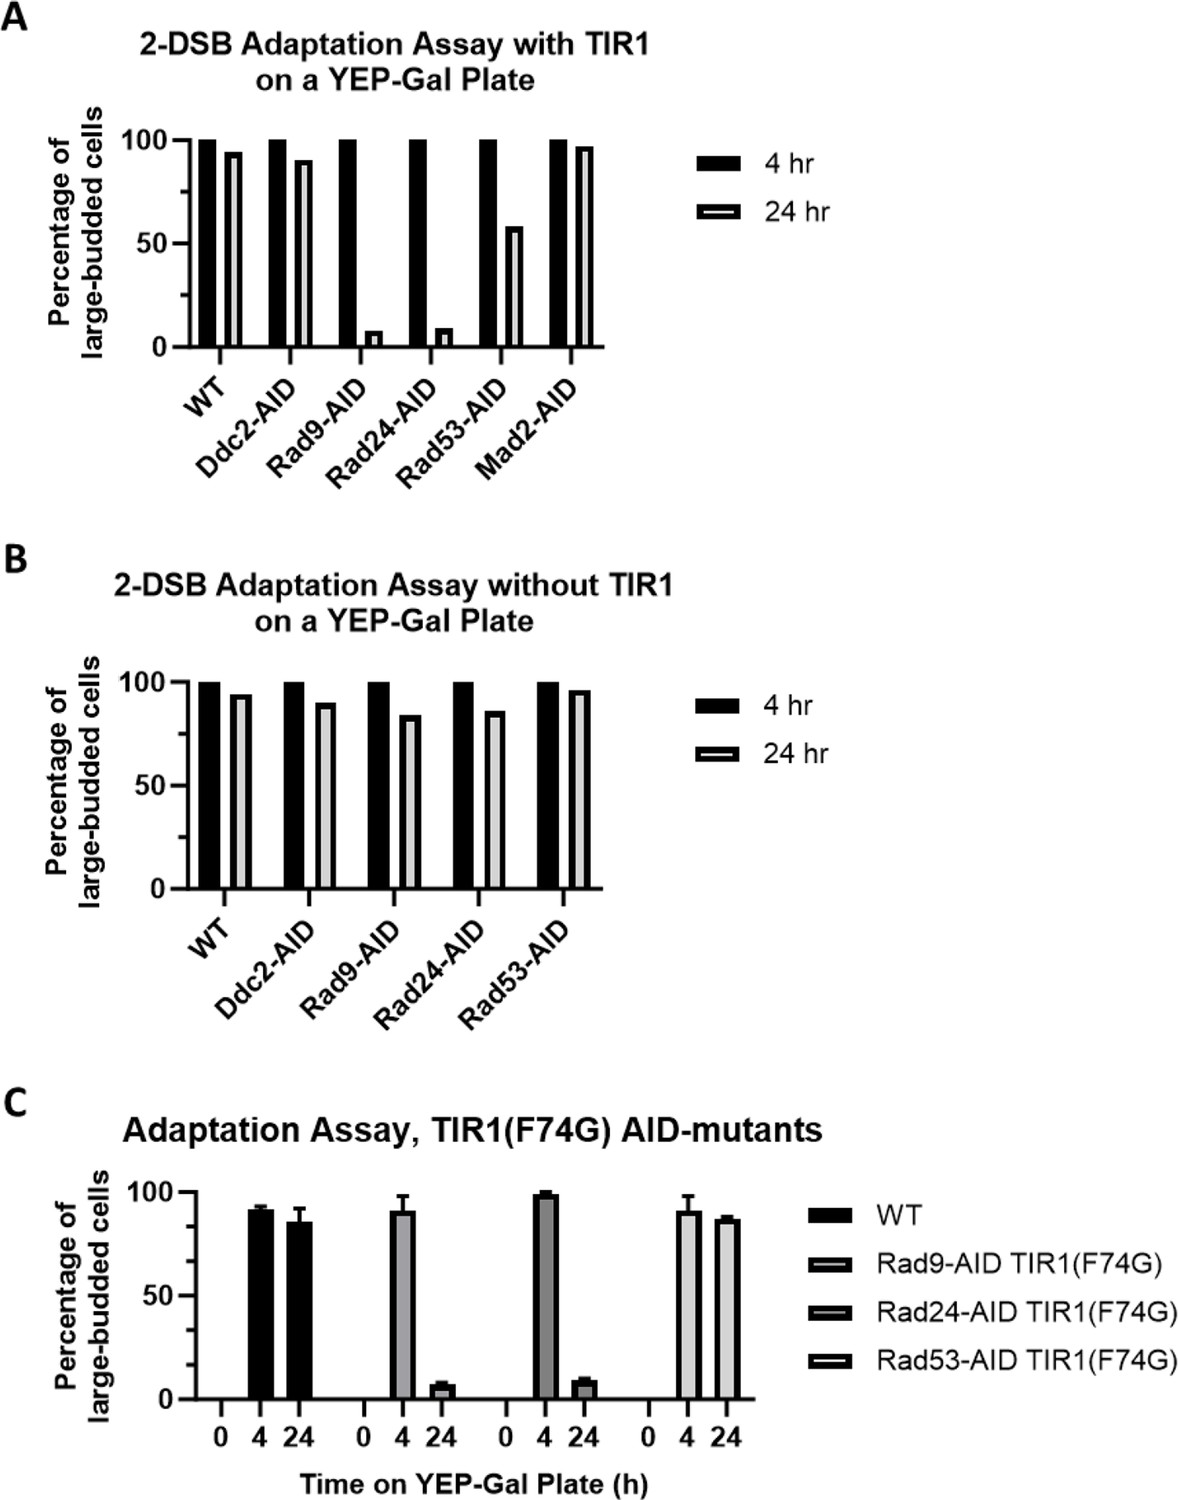
Adaptation assay of AID-tagged checkpoint activation proteins.
(A) Adaptation assay of 50 G1 cells on a YEP-Gal plate after 24 hr for 2-DSB (WT), 2-DSB DDC2-AID, 2-DSB RAD9-AID, 2-DSB RAD24-AID, and 2-DSB RAD53-AID with TIR1. (B) Adaptation assay of 50 G1 cells on a YEP-Gal plate after 24 hr for 2-DSB (WT), 2-DSB DDC2-AID, 2-DSB RAD9-AID, 2-DSB RAD24-AID, and 2-DSB RAD53-AID without TIR1. (C) Adaptation assay of 50 G1 cells on YEP-Gal plate after 24 hr for 2-DSB (WT), 2-DSB RAD9-AID TIR1 (F74G), 2-DSB RAD24-AID (F74G), and 2-DSB RAD53-AID TIR1 (F74G).
Figure 2—figure supplement 2
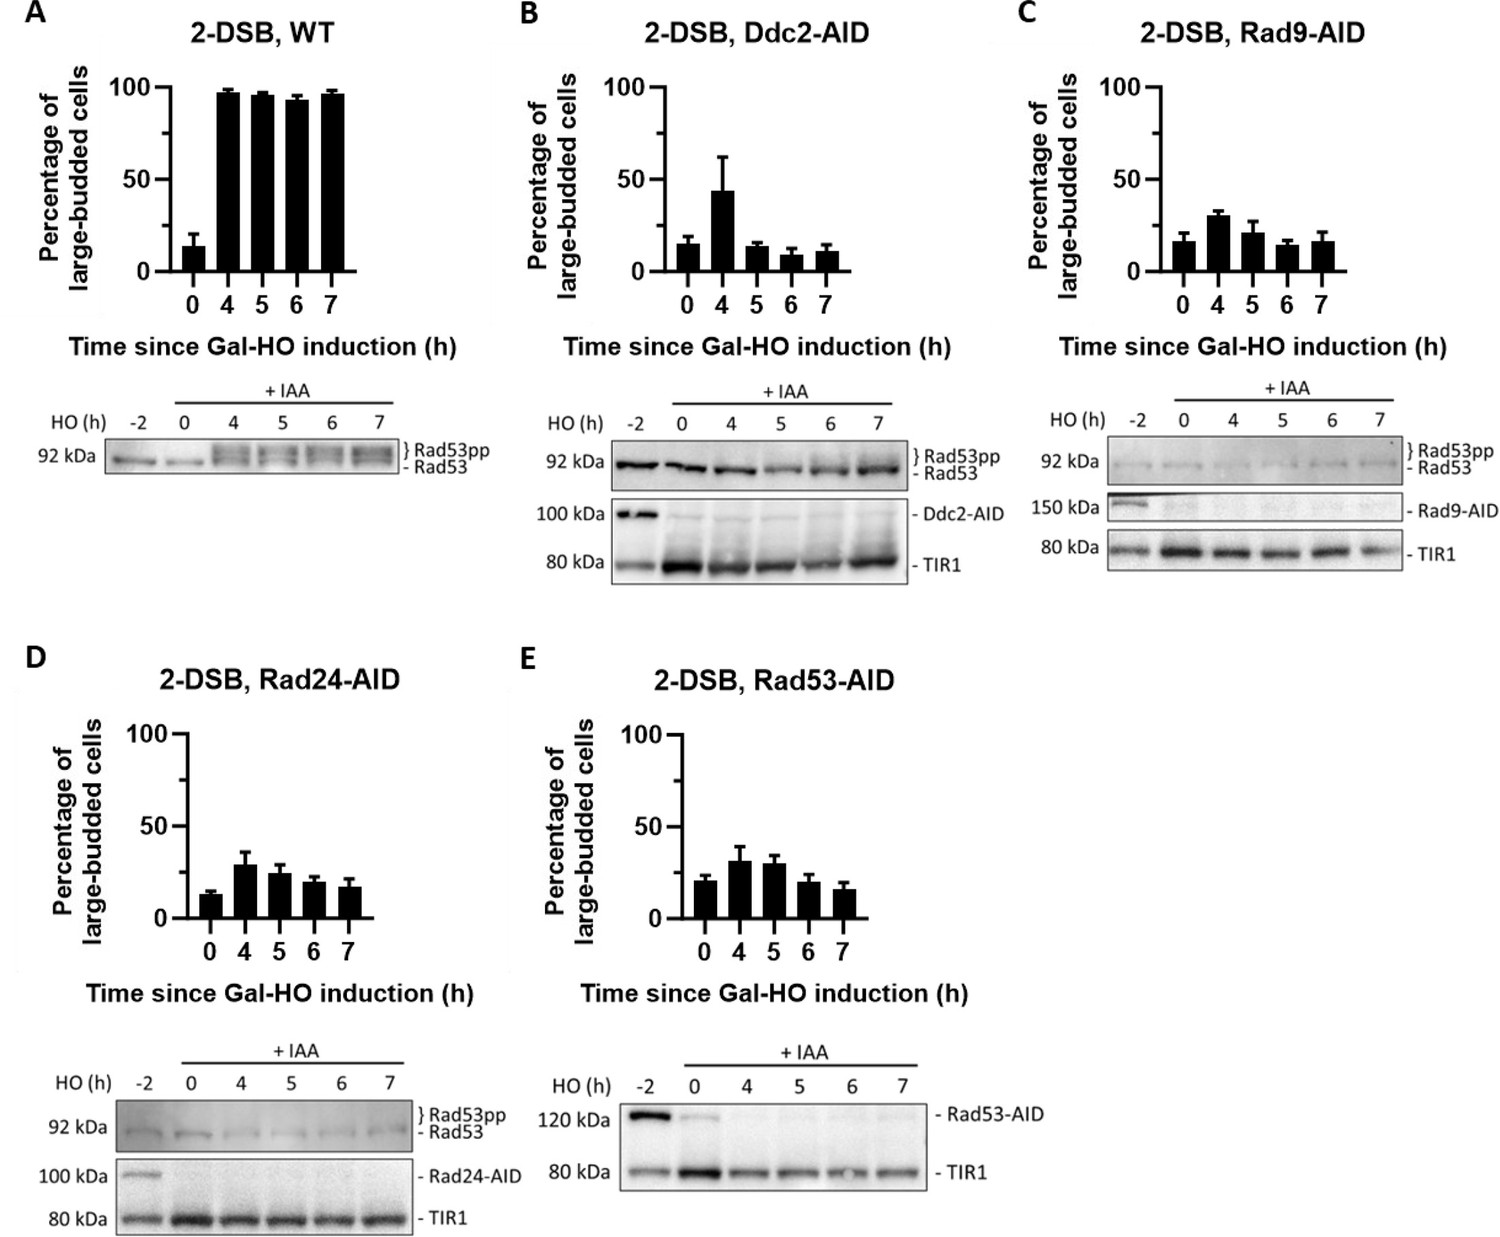
AID-tagged checkpoint proteins readily degrade with auxin.
(A) Morphological profile of a 2-DSB background where 1 mM auxin (IAA) was added 2 hr before DSB induction with galactose. Western blot of a 2-DSB strain probed with α-Rad53. α-Rad53 shows both an unphosphorylated protein and multiple phosphorylated species. (B) Morphological profile of DDC2-AID in a 2-DSB background where IAA was added 2 hr before galactose. Western blot probed with α-Rad53 and α-Myc. α-Rad53 shows both an unphosphorylated protein and multiple phosphorylated species. α-Myc shows Ddc2-AID degradation and TIR1-Myc as a loading control. (C) Same as (B) for 2-DSB RAD9-AID. α-Myc probe shows Rad9-AID degradation with IAA. (D) Same as (B) for 2-DSB RAD24-AID. α-Myc probe shows Rad24-AID degradation with IAA. (E) Same as (B) for 2-DSB RAD53-AID. α-Myc probe shows Rad53-AID degradation with IAA.
-
Figure 2—figure supplement 2—source data 1
Original membranes corresponding to Figure 2—figure supplement 2A.
- https://cdn.elifesciences.org/articles/94334/elife-94334-fig2-figsupp2-data1-v1.zip
-
Figure 2—figure supplement 2—source data 2
Original files corresponding to Figure 2—figure supplement 2A.
- https://cdn.elifesciences.org/articles/94334/elife-94334-fig2-figsupp2-data2-v1.zip
-
Figure 2—figure supplement 2—source data 3
Original membranes corresponding to Figure 2—figure supplement 2B.
- https://cdn.elifesciences.org/articles/94334/elife-94334-fig2-figsupp2-data3-v1.zip
-
Figure 2—figure supplement 2—source data 4
Original files corresponding to Figure 2—figure supplement 2B.
- https://cdn.elifesciences.org/articles/94334/elife-94334-fig2-figsupp2-data4-v1.zip
-
Figure 2—figure supplement 2—source data 5
Original membranes corresponding to Figure 2—figure supplement 2C.
- https://cdn.elifesciences.org/articles/94334/elife-94334-fig2-figsupp2-data5-v1.zip
-
Figure 2—figure supplement 2—source data 6
Original files corresponding to Figure 2—figure supplement 2C.
- https://cdn.elifesciences.org/articles/94334/elife-94334-fig2-figsupp2-data6-v1.zip
-
Figure 2—figure supplement 2—source data 7
Original membranes corresponding to Figure 2—figure supplement 2D.
- https://cdn.elifesciences.org/articles/94334/elife-94334-fig2-figsupp2-data7-v1.zip
-
Figure 2—figure supplement 2—source data 8
Original files corresponding to Figure 2—figure supplement 2D.
- https://cdn.elifesciences.org/articles/94334/elife-94334-fig2-figsupp2-data8-v1.zip
-
Figure 2—figure supplement 2—source data 9
Original membranes corresponding to Figure 2—figure supplement 2E.
- https://cdn.elifesciences.org/articles/94334/elife-94334-fig2-figsupp2-data9-v1.zip
-
Figure 2—figure supplement 2—source data 10
Original files corresponding to Figure 2—figure supplement 2E.
- https://cdn.elifesciences.org/articles/94334/elife-94334-fig2-figsupp2-data10-v1.zip
Figure 2—figure supplement 3
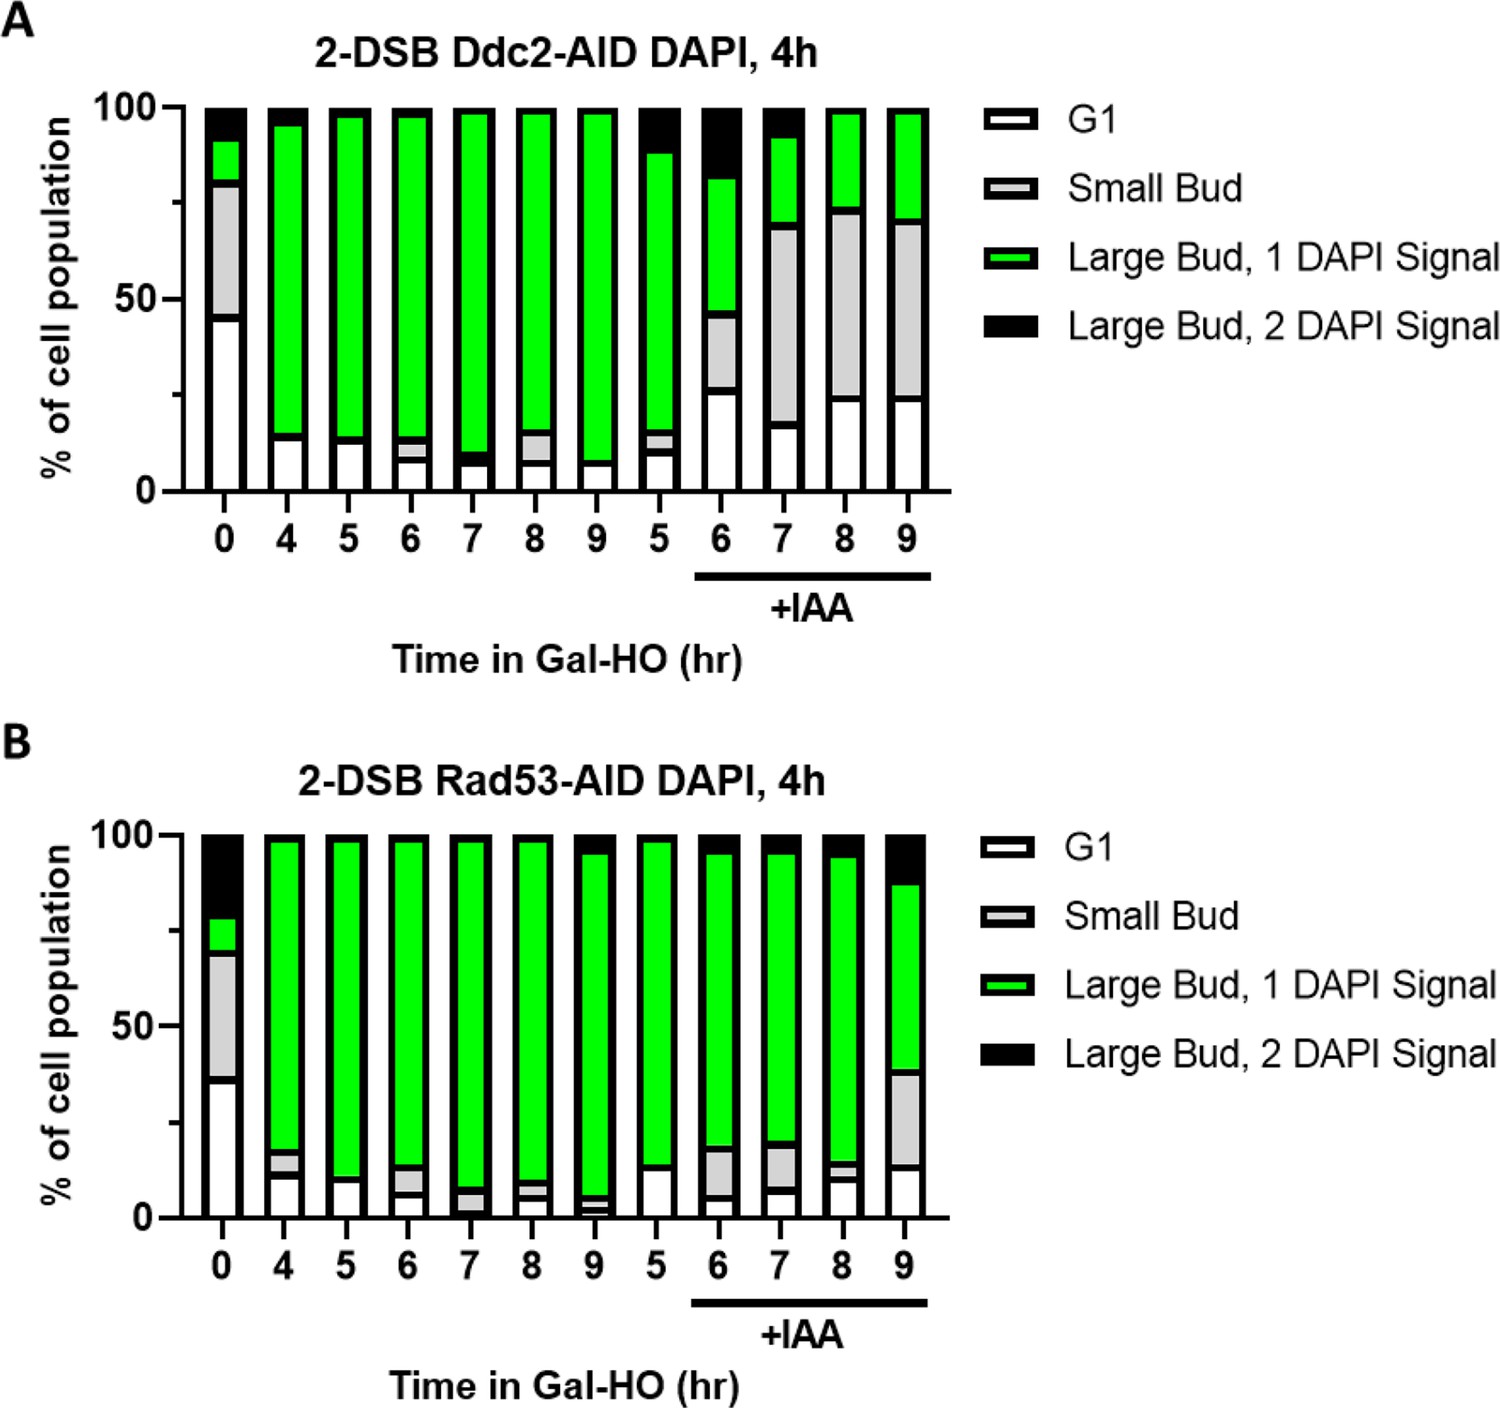
Cell cycle profile as determined by budding and DAPI staining in Ddc2-AID and Rad53-AID mutants ±IAA 4 hr after galactose.
(A) Profile of DAPI-stained cells in a 2-DSB DDC2-AID strain after HO induction. Cultures were split 4 hr after Gal-HO induction. Cells were divided based on cell morphology and number of DAPI signals. (B) Same as (A) for 2-DSB RAD53-AID.
Figure 3 with 1 supplement
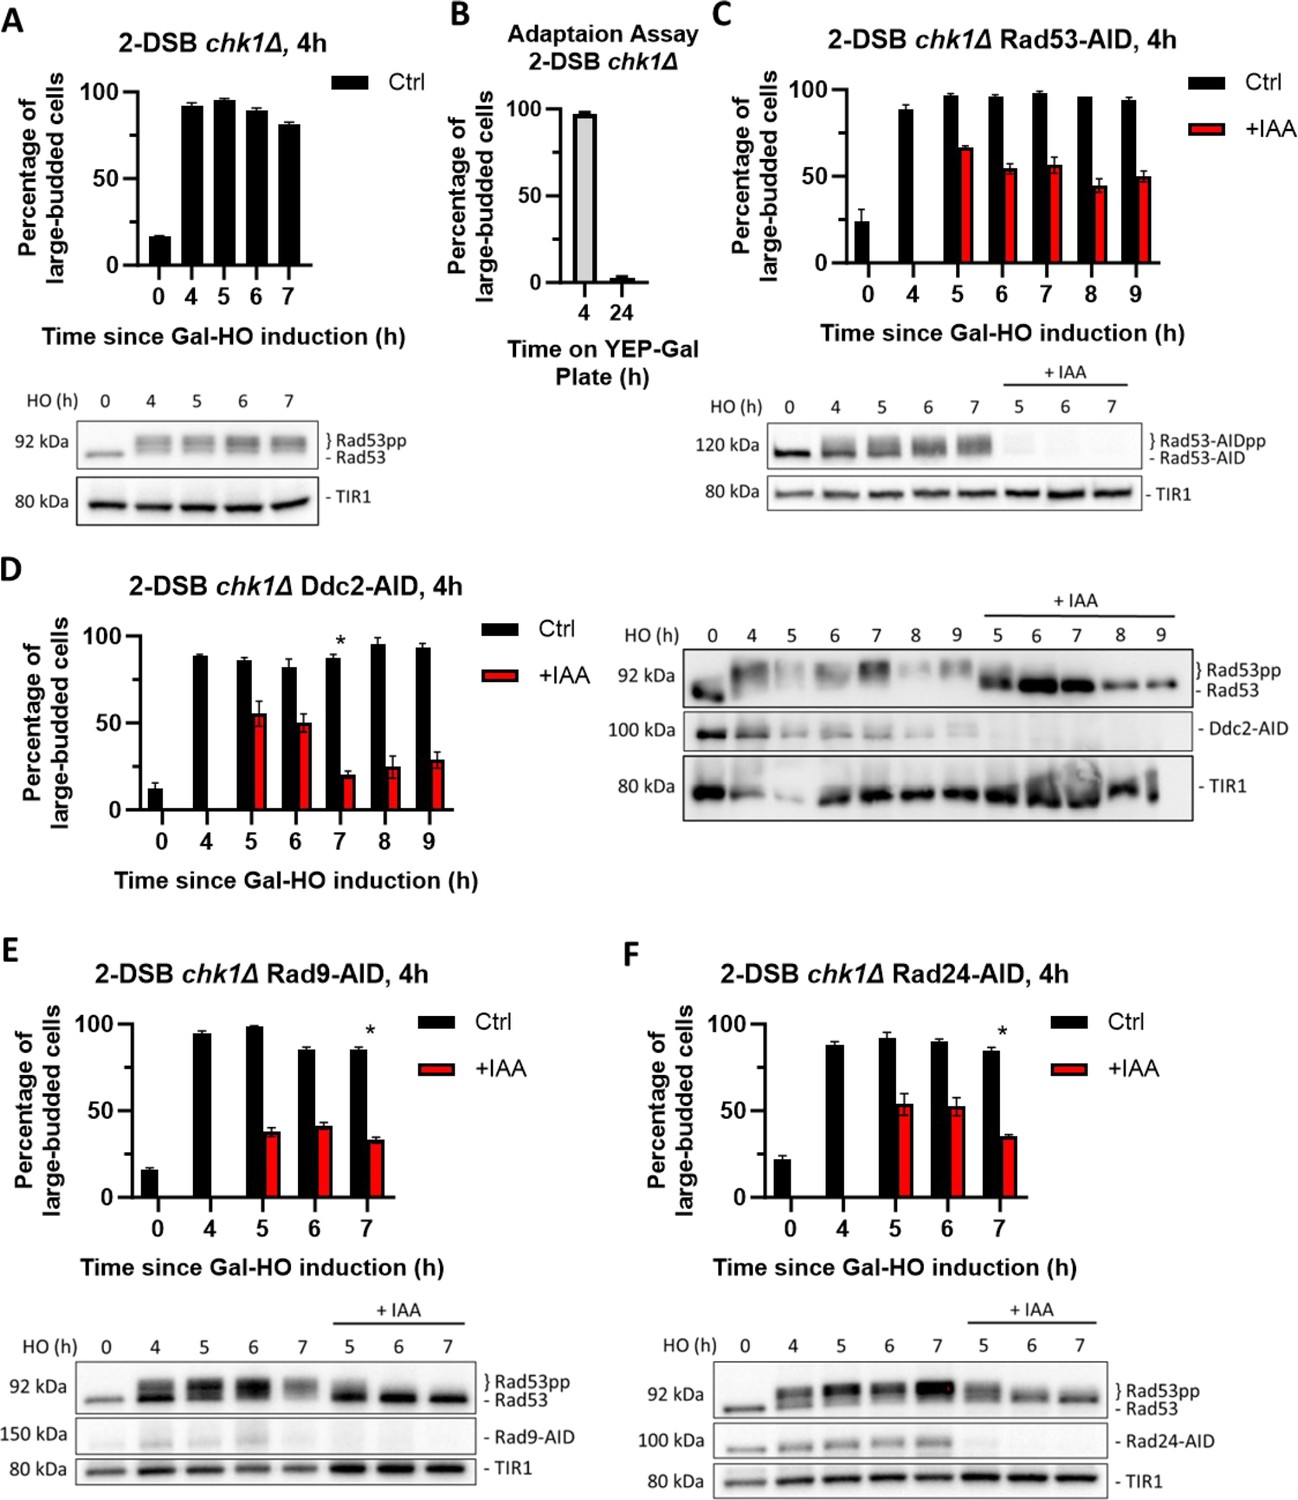
Chk1 is dispensable for activation of the cell cycle arrest, but essential for its maintenance.
(A) Percentage of G2/M cells in a 2-DSB chk1∆ strain following DNA damage. Data are shown from three independent experiments, with error bars representing the standard error of the mean (SEM). Western blot probed with α-Rad53 to determine the status of DDC and α-Myc to determine TIR1-Myc protein abundance. (B) Adaptation assay with 2-DSB chk1∆ strain. (C) Percentage of G2/M-arrested cells a 2-DSB chk1∆ RAD53-AID strain after DNA damage. Cultures were split 4 hr after DSB induction and treated with 1 mM auxin (+IAA) or with ethanol (Ctrl). Data are shown from three independent experiments, with error bars representing the standard error of the mean (SEM). Western blot probed with α-Myc for Rad53-AID and TIR1-Myc as a loading control. (D) Same as (C) for 2-DSB chk1∆ DDC2-AID. Western blot probed with α-Rad53 and α-Myc. α-Rad53 shows both an unphosphorylated protein and multiple phosphorylated species. α-Myc shows Ddc2-AID degradation and TIR1-Myc as a loading control. The asterisk shows when the percentage of large-budded cells returned to pre-damage levels. (E) Same as (D) for 2-DSB chk1∆ RAD9-AID. (F) Same as (D) for 2-DSB chk1∆ RAD24-AID.
-
Figure 3—source data 1
Original membranes corresponding to Figure 3A.
- https://cdn.elifesciences.org/articles/94334/elife-94334-fig3-data1-v1.zip
-
Figure 3—source data 2
Original files corresponding to Figure 3A.
- https://cdn.elifesciences.org/articles/94334/elife-94334-fig3-data2-v1.zip
-
Figure 3—source data 3
Original membranes corresponding to Figure 3C.
- https://cdn.elifesciences.org/articles/94334/elife-94334-fig3-data3-v1.zip
-
Figure 3—source data 4
Original files corresponding to Figure 3C.
- https://cdn.elifesciences.org/articles/94334/elife-94334-fig3-data4-v1.zip
-
Figure 3—source data 5
Original membranes corresponding to Figure 3D.
- https://cdn.elifesciences.org/articles/94334/elife-94334-fig3-data5-v1.zip
-
Figure 3—source data 6
Original files corresponding to Figure 3D.
- https://cdn.elifesciences.org/articles/94334/elife-94334-fig3-data6-v1.zip
-
Figure 3—source data 7
Original membranes corresponding to Figure 3E.
- https://cdn.elifesciences.org/articles/94334/elife-94334-fig3-data7-v1.zip
-
Figure 3—source data 8
Original files corresponding to Figure 3E.
- https://cdn.elifesciences.org/articles/94334/elife-94334-fig3-data8-v1.zip
-
Figure 3—source data 9
Original membranes corresponding to Figure 3F.
- https://cdn.elifesciences.org/articles/94334/elife-94334-fig3-data9-v1.zip
-
Figure 3—source data 10
Original files corresponding to Figure 3F.
- https://cdn.elifesciences.org/articles/94334/elife-94334-fig3-data10-v1.zip
Figure 3—figure supplement 1
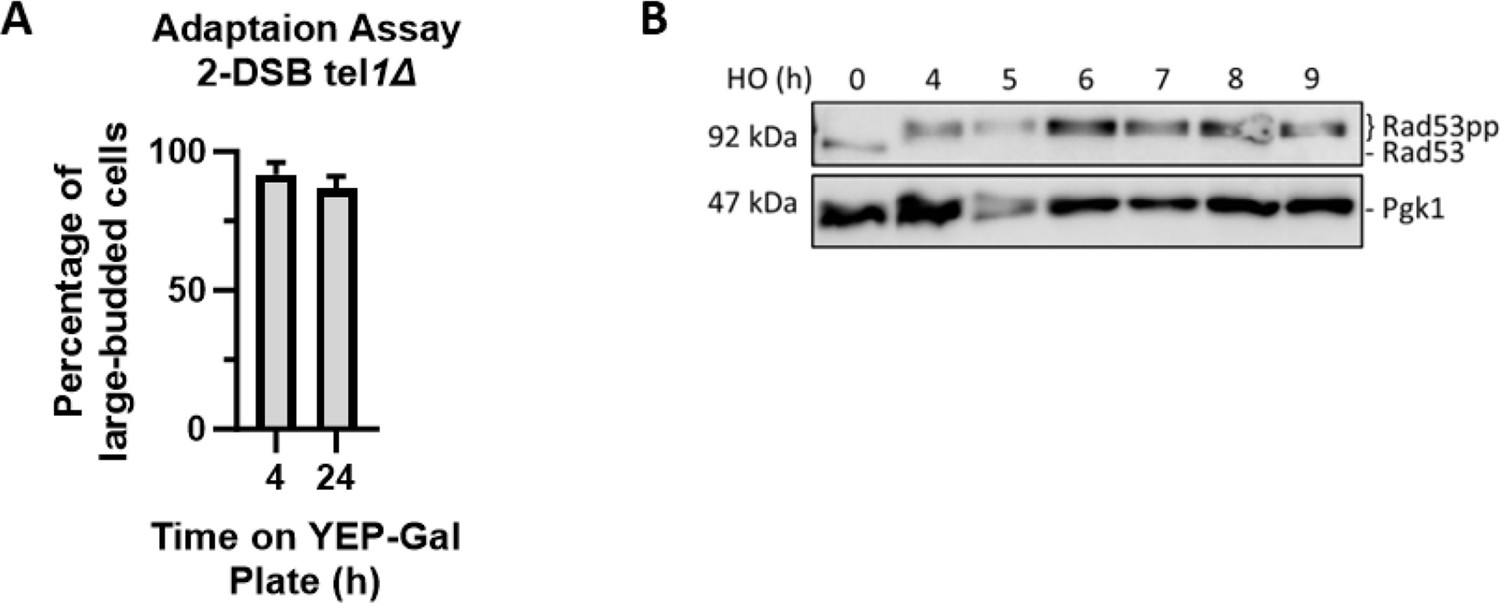
Tel1 is not required for DDC activation or Rad53 phosphorylation.
(A) Adaptation assay for a tel1∆ strain. Cultures were grown in YEP-Lac and put on a YEP-Gal plate. 50 G1 cells were selected to monitor their morphology after 4 and 24 hr on the YEP-Gal plate. (B) Western blot probing α-Rad53 in a 2-DSB tel1∆. α-Pgk1 probed as a loading control.
-
Figure 3—figure supplement 1—source data 1
Original membranes corresponding to Figure 3—figure supplement 1B.
- https://cdn.elifesciences.org/articles/94334/elife-94334-fig3-figsupp1-data1-v1.zip
-
Figure 3—figure supplement 1—source data 2
Original files corresponding to Figure 3—figure supplement 1B.
- https://cdn.elifesciences.org/articles/94334/elife-94334-fig3-figsupp1-data2-v1.zip
Figure 4
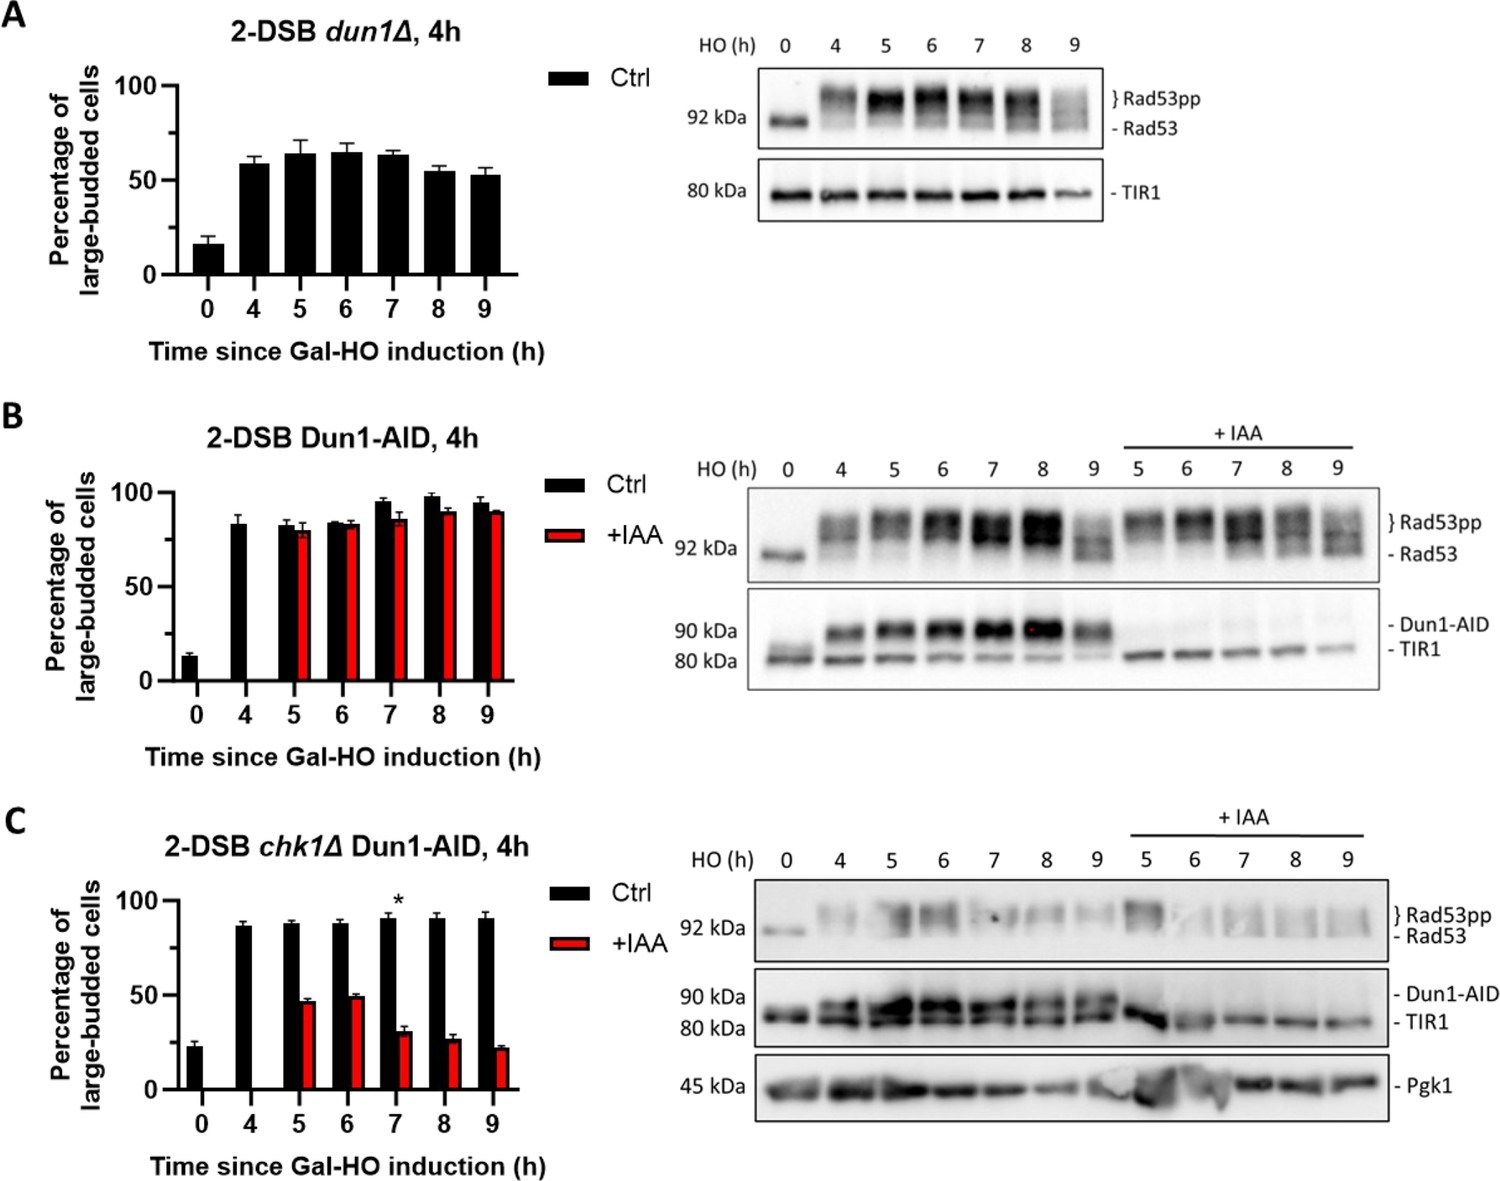
Dun1 is not required for checkpoint maintenance.
(A) Adaptation assay of 50 G1 cells on a YEP-Gal plate with 2-DSB dun1∆. G2/M arrest was determined based on cell morphology as shown in Figure 1A. Data is shown from three trials with standard error of the mean (SEM). Western blot probed with α-Rad53 and α-Myc for TIR1-Myc as a loading control. (B) Percentage of G2/M-arrested cells for 2-DSB DUN1-AID after HO induction. Data are shown from three trials with standard error of the mean (SEM). Cultures were split 4 hr after DSB induction; with auxin (1 mM) (+IAA). Western blot probed with α-Rad53 and α-Myc. α-Rad53 shows both an unphosphorylated protein and multiple phosphorylated species. α-Myc shows Dun1-AID degradation and TIR1-Myc as a loading control. (C) Same as (B) for 2-DSB chk1∆ DUN1-AID. The asterisk marks when the percentage of large-budded cells returned to pre-damage levels.
-
Figure 4—source data 1
Original membranes corresponding to Figure 4A.
- https://cdn.elifesciences.org/articles/94334/elife-94334-fig4-data1-v1.zip
-
Figure 4—source data 2
Original files corresponding to Figure 4A.
- https://cdn.elifesciences.org/articles/94334/elife-94334-fig4-data2-v1.zip
-
Figure 4—source data 3
Original membranes corresponding to Figure 4B.
- https://cdn.elifesciences.org/articles/94334/elife-94334-fig4-data3-v1.zip
-
Figure 4—source data 4
Original files corresponding to Figure 4B.
- https://cdn.elifesciences.org/articles/94334/elife-94334-fig4-data4-v1.zip
-
Figure 4—source data 5
Original membranes corresponding to Figure 4C.
- https://cdn.elifesciences.org/articles/94334/elife-94334-fig4-data5-v1.zip
-
Figure 4—source data 6
Original files corresponding to Figure 4C.
- https://cdn.elifesciences.org/articles/94334/elife-94334-fig4-data6-v1.zip
Figure 5 with 1 supplement
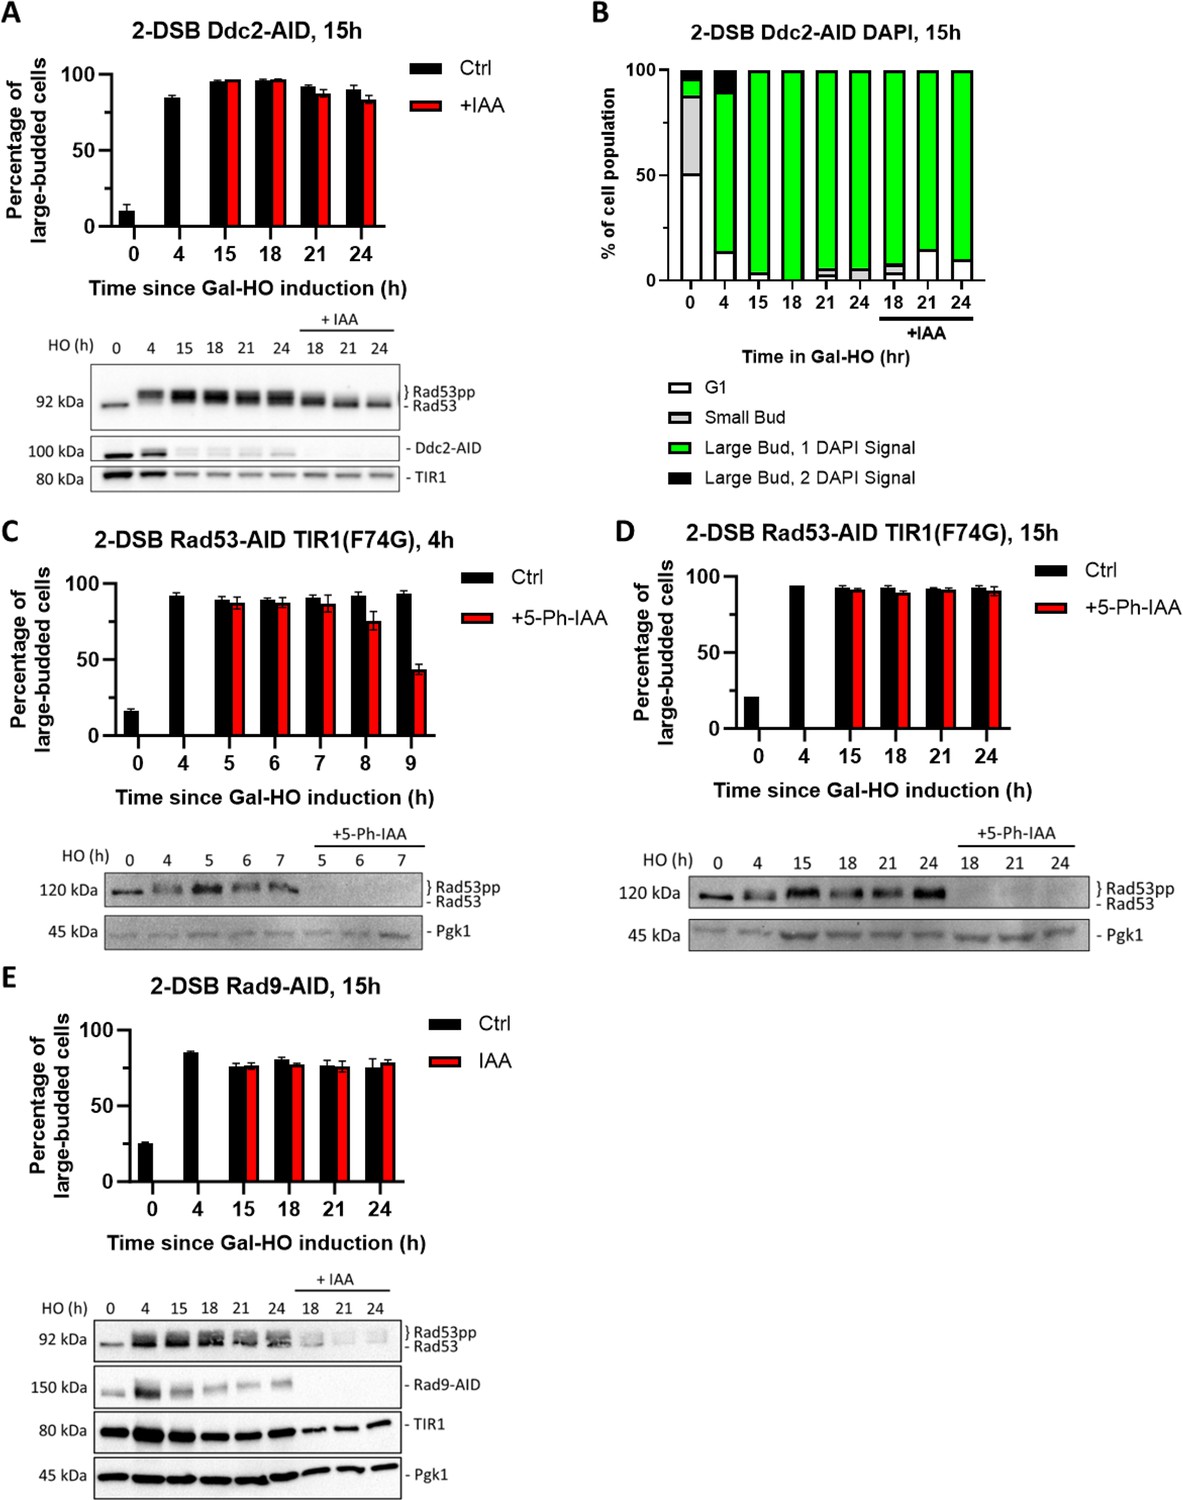
Ddc2 and Rad53 are dispensable for >24 hr checkpoint arrest.
(A) Percentage of G2/M-arrested cells for 2-DSB DDC2-AID after HO induction. Data is shown from three trials with standard error of the mean (SEM). Western blot probed with α-Rad53 and α-Myc. α-Rad53 shows both an unphosphorylated protein and multiple phosphorylated species. α-Myc shows Ddc2-AID degradation and TIR1-Myc as a loading control. (B) Profile of DAPI-stained cells in a 2-DSB DDC2-AID strain after HO induction. Cells were categorized based on cell morphology and number of DAPI signals. (C) Percentage of G2/M-arrested cells for 2-DSB RAD53-AID TIR1(F74G) after HO induction. 5-Ph-IAA was added 4 hr after HO induction. Data is shown from three trials with standard error of the mean (SEM). Western blot probed with α-Rad53, α-Myc, and α-Pgk1. α-Rad53 shows both an unphosphorylated protein and multiple phosphorylated species. α-Myc shows Rad53-AID degradation. α-Pgk1 probed as a loading control. (D) Same as (C) where 5-Ph-IAA was added 15 hr after HO induction. (E) Percentage G2/M-arrested cells for 2-DSB RAD9-AID plus pRad9-AID after HO induction. Data shown from three trials with standard error of the mean (SEM). Western blot probed with α-Rad53 and α-Myc. α-Rad53 shows both an unphosphorylated protein and multiple phosphorylated species. α-Myc shows Rad9-AID degradation and TIR1-Myc as a loading control. α-Pgk1 probed as a loading control.
-
Figure 5—source data 1
Original membranes corresponding to Figure 5A.
The 24 hr ± IAA samples were added to the last two wells.
- https://cdn.elifesciences.org/articles/94334/elife-94334-fig5-data1-v1.zip
-
Figure 5—source data 2
Original files corresponding to Figure 5A.
- https://cdn.elifesciences.org/articles/94334/elife-94334-fig5-data2-v1.zip
-
Figure 5—source data 3
Original membranes corresponding to Figure 3C.
- https://cdn.elifesciences.org/articles/94334/elife-94334-fig5-data3-v1.zip
-
Figure 5—source data 4
Original files corresponding to Figure 3C.
- https://cdn.elifesciences.org/articles/94334/elife-94334-fig5-data4-v1.zip
-
Figure 5—source data 5
Original membranes corresponding to Figure 3D.
- https://cdn.elifesciences.org/articles/94334/elife-94334-fig5-data5-v1.zip
-
Figure 5—source data 6
Original files corresponding to Figure 3D.
- https://cdn.elifesciences.org/articles/94334/elife-94334-fig5-data6-v1.zip
-
Figure 5—source data 7
Original membranes corresponding to Figure 3E.
- https://cdn.elifesciences.org/articles/94334/elife-94334-fig5-data7-v1.zip
-
Figure 5—source data 8
Original files corresponding to Figure 3E.
- https://cdn.elifesciences.org/articles/94334/elife-94334-fig5-data8-v1.zip
Figure 5—figure supplement 1
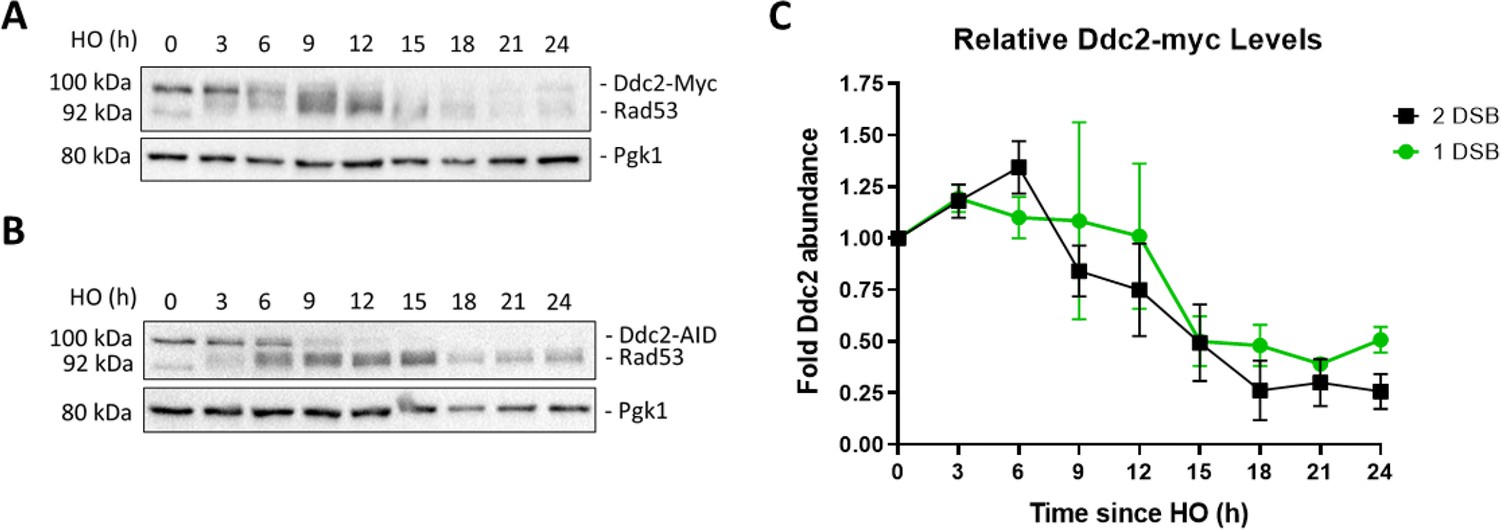
Relative levels of Ddc2 decrease after DSB induction.
(A, B) Western blots probed with α-Myc for Ddc2-9xMyc and Ddc2-9xMyc-AID in a 1-DSB and 2-DSB, respectively. α-Pgk1 is used as a loading control. (C) Relative levels of Ddc2 in a 1-DSB and 2-DSB strain up to 24 hr after DSB induction.
-
Figure 5—figure supplement 1—source data 1
Original membranes corresponding to Figure 5—figure supplement 1A.
- https://cdn.elifesciences.org/articles/94334/elife-94334-fig5-figsupp1-data1-v1.zip
-
Figure 5—figure supplement 1—source data 2
Original files corresponding to Figure 5—figure supplement 1A.
- https://cdn.elifesciences.org/articles/94334/elife-94334-fig5-figsupp1-data2-v1.zip
-
Figure 5—figure supplement 1—source data 3
Original membranes corresponding to Figure 5—figure supplement 1B.
- https://cdn.elifesciences.org/articles/94334/elife-94334-fig5-figsupp1-data3-v1.zip
-
Figure 5—figure supplement 1—source data 4
Original files corresponding to Figure 5—figure supplement 1B.
- https://cdn.elifesciences.org/articles/94334/elife-94334-fig5-figsupp1-data4-v1.zip
Figure 6 with 3 supplements
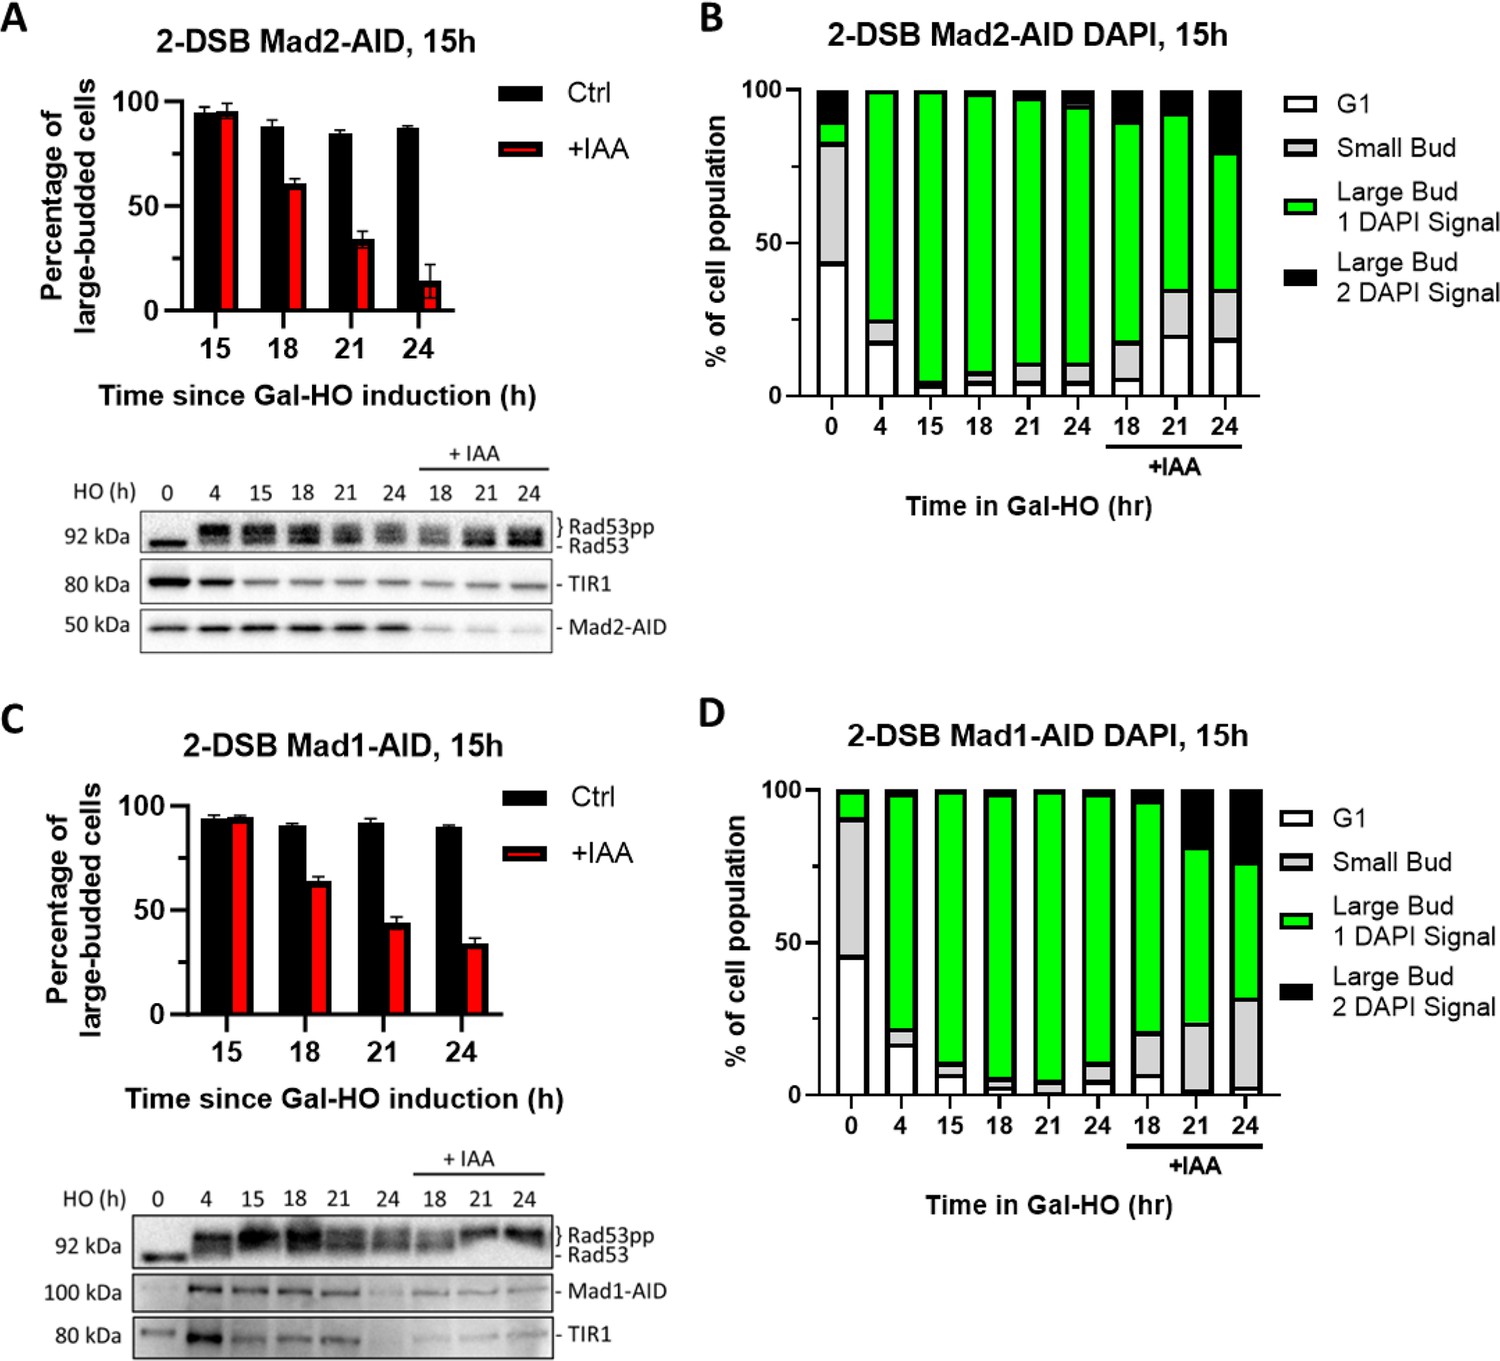
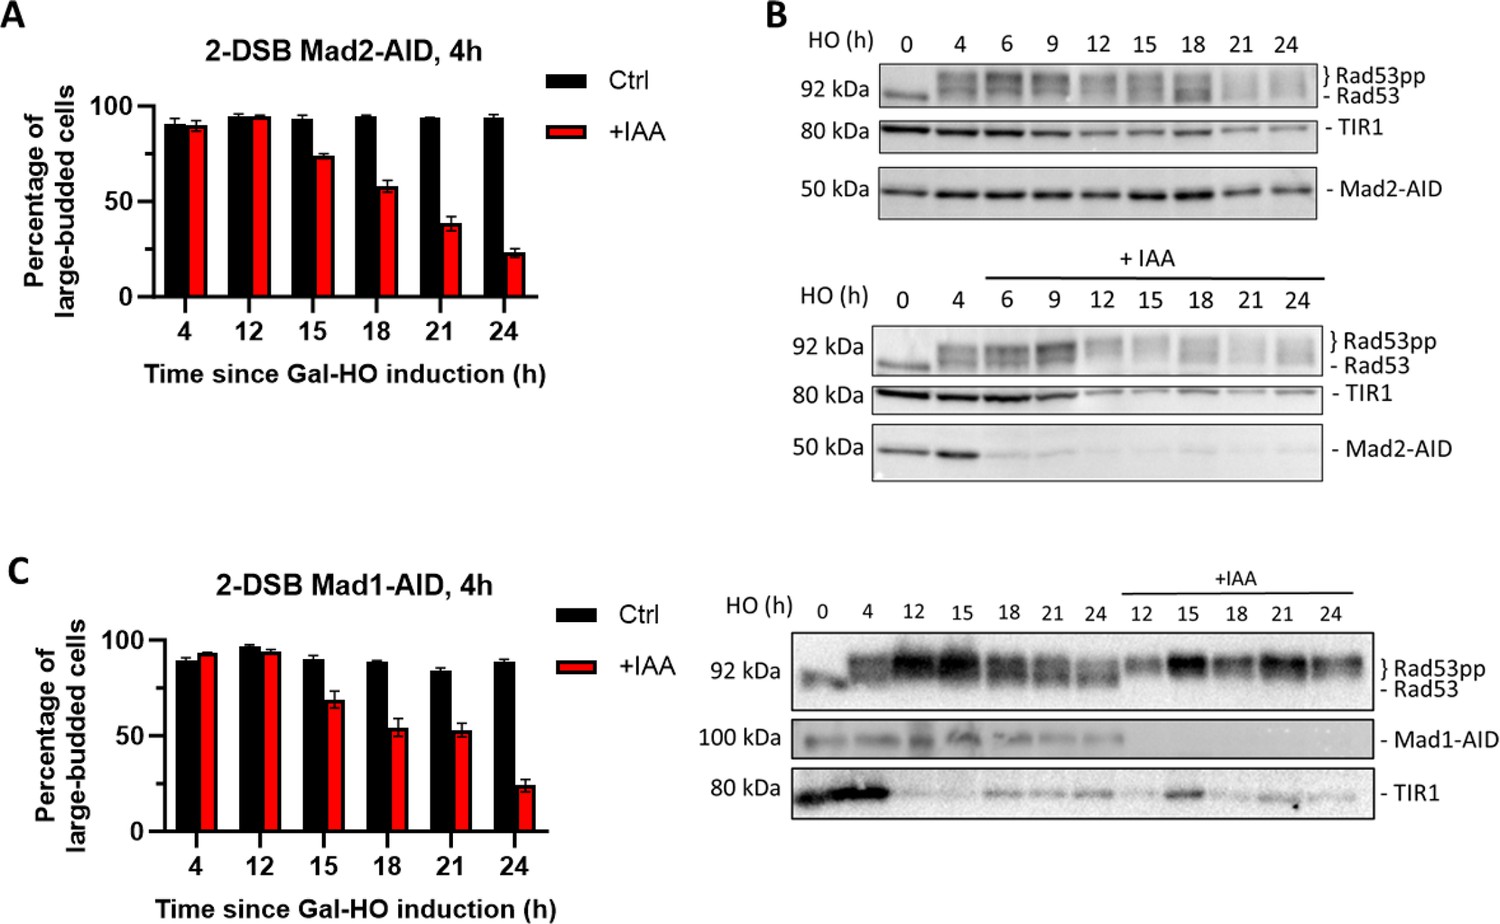
Degradation of Mad2 or Mad1 at 15 hr releases cells from checkpoint arrest.
(A) Percentage of G2/M-arrested cells for 2-DSB MAD2-AID after HO induction. Data is shown from three trials with standard error of the mean (SEM). Western blot probed with α-Rad53 and α-Myc. α-Rad53 shows both an unphosphorylated protein and multiple phosphorylated species. α-Myc shows Mad2-AID degradation and TIR1-Myc as a loading control. (B) Profile of DAPI-stained cells in a 2-DSB MAD2-AID strain after HO induction. Liquid cultures were split 15 hr after HO induction and treated with either IAA or ethanol. Cells were scored based on cell morphology and number of DAPI signals. (C) Same as (A) for 2-DSB MAD1-AID. (D) Same as (B) for 2-DSB MAD1-AID.
-
Figure 6—source data 1
Original membranes corresponding to Figure 6A.
- https://cdn.elifesciences.org/articles/94334/elife-94334-fig6-data1-v1.zip
-
Figure 6—source data 2
Original files corresponding to Figure 6A.
- https://cdn.elifesciences.org/articles/94334/elife-94334-fig6-data2-v1.zip
-
Figure 6—source data 3
Original membranes corresponding to Figure 6C.
- https://cdn.elifesciences.org/articles/94334/elife-94334-fig6-data3-v1.zip
-
Figure 6—source data 4
Original files corresponding to Figure 6C.
- https://cdn.elifesciences.org/articles/94334/elife-94334-fig6-data4-v1.zip
Figure 6—figure supplement 1
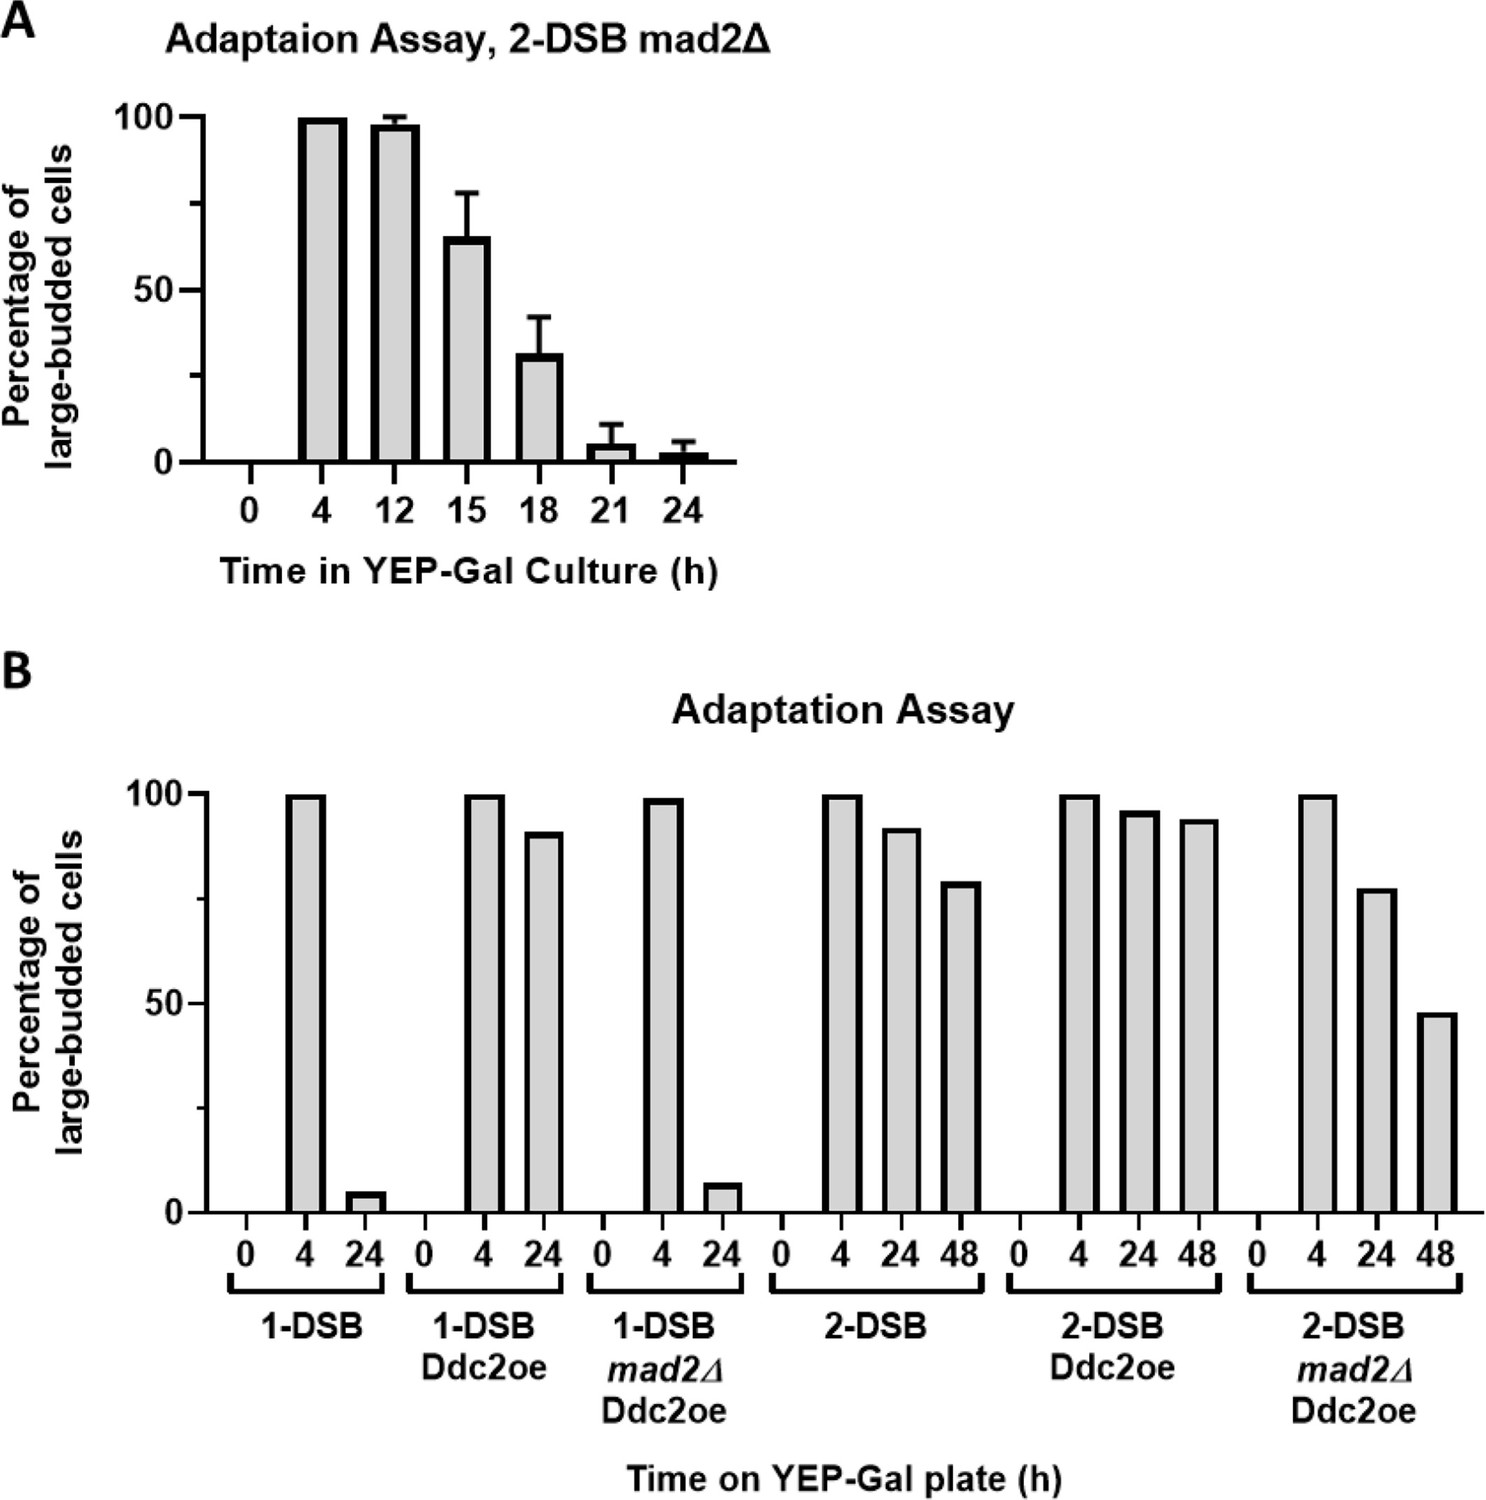
Mad2 is required for permanent arrest in a 2-DSB strain.
(A) Adaptation assay of 1-DSB and 2-DSB where morphology is measured for up to 24 hr and 48 hr, respectively. A second copy of Ddc2 with a GAL1,10 promotor, Ddc2 overexpression (Ddc2oe), was integrated into the 1-DSB and 2-DSB strains. MAD2 was deleted in both backgrounds with the second copy of Ddc2. (B) Adaptation assay for a mad2∆ in a 2-DSB strain.
Figure 6—figure supplement 2
Mad1 and Mad2 are required for permanent arrest in a 2-DSB strain.
(A) Morphological profile of MAD2-AID after HO induction on a YEP-Gal or YEP-Gal-IAA plate. Galactose was added to an overnight culture of Mad2-AID in YEP-Lac. 4 hr after adding galactose, cells were added to a YEP-Gal plate or a YEP-Gal-IAA (1 mM IAA) plate. The morphology of cells was measured for up to 24 hr on each plate. (B) Western blot probed with α-Rad53 and α-Myc. α-Rad53 shows both an unphosphorylated protein and multiple phosphorylated species. α-Myc shows Mad2-AID degradation and TIR1-Myc as a loading control. The top western blot samples were treated with ethanol and bottom western blot samples were treated with IAA. (C) Same as (A) for MAD1-AID. Western blot probed with α-Rad53 and α-Myc. α-Rad53 shows both an unphosphorylated protein and multiple phosphorylated species. α-Myc shows Mad1-AID degradation and TIR1-Myc as a loading control.
-
Figure 6—figure supplement 2—source data 1
Original membranes corresponding to Figure 6—figure supplement 2B.
- https://cdn.elifesciences.org/articles/94334/elife-94334-fig6-figsupp2-data1-v1.zip
-
Figure 6—figure supplement 2—source data 2
Original files corresponding to Figure 6—figure supplement 2B.
- https://cdn.elifesciences.org/articles/94334/elife-94334-fig6-figsupp2-data2-v1.zip
-
Figure 6—figure supplement 2—source data 3
Original membranes corresponding to Figure 6—figure supplement 2C.
- https://cdn.elifesciences.org/articles/94334/elife-94334-fig6-figsupp2-data3-v1.zip
-
Figure 6—figure supplement 2—source data 4
Original files corresponding to Figure 6—figure supplement 2C.
- https://cdn.elifesciences.org/articles/94334/elife-94334-fig6-figsupp2-data4-v1.zip
Figure 6—figure supplement 3
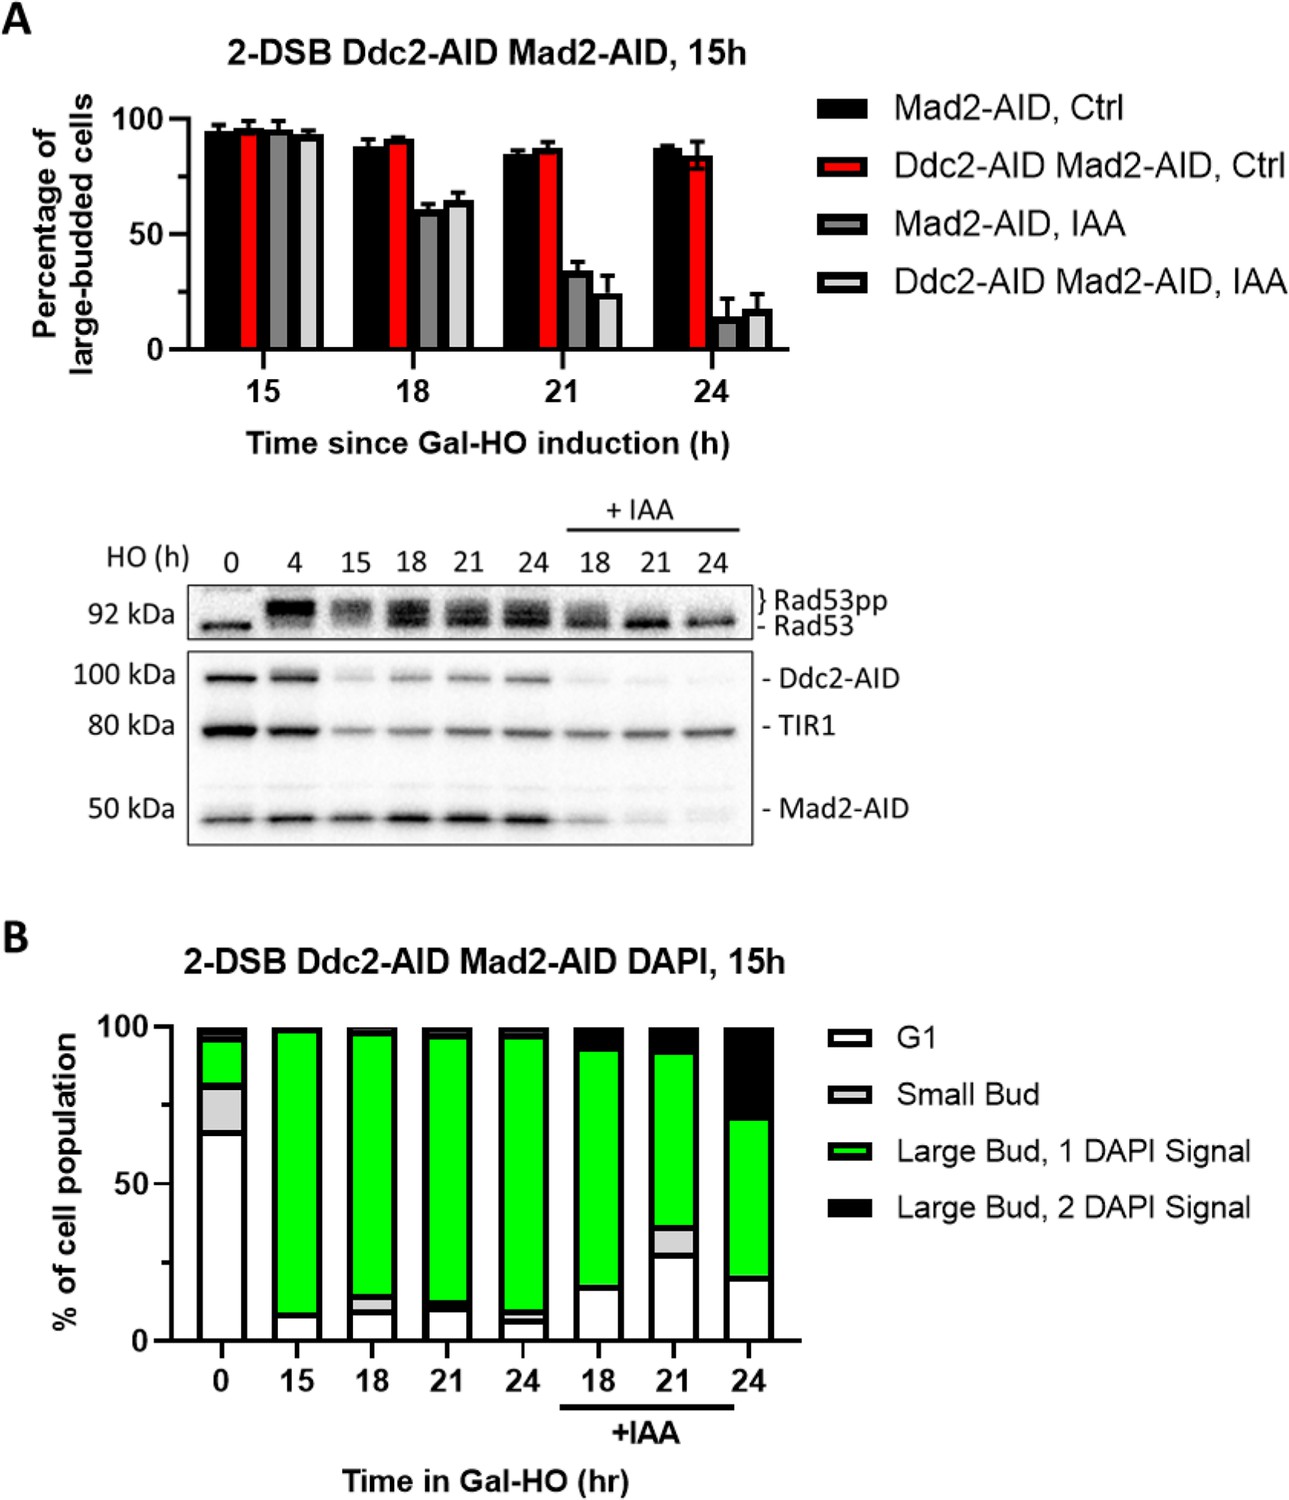
Degradation of Ddc2 and Mad2 at 15 hr releases cells from checkpoint arrest.
(A) Morphological profile of a 2-DSB MAD2-AID and DDC2-AID MAD2-AID strains after HO induction. Cultures were added onto YEP-Gal ± IAA plates 15 hr after adding HO induction. Ctrl samples were plated on a YEP-Gal plate and IAA samples were plated on a YEP-GAL-IAA plate. Western blot probed with α-Rad53 and α-Myc. α-Rad53 shows both an unphosphorylated protein and multiple phosphorylated species. α-Myc shows Ddc2-AID Mad2-AID degradation and TIR1-Myc as a loading control. (B) Profile of DAPI-stained cells in a 2-DSB DDC2-AID MAD2-AID strain after HO induction. Cultures were split 15 hr after HO induction and treated with either IAA or ethanol. Cells were divided based on cell morphology and number of DAPI signals.
-
Figure 6—figure supplement 3—source data 1
Original membranes corresponding to Figure 6—figure supplement 3A.
- https://cdn.elifesciences.org/articles/94334/elife-94334-fig6-figsupp3-data1-v1.zip
-
Figure 6—figure supplement 3—source data 2
Original files corresponding to Figure 6—figure supplement 3A.
- https://cdn.elifesciences.org/articles/94334/elife-94334-fig6-figsupp3-data2-v1.zip
Figure 7 with 1 supplement
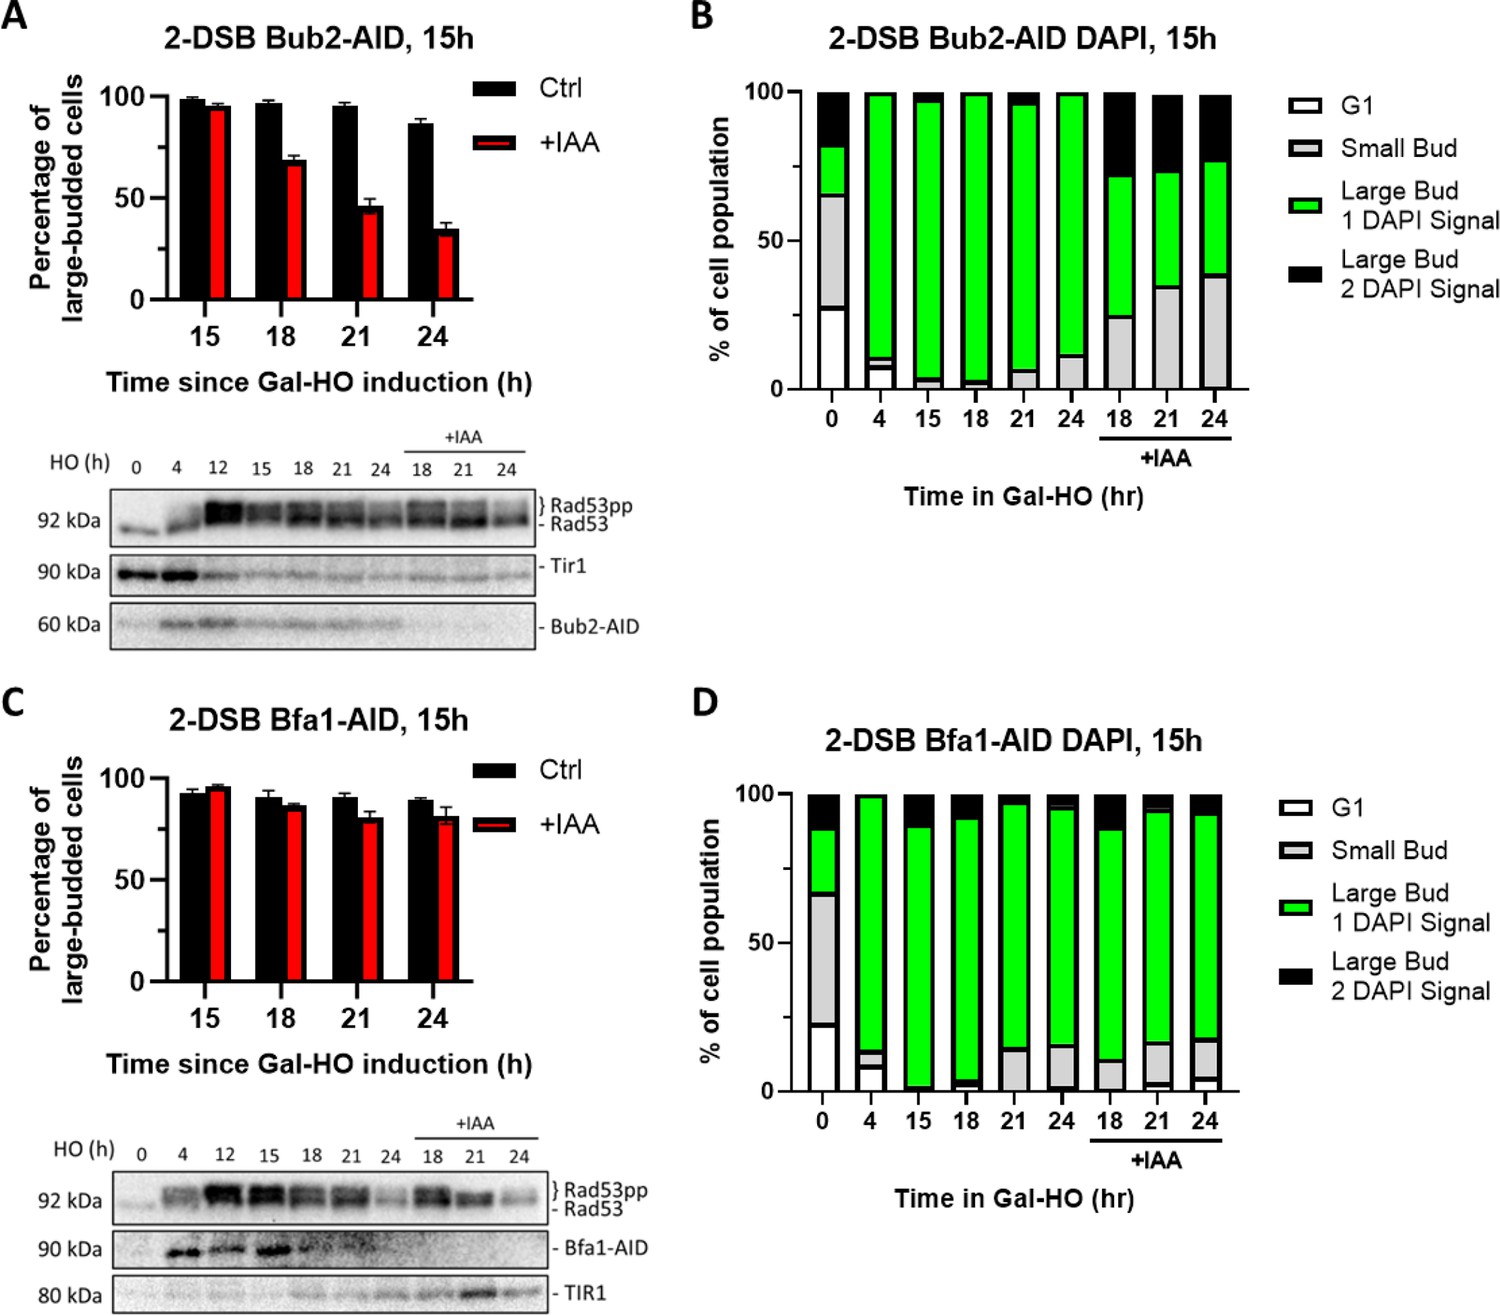
Degradation of Bub2 but not Bfa1 at 15 hr releases cells from checkpoint arrest.
(A) Percentage of G2/M-arrested cells for 2-DSB BUB2-AID after HO induction. Data is shown from three trials with standard error of the mean (SEM). Western blot probed with α-Rad53 and α-Myc. α-Rad53 shows both an unphosphorylated protein and multiple phosphorylated species. α-Myc shows Bub2-AID degradation and TIR1-Myc as a loading control. (B) Profile of DAPI-stained cells in a 2-DSB BUB2-AID strain after HO induction. Liquid cultures were split 15 hr after HO induction and treated with either IAA or ethanol. Cells were scored based on cell morphology and number of DAPI signals. (C) Same as (A) for 2-DSB BFA1-AID. (D) Same as (B) for 2-DSB BFA1-AID.
-
Figure 7—source data 1
Original membranes corresponding to Figure 7A.
- https://cdn.elifesciences.org/articles/94334/elife-94334-fig7-data1-v1.zip
-
Figure 7—source data 2
Original files corresponding to Figure 7A.
- https://cdn.elifesciences.org/articles/94334/elife-94334-fig7-data2-v1.zip
-
Figure 7—source data 3
Original membranes corresponding to Figure 7C.
- https://cdn.elifesciences.org/articles/94334/elife-94334-fig7-data3-v1.zip
-
Figure 7—source data 4
Original files corresponding to Figure 7C.
- https://cdn.elifesciences.org/articles/94334/elife-94334-fig7-data4-v1.zip
Figure 7—figure supplement 1
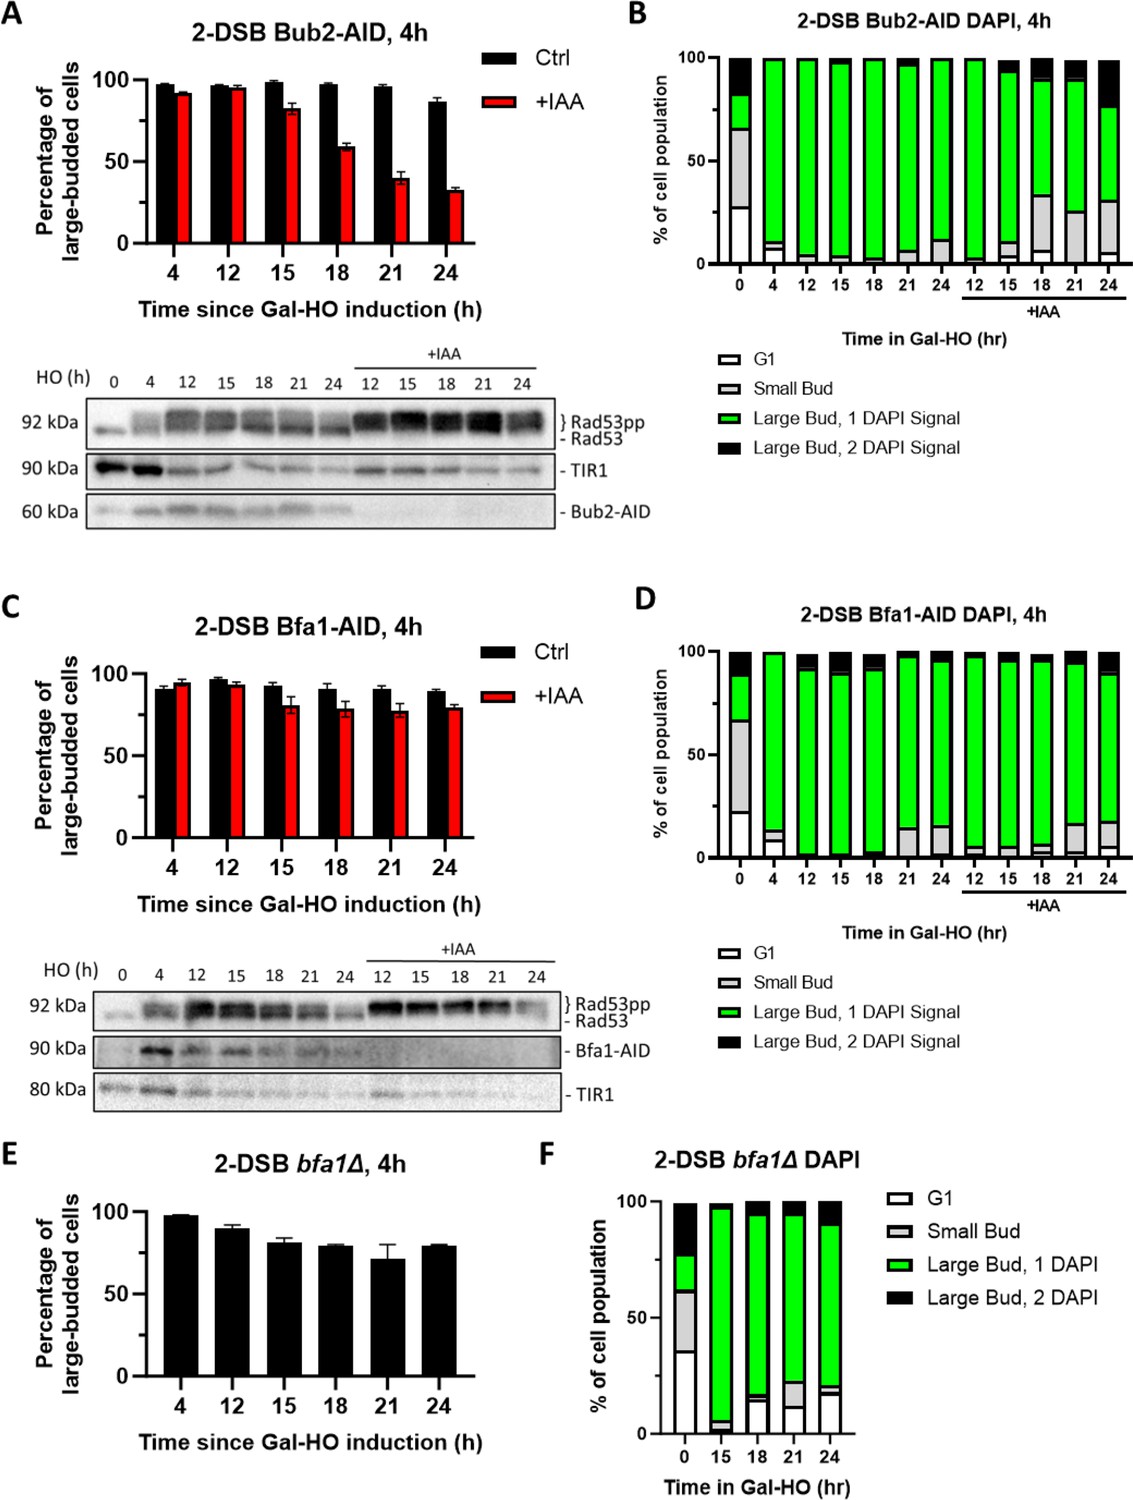
Bub2 but not Bfa1 is required for prolonged arrest.
(A) Morphological profile of a 2-DSB BUB2-AID strain with the auxin-Gal plating assay. Cultures were added onto YEP-Gal ± IAA plates 4 hr after HO induction. Western blot probed with α-Rad53 and α-Myc. α-Rad53 shows both an unphosphorylated protein and multiple phosphorylated species. α-Myc shows Bub2-AID degradation and TIR1-Myc as a loading control. (B) Profile of DAPI-stained cells in a 2-DSB BUB2-AID strain after HO induction. Cultures were split 15 hr after HO induction and treated with either IAA or ethanol. Cells were divided based on cell morphology and number of DAPI signals. (C) Same as (A) for a 2-DSB BFA1-AID strain. (D) Same as (B) for a 2-DSB BFA1-AID strain. (E) Same as (A) for a 2-DSB bfa1∆ strain. (F) Same as (B) for 2-DSB bfa1∆ strain.
-
Figure 7—figure supplement 1—source data 1
Original membranes corresponding to Figure 7—figure supplement 1A.
- https://cdn.elifesciences.org/articles/94334/elife-94334-fig7-figsupp1-data1-v1.zip
-
Figure 7—figure supplement 1—source data 2
Original files corresponding to Figure 7—figure supplement 1A.
- https://cdn.elifesciences.org/articles/94334/elife-94334-fig7-figsupp1-data2-v1.zip
-
Figure 7—figure supplement 1—source data 3
Original membranes corresponding to Figure 7—figure supplement 1C.
- https://cdn.elifesciences.org/articles/94334/elife-94334-fig7-figsupp1-data3-v1.zip
-
Figure 7—figure supplement 1—source data 4
Original files corresponding to Figure 7—figure supplement 1C.
- https://cdn.elifesciences.org/articles/94334/elife-94334-fig7-figsupp1-data4-v1.zip
Figure 8
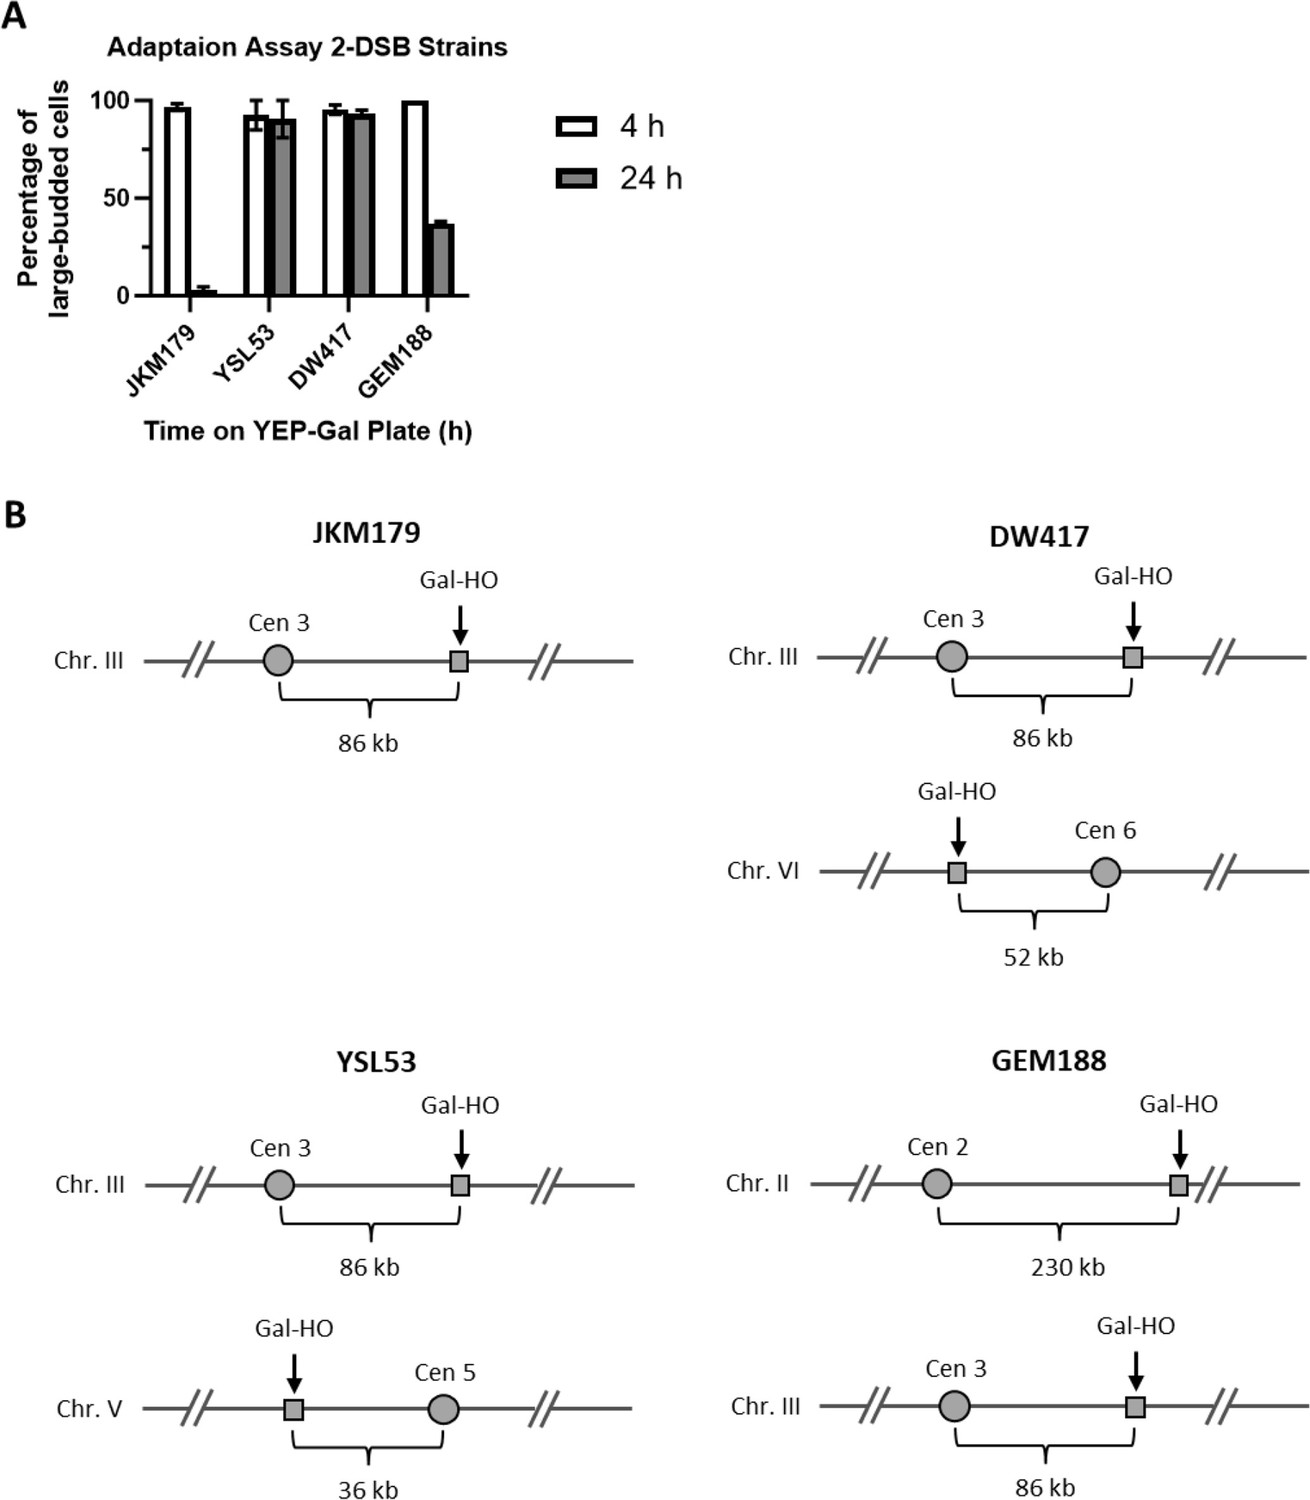
Adaptation assay of different 2-DSB strains.
(A) Adaptation assay of 1-DSB and 2-DSB strains tracking the morphology of 50 G1 cells on a YEP-Gal plate. The percentage of G2/M-arrested cells was shown 4 hr and 24 hr after placement of YEP-Gal plates. JKM179 is a 1-DSB strain with an HO-cut site in the MAT locus on chromosome III 86 kb away from the centromere. DW417 is a 2-DSB strain derived from JKM179 with an additional HO-cut site on chromosome VI 52 kb away from the centromere. YSL53 is a 2-DSB strain derived from JKM179 with an additional HO-cut site at the URA3 locus on chromosome V 36 kb away from the centromere (Lee et al., 1998). GEM188 is a 2-DSB strain derived from JKM179 with an additional HO-cut site at LYS2 on chromosome II 230 kb away from the centromere. (B) Cartoon representations of strains showing the location of the HO-cut sites relative to their respective centromeres.
Figure 9
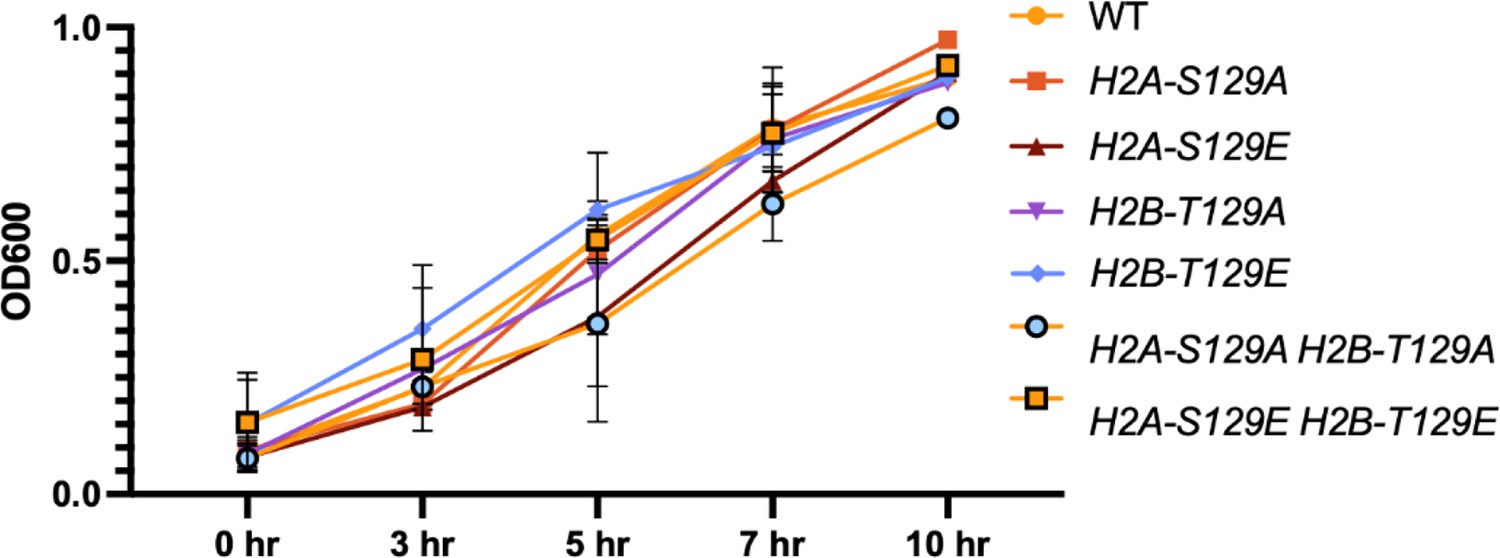
Phosphomimetic and non-phosphorylatable mutants of histone H2A and H2B do not affect the growth rate of cells.
Growth rate of strains were measured in YPD (2% dextrose) in H2A and H2B mutants for up to 10 hr. Cultures were grown in YPD until they reached an OD600 of 0.1. The OD of each strain was then measured at 3, 5, 7, and 10 hr.
Figure 10
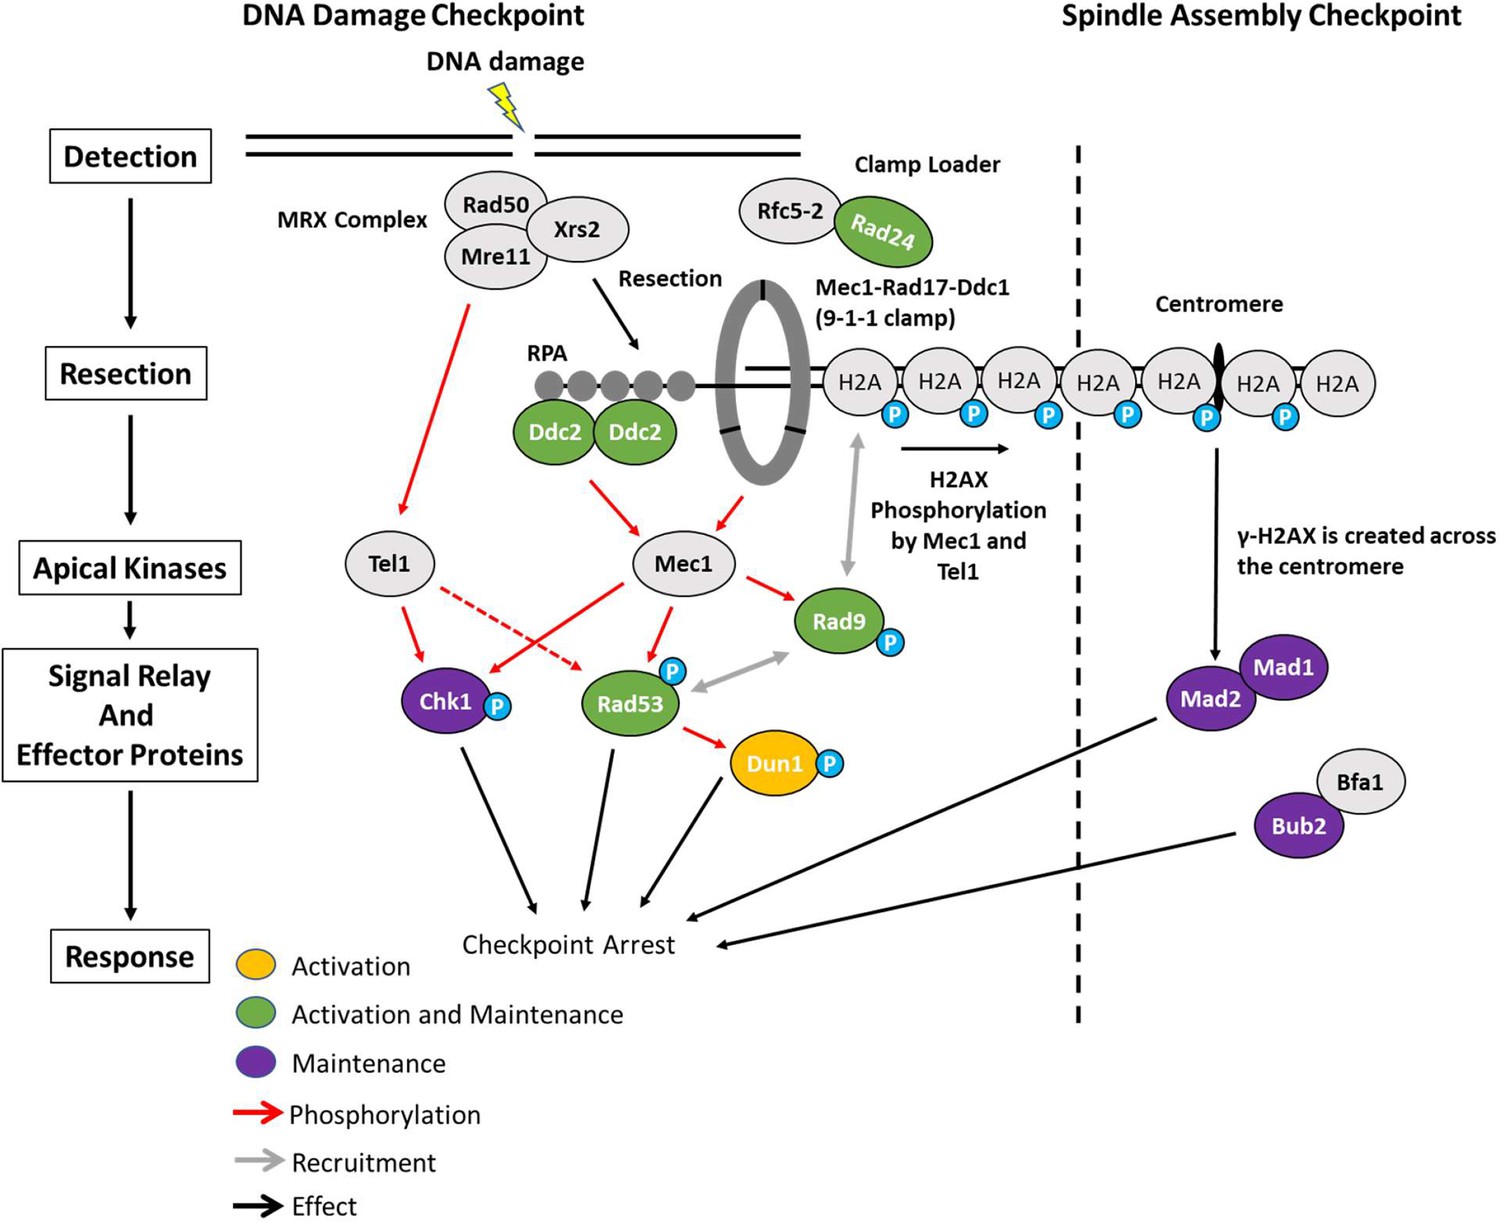
Activation and maintenance of checkpoint arrest in response to a DSB.
The Mre11-Rad50-Xrs2 (MRX) complex is one of the first complexes recruited to DSBs and initiates the resection of dsDNA to ssDNA. ssDNA is then coated with RPA which recruits Ddc2. Mec1 is the primary kinase responsible for checkpoint arrest in budding yeast and is activated by Ddc2 and Ddc1 from the 9-1-1 clamp. Proteins in green (Ddc2, Rad9, Rad24, and Rad53) were required for the activation and maintenance of checkpoint arrest. While Chk1 was not required for establishment of G2/M arrest, it contributed to the maintenance of arrest. In contrast, Dun1 was required for checkpoint activation but was dispensable 4 hr after DSB induction. Prolonged arrest >24 hr in a 2-DSB strain was dependent on the SAC proteins Mad2, Mad1, and Bub2 as well as the distance between the second HO-cut site and the centromere.
Tables
Table 1
Comparison of the percentage of large-budded cells back to baseline levels.
| Figure | Strain | Timepoint comparison* | p-Value | Significance | Post hoc test† |
|---|---|---|---|---|---|
| Figure 2A | DDC2-AID | 0 vs 5 + IAA | <0.0001 | **** | Sidak |
| 0 vs 6 + IAA | <0.0001 | **** | Sidak | ||
| 0 vs 7 + IAA | <0.0001 | **** | Sidak | ||
| 0 vs 8 + IAA | 0.0009 | *** | Sidak | ||
| 0 vs 9 + IAA | 0.054 | ns | Sidak | ||
| Figure 3D | DDC2-AID CHK1∆ | 0 vs 5 + IAA | <0.0001 | **** | Sidak |
| 0 vs 6 + IAA | <0.0001 | **** | Sidak | ||
| 0 vs 7 + IAA | 0.10 | ns | Sidak | ||
| 0 vs 8 + IAA | 0.25 | ns | Sidak | ||
| 0 vs 9 + IAA | 0.072 | ns | Sidak | ||
| Figure 2B | RAD9-AID | 0 vs 5 + IAA | <0.0001 | **** | Sidak |
| 0 vs 6 + IAA | <0.0001 | **** | Sidak | ||
| 0 vs 7 + IAA | <0.0001 | **** | Sidak | ||
| 0 vs 8 + IAA | 0.0055 | ** | Sidak | ||
| 0 vs 9 + IAA | 1.00 | ns | Sidak | ||
| Figure 3E | RAD9-AID CHK1∆ | 0 vs 5 + IAA | 0.00050 | *** | Sidak |
| 0 vs 6 + IAA | 0.0052 | ** | Sidak | ||
| 0 vs 7 + IAA | 0.21 | ns | Sidak | ||
| Figure 2C | RAD24-AID | 0 vs 5 + IAA | <0.0001 | **** | Sidak |
| 0 vs 6 + IAA | <0.0001 | **** | Sidak | ||
| 0 vs 7 + IAA | 0.00 | *** | Sidak | ||
| 0 vs 8 + IAA | 0.36 | ns | Sidak | ||
| 0 vs 9 + IAA | 0.90 | ns | Sidak | ||
| Figure 3F | RAD24-AID CHK1∆ | 0 vs 5 + IAA | 0.00010 | *** | Sidak |
| 0 vs 6 + IAA | 0.00020 | *** | Sidak | ||
| 0 vs 7 + IAA | 0.10 | ns | Sidak | ||
| Figure 5D | RAD53-AID TIR1(F74G) | 18 vs 18 + IAA | 0.35 | ns | Sidak |
| 21 vs 21 + IAA | 0.96 | ns | Sidak | ||
| 24 vs 24 + IAA | 0.42 | ns | Sidak | ||
| Figure 5E | RAD9-AID pRAD9-AID | 18 vs 18 + IAA | 0.80 | ns | Sidak |
| 21 vs 21 + IAA | 0.99 | ns | Sidak | ||
| 24 vs 24 + IAA | 0.84 | ns | Sidak | ||
| Figure 6—figure supplement 3A | DDC2-AID MAD2-AID AND MAD2-AID | 18 + IAA vs 18 + IAA | 0.95 | ns | Sidak |
| 21 + IAA vs 21 + IAA | 0.64 | ns | Sidak | ||
| 24 + IAA vs 24 + IAA | 0.97 | ns | Sidak |
-
*
Timepoints are relative to when galactose was added.
-
†
A one-way ANOVA was used to test for significant differences.
Appendix 1—key resources table
| Reagent type (species) or resource | Designation | Source or reference | Identifiers | Additional information |
|---|---|---|---|---|
| Antibody | Anti-Rad53; (mouse monoclonal) | Abcam | Cat# ab166859; RRID:AB_2801547 | WB (1:1000) |
| Antibody | Anti-Rad53; (rabbit polyclonal) | Abcam | ab104232 | WB (1:1000) |
| Antibody | Anti-Myc; (mouse monoclonal) | Abcam | Cat# ab16918; RRID:AB_30256 | WB (1:1000) |
| Antibody | Anti-Pgk1; (mouse monoclonal) | Abcam | Cat# ab32; RRID:AB_30359 | WB (1:5000) |
| Antibody | Anti-Rad9; (rabbit polyclonal) | Usui et al., 2009 | N/A | WB (1:4000) |
| Antibody | ECL TH Anti-mouse IgG horseradish peroxidase from sheep | GE Healthcare | NXA931V Lot 16937010 | WB (1:10,000) |
| Antibody | ECL TH Anti-rabbit IgG horseradish peroxidase from donkey | GE Healthcare | NA934V lot 6969611 | WB (1:10,000) |
| Chemical compound, drug | Indole-3-acetic acid | Sigma-Aldrich | I3750-25G-A | 1 mM |
| Chemical compound, drug | 5-Ph-IAA | Sigma-Aldrich | SML3574-25MG | 1 µM |
| Chemical compound, drug | Formaldehyde | Sigma-Aldrich | 47608 | 4% |
| Chemical compound, drug | VECTASHIELD Antifade Mounting Medium with DAPI | Vector Laboratories | Cat# H-1200 | 1 μg/ml |
| Chemical compound, drug | Prometheus Protein Biology Products 20–313 OneBlock Western-CL Blocking Buffer, For Chemiluminescent Blots | Genesee Scientific | Cat# 20-313 | Blocking buffer for western blots |
| Commercial assay or kit | ECL Prime Western Blotting System | MilliporeSigma | GERPN2232 | |
| Strain, strain background (Saccharomyces cerevisiae) | cerevisiae: strain background S228c | See Supplementary file 1a for full strain list | N/A | Strains used in this study |
| Strain, strain background (S. cerevisiae) | JKM179 | Lee et al., 1998 | Yeast strain | MATα ade1 leu2-3 lys5 trp1 ::hisG ura3-52 hoΔ hmlΔ::ADE1 hmr Δ::ADE1 ade3:: GAL::HO |
| Strain, strain background (S. cerevisiae) | DW184 | This study | Yeast strain | TIR1-myc6::URA3 |
| Strain, strain background (S. cerevisiae) | DW417 | This study | Yeast strain | HOcse6::HPH TIR1 -myc6::URA3 |
| Strain, strain background (S. cerevisiae) | DW418 | This study | Yeast strain | Ddc2-AID*–9xMyc::KAN |
| Strain, strain background (S. cerevisiae) | DW419 | This study | Yeast strain | Rad9-AID*–9xMyc::KAN |
| Strain, strain background (S. cerevisiae) | DW420 | This study | Yeast strain | Rad24-AID*–9xMyc::KAN |
| Strain, strain background (S. cerevisiae) | DW421 | This study | Yeast strain | Rad53-AID*–9xMyc::KAN |
| Strain, strain background (S. cerevisiae) | DW426 | This study | Yeast strain | chk1∆::NAT |
| Strain, strain background (S. cerevisiae) | DW647 | This study | Yeast strain | Ddc2-AID*–9xMyc::KAN chk1∆::NAT |
| Strain, strain background (S. cerevisiae) | DW427 | This study | Yeast strain | Rad9-AID*–9xMyc::KAN chk1∆::NAT |
| Strain, strain background (S. cerevisiae) | DW428 | This study | Yeast strain | Rad24-AID*–9xMyc::KAN chk1∆::NAT |
| Strain, strain background (S. cerevisiae) | DW429 | This study | Yeast strain | Rad53-AID*–9xMyc::KAN chk1∆::NAT |
| Strain, strain background (S. cerevisiae) | DW625 | This study | Yeast strain | dun1∆::KAN |
| Strain, strain background (S. cerevisiae) | DW626 | This study | Yeast strain | Dun1-AID*–9xMyc::KAN |
| Strain, strain background (S. cerevisiae) | DW641 | This study | Yeast strain | Dun1-AID*–9xMyc::KAN chk1∆::NAT |
| Strain, strain background (S. cerevisiae) | FZ009 | This study | Yeast strain | Mad2*–9xMyc-AID::NAT |
| Strain, strain background (S. cerevisiae) | FZ010 | This study | Yeast strain | Ddc2-AID*–9xMyc ::KAN Mad2*–9xMyc -AID::NAT |
| Strain, strain background (S. cerevisiae) | DW455 | This study | Yeast strain | mad2Δ::KAN |
| Strain, strain background (S. cerevisiae) | GM180 | Memisoglu et al., 2019 | Yeast strain | pGal::Ddc2::LEU2 |
| Strain, strain background (S. cerevisiae) | DW648 | This study | Yeast strain | HOcse6::HPH pGal:: Ddc2::LEU2 |
| Strain, strain background (S. cerevisiae) | DW649 | This study | Yeast strain | HOcse6::HPH pGal:: Ddc2::LEU2 mad2∆::NAT |
| Strain, strain background (S. cerevisiae) | DW642 | This study | Yeast strain | HOcse6::HPH Ddc2-AID*–9xMyc::KAN |
| Strain, strain background (S. cerevisiae) | DW643 | This study | Yeast strain | HOcse6::HPH Rad9-AID*–9xMyc::KAN |
| Strain, strain background (S. cerevisiae) | DW644 | This study | Yeast strain | HOcse6::HPH Rad24-AID*–9xMyc::KAN |
| Strain, strain background (S. cerevisiae) | DW645 | This study | Yeast strain | HOcse6::HPH Rad53-AID*–9xMyc::KAN |
| Strain, strain background (S. cerevisiae) | DW650 | This study | Yeast strain | pGal::Ddc2::LEU2 mad2∆::NAT |
| Strain, strain background (S. cerevisiae) | GM539 | Memisoglu et al., 2019 | Yeast strain | Ddc2-9xMyc::KAN |
| Strain, strain background (S. cerevisiae) | FZ001 | This study | Yeast strain | MATα HOcse6::HPH |
| Strain, strain background (S. cerevisiae) | JY542 | This study | Yeast strain | HOcse6::HPH tel1∆::KAN |
| Strain, strain background (S. cerevisiae) | FZ024 | This study | Yeast strain | HOcse6::HPH Rad9-AID*–9xMyc::KAN |
| Strain, strain background (S. cerevisiae) | FZ025 | This study | Yeast strain | HOcse6::HPH Rad24-AID*–9xMyc::KAN |
| Strain, strain background (S. cerevisiae) | FZ026 | This study | Yeast strain | HOcse6::HPH Rad53-AID*–9xMyc::KAN |
| Strain, strain background (S. cerevisiae) | FZ173 | This study | Yeast strain | HOcse6::HPH Rad24-AID*–9xMyc::KAN TIR1(F74G)::URA3 |
| Strain, strain background (S. cerevisiae) | FZ174 | This study | Yeast strain | HOcse6::HPH Rad9-AID*–9xMyc::KAN TIR1(F74G)::URA3 |
| Strain, strain background (S. cerevisiae) | FZ175 | This study | Yeast strain | HOcse6::HPH Rad53-AID*–9xMyc::KAN TIR1(F74G):: URA3 |
| Strain, strain background (S. cerevisiae) | YSL53 | Lee et al., 1998 | Yeast strain | HOcse5::URA3 |
| Strain, strain background (S. cerevisiae) | GEM188 | This study | Yeast strain | HOcse2::LYS2 |
| Strain, strain background (S. cerevisiae) | FZ201 | This study | Yeast strain | Rad9-AID*–9xMyc::KAN pRAD9-AID*–9xMyc |
| Strain, strain background (S. cerevisiae) | FZ155 | This study | Yeast strain | bfa1∆::KAN |
| Strain, strain background (S. cerevisiae) | yMA11 | This study | Yeast strain | H2A-S129A H2B-T129A |
| Strain, strain background (S. cerevisiae) | yMA12 | This study | Yeast strain | H2AS129E H2B-T129E |
| Strain, strain background (S. cerevisiae) | yMA13 | This study | Yeast strain | H2B-T129A |
| Strain, strain background (S. cerevisiae) | yMA14 | This study | Yeast strain | H2B-T129E |
| Strain, strain background (S. cerevisiae) | yBL257 | This study | Yeast strain | H2A-S129E |
| Strain, strain background (S. cerevisiae) | yBL259 | This study | Yeast strain | H2A-S129A |
| Strain, strain background (S. cerevisiae) | FZ062 | This study | Yeast strain | Mad1*–9xMyc-AID::NAT |
| Strain, strain background (S. cerevisiae) | FZ165 | This study | Yeast strain | Bfa1*–9xMyc-AID::NAT |
| Strain, strain background (S. cerevisiae) | FZ167 | This study | Yeast strain | Bub2*–9xMyc-AID::NAT |
| Sequence-based reagent | GAT1p1B | This paper | PCR primers | GCTCAGTGTGCGTTATGCTT |
| Sequence-based reagent | GAT1p2B | This paper | PCR primers | TTCAGGTCTCGGTTGCTCTT |
| Sequence-based reagent | VE162 Ddc2-AID For | This paper | PCR primers | ATCTAACCACACTAGAGGAGGCCGATTCATTATATATCTCAATGGGACTGCCTAAAGATCCAGCCAAACCTCC |
| Sequence-based reagent | VE163 Ddc2-AID Rev | This paper | PCR primers | ATTACAAGGTTTCTATAAAGCGTTGACATTTTCCCCTTTTGATTGTTGCCCAGTATAGCGACCAGCATTCACATAC |
| Sequence-based reagent | DW217 Rad9-AID 1 F | This paper | PCR primers | GGTTTTCACGATGATATTACGGACAATGATATATACAACACTATTTCTGAGGTTAGACCTAAAGATCCAGCCAAACCTCC |
| Sequence-based reagent | DW218 Rad9-AID 1 R | This paper | PCR primers | CTAAATTTTTTTTTATTTAATCGTCCCTTTCTATCAATTATGAGTTTATATATTTTTATAATTCAGTATAGCGACCAGCATTCACATAC |
| Sequence-based reagent | DW208 Rad24-AID 1 F | This paper | PCR primers | CAGATTCAGATCTGGAAATACTCCCTAAAGATCCAGCCAAACCTCC |
| Sequence-based reagent | DW209 Rad24-AID 1 R | This paper | PCR primers | GTGGAATATTTCCTGGGGTTTTCTCGTCAAATTTAAAGAGTAAAAAGCCTAAAGATCCAGCCAAACCTCC |
| Sequence-based reagent | DW199 Rad53AID 1 F | This paper | PCR primers | GGTTAAAAGGGCAAAATTGGACCAAACCTCAAAAGGCCCCGAGAATTTGCAATTTTCGCCTAAAGATCCAGCCAAACCTCC |
| Sequence-based reagent | DW200 Rad53AID 1 R | This paper | PCR primers | CCATCTTCTCTCTTAAAAAGGGGCAGCATTTTCTATGGGTATTTGTCCTTGGCAGTATAGCGACCAGCATTCACATAC |
| Recombinant DNA reagent | pKan-9xMyc-AID | Morawska and Ulrich, 2013 | pJH2892 | Backbone: pSM409 |
| Recombinant DNA reagent | pNAT-9xMyc-AID | Morawska and Ulrich, 2013 | pJH2899 | Backbone: pSM409 |
| Recombinant DNA reagent | sTIR1::URA3 | Nishimura et al., 2009 | pNHK53 | |
| Recombinant DNA reagent | GAL-DDC2 | Paciotti et al., 2000 | pML100 | Backbone: pML95 |
| Recombinant DNA reagent | ADH1-OsTIR1(F74G) | Yesbolatova et al., 2020 | pMK420 | |
| Recombinant DNA reagent | bRA90 | Anand et al., 2017 | bRA90 | |
| Recombinant DNA reagent | bG059 | This study | bG059 | Backbone: bRA90 |
| Recombinant DNA reagent | bG060 | This study | bG060 | Backbone: bRA90 |
| Recombinant DNA reagent | pRad9-3HA | Lazzaro et al., 2008 | pFL36.1 | Backbone: pRS306 |
| Recombinant DNA reagent | pRad9-9xMyc-AID | This study | pFZ052 | Backbone: pRS306 |
| Recombinant DNA reagent | pBL15 – HTA1 gRNA1 | This study | pBL15 | Backbone: BRA89 |
| Recombinant DNA reagent | pBL16 – HTA2 gRNA2 | This study | pBL16 | Backbone: BRA89 |
| Recombinant DNA reagent | pKL004 – HTB1 gRNA1 | This study | pKL004 | Backbone: BRA89 |
| Recombinant DNA reagent | pKL005 – HTB2 gRNA1 | This study | pKL005 | Backbone: BRA89 |
| Software, algorithm | Prism 7.00 | GraphPad Software, Inc. | N/A | |
| Software, algorithm | Image Lab | Bio-Rad | N/A | |
| Software, algorithm | FiJi | ImageJ | N/A | |
| Gene (S. cerevisiae) | Ddc2 | Saccharomyces Genome Database | Systematic name YDR499W | |
| Gene (S. cerevisiae) | Rad9 | Saccharomyces Genome Database | Systematic name YDR217C | |
| Gene (S. cerevisiae) | Rad24 | Saccharomyces Genome Database | Systematic name YER173W | |
| Gene (S. cerevisiae) | Rad53 | Saccharomyces Genome Database | Systematic name YPL153C | |
| Gene (S. cerevisiae) | Chk1 | Saccharomyces Genome Database | Systematic name YBR274W | |
| Gene (S. cerevisiae) | Dun1 | Saccharomyces Genome Database | Systematic name YDL101C | |
| Gene (S. cerevisiae) | Tel1 | Saccharomyces Genome Database | Systematic name YBL088C | |
| Gene (S. cerevisiae) | Mad2 | Saccharomyces Genome Database | Systematic name YJL030W | |
| Gene (S. cerevisiae) | Mad1 | Saccharomyces Genome Database | Systematic name YGL086W | |
| Gene (S. cerevisiae) | Bub2 | Saccharomyces Genome Database | Systematic name YMR055C | |
| Gene (S. cerevisiae) | Bfa1 | Saccharomyces Genome Database | Systematic name YJR053W |
Additional files
-
Supplementary file 1
Strains and Primers used in this study.
(a) Strains used in this study. (b) Primers used in this study.
- https://cdn.elifesciences.org/articles/94334/elife-94334-supp1-v1.docx
-
MDAR checklist
- https://cdn.elifesciences.org/articles/94334/elife-94334-mdarchecklist1-v1.pdf
Download links
A two-part list of links to download the article, or parts of the article, in various formats.
Downloads (link to download the article as PDF)
Open citations (links to open the citations from this article in various online reference manager services)
Cite this article (links to download the citations from this article in formats compatible with various reference manager tools)
Prolonged cell cycle arrest in response to DNA damage in yeast requires the maintenance of DNA damage signaling and the spindle assembly checkpoint
eLife 13:RP94334.
https://doi.org/10.7554/eLife.94334.3


