The non-mitotic role of HMMR in regulating the localization of TPX2 and the dynamics of microtubules in neurons
- Institute of Molecular Medicine and Bioengineering, National Yang Ming Chiao Tung University, Taiwan
- Department of Orthopedic Surgery, Changhua Christian Hospital, Taiwan
- Department of Biological Science and Technology, National Yang Ming Chiao Tung University, Taiwan
- Institute of Bioinformatics and Systems Biology, National Yang Ming Chiao Tung University, Taiwan
- Center for Intelligent Drug Systems and Smart Bio-devices (IDS2B), National Yang Ming Chiao Tung University, Taiwan
Figures
Figure 1 with 1 supplement
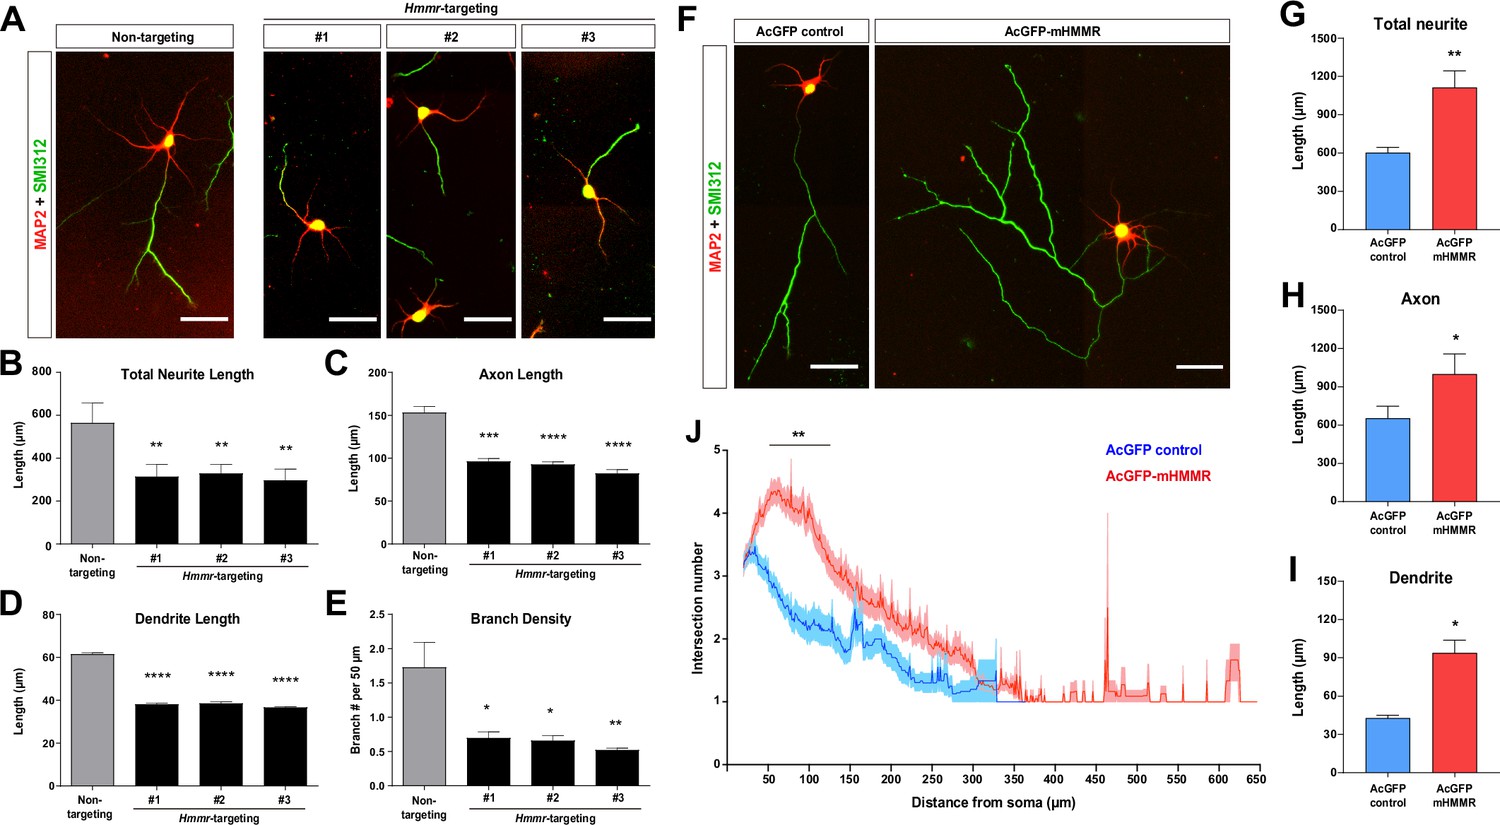
Hyaluronan-mediated motility receptor (HMMR) promotes neuronal morphogenesis.
(A) Representative images of hippocampal neurons co-transfected with the EGFP-expressing and the indicated shRNA-expressing plasmids on 0 DIV and fixed on 4 DIV. Neurons were immunofluorescence stained with the dendrite marker MAP2 and the axon marker SMI312 (top). Quantification of (B) total neurite length per neuron, (C) axon length, (D) dendrite length, and (E) axon branch density (i.e. branch number per 50 µm of axon). *p<0.05, **p<0.01, ***p<0.001, ****p<0.0001, one-way ANOVA followed by Dunnett’s post-hoc test. More than 20 neurons were analyzed per condition per repeat. (F) Representative images of hippocampal neurons transfected with AcGFP- or AcGFP-mHMMR-expressing plasmid on 0 DIV and fixed on 3 DIV. Neurons were immunofluorescence stained with the dendrite marker MAP2 and the axon marker SMI312. Quantification of (G) total neurite length per neuron, (H) axon length per neuron, and (I) dendrite length per neuron. *p<0.05, **p<0.01, two-tailed Student’s t-test. More than 50 neurons were analyzed per condition per repeat. (J) Sholl analysis of the axon branching complexity. **p<0.01, two-way ANOVA followed by Sidak’s post-hoc tests. The solid line and shaded area indicate mean and SEM collected from three independent repetitions (more than 50 neurons were analyzed per condition per repetition). All scale bars present 50 µm and all bar graphs are expressed as mean ± SEM from three independent repetitions.
Figure 1—figure supplement 1
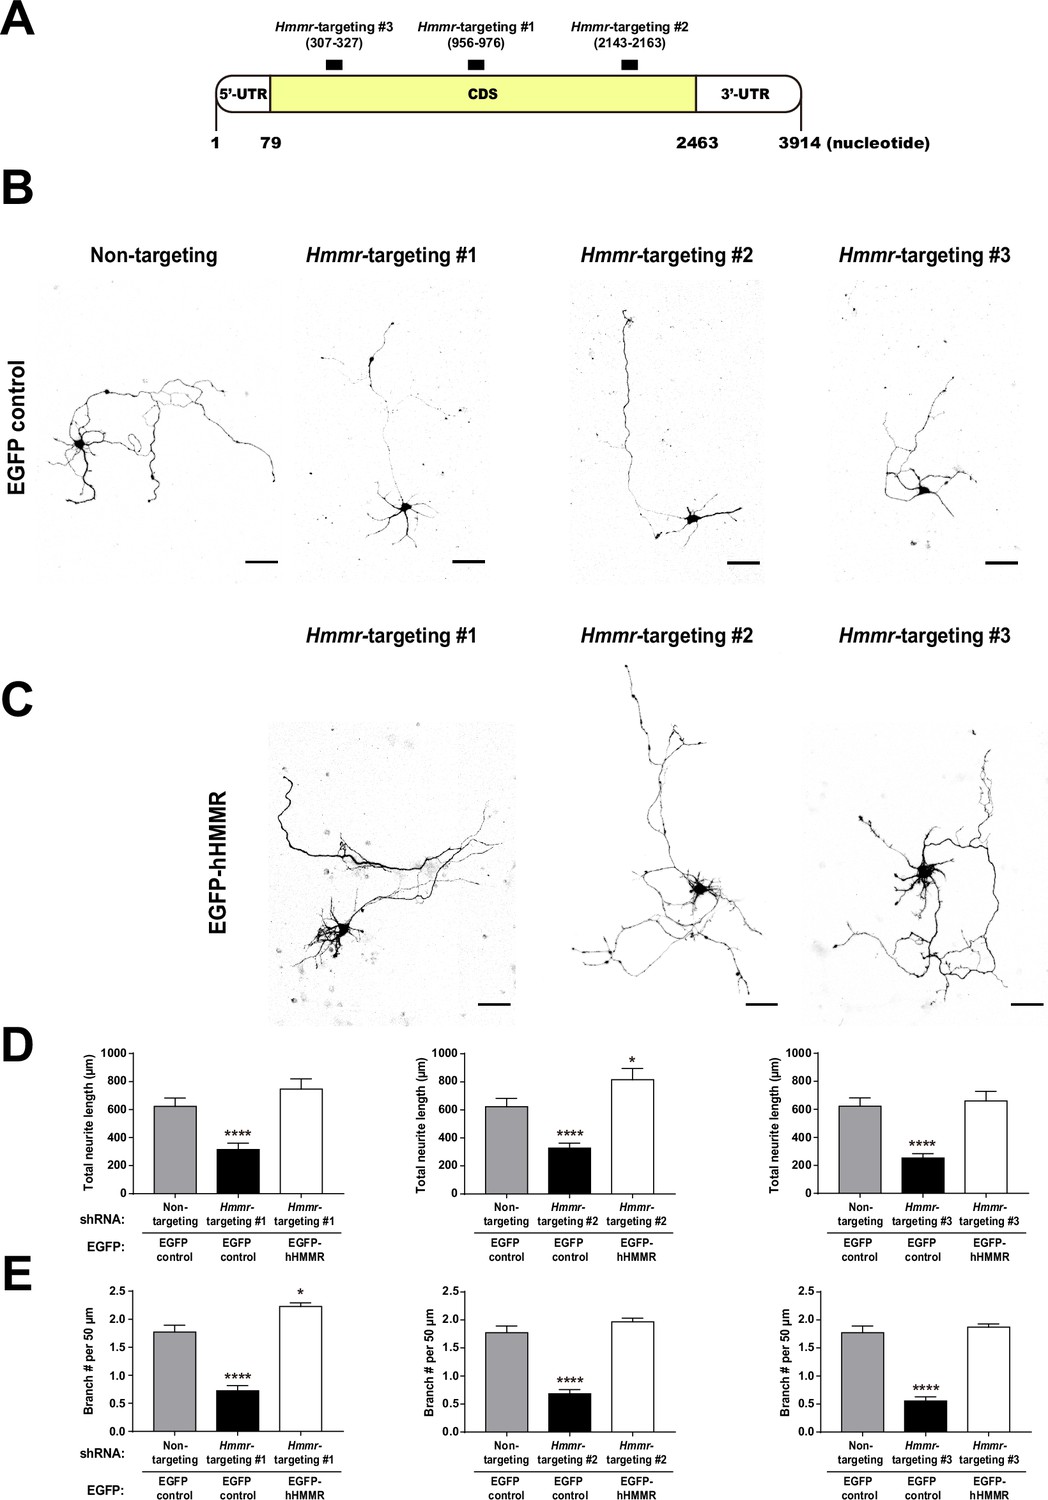
Overexpressing human hyaluronan-mediated motility receptor (HMMR) rescues the effect of HMMR depletion in mouse neurons.
(A) Schematic representation of shRNA targeting regions of the mouse Hmmr mRNA. The untranslated regions (UTR) are shown in white and the coding sequence (CDS) in yellow. Black bars indicate shRNA targeting regions and the mRNA is numbered by the nucleotide sequence. Representative EGFP images of mouse hippocampal neurons co-transfected with the indicated shRNA- and the control cytosolic EGFP- (B) or EGFP-hHMMR (C) expressing plasmids on 2 DIV and fixed on 5 DIV. Images are inverted to improve visualization. The scale bars present 50 μm. Quantification of (D) total neurite length per neuron and (E) normalized branch density (branch number in 50 µm of neurite) for neurons shown in panel B-C. *p<0.05; ****p<0.0001, one-way ANOVA followed by Dunnett’s post-hoc test. All bar graphs are expressed as mean ± SEM from three independent repetitions. More than 50 neurons were analyzed per condition per repeat.
Figure 2 with 3 supplements
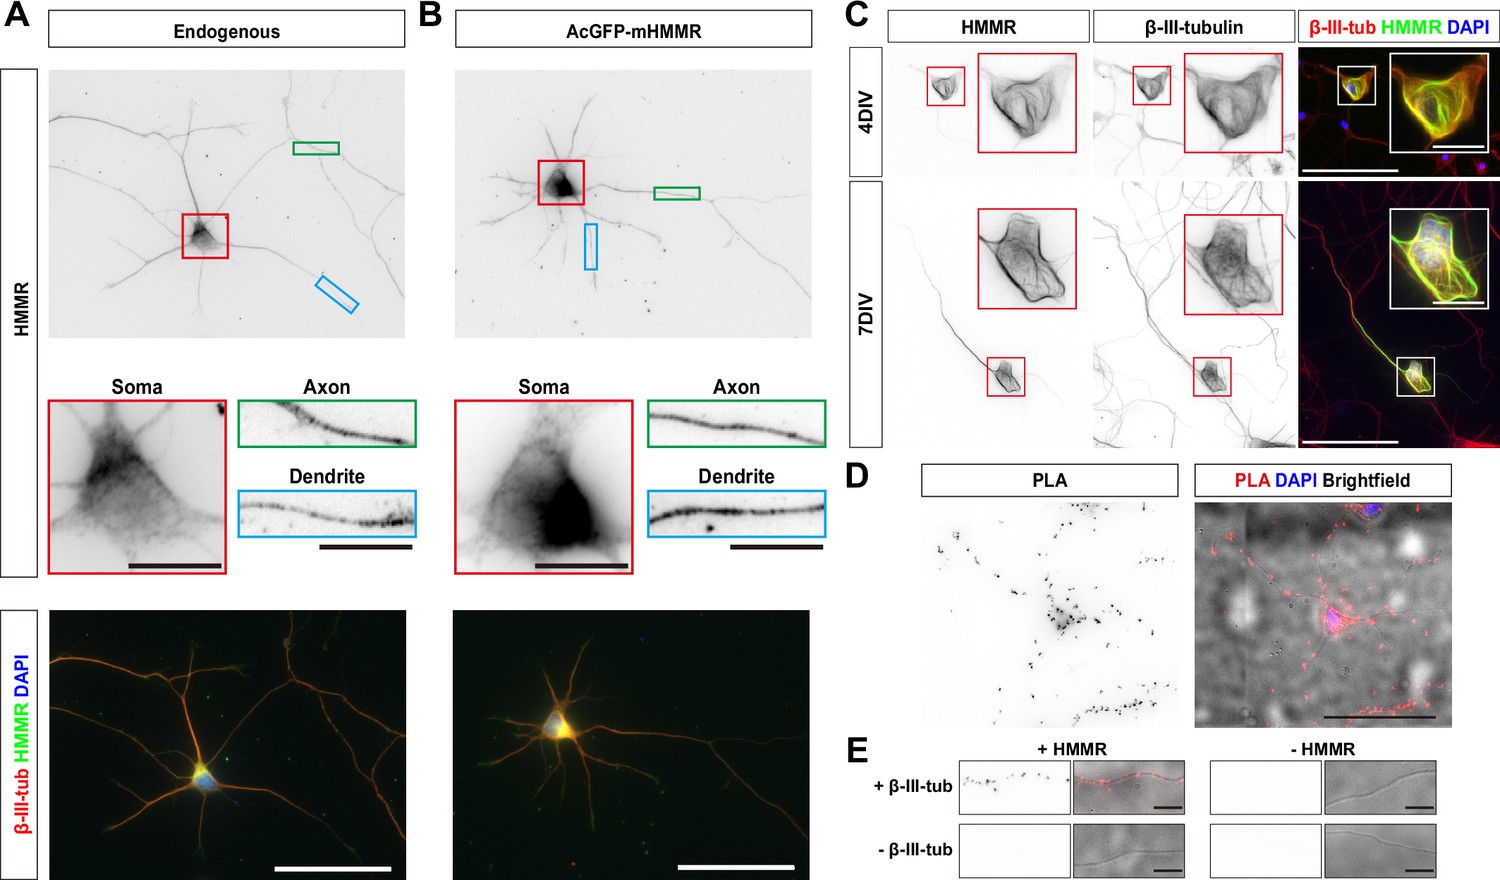
Hyaluronan-mediated motility receptor (HMMR) localizes to the microtubules in neurons.
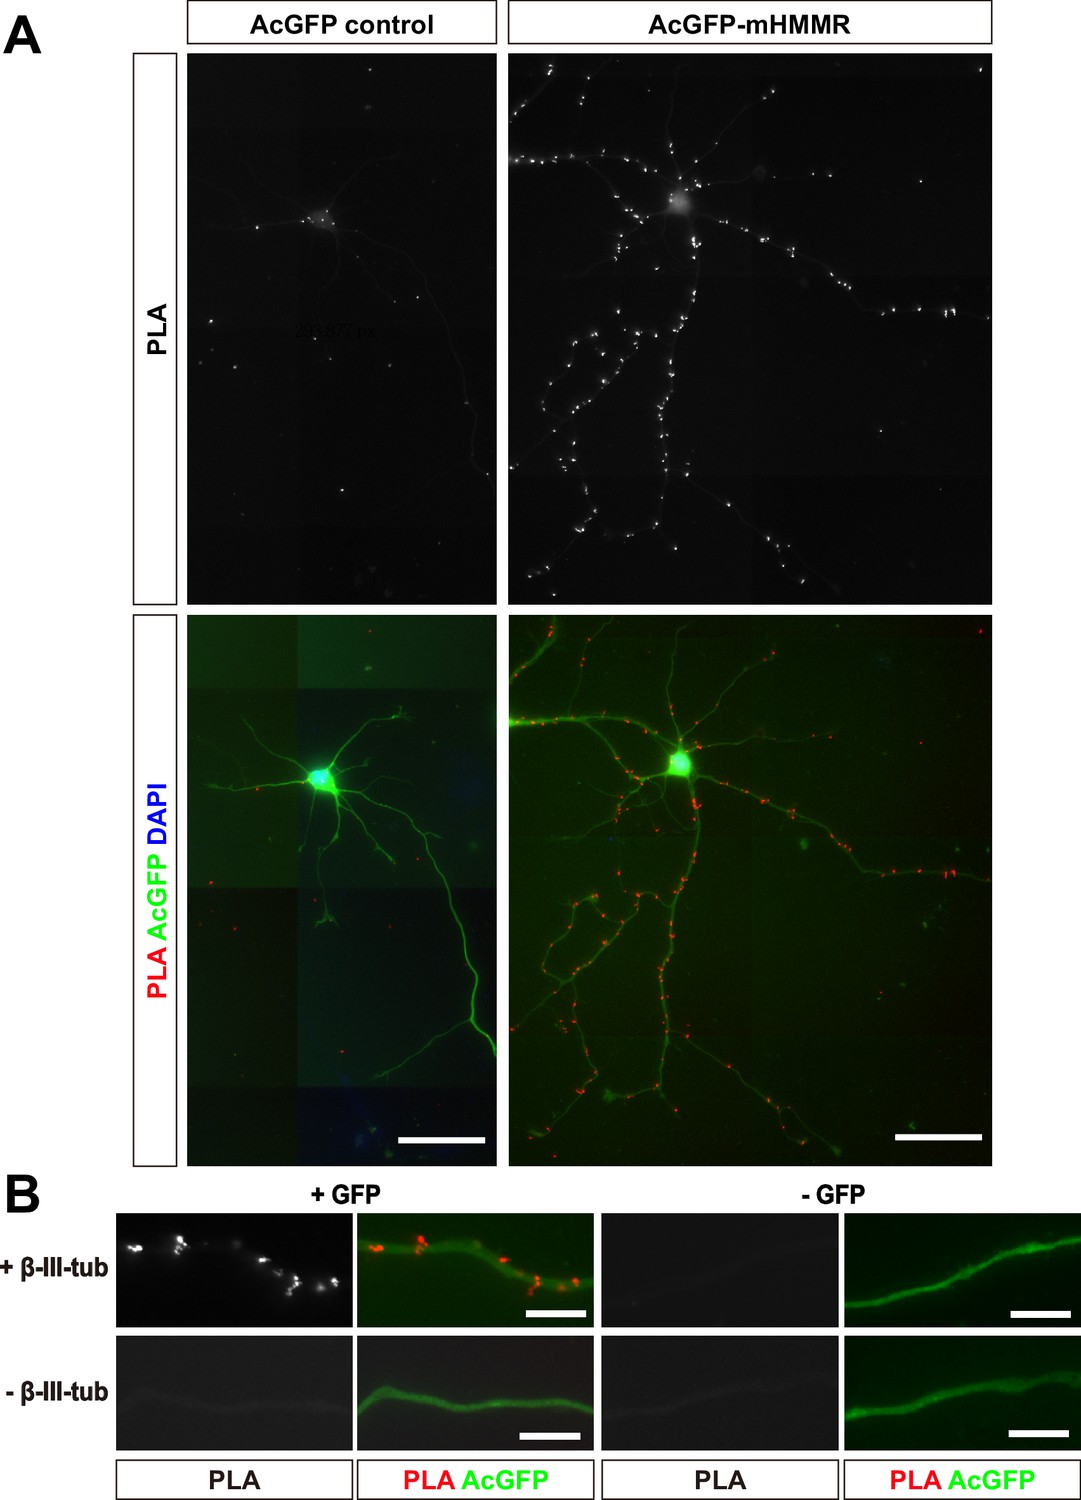
(A) Representative images of 3 DIV mouse hippocampal neurons immunofluorescence stained with antibodies against HMMR (green) and β-III-tubulin (red). Nuclei are visualized using DAPI (blue). HMMR images were inverted to improve visualization. (B) Representative images of 3 DIV mouse hippocampal neurons expressing AcGFP-mHMMR. Neurons were fixed and immunofluorescence stained with the antibody against β-III-tubulin (red). Nuclei are visualized using DAPI (blue). AcGFP-mHMMR images were inverted to improve visualization. Colored boxes indicate the magnified regions. The scale bars represent 10 μm and 50 μm in the colored boxes and the merged images, respectively. More than 50 neurons were observed for each condition, and HMMR exhibits similar localization in all neurons. (C) Representative images of 4 DIV (top) and 7 DIV (bottom) hippocampal neurons expressing AcGFP-mHMMR. Neurons were immunofluorescence stained with the β-III-tubulin antibody. AcGFP-mHMMR and β-III-tubulin signals were inverted to improve visualization. Red and white boxes at the soma are magnified in the insets. All images have the same scale and the scale bars present 50 μm. (D) Representative images of proximity ligation assay (PLA) on HMMR and β-III-tubulin in 3 DIV hippocampal neurons. The PLA image was inverted to improve visualization (left). DAPI was used to visualize the nuclei and brightfield microscopy was used to visualize the general appearance of neurons in the merged image (right). The scale bar presents 50 μm. (E) PLA puncta were present along the neurite shaft only when antibodies against HMMR and β-III-tubulin were both present. All images have the same scale and the scale bars represent 10 μm.
Figure 2—figure supplement 1
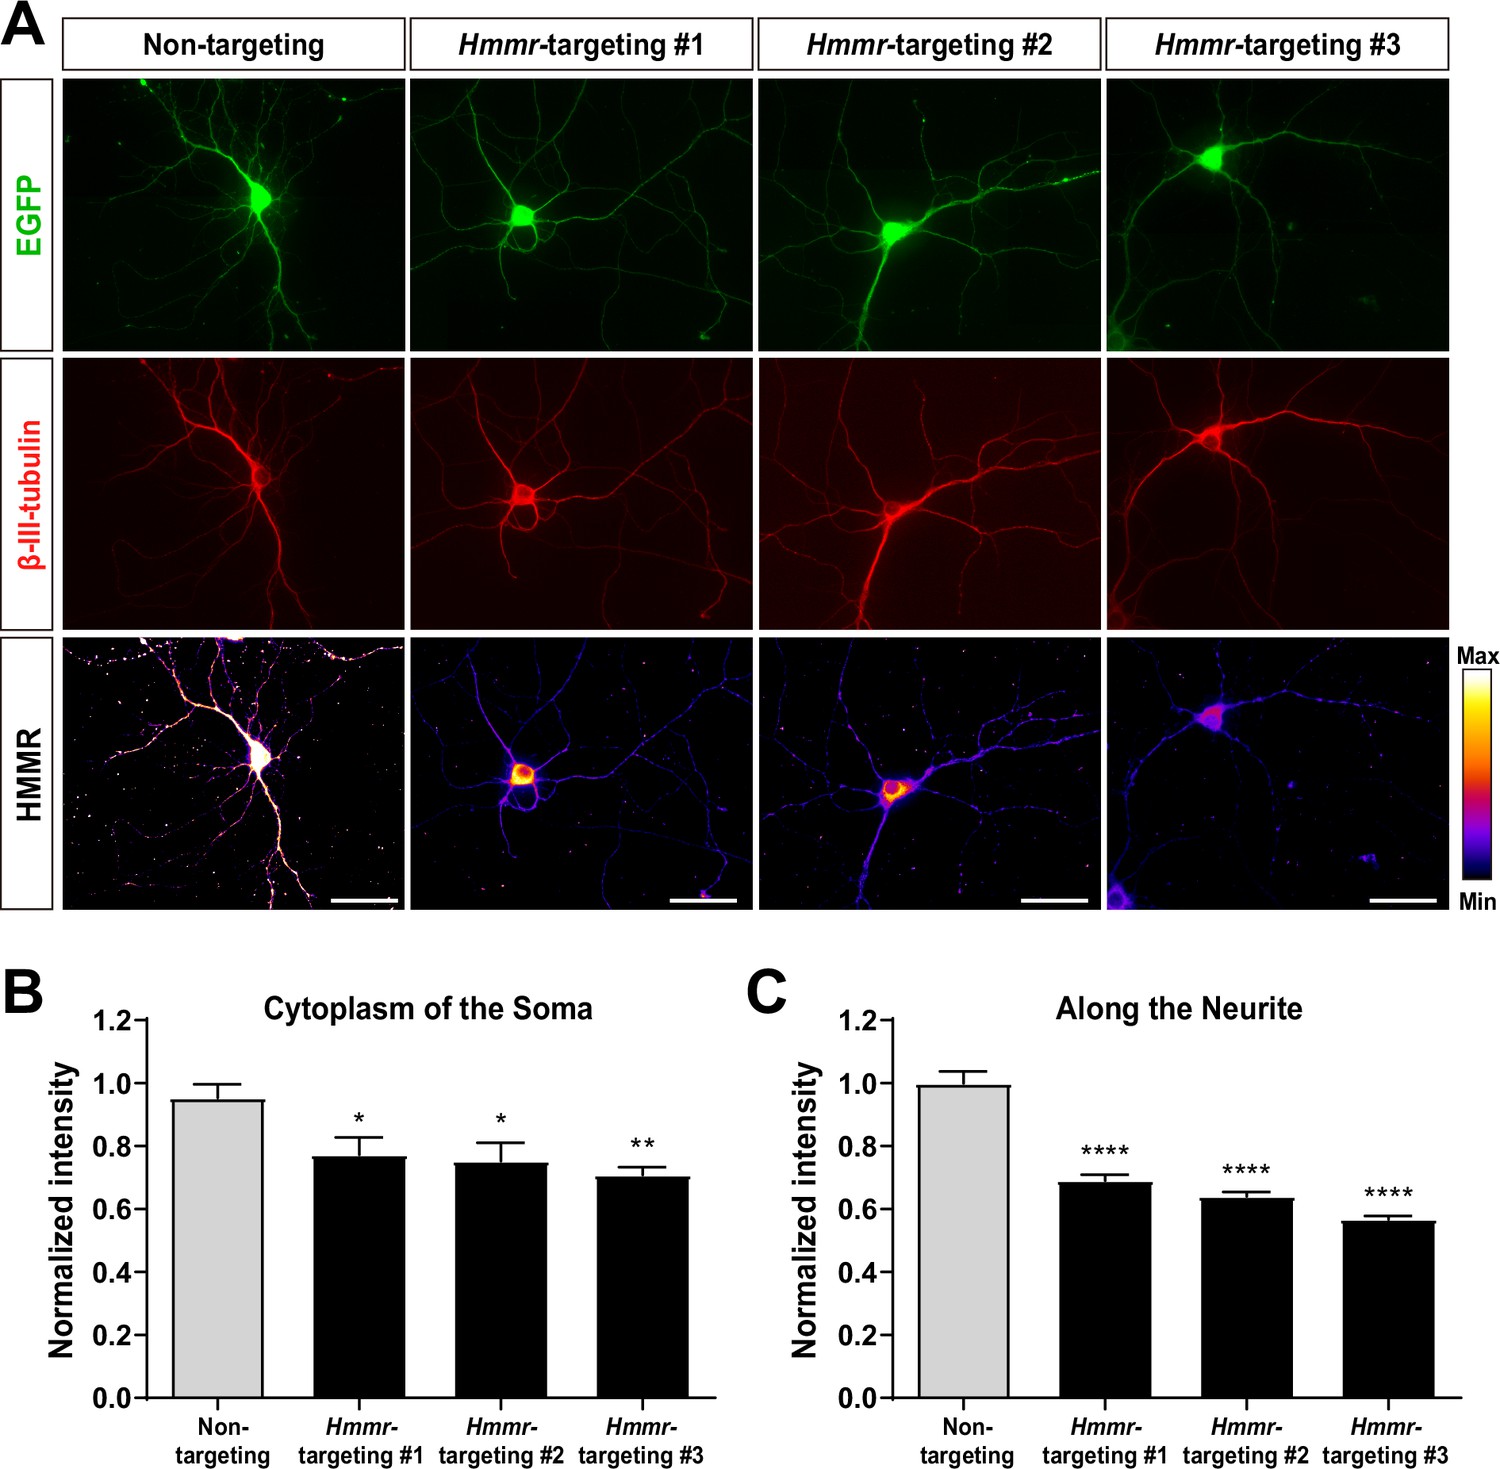
Validation of the hyaluronan-mediated motility receptor (HMMR) antibody.
(A) Representative images of 10 DIV mouse hippocampal neurons co-expressing the indicated Hmmr-targeting shRNA and EGFP. Neurons were immunofluorescence stained with antibodies against β-III-tubulin (red) and HMMR (pseudocolor). All scale bars present 50 μm. Only neurons possessing both β-III-tubulin and EGFP signals were quantified. Quantification of HMMR intensity in the soma (B) and along the neurite (C). *p<0.05; **p<0.01; ****p<0.0001, one-way ANOVA followed by Dunnett’s post-hoc tests. Both bar graphs are expressed as mean ± SEM from three independent repetitions. More than 30 neurons were analyzed per condition per repeat.
Figure 2—figure supplement 2
Transiently expressed AcGFP-mHMMR associates with microtubules in neurons.
Dissociated hippocampal neurons were transfected with AcGFP control (left) or AcGFP-mHMMR (right) on 0 DIV and fixed on 7 DIV. (A) PLA images of AcGFP control (upper left) or AcGFP-mHMMR (upper right) and β-III-tubulin in 7 DIV dissociated hippocampal neurons. Nuclei were visualized using DAPI (blue) and the general appearance of neurons was visualized using the AcGFP signal (green). All images have the same scale and the scale bars present 50 μm. (B) PLA puncta were present along the neurite shaft only when antibodies against AcGFP and β-III-tubulin were both present. All images have the same scale and the scale bars represent 10 μm.
Figure 2—figure supplement 3
Hyaluronan-mediated motility receptor (HMMR) does not colocalize with microtubule plus-ends in neurons.
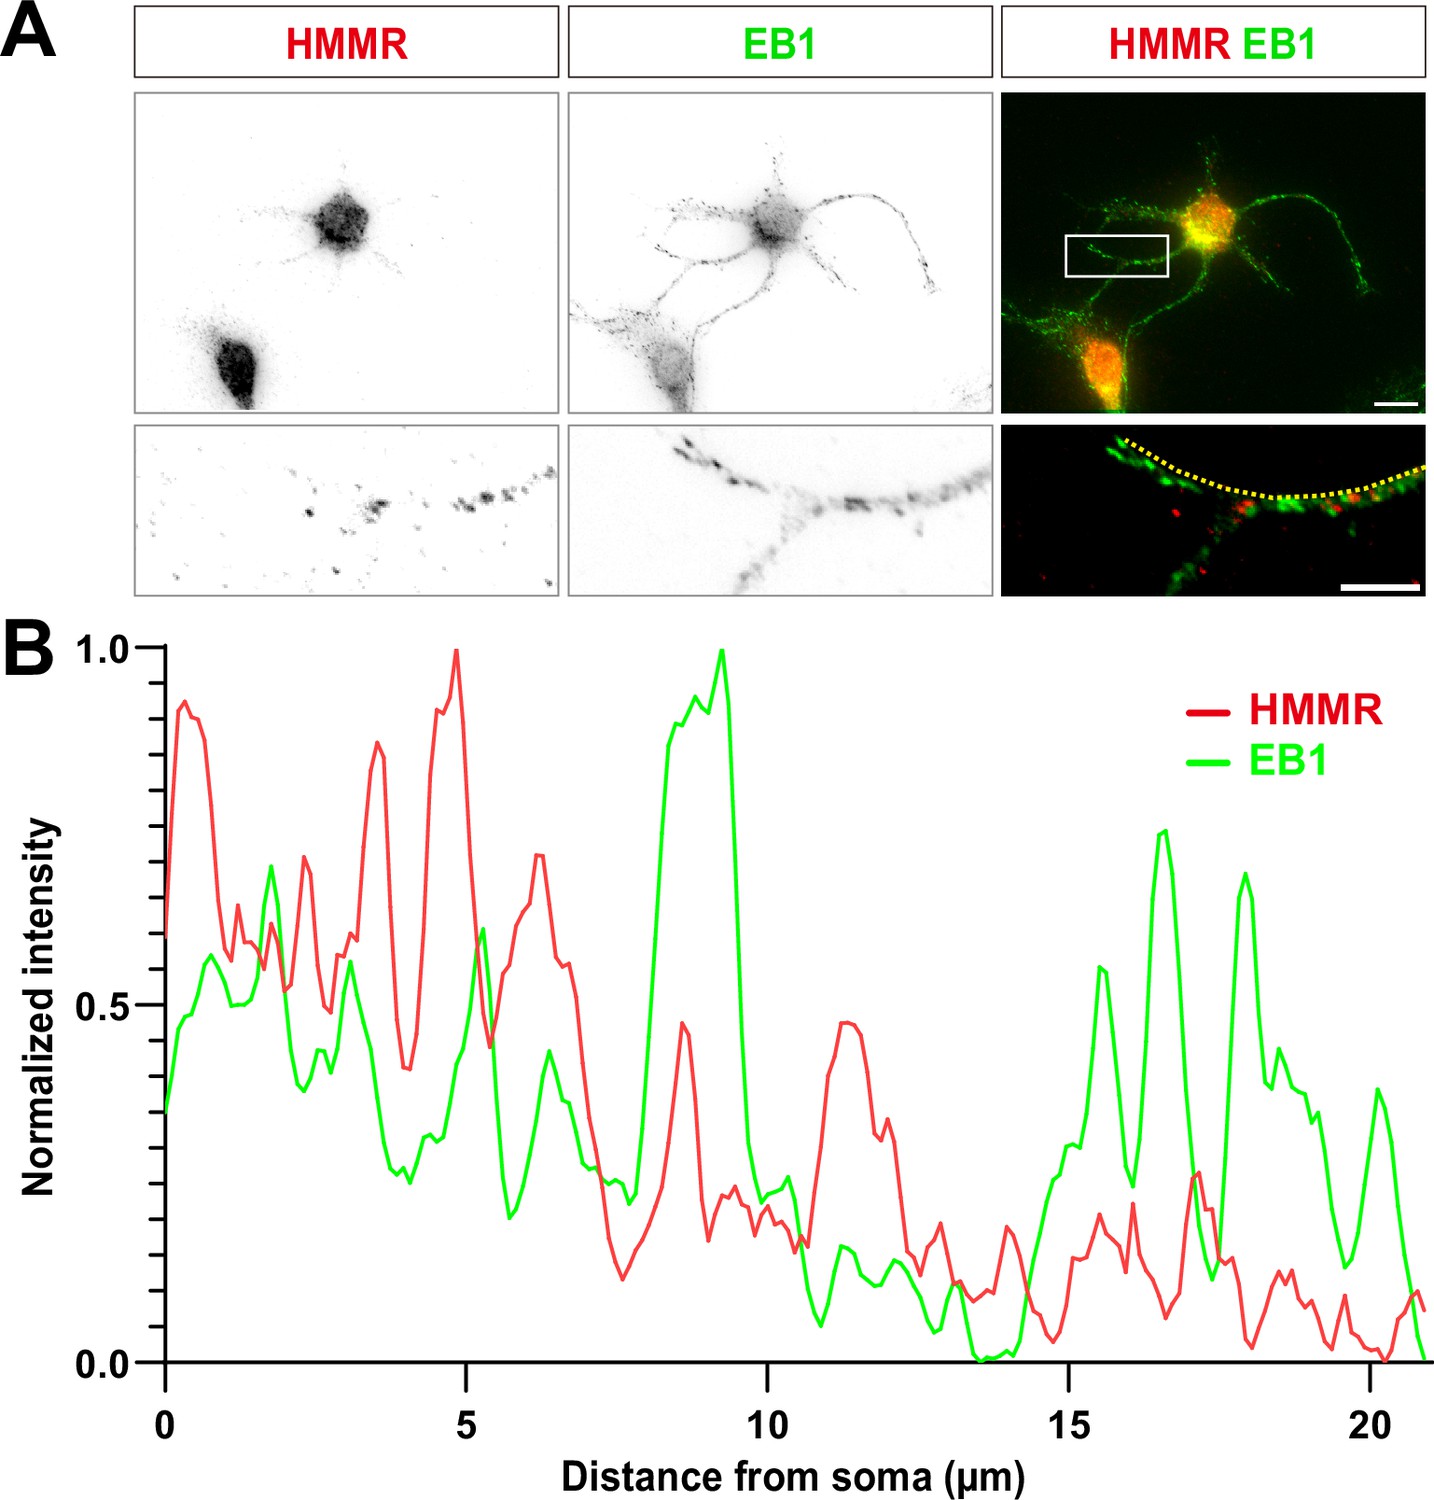
(A) Representative images of a 3 DIV hippocampal neuron immunofluorescence stained with antibodies against HMMR and EB1. The white box in the upper right panel indicates the magnified region shown in lower panels. The scale bars in the upper and lower panels represent 10 μm and 5 μm, respectively. (B) The linescan along the yellow dotted line in the lower right of panel A. The signal intensity of HMMR and EB1 is shown in red and green, respectively. The average Pearson correlation coefficient is 0.28±0.25. More than 300 neurites from three independent repeats were quantified.
Figure 3
Hyaluronan-mediated motility receptor (HMMR) regulates microtubule stability in neurons.
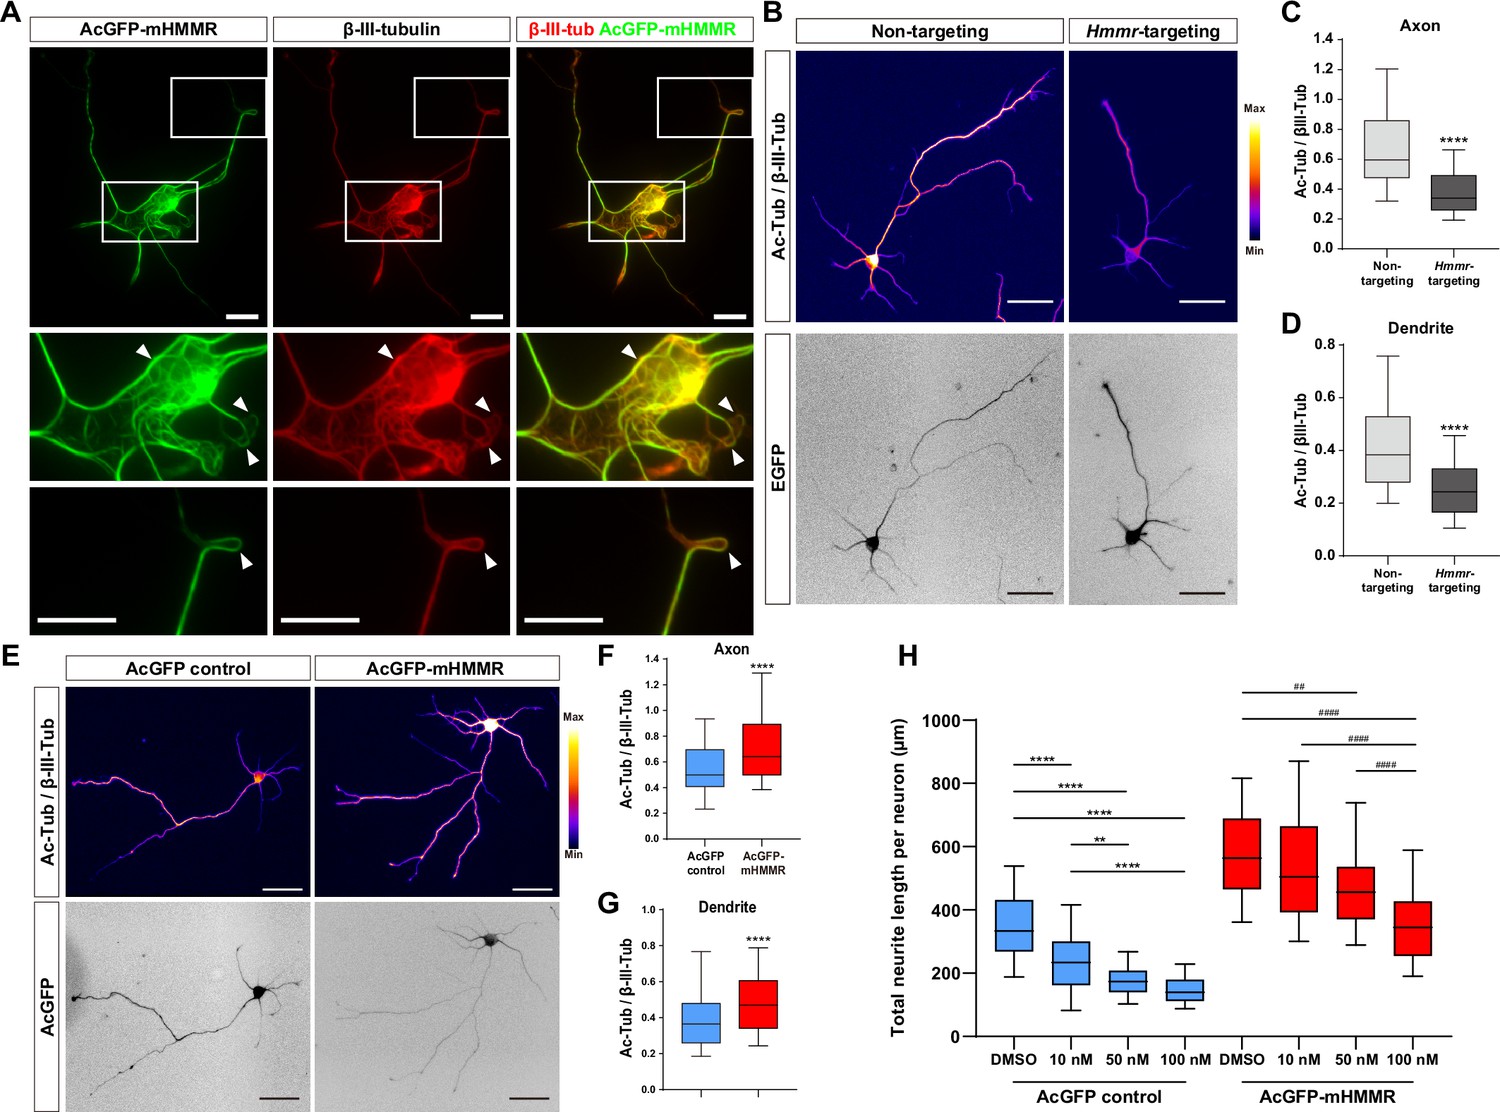
(A) Representative images of 4 DIV hippocampal neurons expressing AcGFP-mHMMR. Neurons were immunofluorescence stained with the antibody against β-III-tubulin. White boxes at the soma and the neurite tip are magnified. Arrowheads indicate looped microtubules. (B) Representative pseudo-colored acetylated-α-tubulin-to-β-III-tubulin ratio images of non-targeting shRNA (top left panel) or Hmmr-targeting shRNA (top right panel) expressing 4 DIV hippocampal neurons. The transfection indicator EGFP signal was inverted to improve visualization (bottom panels). Only neurons possessing both β-III-tubulin and EGFP signals were quantified. Quantification of the acetylated-α-tubulin-to-β-III-tubulin intensity ratio in axon (C) and dendrite (D). ****p<0.0001, two-tailed Mann-Whitney test. (E) Representative pseudo-colored acetylated-α-tubulin-to-β-III-tubulin ratio images of AcGFP-expressing control (top left panel) or AcGFP-mHMMR (top right panel) expressing 3 DIV hippocampal neurons. The AcGFP signal was inverted to improve visualization (bottom panels). Only neurons possessing both β-III-tubulin and AcGFP signals were quantified. Quantification of the acetylated-α-tubulin-to-β-III-tubulin intensity ratio within axon (F) and dendrite (G). **** P<0.0001, two-tailed Mann-Whitney test. (H) Quantification of total neurite length per neuron in AcGFP- or AcGFP-mHMMR expressing 3 DIV hippocampal neurons treated with or without the indicated concentration of nocodazole for 2 days. **p<0.01, **** P<0.0001, Kruskal-Wallis test followed by Dunn’s post-hoc tests within the AcGFP expressing group. ##p<0.01, ####p<0.0001, Kruskal-Wallis test followed by Dunn’s post-hoc tests within the AcGFP-mHMMR expressing group. All box plots are expressed as first quartile, median, and third quartile with whiskers extending to 5–95 percentile. More than 90 neurons were analyzed per condition per repeat. Scale bars represent 20 µm in (A) and 50 µm in (B) and (E).
Figure 4
Hyaluronan-mediated motility receptor (HMMR) regulates the dynamics of neuronal microtubules.
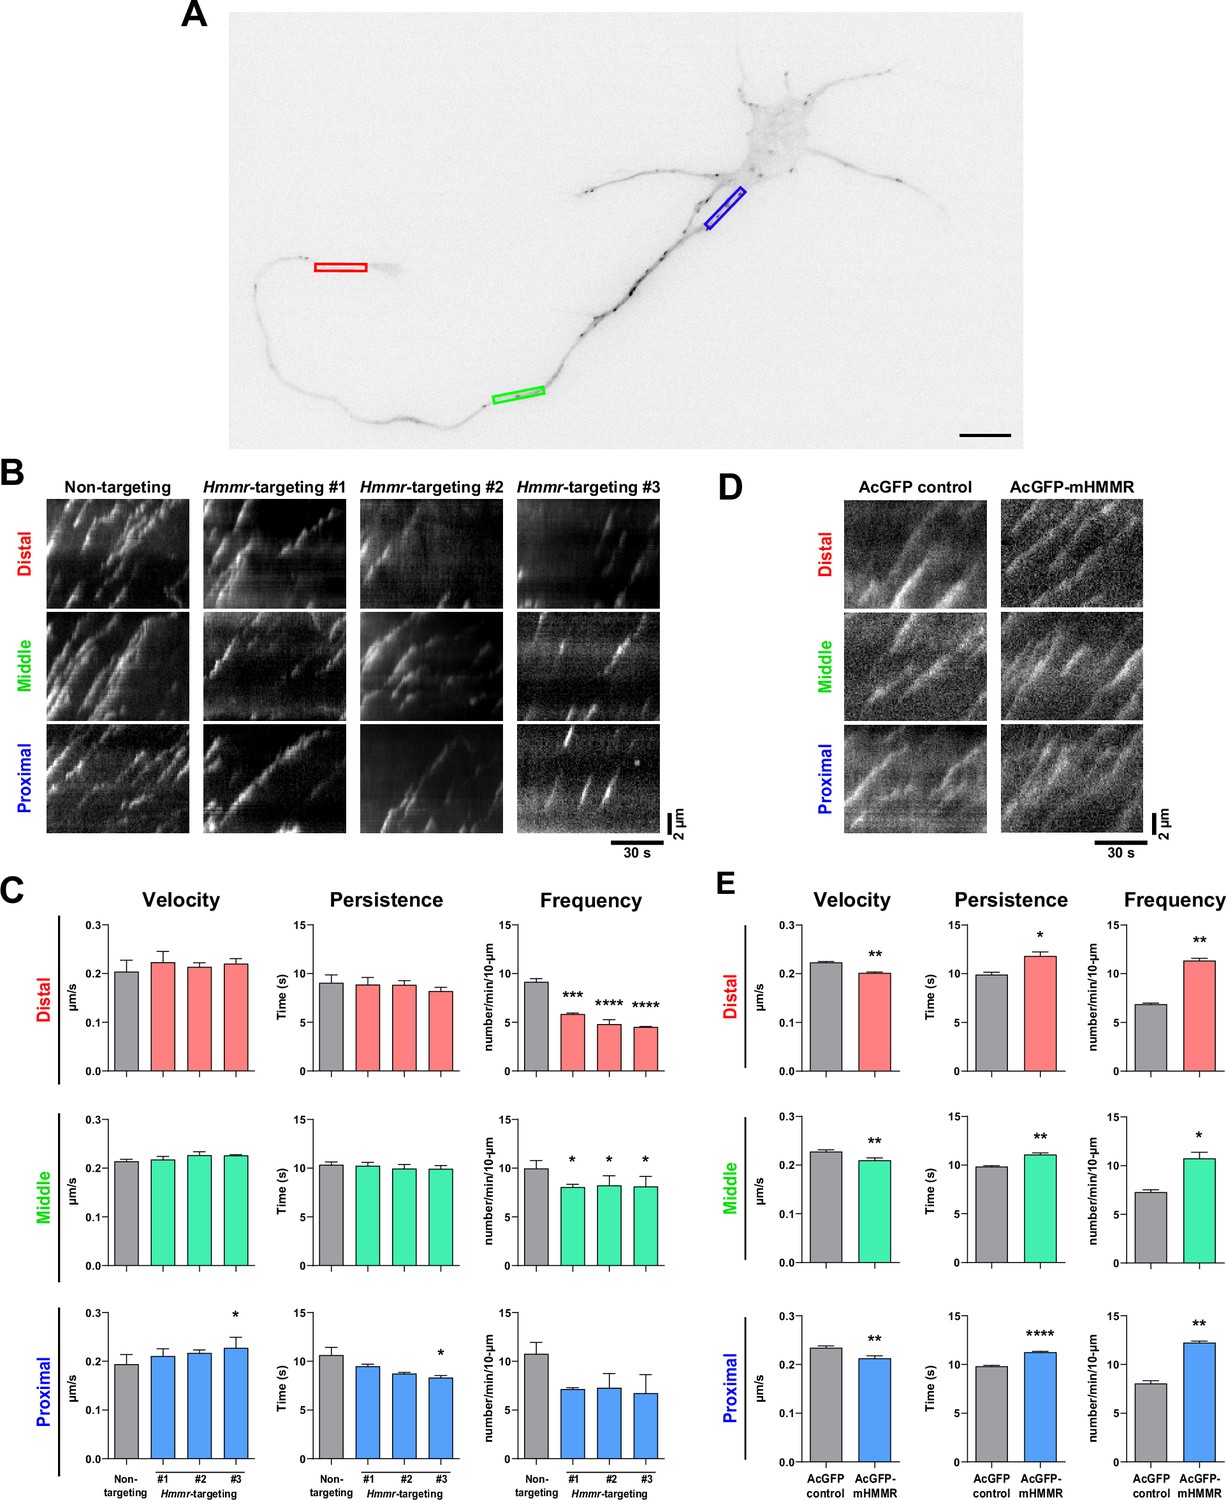
(A) Representative image of a 4 DIV EB3-mCherry-expressing cortical neuron. The color boxes indicate regions of quantification: red, green, and blue boxes represent the distal, middle, and proximal neurite, respectively. The scale bar presents 10 µm. (B) Representative kymographs of indicated neurons at different regions of the neurite. (C) Quantification of EB3-mCherry comets dynamics in B. *p<0.05, ***p<0.001, ****p<0.0001, one-way ANOVA followed by Dunnett’s post-hoc tests. (D) Representative kymographs of indicated neurons at different regions of the neurite. (E) Quantification of EB3-mCherry comets dynamics in D. *p<0.05, **p<0.01, ****p<0.0001, two-tailed Student’s t-test. At least 15 neurons were analyzed per condition per repeat. All bar graphs are expressed as mean ± SEM from three independent repeats.
Figure 5
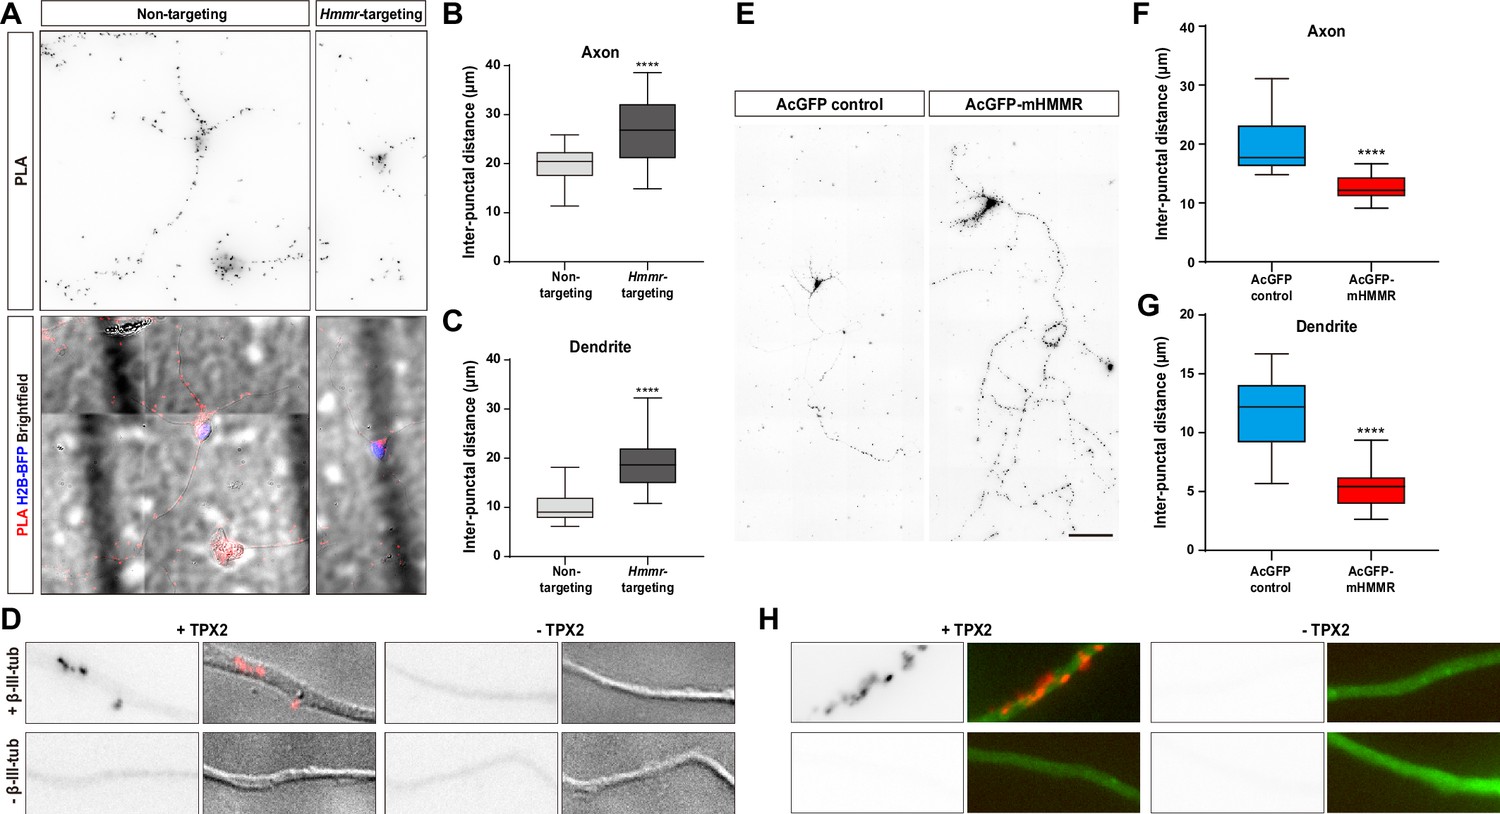
Hyaluronan-mediated motility receptor (HMMR) regulates the localization of TPX2 on microtubules in neurons.
(A–D) Hippocampal neurons were co-transfected with indicated shRNA- and H2B-BFP-expressing plasmids at 0 DIV and cultured for 4 days before ice-cold methanol fixation. The Hmmr-targeting #1 shRNA was utilized to deplete HMMR. (A) Representative PLA images for TPX2 and β-III-tubulin (upper panel) and merged images of PLA, H2B-BFP, differential interference contrast (DIC) (lower panel) in 4 DIV hippocampal neurons. Quantification of the inter-punctal distance of PLA signals in axon (B) and dendrite (C). Only neurons possessing both PLA and H2B-BFP signals were quantified. ****p<0.0001, two-tailed Mann-Whitney test. (D) PLA signals were presented along the neurite only when both TPX2 and β-III-tubulin antibodies were present. (E–H) Hippocampal neurons were co-transfected with H2B-BFP- and either AcGFP- or AcGFP-mHMMR-expressing plasmids at 0 DIV and cultured for 7 days before ice-cold methanol fixation. (E) Representative PLA images for TPX2 and β-III-tubulin in 7 DIV hippocampal neurons. Quantification of the inter-punctal distance of PLA signals in axon (F) and dendrite (G). Only neurons possessing both PLA and H2B-BFP signals were quantified. ****p<0.0001, two-tailed Mann-Whitney test. All box plots are expressed as first quartile, median, and the third quartile with whiskers extending to 5–95 percentile. (H) PLA signals were presented along the neurite only when both TPX2 and β-III-tubulin antibodies were present. Dylight 488-conjugated secondary antibody was applied after PLA to stain β-III-tubulin antibody (shown in green). Scale bars represent 20 µm in (A), 5 µm in (D) (H), and 100 µm in (E).
Tables
Key resources table
| Reagent type (species) or resource | Designation | Source or reference | Identifiers | Additional information |
|---|---|---|---|---|
| Gene (M. musculus) | Hmmr | GenBank | Gene ID: 15366 | |
| Transfected construct (M. musculus) | shRNA #1 | RNAi Consortium shRNA Library via RNAi Core of Academia Sinica | TRCN0000311803 | Lentiviral construct to express the Hmmr-targeting shRNA |
| Transfected construct (M. musculus) | shRNA #2 | RNAi Consortium shRNA Library via RNAi Core of Academia Sinica | TRCN0000311805 | Lentiviral construct to express the Hmmr-targeting shRNA |
| Transfected construct (M. musculus) | shRNA #3 | RNAi Consortium shRNA Library via RNAi Core of Academia Sinica | TRCN0000071592 | Lentiviral construct to express the Hmmr-targeting shRNA |
| Antibody | Anti-acetylated-α-tubulin (mouse monoclonal) | Abcam | ab24610 | IF (1:1000) |
| Antibody | Anti-β-III-tubulin (TUJ1) (mouse monoclonal) | BioLegend | 801202 | IF (1:4000) |
| Antibody | Anti-β-III-tubulin (TUBB3) (rabbit polyclonal) | BioLegend | 802001 | IF (1:2000) |
| Antibody | Anti-neurofilament (SMI312) (rabbit polyclonal) | BioLegend | 837904 | IF (1:1000) |
| Antibody | Anti-GFP (mouse monoclonal) | DSHB | 12A6 | IF (1:100) |
| Antibody | Anti-HMMR (E-19) (goat polyclonal) | Santa Cruz Biotechnology | sc-16170 | IF (1:50) |
| Antibody | Anti-MAP2 (rabbit polyclonal) | MilliporeSigma | AB5622 | IF (1:1000) |
| Antibody | Anti-TPX2 (rabbit polyclonal) | Oliver Gruss; Gruss et al., 2002 | IF (1:2000) | |
| Recombinant DNA reagent | pCAG-AcGFP-mHMMR (plasmid) | This paper | AcGFP-mHmmr expression vector | |
| Recombinant DNA reagent | pEGFP-hHMMR (plasmid) | Christopher Maxwell; Maxwell et al., 2003 | ||
| Commercial assay or kit | Duolink proximity ligation assay | Sigma-Aldrich | DUO92101 | |
| Software, algorithm | Prism | GraphPad v8.4.3 | RRID: SCR_002798 | |
| Software, algorithm | Fiji | Fiji | RRID: SCR_002285 | |
| Software, algorithm | NIS-Elements | Nikon | RRID: SCR_014329 |
Additional files
Download links
A two-part list of links to download the article, or parts of the article, in various formats.
Downloads (link to download the article as PDF)
Open citations (links to open the citations from this article in various online reference manager services)
Cite this article (links to download the citations from this article in formats compatible with various reference manager tools)
The non-mitotic role of HMMR in regulating the localization of TPX2 and the dynamics of microtubules in neurons
eLife 13:RP94547.
https://doi.org/10.7554/eLife.94547.3


