Tracking the neurodevelopmental trajectory of beta band oscillations with optically pumped magnetometer-based magnetoencephalography
- Sir Peter Mansfield Imaging Centre, School of Physics and Astronomy, University of Nottingham, University Park, United Kingdom
- Diagnostic Imaging, The Hospital for Sick Children, Canada
- Clinical Neurophysiology, Nottingham University Hospitals NHS Trust, Queens Medical Centre, United Kingdom
- Cerca Magnetics Limited, 7-8 Castlebridge Office Village, Kirtley Drive, United Kingdom
- QuSpin Inc, United States
Figures
Figure 1
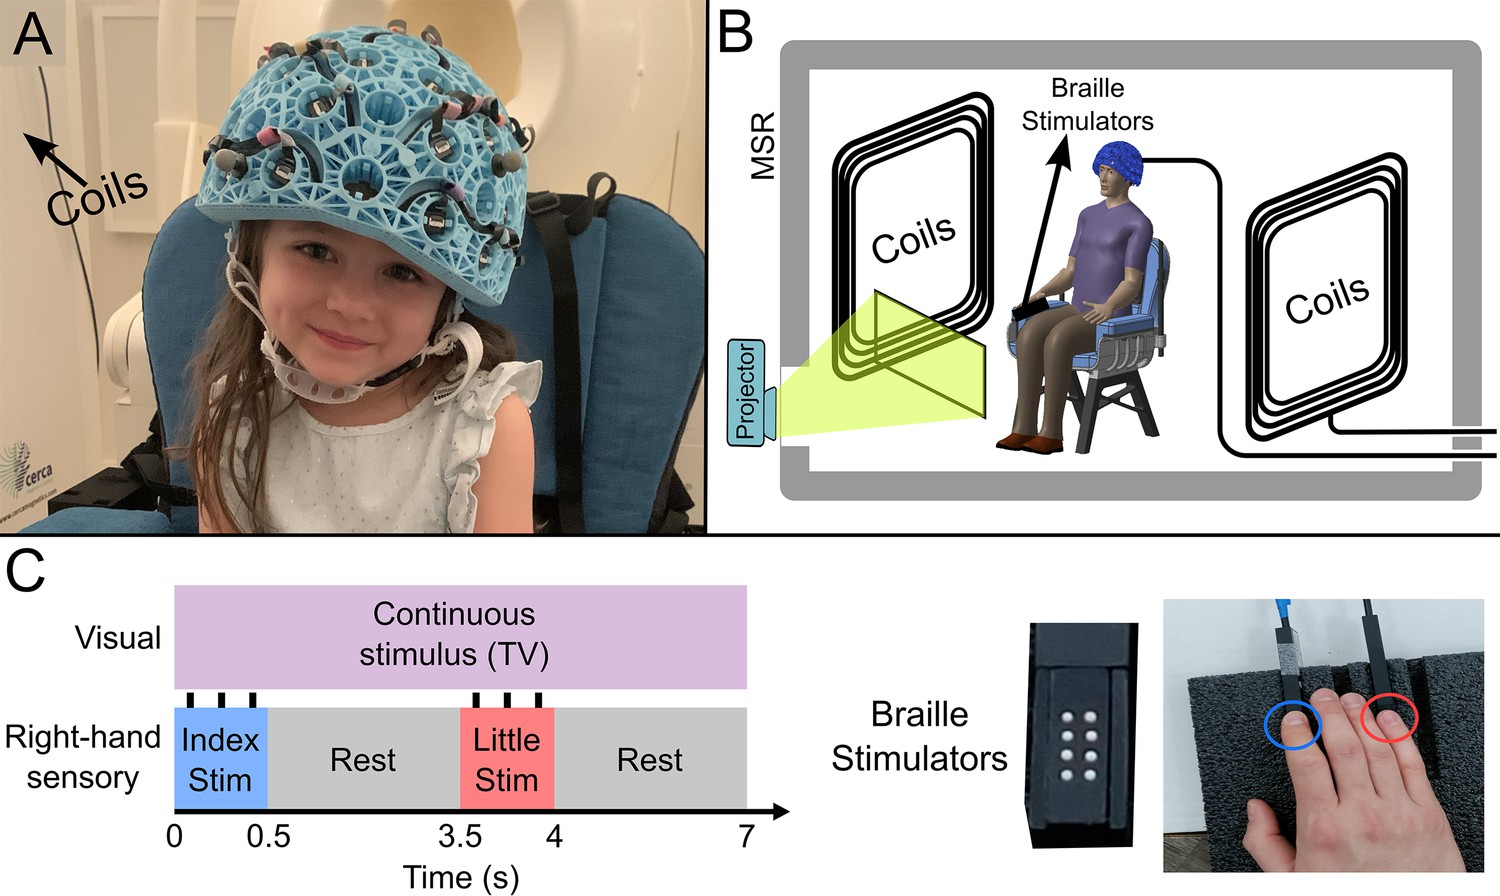
Experimental setup and beta band modulation during sensory task.
(A) 4-year-old child wearing an optically pumped magnetometer-based magnetoencephalography (OPM-MEG) helmet (consent and authorisation for publication was obtained). (B) Schematic diagram of the whole system inside the shielded room. (C) Schematic illustration of stimulus timings and a photo of the somatosensory stimulators. ‘Braille’ stimulators each comprise eight pins, which can be controlled independently; all eight were used simultaneously to deliver the stimuli.
Figure 2
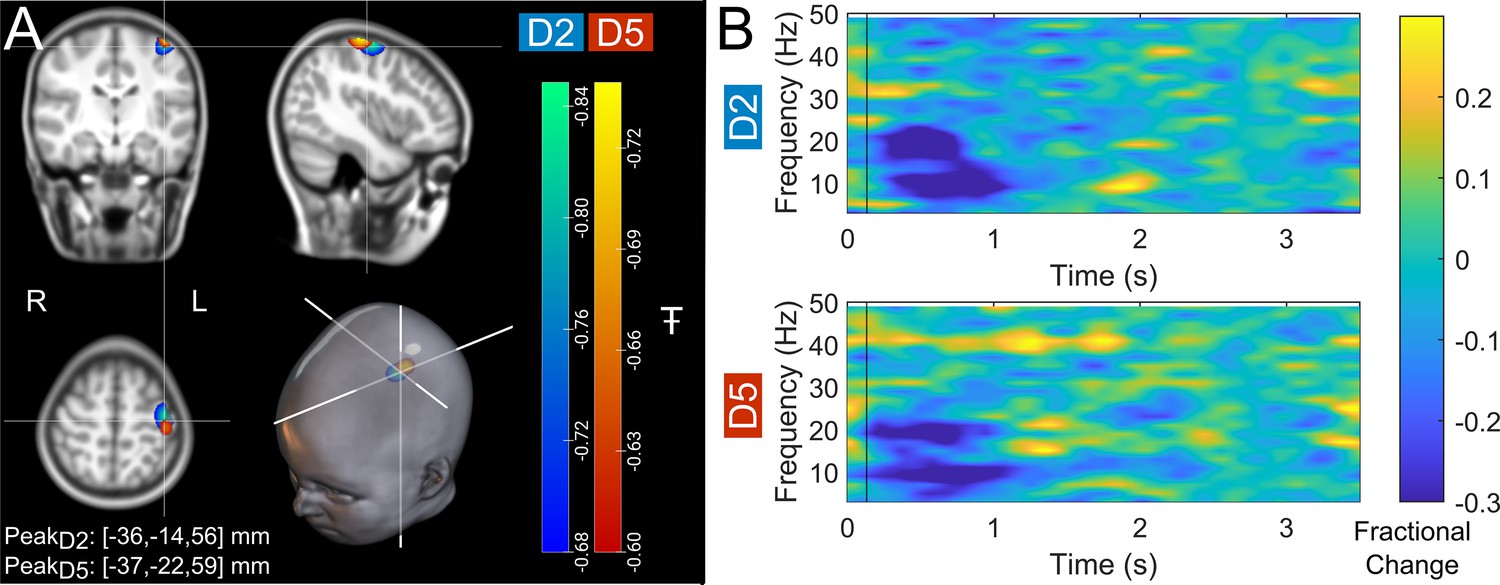
Data from a single participant (7 years of age).
(A) Brain plots show slices through the left motor cortex, with a pseudo-T-statistical map of beta modulation. The blue/green peaks indicate locations of largest beta modulation during stimulation for index finger trials (digit 2/D2), while the red/yellow peaks show the little finger (digit 5/D5). (B) Time-frequency spectra showing neural oscillatory amplitude modulation (fractional change in spectral amplitude relative to baseline measured in the 2.5–3 s window) for both fingers, using data extracted from the location of peak beta modulation (left sensorimotor cortex). Vertical lines indicate the time of the first braille stimulus. Note the beta amplitude reduction during stimulation, as expected.
Figure 3 with 1 supplement
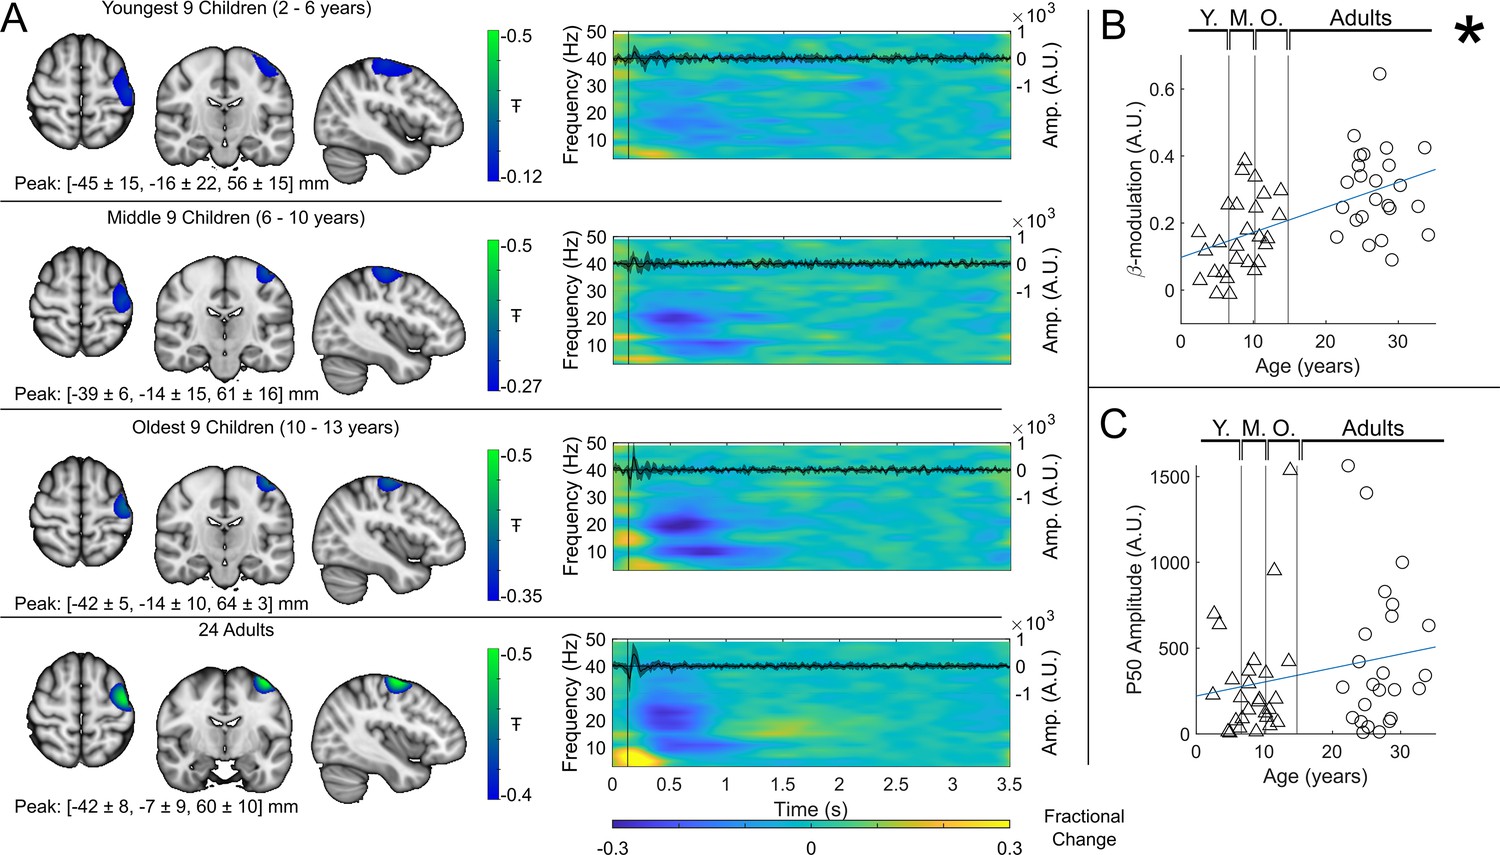
Beta band modulation with age (index finger).
(A) Brain plots show slices through the left motor cortex, with a pseudo-T-statistical map of beta modulation (blue/green) overlaid on the standard brain. Peak MNI coordinates are indicated for each subgroup. Time-frequency spectrograms show modulation of the amplitude of neural oscillations (fractional change in spectral amplitude relative to the baseline measured in the 2.5–3 s window). Vertical lines indicate the time of the first braille stimulus. In all cases results were extracted from the location of peak beta desynchronisation (in the left sensorimotor cortex). Note the clear beta amplitude reduction during stimulation. The inset line plots show the 4–40 Hz trial averaged phase-locked evoked response, with the expected prominent deflections around 20 ms and 50 ms. Shaded areas indicate the standard deviation of the evoked traces across the group. (B) Maximum difference in beta band amplitude (0.3–0.8 s window vs 1–1.5 s window) plotted as a function of age (i.e. each data point shows a different participant; triangles represent children, circles represent adults). Note significant correlation (*). (C) Amplitude of the P50 component of the evoked response plotted against age. There was no significant correlation (). All data here relate to the index finger stimulation; similar results are available for the little finger stimulation in Figure 3—figure supplement 1.
Figure 3—figure supplement 1
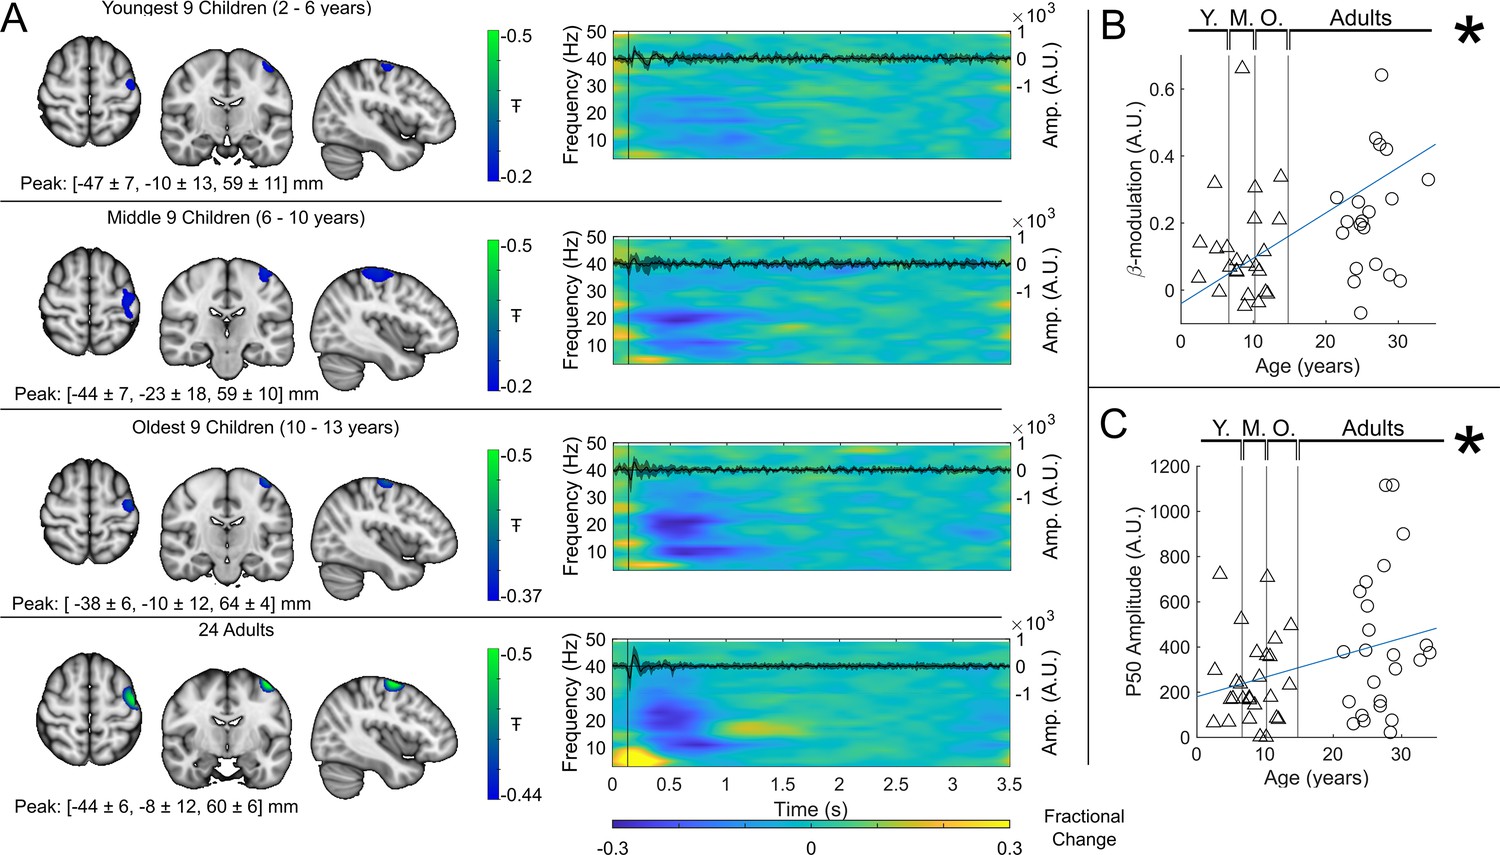
Beta band modulation with age (little finger).
Figure 4
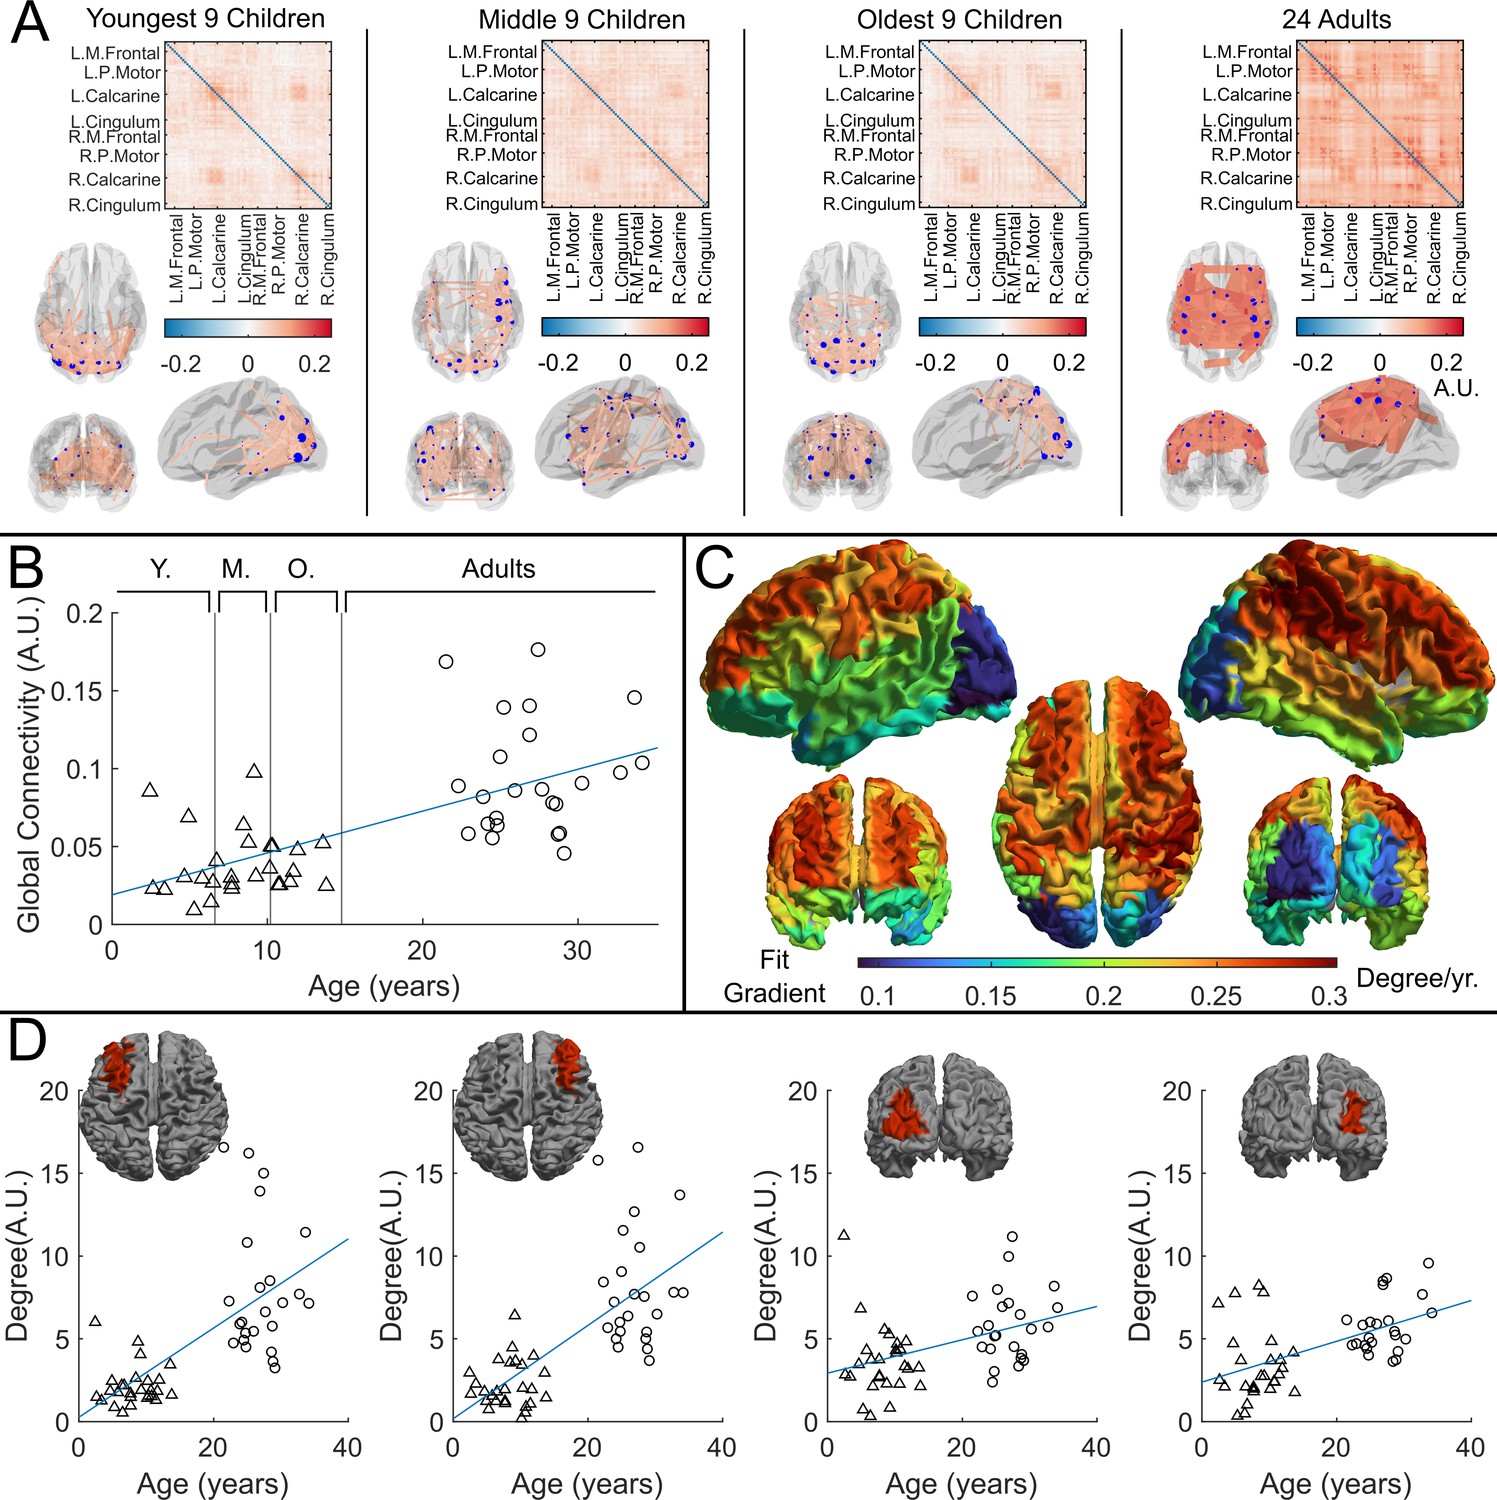
Functional connectivity – estimated using amplitude envelope correlation (AEC) – varies with age.
(A) Connectivity matrices constructed using 78 regions of the automated anatomical labelling (AAL) atlas and glass brains showing the strongest 150 connections (average across the group). AEC was estimated across the entire recording. (B) Global average connectivity increases significantly with age (*). (C) Age-related changes in connectivity vary spatially. Brain plot shows the linear fit gradient of node degree (the sum across the rows of the connectivity matrices) against age. Node degree varies less in occipital regions while frontal regions become more strongly connected with increasing age. (D) Example plots show node degree against age for left and right frontal and occipital regions. Pearson correlation yielded (from left to right): (); (); (); ().
Figure 5
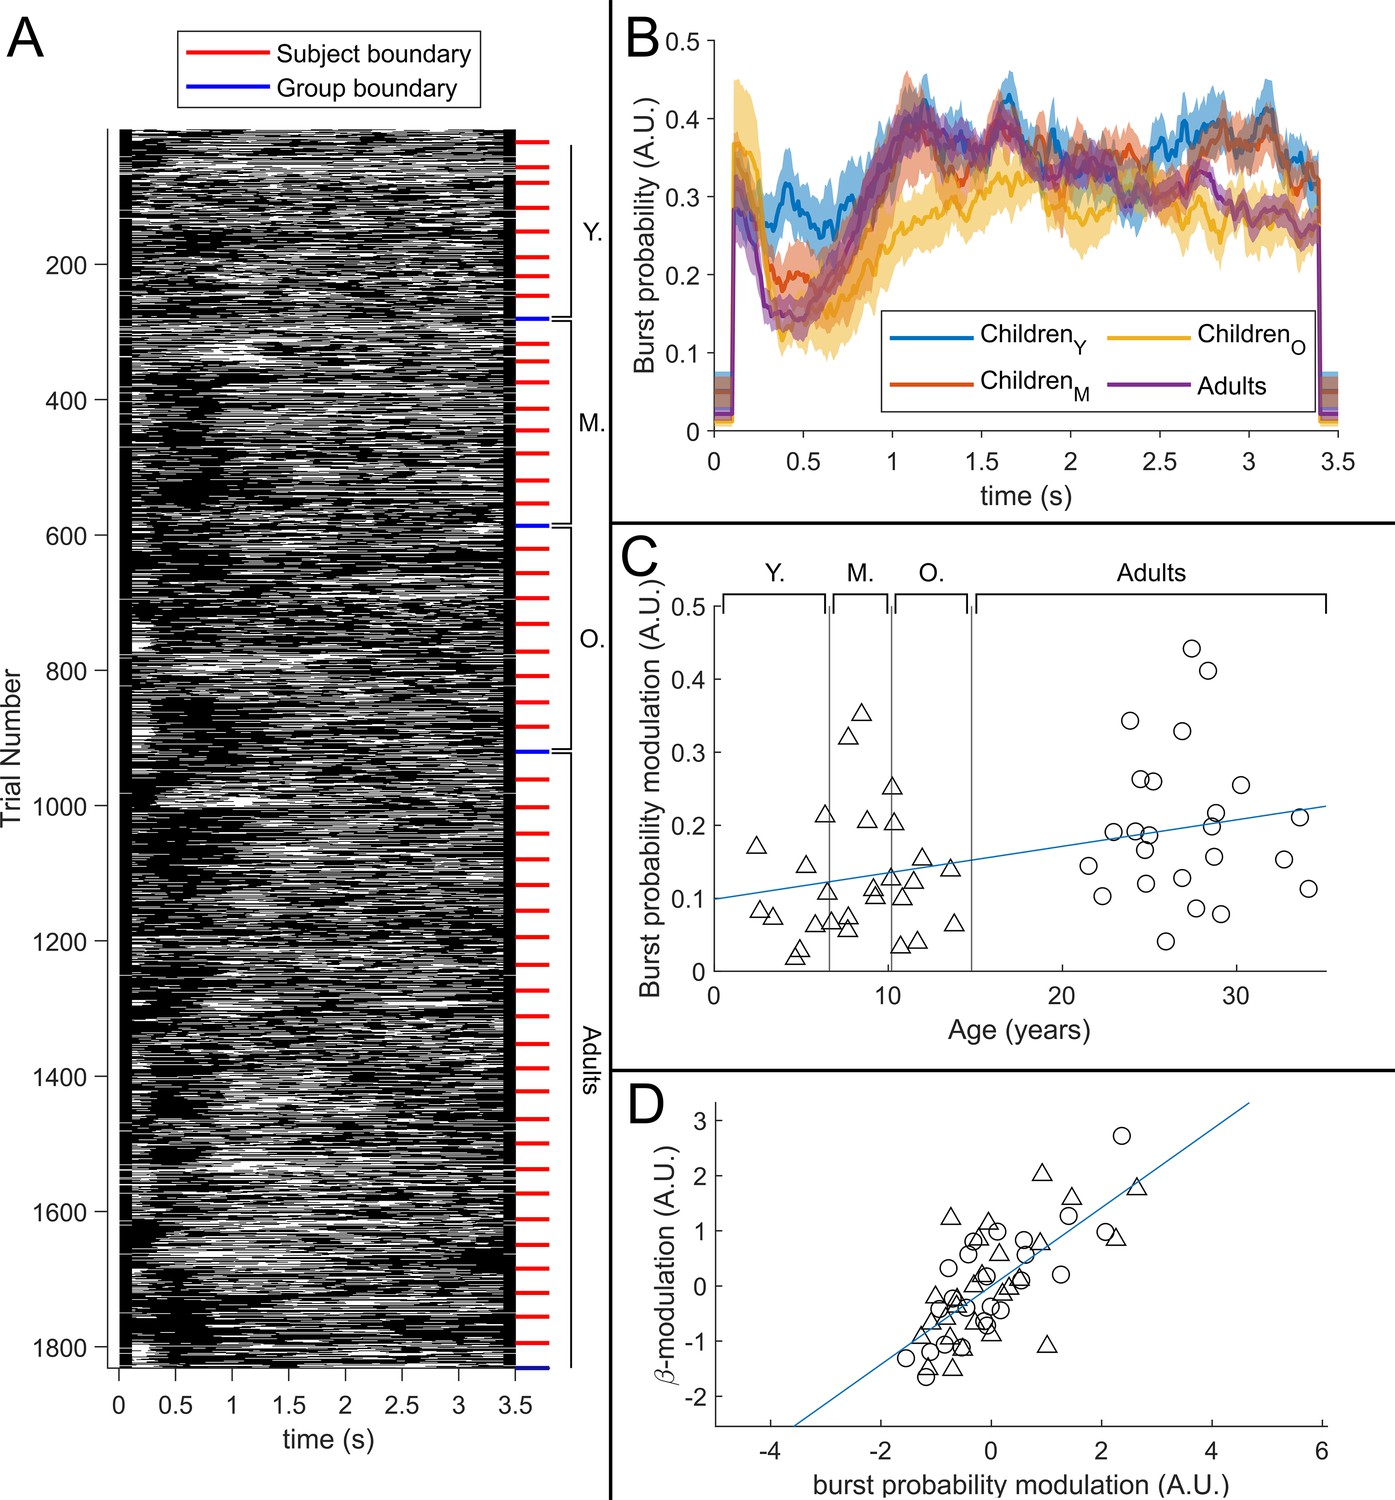
The relationship between beta band amplitude modulation and pan-spectral burst probability.
(A) Raster plot showing burst occurrence (white) as a function of time for all trials and participants combined (participants sorted by increasing age). (B) Trial averaged burst probability time courses across the four participant groups. Shaded areas indicate the standard error. (C) Stimulus to post-stimulus modulation of burst probability (0.3–0.8 s vs 1–1.5 s) plotted against age. Note significant (*) positive correlation. (D) Beta amplitude modulation plotted against burst probability. Note again significant correlation (*). Values for both measures were z-transformed within the children and adult group respectively to mitigate the age confound. Triangles and circles denote children and adults respectively.
Figure 6 with 1 supplement
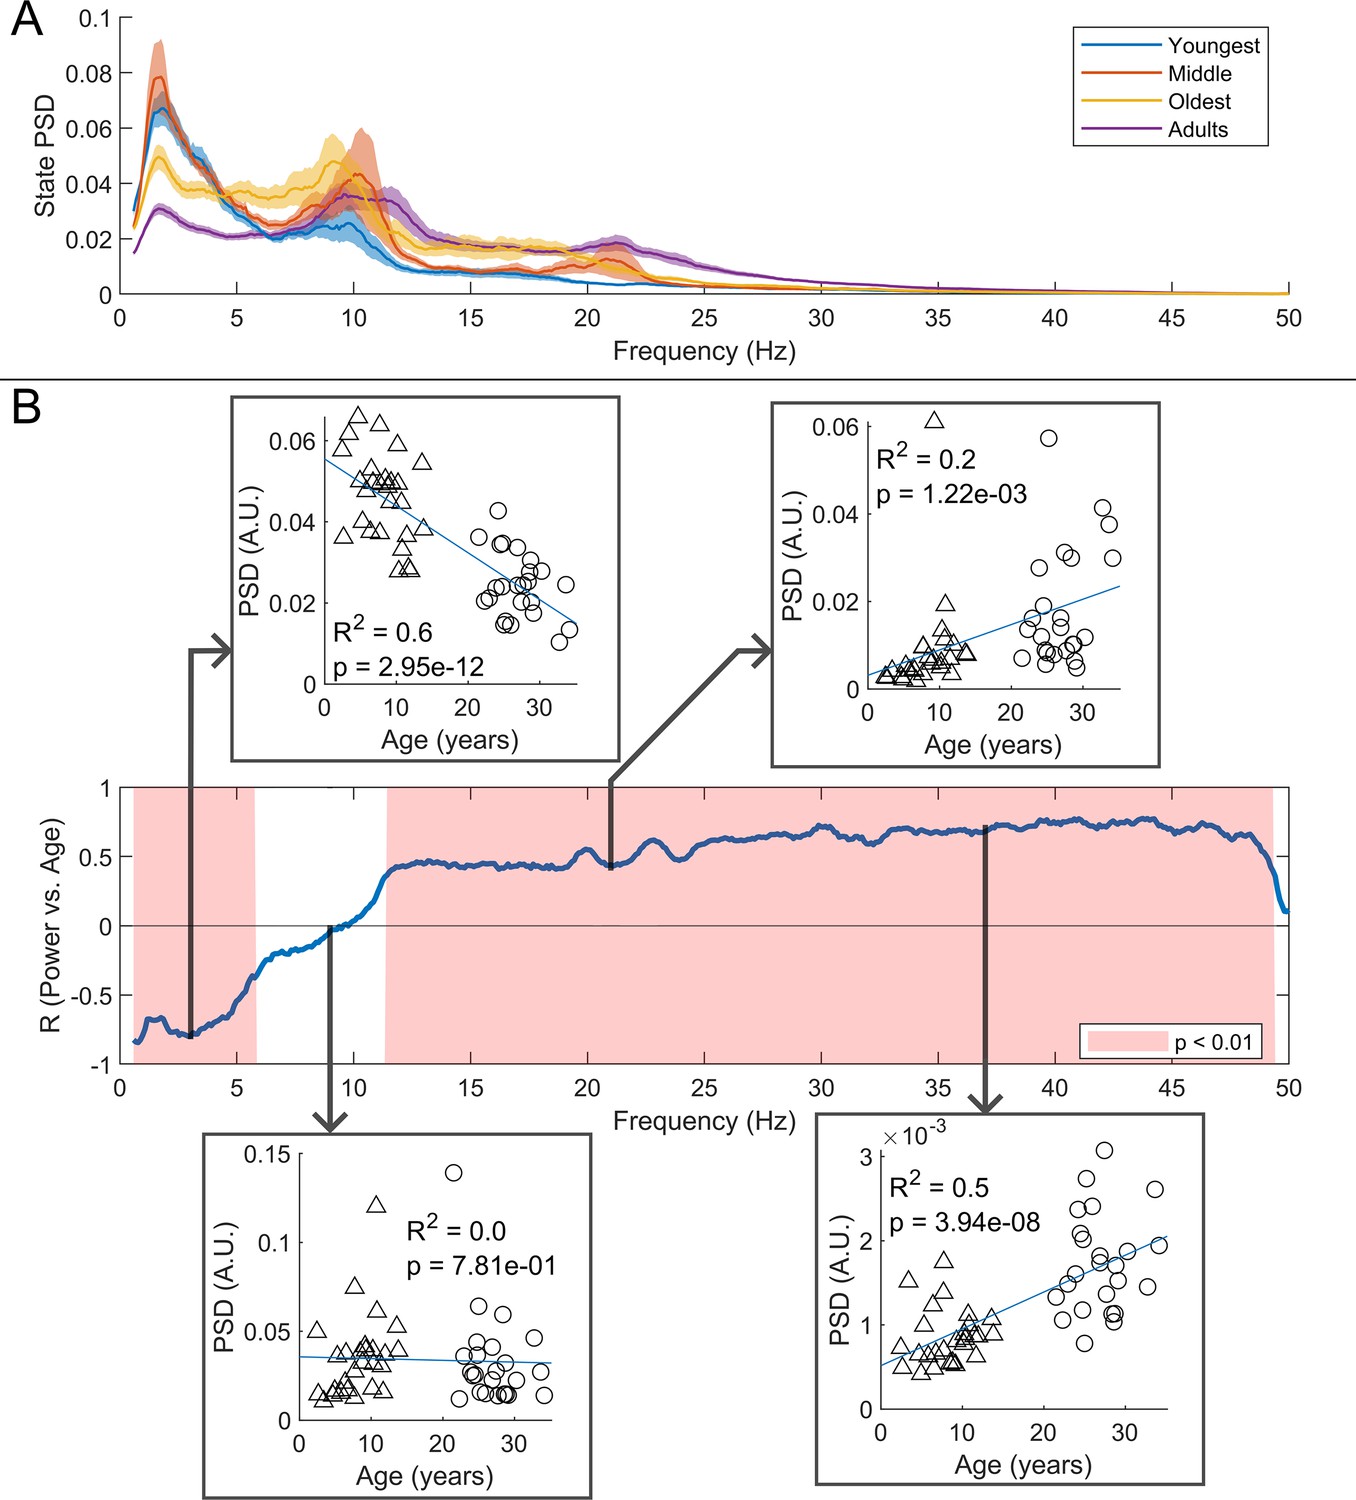
Spectral content of the burst state varies with age.
(A) Average burst-state spectra across groups. Shaded areas indicate standard error on the group mean. (B) Pearson correlation coefficient for the power spectral density (PSD) values in (A) against age across all frequency values. Red shaded areas indicate (uncorrected). The four inset plots show example scatters of PSD values with age at selected frequencies (3 Hz, 9 Hz, 21 Hz, and 37 Hz). Low-frequency spectral content decreases with age while high-frequency content increases. No significant correlation was observed in the high theta and alpha bands.
Figure 6—figure supplement 1
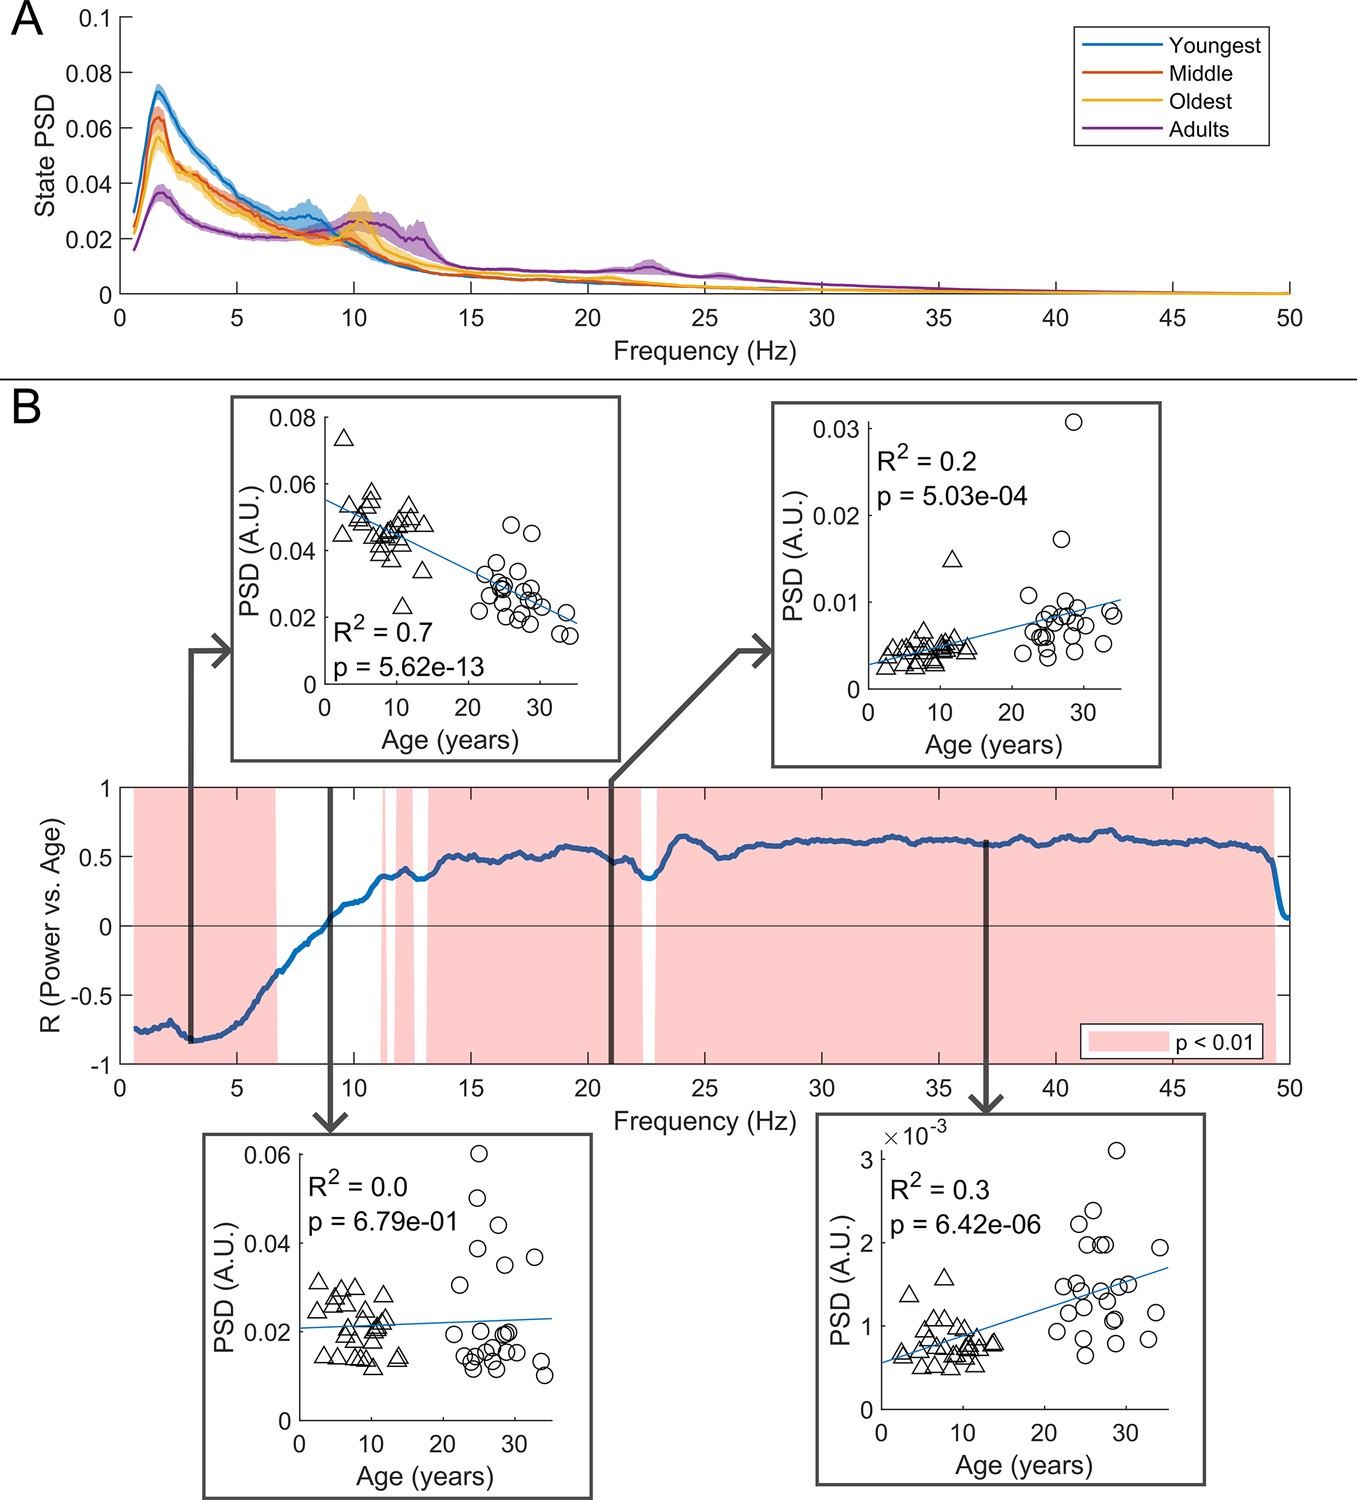
Spectral content of the non-burst states.
Appendix 1—figure 1
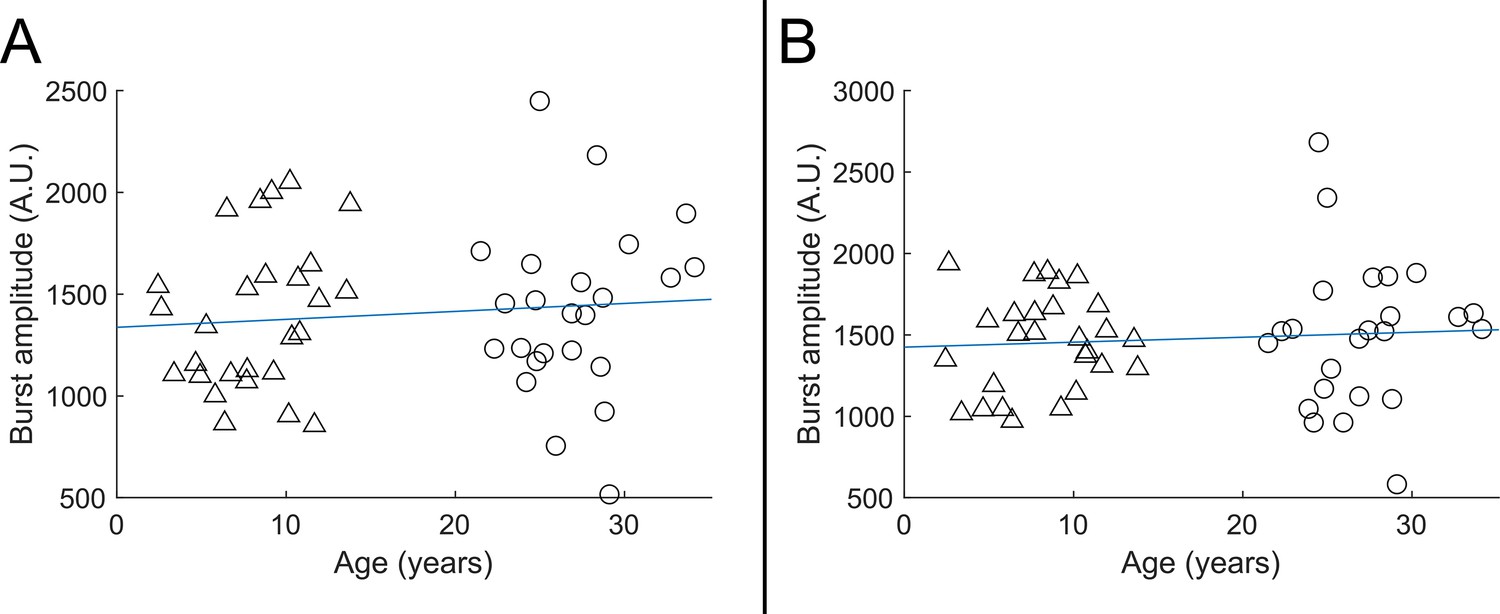
Beta burst amplitude as a function of age.
A shows index finger simulation trials (R2=0.01, p=0.48); B shows little finger stimulation trials (R2=0.01, p=0.57). In both cases there was no significant modulation of burst amplitude with age.
Appendix 2—figure 1
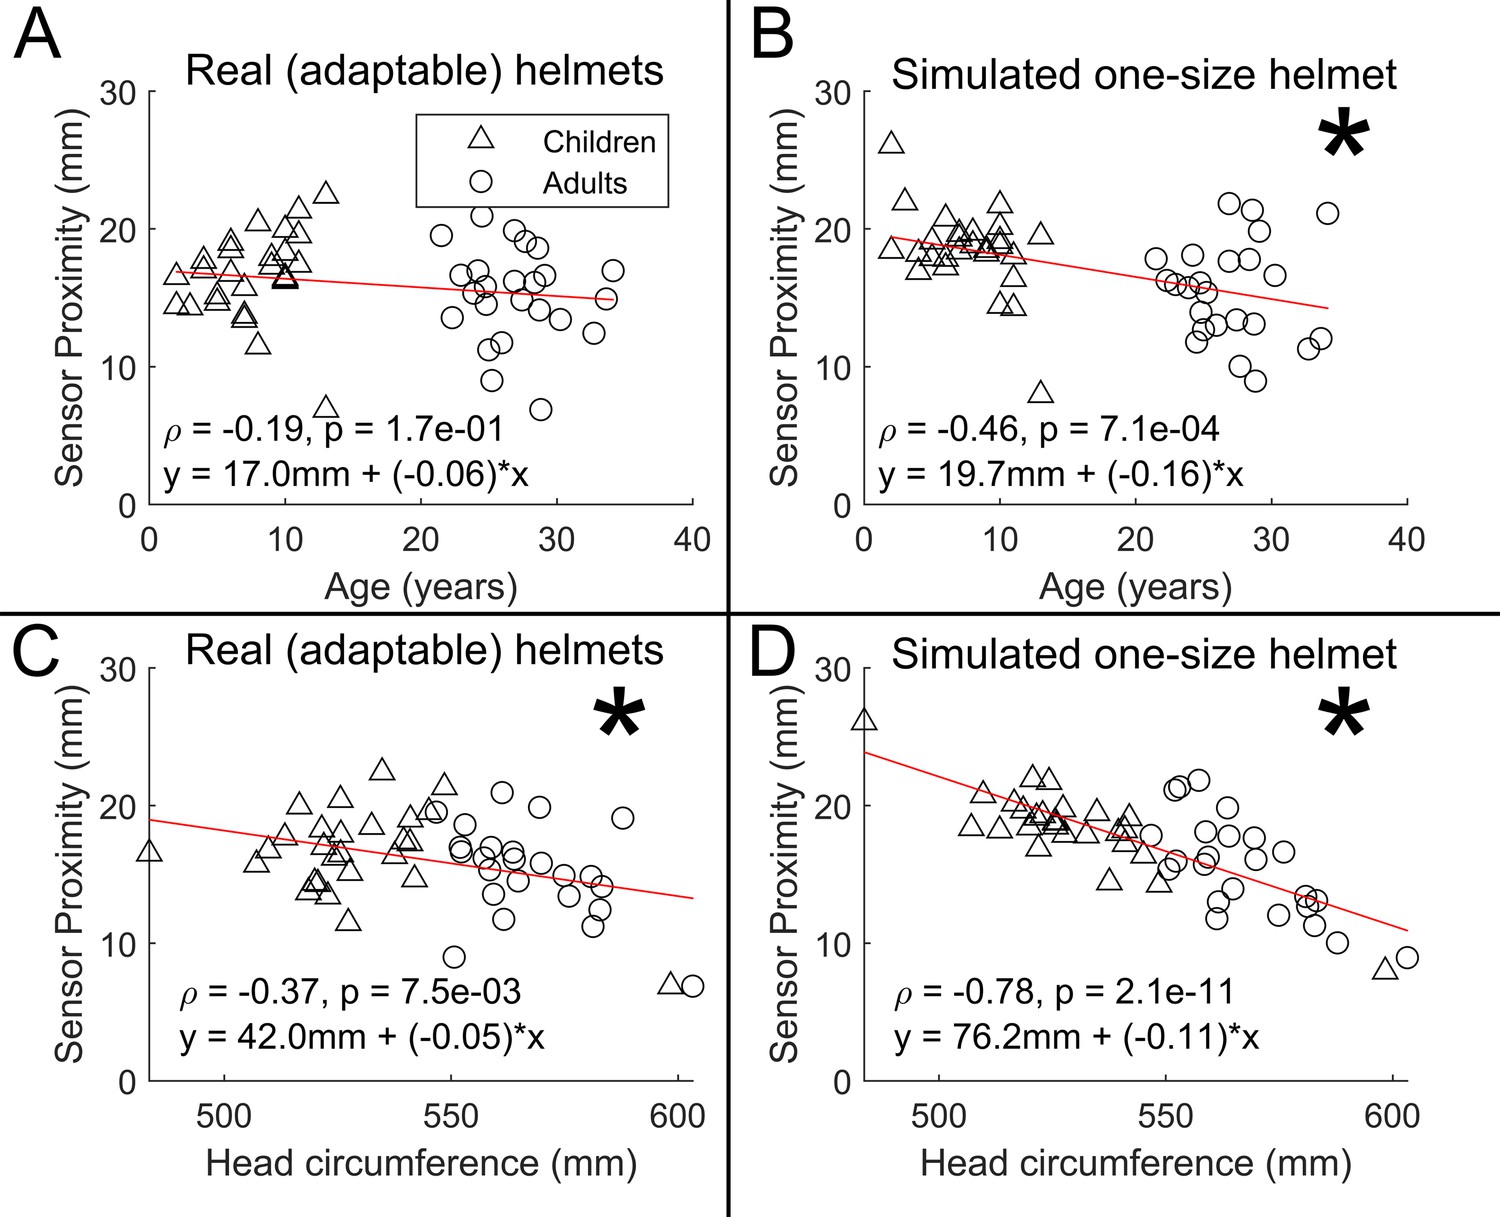
Scalp-to-sensor distance as a function of age (A/B) and head circumference (C/D).
A and C show the case for the real helmets; B and D show the simulated non-adaptable case.
Appendix 3—figure 1
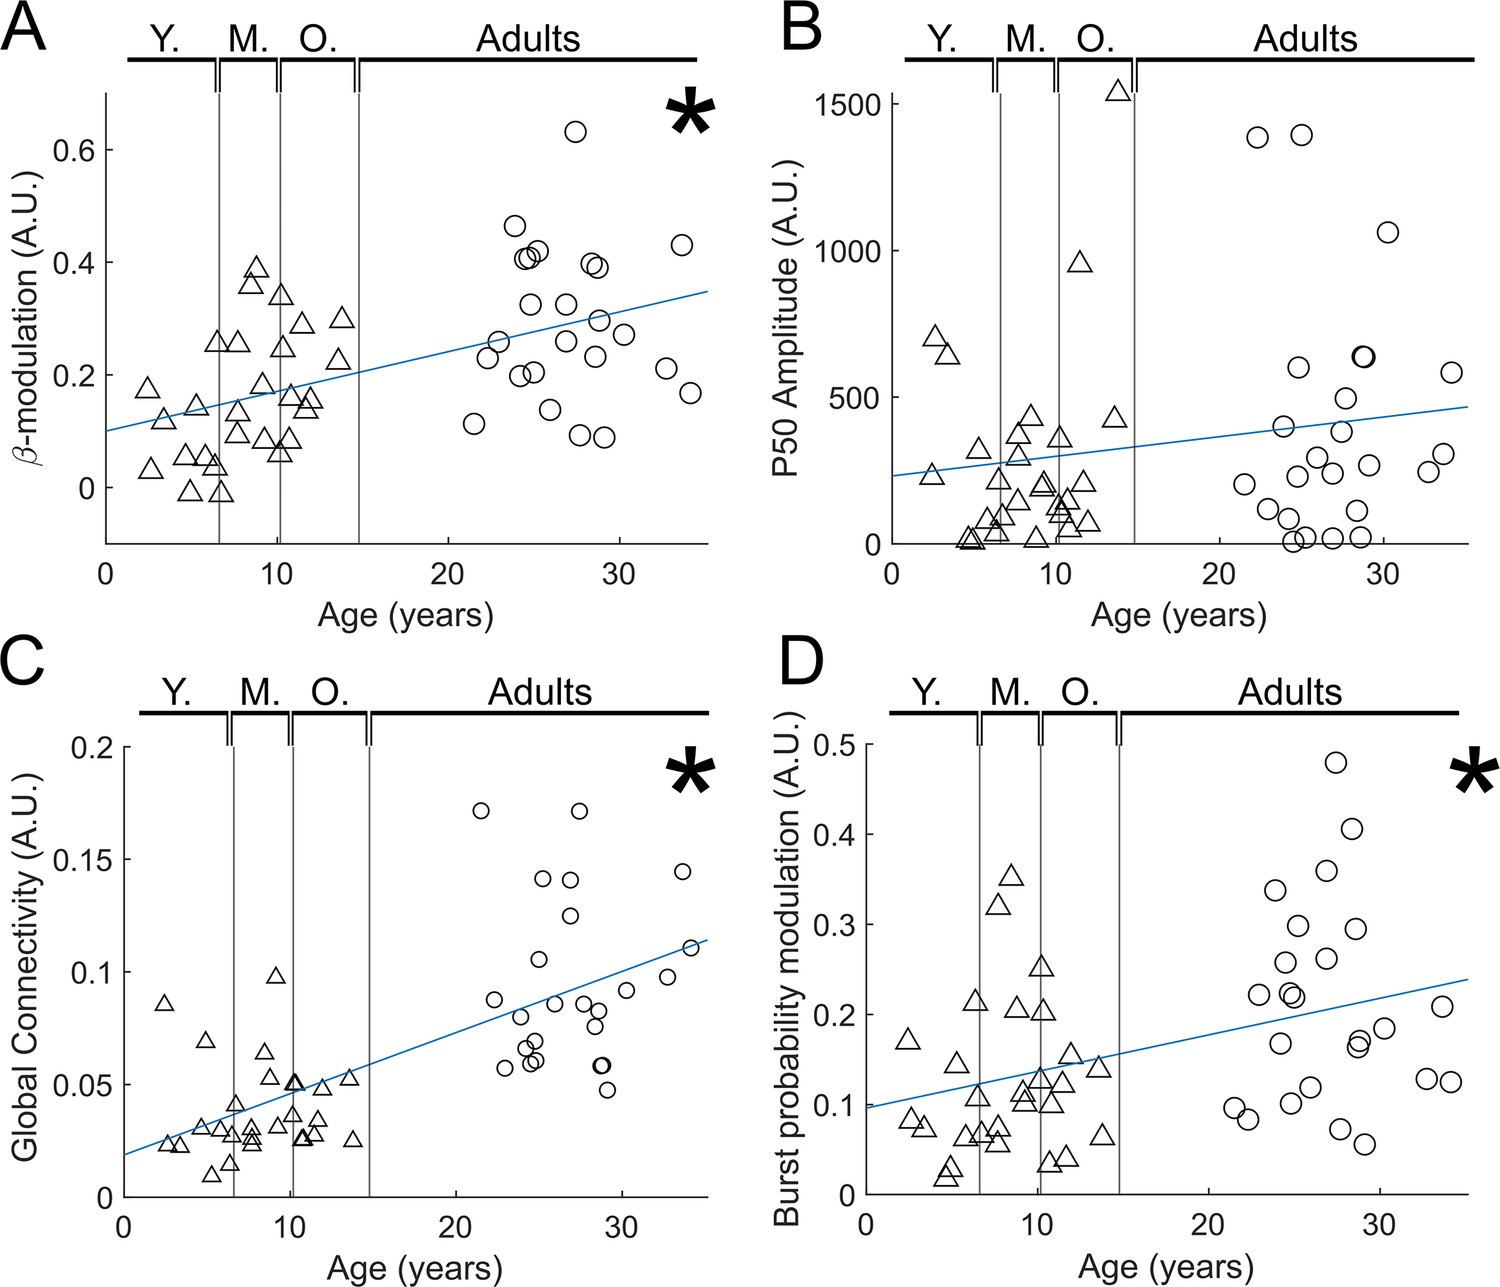
Reduced trial analysis for index finger stimuli.
(A) Beta modulation with age (). (B) Evoked response (P50) modulation with age (). (C) Functional connectivity with age (). (D) Burst probability modulation with age ( ).
Author response image 1

Scalp-to-sensor distance as a function of age (A/B) and head circumference (C/D).
A and C show the case for the real helmets; B and D show the simulated non-adaptable case.
Author response image 2

Beta burst amplitude as a function of age; (A) shows index finger simulation trials; (B) shows little finger stimulation trials.
In both case there was no significant modulation of burst amplitude with age.
Author response image 3

Beta band modulation with age.
(A) Brain plots show slices through the left motor cortex, with a pseudo-T-statistical map of beta modulation (blue/green) overlaid on the standard brain. Peak MNI coordinates are indicated for each subgroup. Time-frequency spectrograms show modulation of the amplitude of neural oscillations (fractional change in spectral amplitude relative to the baseline measured in the 2.5-3 s window). Vertical lines indicate the time of the first braille stimulus. In all cases results were extracted from the location of peak beta desynchronisation (in the left sensorimotor cortex). Note the clear beta amplitude reduction during stimulation. The inset line plots show the 4-40 Hz trial averaged phase-locked evoked response, with the expected prominent deflections around 20 and 50 ms. (B) Maximum difference in beta-band amplitude (0.3-0.8 s window vs 1-1.5 s window) plotted as a function of age (i.e., each data point shows a different participant; triangles represent children, circles represent adults). Note significant correlation (R2 = 0.29, p = 0.00004 *). (C) Amplitude of the P50 component of the evoked response plotted against age. There was no significant correlation (R2 = 0.04, p = 0.14). All data here relate to the index finger stimulation; similar results are available for the little finger stimulation in Supplementary Information Section 1.
Additional files
Download links
A two-part list of links to download the article, or parts of the article, in various formats.
Downloads (link to download the article as PDF)
Open citations (links to open the citations from this article in various online reference manager services)
Cite this article (links to download the citations from this article in formats compatible with various reference manager tools)
Tracking the neurodevelopmental trajectory of beta band oscillations with optically pumped magnetometer-based magnetoencephalography
eLife 13:RP94561.
https://doi.org/10.7554/eLife.94561.3


