Perceptual error based on Bayesian cue combination drives implicit motor adaptation
- School of Psychological and Cognitive Sciences, Peking University, China
- Beijing Key Laboratory of Behavior and Mental Health, China
- Peking-Tsinghua Center for Life Sciences, Peking University, China
- National Key Laboratory of General Artificial Intelligence, China
Figures
Figure 1
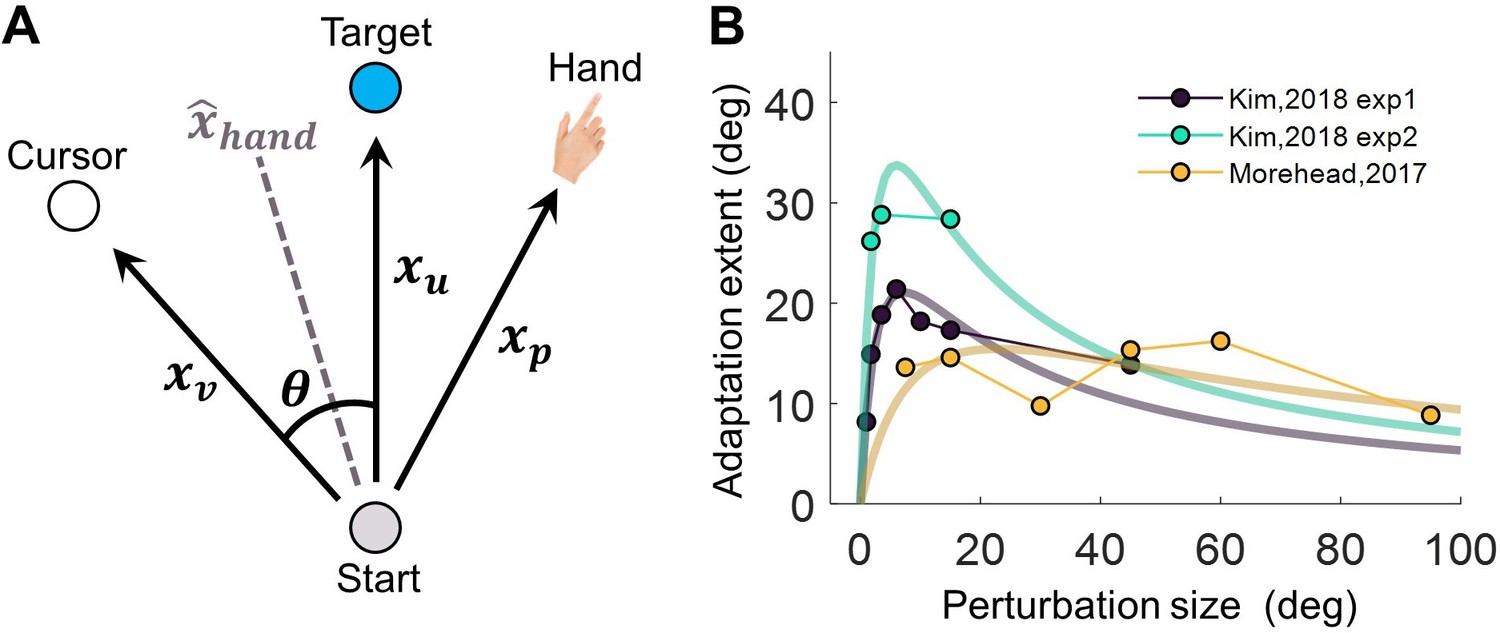
The Perceptual Error Adaptation (PEA) model for error-clamp adaptation.
(A) Illustration of involved sensorimotor cues for estimating hand direction . The clamped cursor, the hand, and the sensory prediction of the reaching action provide the visual (), proprioceptive (), and the sensory prediction cue () of movement direction, respectively. The hand direction estimate is assumed to be based on maximum likelihood cue combination. (B) Assuming a linear dependency of visual uncertainty on eccentricity, the PEA model predicts that implicit adaptation extent is a concave function of perturbation size θ, a pattern qualitatively aligning with previous findings (Kim et al., 2018; Morehead et al., 2017).
Figure 2 with 2 supplements
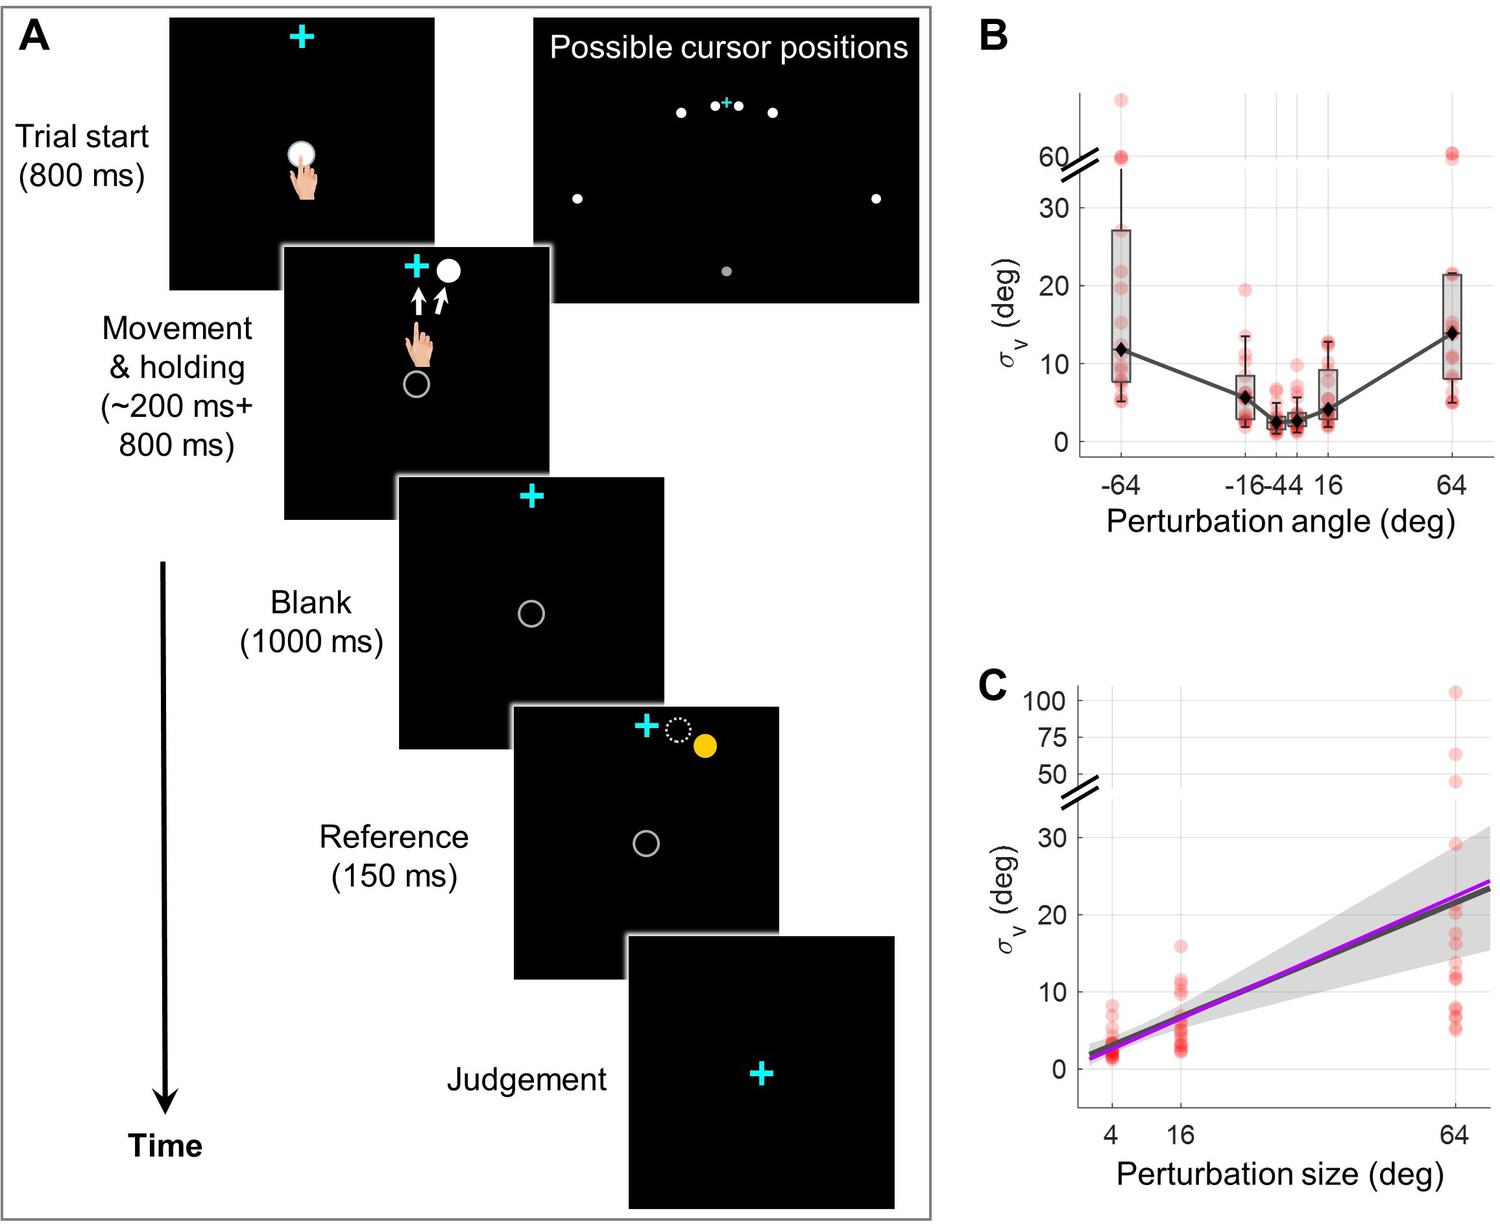
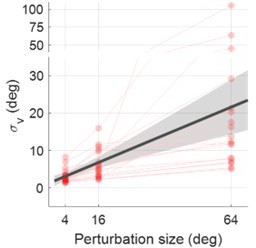
Experiment 1 measuring the dependency of visual uncertainty on perturbation size.
(A) Illustration of all possible cursor endpoints during the experiment and the procedure of the 2AFC task for judging the cursor motion direction. In an exemplary trial, the participant reaches to a target while a direction-clamped cursor moves concurrently, serving as an error-clamp perturbation. Following a 1000 ms blank masking period, a reference point appears for 150ms, either clockwise or counterclockwise from the clamped cursor. The participant is then asked to make a binary judgment regarding the direction of the clamped cursor relative to the reference point. (B) The visual uncertainty, obtained from psychometrical estimation based on the 2AFC, is plotted as a function of perturbation size (n = 18). Both individual estimates (red dots) and group-level statistics (boxplots) are shown. Positive angles correspond to CW rotations, negative angles to CCW rotations. (C) Collapsing data from both rotation directions, we observe that visual uncertainty closely follows a linear function of perturbation size. The dark gray line and its shaded region denote the regression line and its 95% confidence interval, respectively. The purple line is generated with the values of a and b fitted from data in Experiment 2 with a and b treated as free parameters (see Methods for details).
Figure 2—figure supplement 1
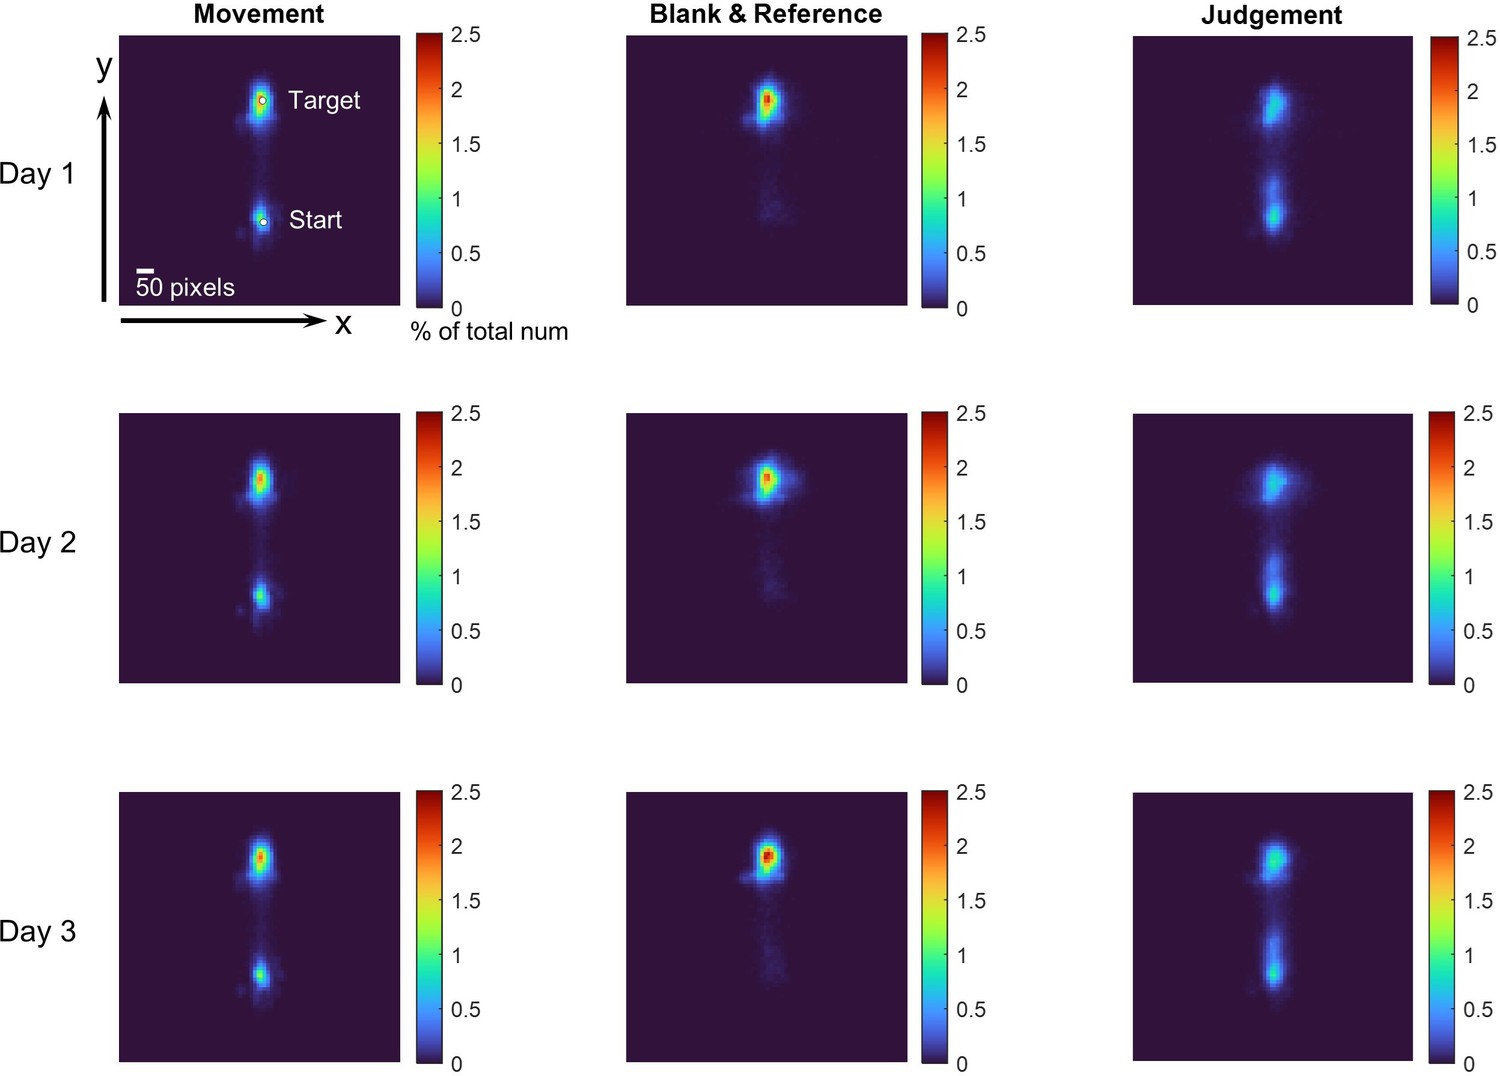
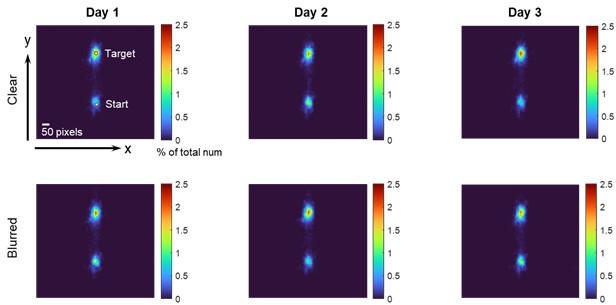
Heat map of eye fixations during the 2AFC task in Experiment 1.
The screen is partitioned into 10x10 pixel grids, and the cumulative number of gaze samples in each grid is recorded. Data from all participants, aggregated across each day of practice, are presented. The color map signifies the normalized count of gaze samples in each grid. Data are separately displayed for the three distinct phases of a trial, as delineated by the columns on the left, middle, and right. These correspond to periods during hand movement, the appearance of the visual mask and reference point, and the time allotted for manual response. On average, 95.06%, 89.93%, and 86.55% of gaze samples fall within the ±50-pixel range of the central line during these three phases, respectively. These results corroborate that participant adhered to the instructions and refrained from looking at the cursor during the visual discrimination task.
Figure 2—figure supplement 2
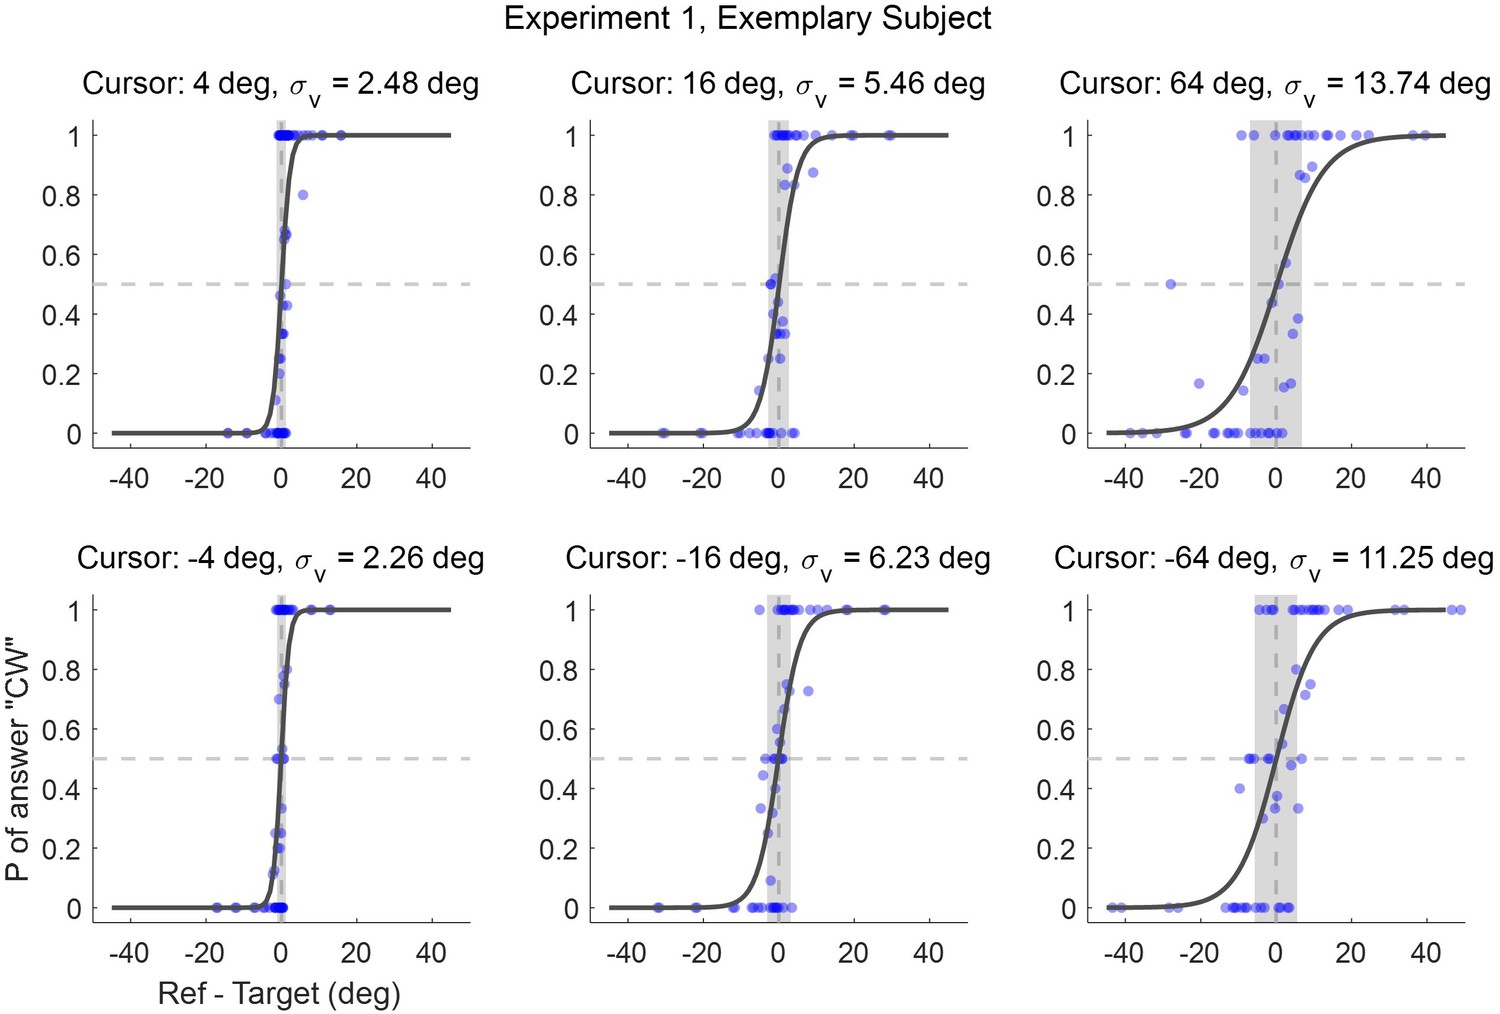
Performance of an exemplary participant in Experiment 1.
Six panels display the psychometric curves corresponding to different error-clamp sizes. The x-axis denotes the angular deviation between the clamped cursor and the reference point (as depicted in Figure 6A). A negative value implies that the reference point appears on the counterclockwise (CCW) side of the clamped cursor. The blue dots represent the proportion of trials in which the participant reported that ‘the yellow point is on the clockwise (CW) side of the clamped cursor’ for various angular deviations between these two. Data were aggregated from all trials across three days of the experiment. The gray-shaded region represents the interquartile range (25th to 75th percentile) of the psychometric curve, and the width of this shaded region serves as an indicator of the amplitude of visual uncertainty.
Figure 3 with 4 supplements
Results and model fitting of Experiment 2.
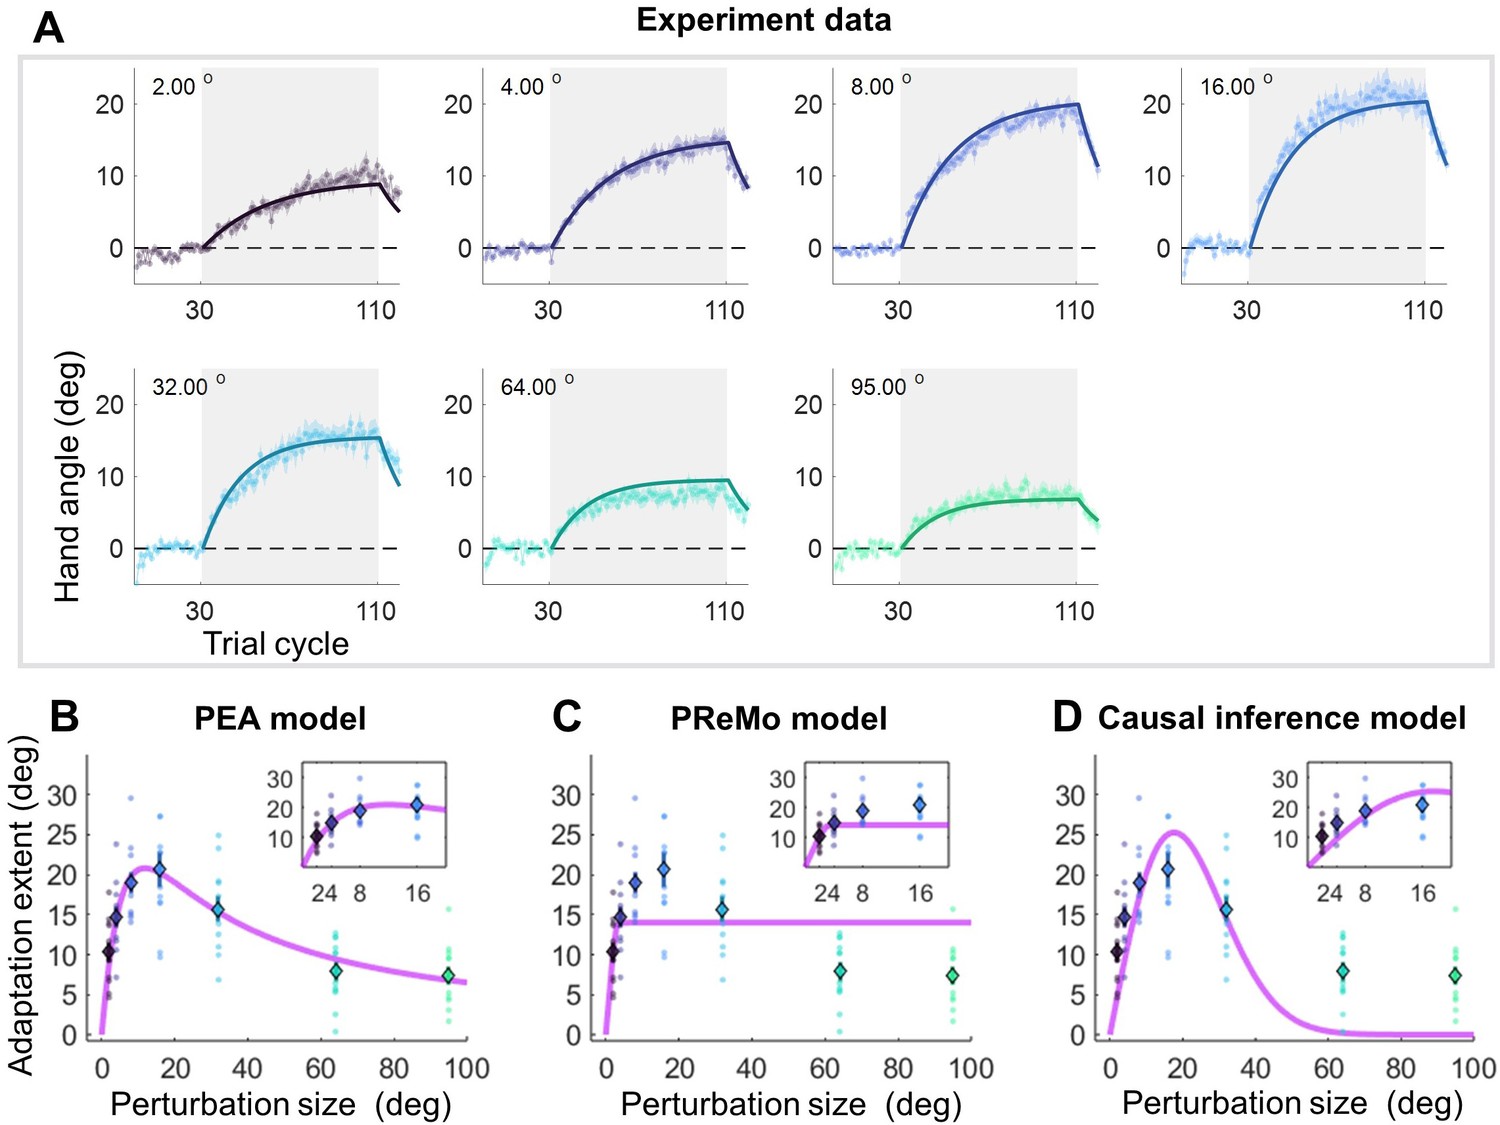
(A) Implicit adaptation to error clamps of varying sizes is depicted (n = 84); colored dot-lines and colored shading area represent the mean and standard error for each participant group. The light gray area indicates trials with error-clamp perturbations. Adaptation starts after baseline, gradually asymptotes to its final extent, and then decays with null feedback during washout. Different perturbation sizes result in distinct adaptation rates and extents. Group averages and standard error across participants are shown, along with predictions (colored solid lines) from the PEA model. (B) The adaptation extent (cycle 100–110) exhibits a nonlinear dependency on perturbation size, conforming to a concave function as prescribed by PEA (purple line). Color dots and error bars denote the mean and standard error across participants in each group. (C–D) The same data fitted with the PReMo model and the causal inference model. For more details, refer to Figure 3—figure supplement 1.
Figure 3—figure supplement 1
Model fitting for observed implicit adaptation in Experiment 2.
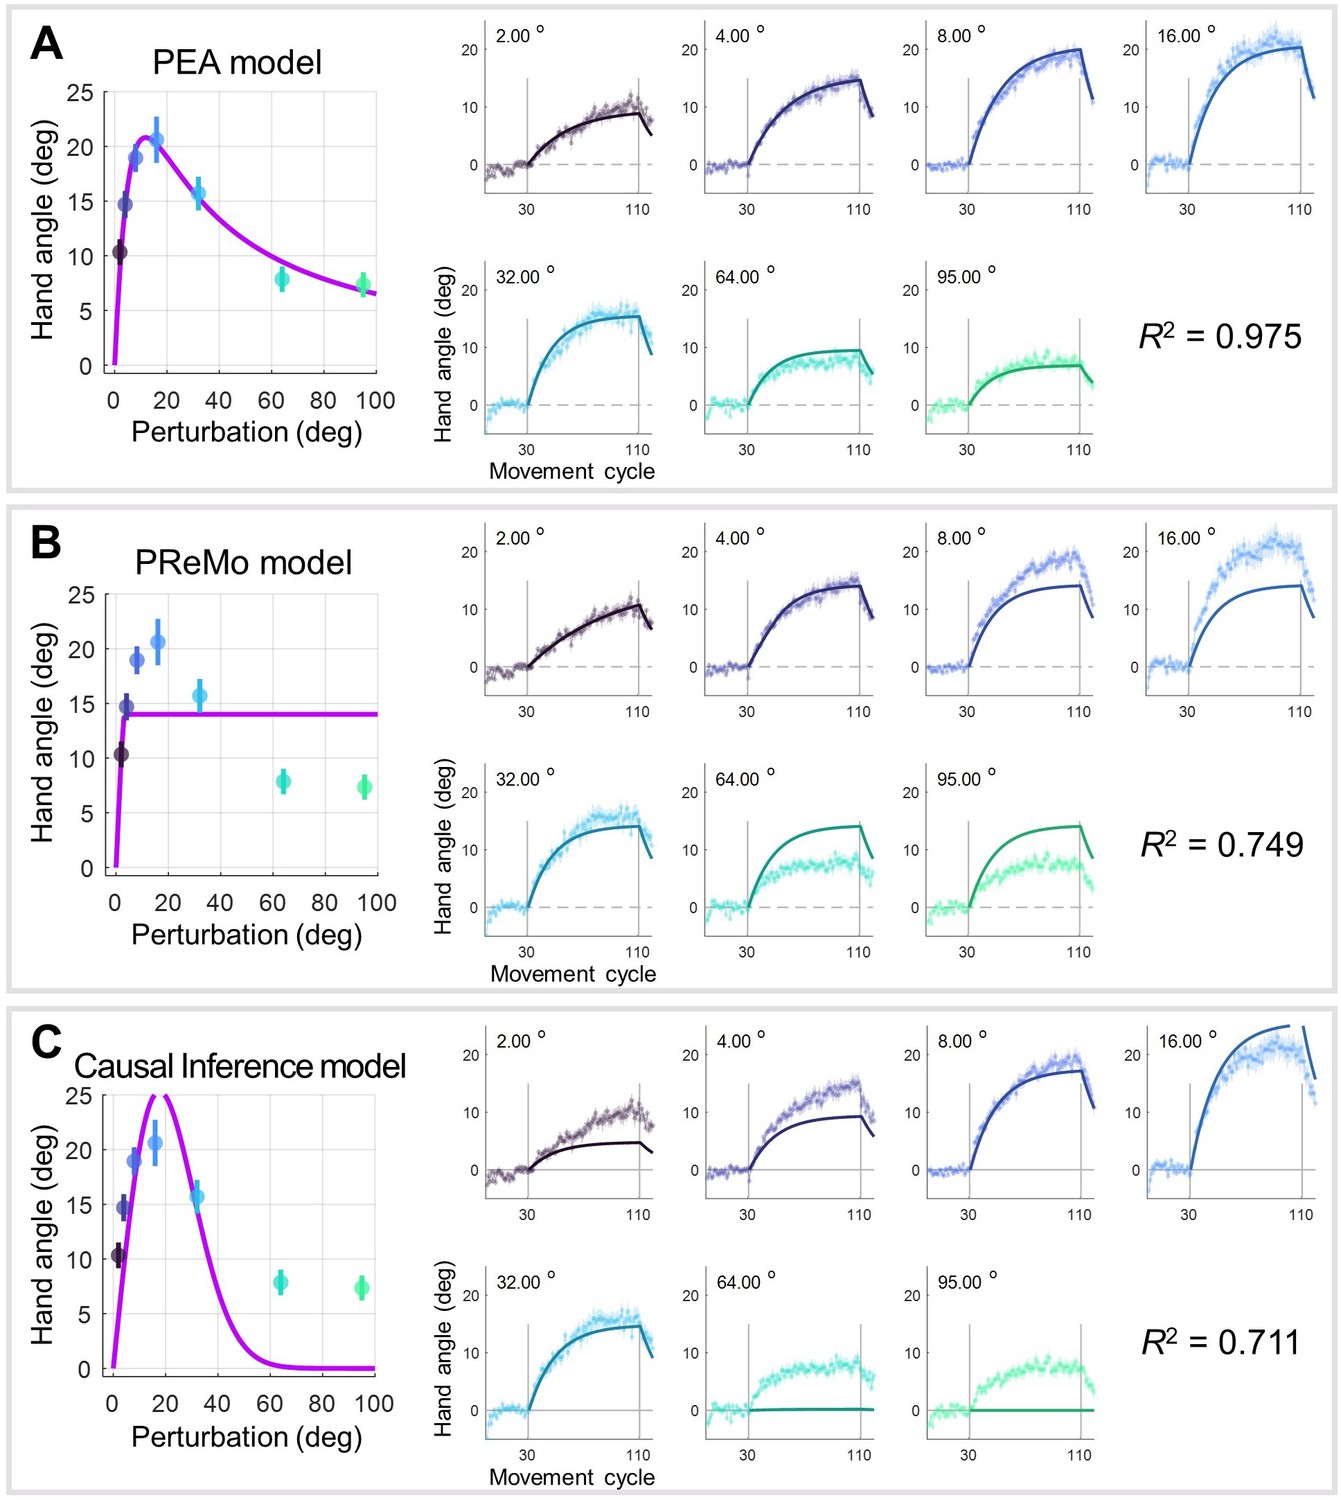
This supplementary figure provides a comprehensive evaluation of the three competing models: the PEA model, the PReMo model, and the causal inference model. (A) Results of PEA Model Fitting: The layout of these plots mirrors that of Figure 3A and B, serving as a direct comparison between the empirical data and the predictions made by the PEA model. (B) Results of PReMo Model Fitting: The left panel is a duplicate of Figure 3C, while the right panel presents the trial-by-trial data fitting. This juxtaposition allows for a nuanced evaluation of the PReMo model’s performance at both the aggregate and individual trial levels. (C) Results of Causal Inference Model: The arrangement of these plots is consistent with panels (A) and (B), facilitating a straightforward comparison of all three models. For a detailed assessment of the quality of model fitting and subsequent model comparisons, please refer to Supplementary file 1a and Supplementary file 1b.
Figure 3—figure supplement 2

Correlation between initial learning rate and adaptation extent in Experiment 2.
For each participant, the initial learning rate is calculated as the change in hand angle between the 1st and 10th cycle, divided by 10. The adaptation extent is defined as the average hand angle across the last 10 adaptation cycles. When pooling data across all perturbation sizes, a significant correlation is observed between the initial learning rate and the adaptation extent.
Figure 3—figure supplement 3
Model fitting of single-trial learning from Experiment 2 of Tsay et al., 2021a.
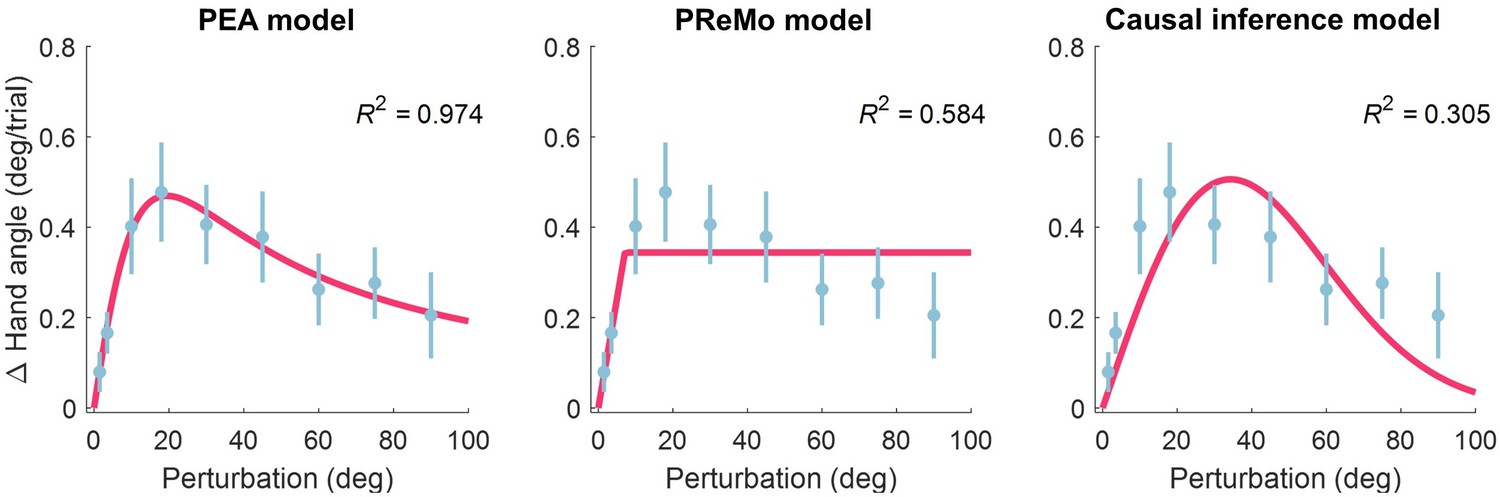
Blue dots represent the mean single-trial learning across varying perturbation size, with error bars denoting standard errors across participants. The left, middle and right panel present the fitting results for the PEA, PReMo, and causal inference models, respectively. For additional details, refer to the Methods, Results, and Supplementary file 1a and b.
Figure 3—figure supplement 4
Alternative Model fitting with PEA for Experiment 2; see details in Appendix 2.
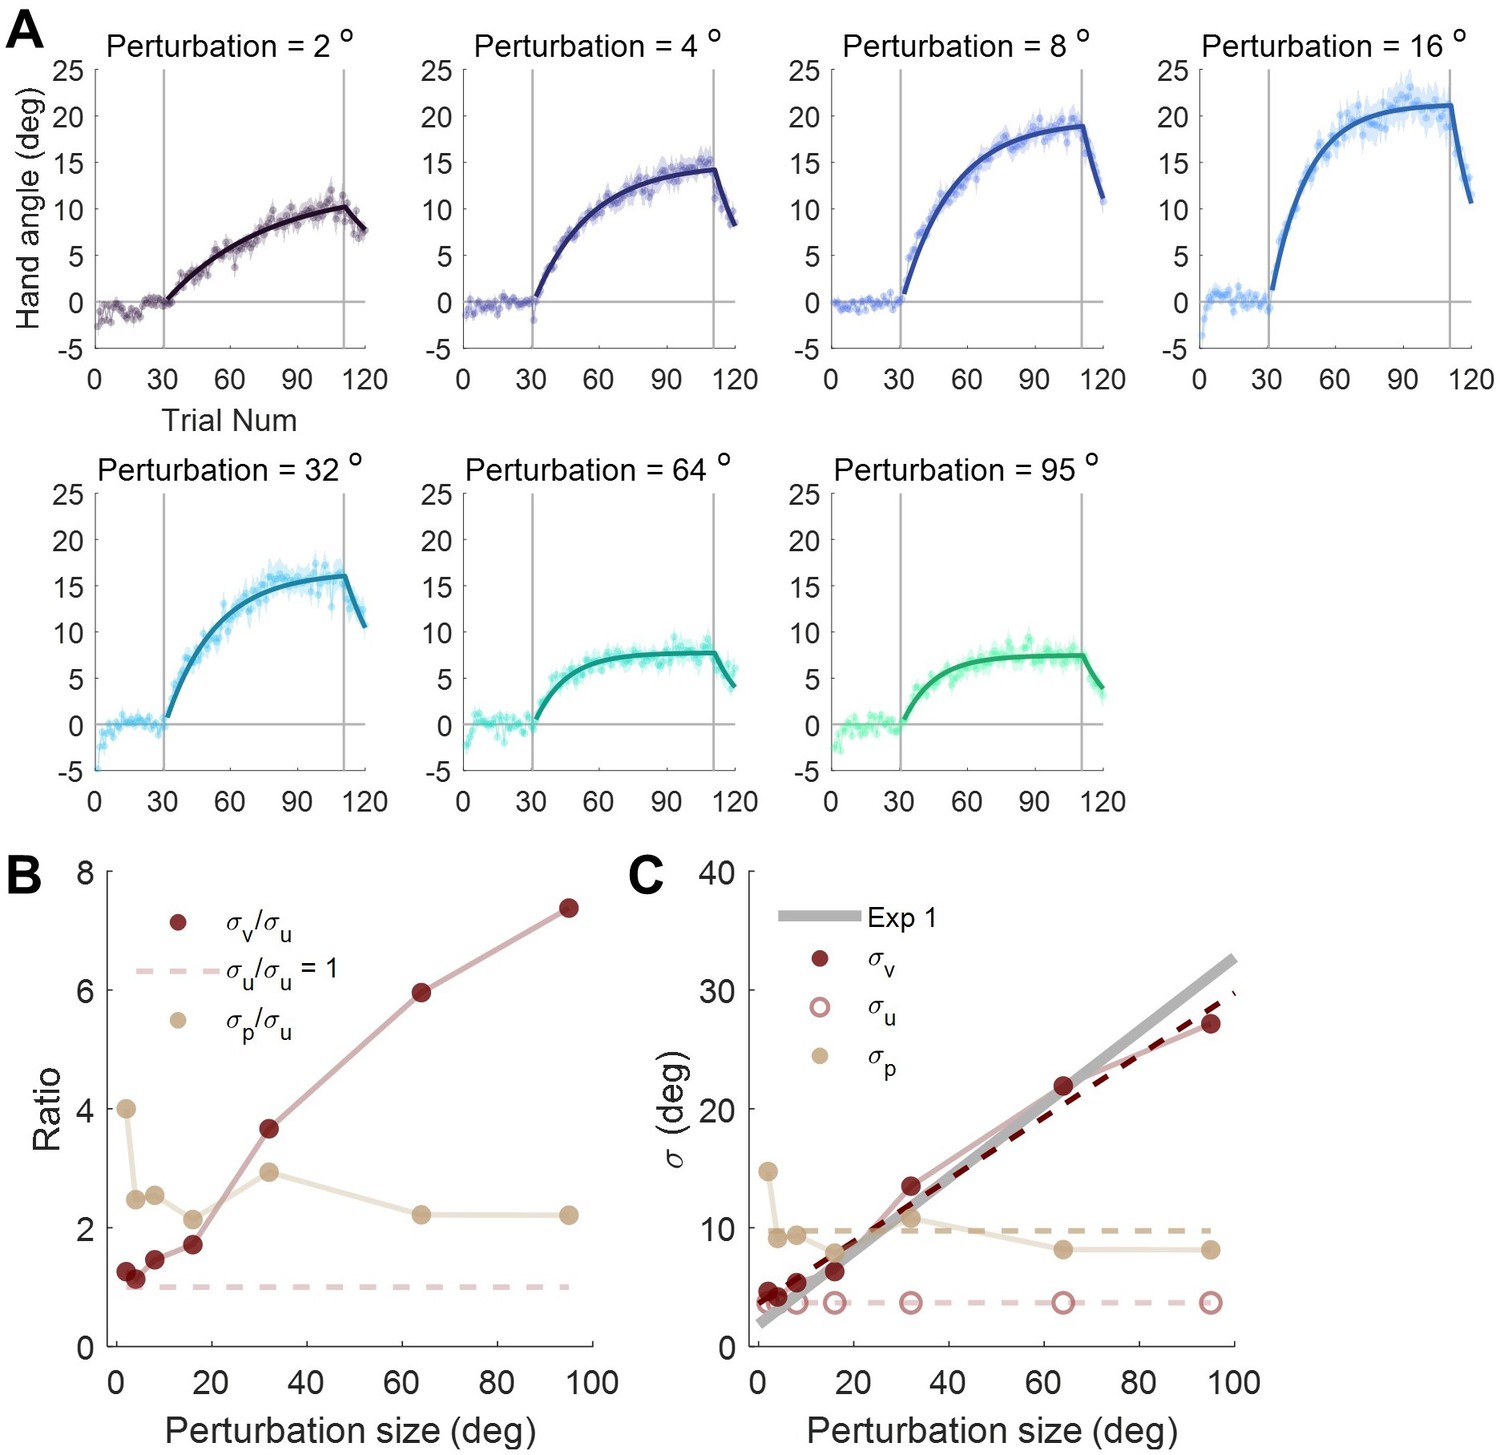
(A) Results of PEA Model Fitting. The layout is similar to Figure 3A and Figure 3—figure supplement 1A. (B) Fitted ratio between uncertainties of different cues. (C) Estimated actual value of uncertainties of different cues.
Figure 4 with 1 supplement
Proprioceptive data fitting and results from Experiment 3.
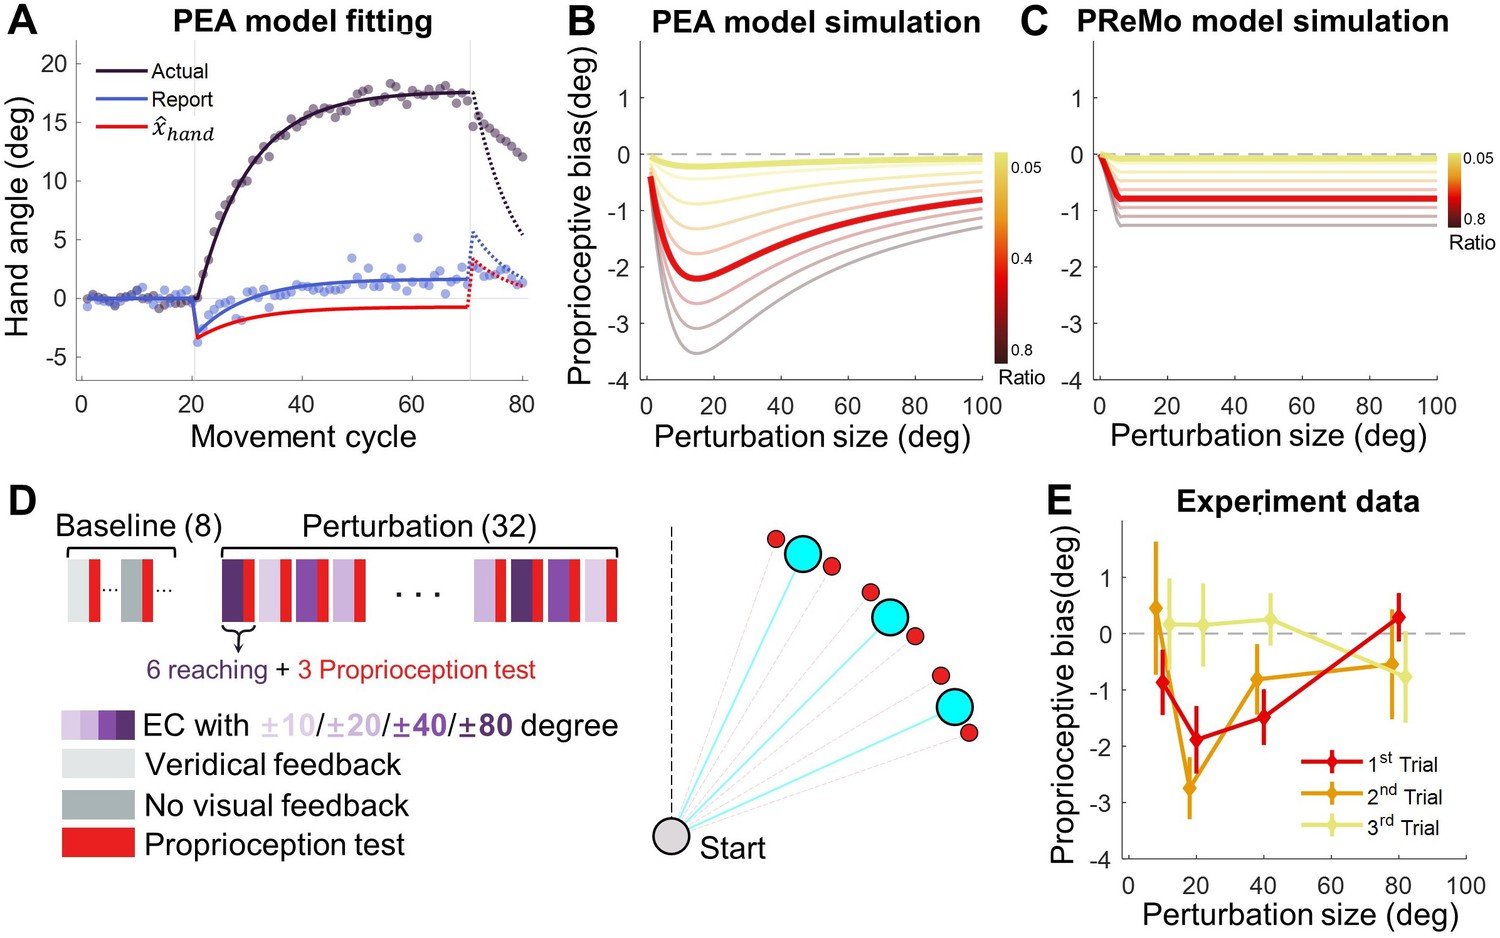
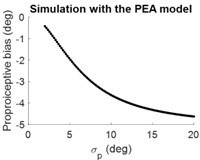
(A) The data from Tsay et al., 2020 are presented alongside the fitting of the PEA model. Participants adapting to a 30° error-clamp perturbation were required to report the location of their adapted hand using visual aids of numbers. The report was provided when the hand stayed at the end of movement. Initially, the proprioceptive estimate of the hand is biased toward the visual cursor (negative in the plot) and then gradually shifts toward the hand (positive in the plot). This trend is accurately captured by the PEA model: lines represent model fitting results, with the adapted hand direction in indigo and the reported hand direction in blue. The hand direction estimate ( , Equation 1) following a reach movement is shown in red. (B–C) Model simulations for proprioceptive bias from the PEA and PReMo models. Color gradients denote the simulations with varying ratio between the weights of and , the two cues available for estimating the hand direction. Note that the two models prescribe distinct profiles for the dependency of proprioception bias on perturbation size. (D) Experimental design. A reaching block, either with or without visual perturbations, is followed by a proprioception test block. The size and direction of the visual perturbation vary across blocks. The proprioception test is conducted when the hand is passively moved to a target (red dots) situated near the reaching target (blue dots). (E) The observed proprioceptive bias as a function of perturbation size (n = 11). Data from the three proprioception test trials are separately plotted. The first trial reveals proprioception biases that form a concave function of perturbation size.
Figure 4—figure supplement 1
Proprioception uncertainty estimation results.
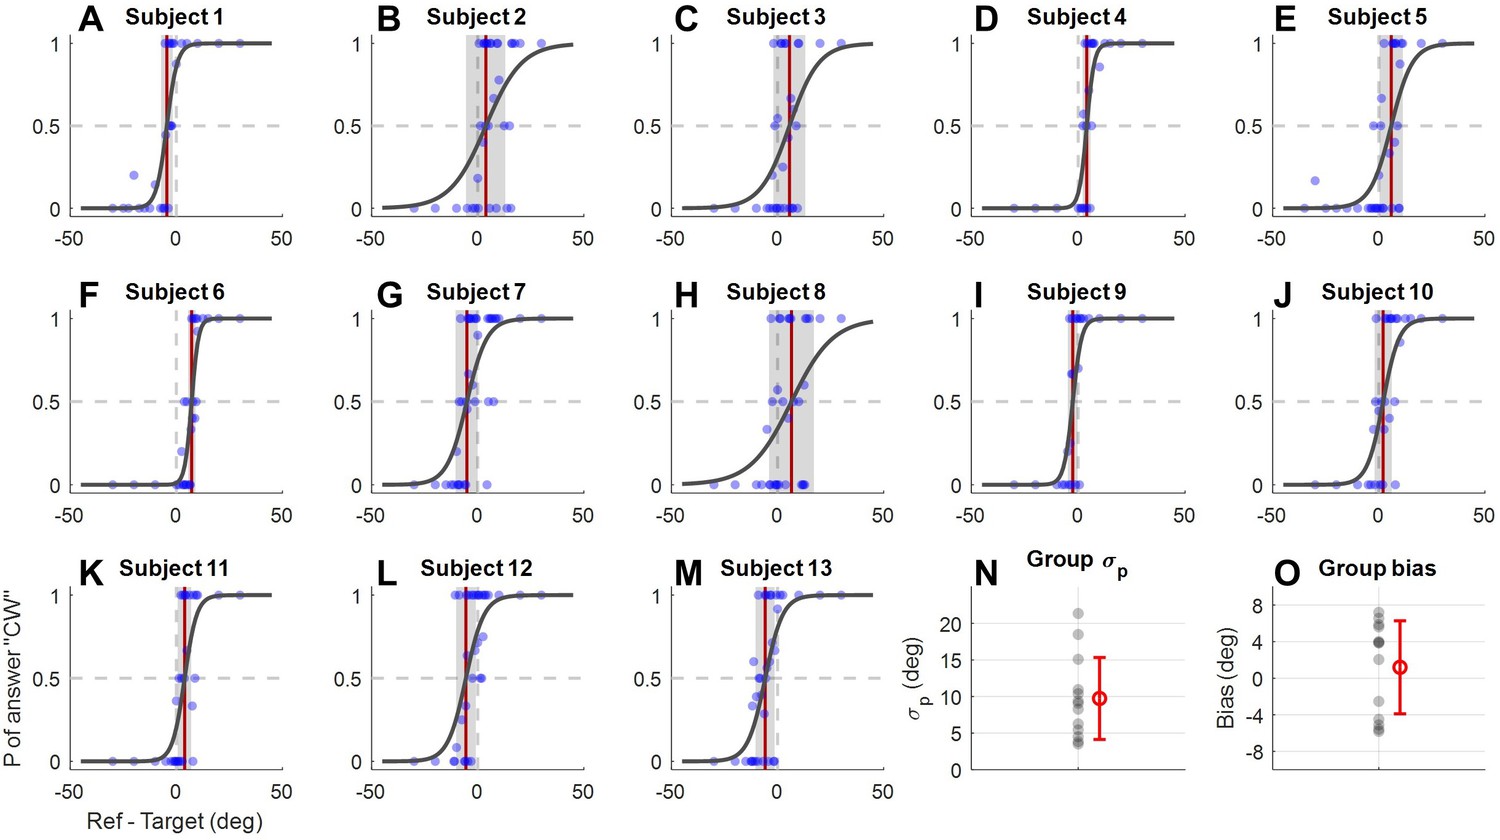
Thirteen participants from Experiment 1 participated in a proprioception discrimination task to measure their proprioceptive uncertainty in the setting of the error-clamp adaptation. The setup paralleled that used for estimating visual uncertainty in Experiment 1. In each trial, participants initially held their hand at the starting position. They were instructed to relax their arm while the experimenter, seated on the other side of the monitor, pulled their hand to a proprioceptive target near the straight-ahead target. The arms of the experimenter and the participant were blocked from the view of the participant. After 0.8 s, a yellow reference point appeared. The angular deviation between the participant’s hand and this reference was determined using the same PEST procedure employed in Experiment 1. Participants indicated, by pressing left or right arrow keys by their left hand, whether the reference point appeared on the CW or CCW side of their actual right-hand position. The maximum deviation allowed was 30°, with an initial step size of 10° and a stop threshold of 0.5°. This task was conducted over six runs across 3 consecutive days. Similar to Figure 2—figure supplement 2, panel (A) to (M) show the psychometric curves for each participant with data from the 3 days pooled together. (N) and (O) present the measured proprioceptive uncertainty and bias for all participants (gray dots) and their mean ± standard deviation (red error bars).
Figure 5
Results of Experiment 4.
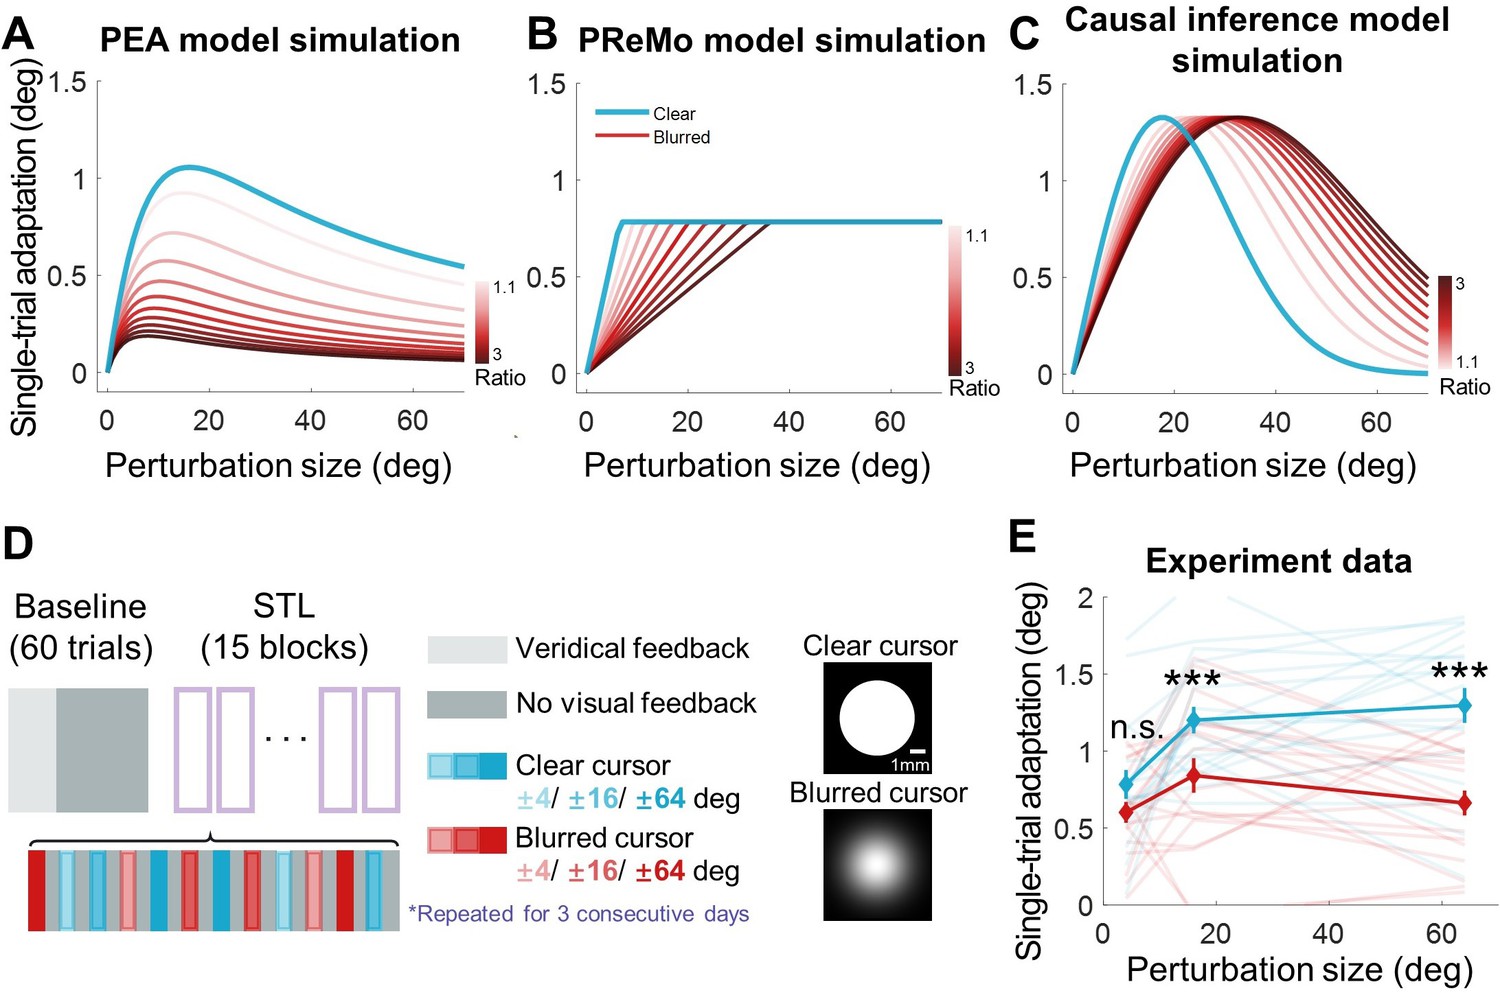
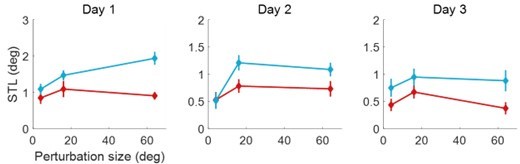
(A–C) Model simulations for single-trial learning under different visual uncertainty levels, shown separately for the PEA, PReMo and causal inference models. Blue curves represent simulated learning based on model parameters estimated from Experiment 2. Curves with red gradient indicate simulations with increasing levels of visual uncertainty, color coded by the ratio of visual uncertainty for the blurred cursor to that of the clear cursor. (D) Experimental design. Following 60 baseline trials without perturbations, participants completed 15 mini-blocks of error-clamp adaptation over three successive days. Each mini-block features 12 different types of error-clamp perturbations, distinguished by two cursor presentations (blurred or clear cursor) and six clamp sizes. Each perturbation trial, varied randomly in perturbation type, is flanked by two no-feedback trials. The change in hand direction between these two no-feedback trials serves to quantify singe-trial learning. (E) The single-trial learning with the blurred cursor is less than that with the clear cursor, but the difference is non-monotonic across perturbation size (n = 19, *** denote p<0.001).
Figure 6
Design of Experiment 1.
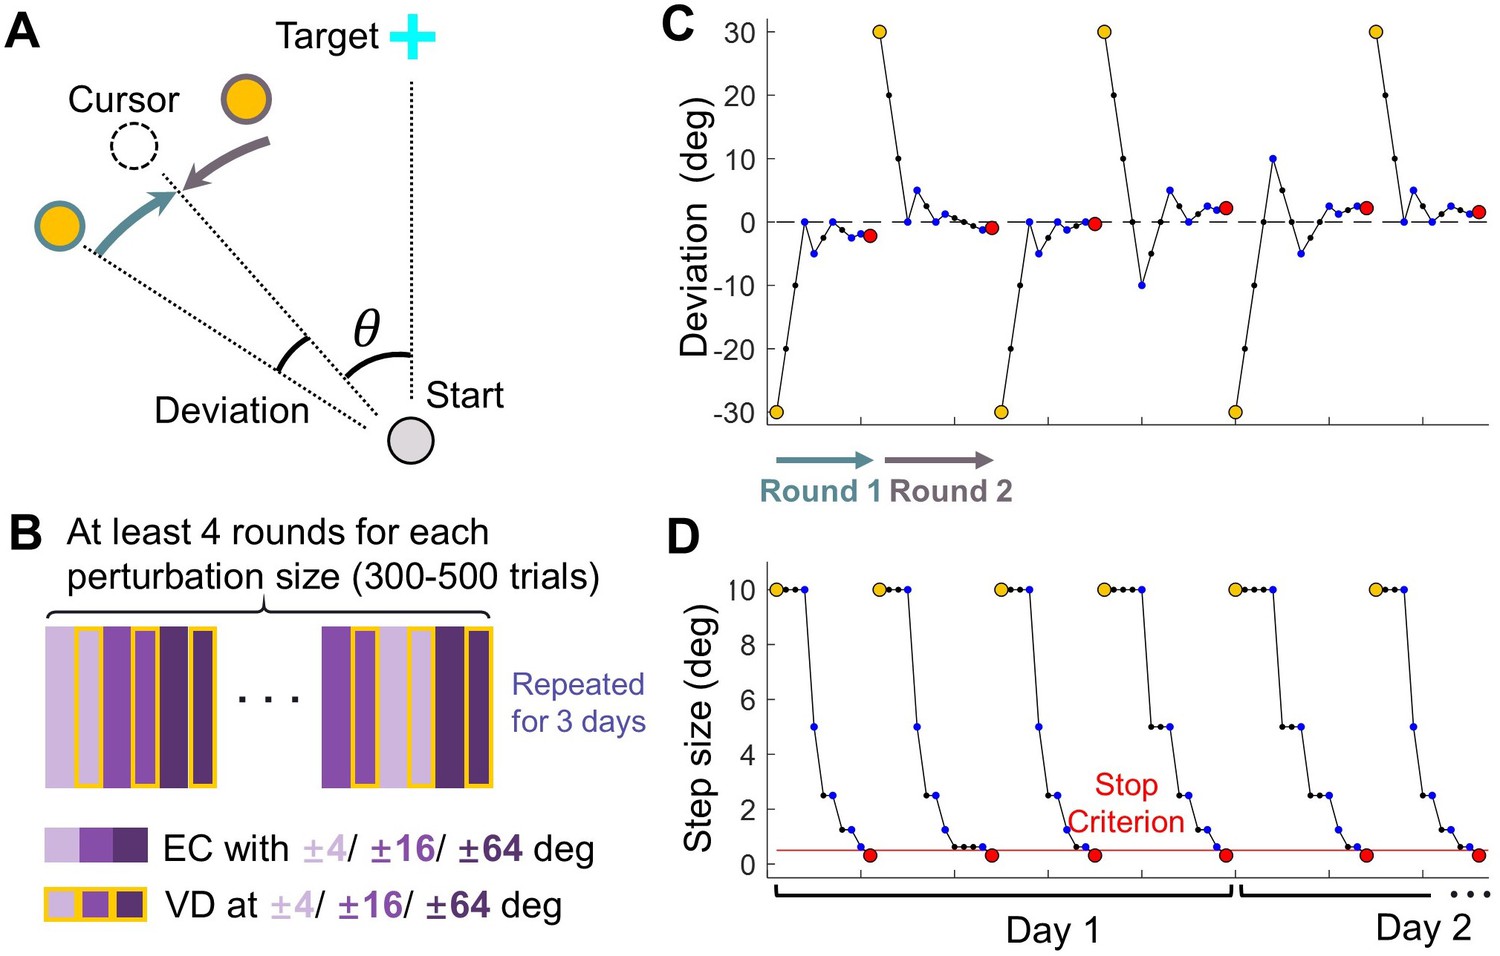
(A) Top-down view of the setup in visual discrimination task. The reference point (yellow) was presented either CW or CCW relative to the clamped cursor (dashed circle), which has a perturbation size θ. (B) Trial structure of the visual discrimination task. Purple rectangles represent error-clamped trials with varying perturbation size, rectangles with yellow edges represent the ensuing visual discrimination test for each perturbation size. (C–D) Exemplary sequences of the reference point: These sequences illustrate the deviation of the reference point from the cursor (C) and the changing step size across trials (D), following the PEST algorithm. Individual trials are represented by blue dots. Yellow and red dots mark the initiation and termination of each round of trials, respectively. In each round, the reference point starts on either the CW or CCW side of the cursor; In the subsequent round, it starts on the opposite side.
Figure 7
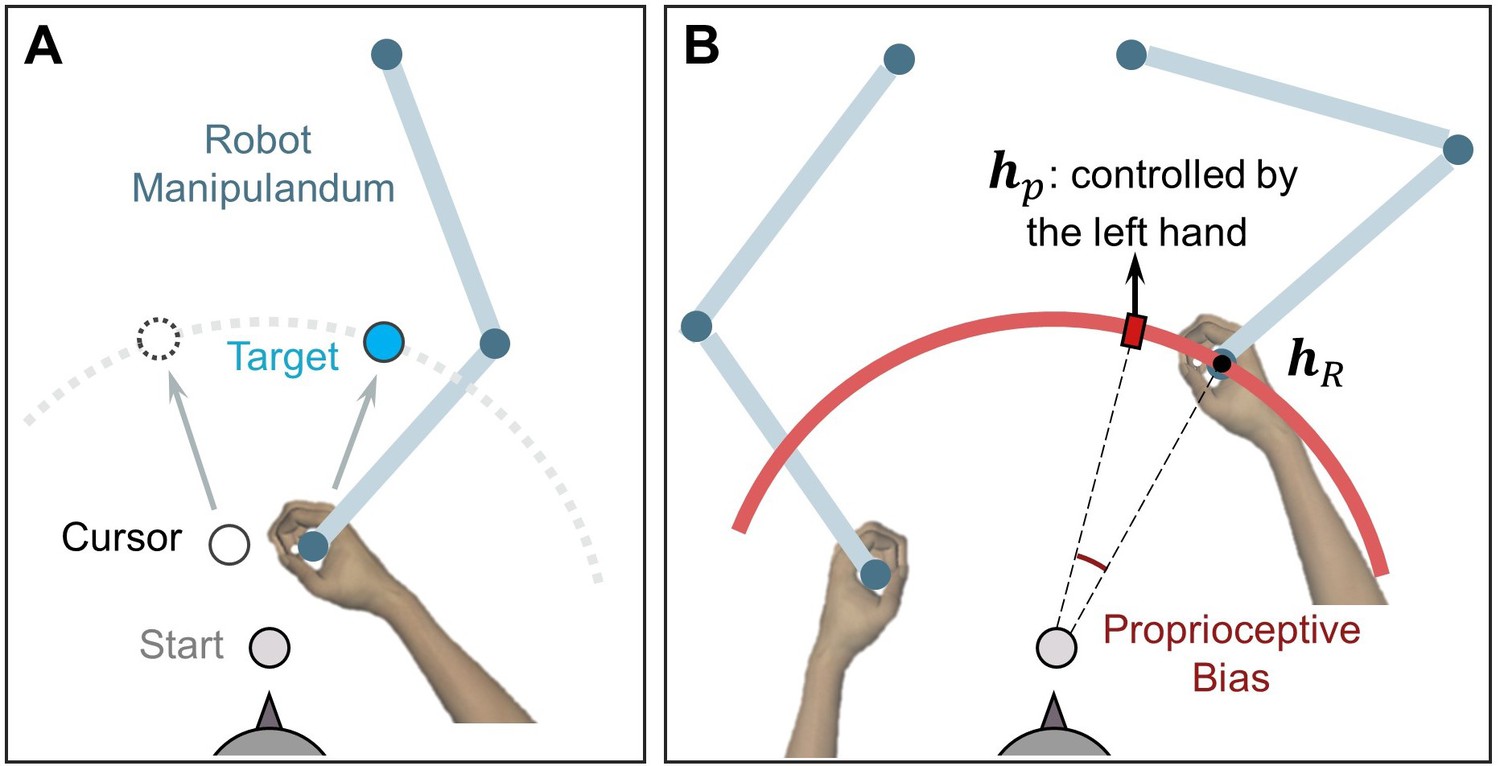
Setup for measuring proprioceptive recalibration in Experiment 3.
(A) Reaching movement with error-clamped cursor, performed by the right hand holding a robot handle. (B) Passive movement in the proprioception test. The right hand was passively moved to the unseen target (hr), depicted here as a small black dot. A red hollow circle with an expanding radius appears on the screen during passive movement, signaling the increasing distance between the hand and the start position. Subsequently, participants used their left hand to report the right-hand location (hp) by aligning a red rectangle on the red circle, which is displayed at the target distance.
Author response image 1
Author response image 2
Author response image 3
Author response image 4
Additional files
-
Supplementary file 1
Model fitting results and model comparisons.
(a) Model fitting and simulation parameters with the PEA model. (b) Model comparisons.
- https://cdn.elifesciences.org/articles/94608/elife-94608-supp1-v1.docx
-
MDAR checklist
- https://cdn.elifesciences.org/articles/94608/elife-94608-mdarchecklist1-v1.docx
Download links
A two-part list of links to download the article, or parts of the article, in various formats.
Downloads (link to download the article as PDF)
Open citations (links to open the citations from this article in various online reference manager services)
Cite this article (links to download the citations from this article in formats compatible with various reference manager tools)
Perceptual error based on Bayesian cue combination drives implicit motor adaptation
eLife 13:RP94608.
https://doi.org/10.7554/eLife.94608.3


