The molecular logic of Gtr1/2- and Pib2-dependent TORC1 regulation in budding yeast
- Department of Molecular and Cellular Biology, University of Arizona, United States
- Department of Medicine, University of Arizona, United States
- Bio5 Institute, University of Arizona, United States
Figures
Figure 1
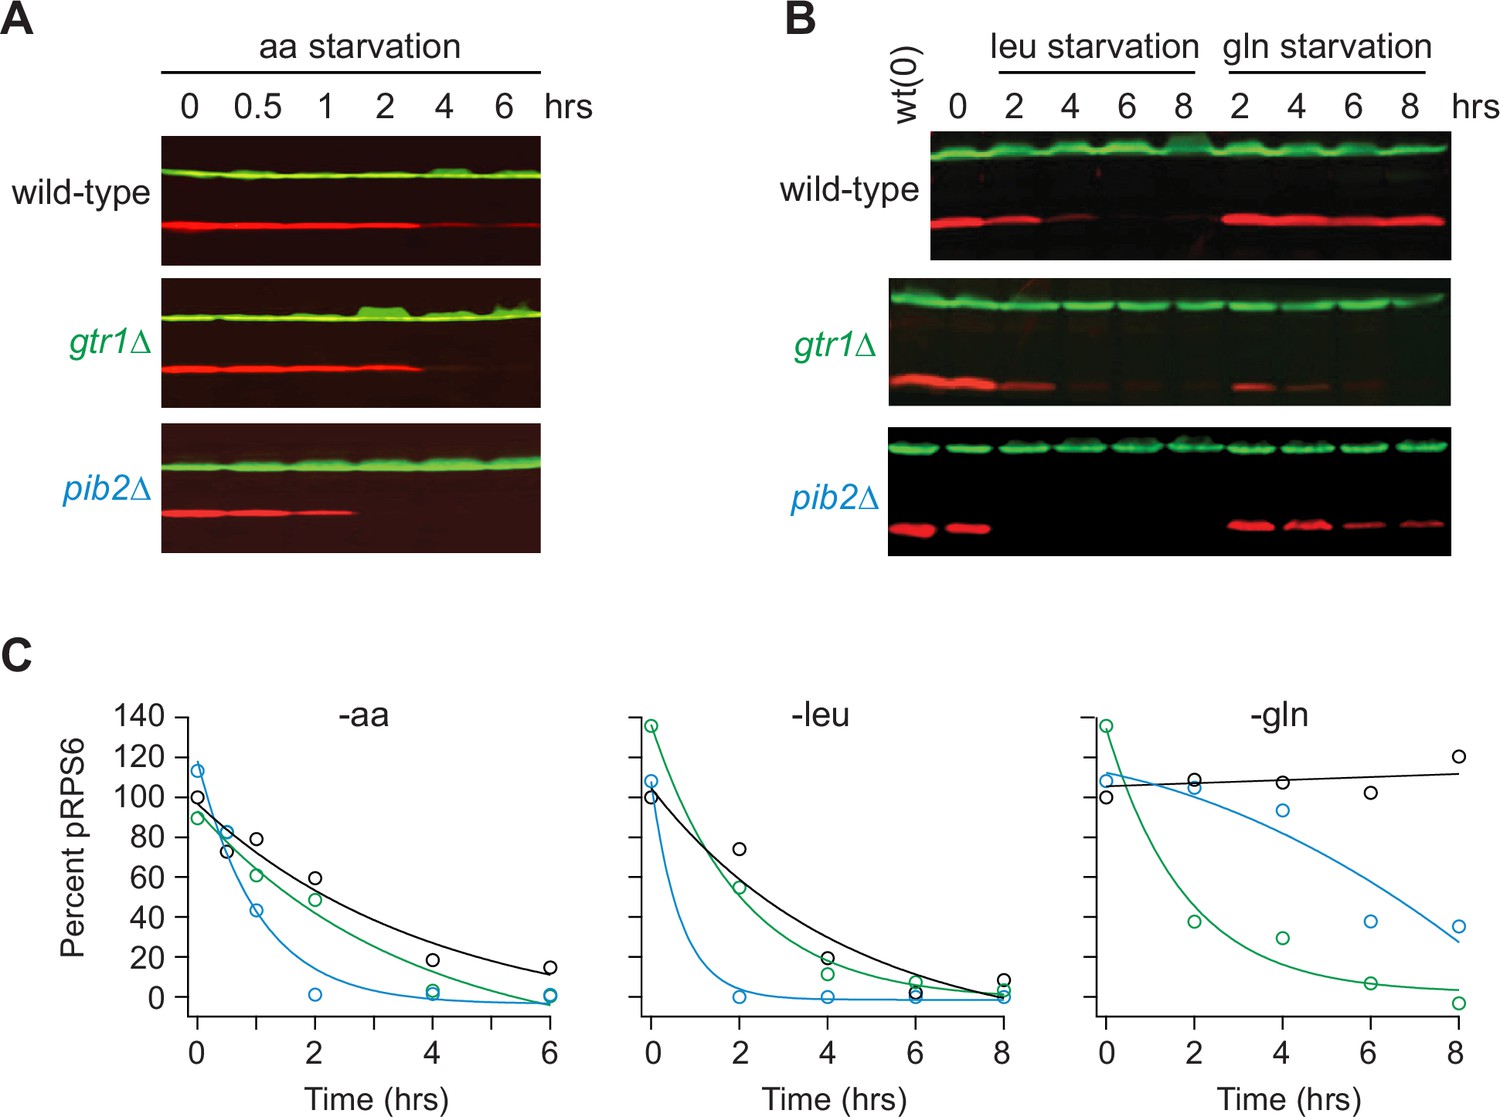
Impact of Gtr1/2 and Pib2 on TORC1 signaling during amino acid starvation.
(A) TORC1 activity measured before and after complete amino acid starvation in wild-type, gtr1∆, and pib2∆ strains using a western blot with anti phospho-Rps6 (red) and anti-PGK (green) antibodies. (B) TORC1 activity measured as in (A) but during leucine and glutamine starvation. Glutamine starvation was triggered by transferring the cells from synthetic complete (SC) medium, to SC medium missing glutamine and containing 2 mM methionine sulfoximine (MSX; a glutamine synthetase inhibitor). Leucine starvation was triggered by transferring the three leu- strains from SC medium to SC medium missing leucine. (C) Values showing the ratio of the p-Rps6 signal divided by the PGK (loading control) signal in each lane from (A) and (B), relative to the value for the wild-type strain at time = 0.
-
Figure 1—source data 1
Original western blots for Figure 1A and B indicating the relevant bands and treatments.
- https://cdn.elifesciences.org/articles/94628/elife-94628-fig1-data1-v1.pdf
-
Figure 1—source data 2
Original files for western blots displayed in Figure 1.
- https://cdn.elifesciences.org/articles/94628/elife-94628-fig1-data2-v1.zip
Figure 2
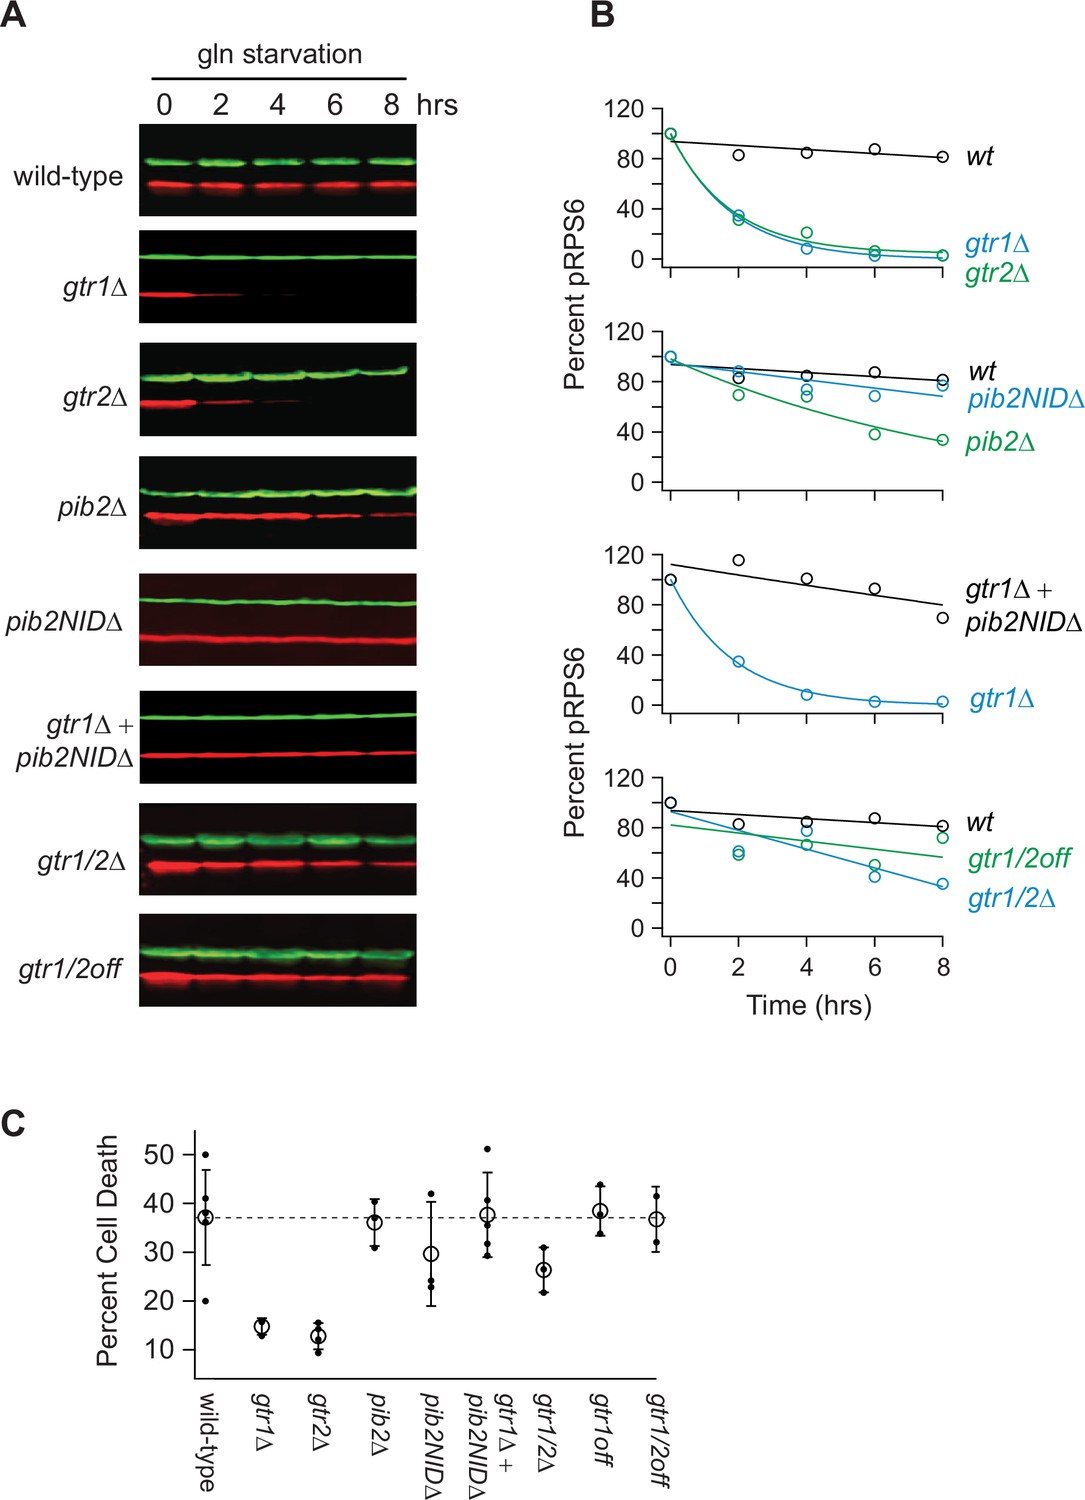
Impact of Gtr1/2 and Pib2 on TORC1 signaling during glutamine starvation.
(A) TORC1 activity measured during glutamine starvation in gtr1∆, gtr2∆, pib2∆, pib2NID∆, gtr1∆pib2NID∆, gtr1∆gtr2∆, and gtr1/2off strains using a western blot, as described in Figure 1. (B) Values showing the ratio of the p-Rps6 signal divided by the PGK (loading control) signal in each lane from (A) relative to the value for the wild-type strain at time = 0. (C) Fraction of cells that are dead after 6 h of glutamine starvation for each strain listed in (B) as measured using SYTOX green labeling and a fluorescence microscope. The open circles and error bars show the average and standard deviation from four replicates (filled circles), with >200 cells analyzed per replicate, per strain.
-
Figure 2—source data 1
Original western blots for Figure 2A, indicating the relevant bands and treatments.
- https://cdn.elifesciences.org/articles/94628/elife-94628-fig2-data1-v1.pdf
-
Figure 2—source data 2
Original files for western blots displayed in Figure 2.
- https://cdn.elifesciences.org/articles/94628/elife-94628-fig2-data2-v1.zip
Figure 3
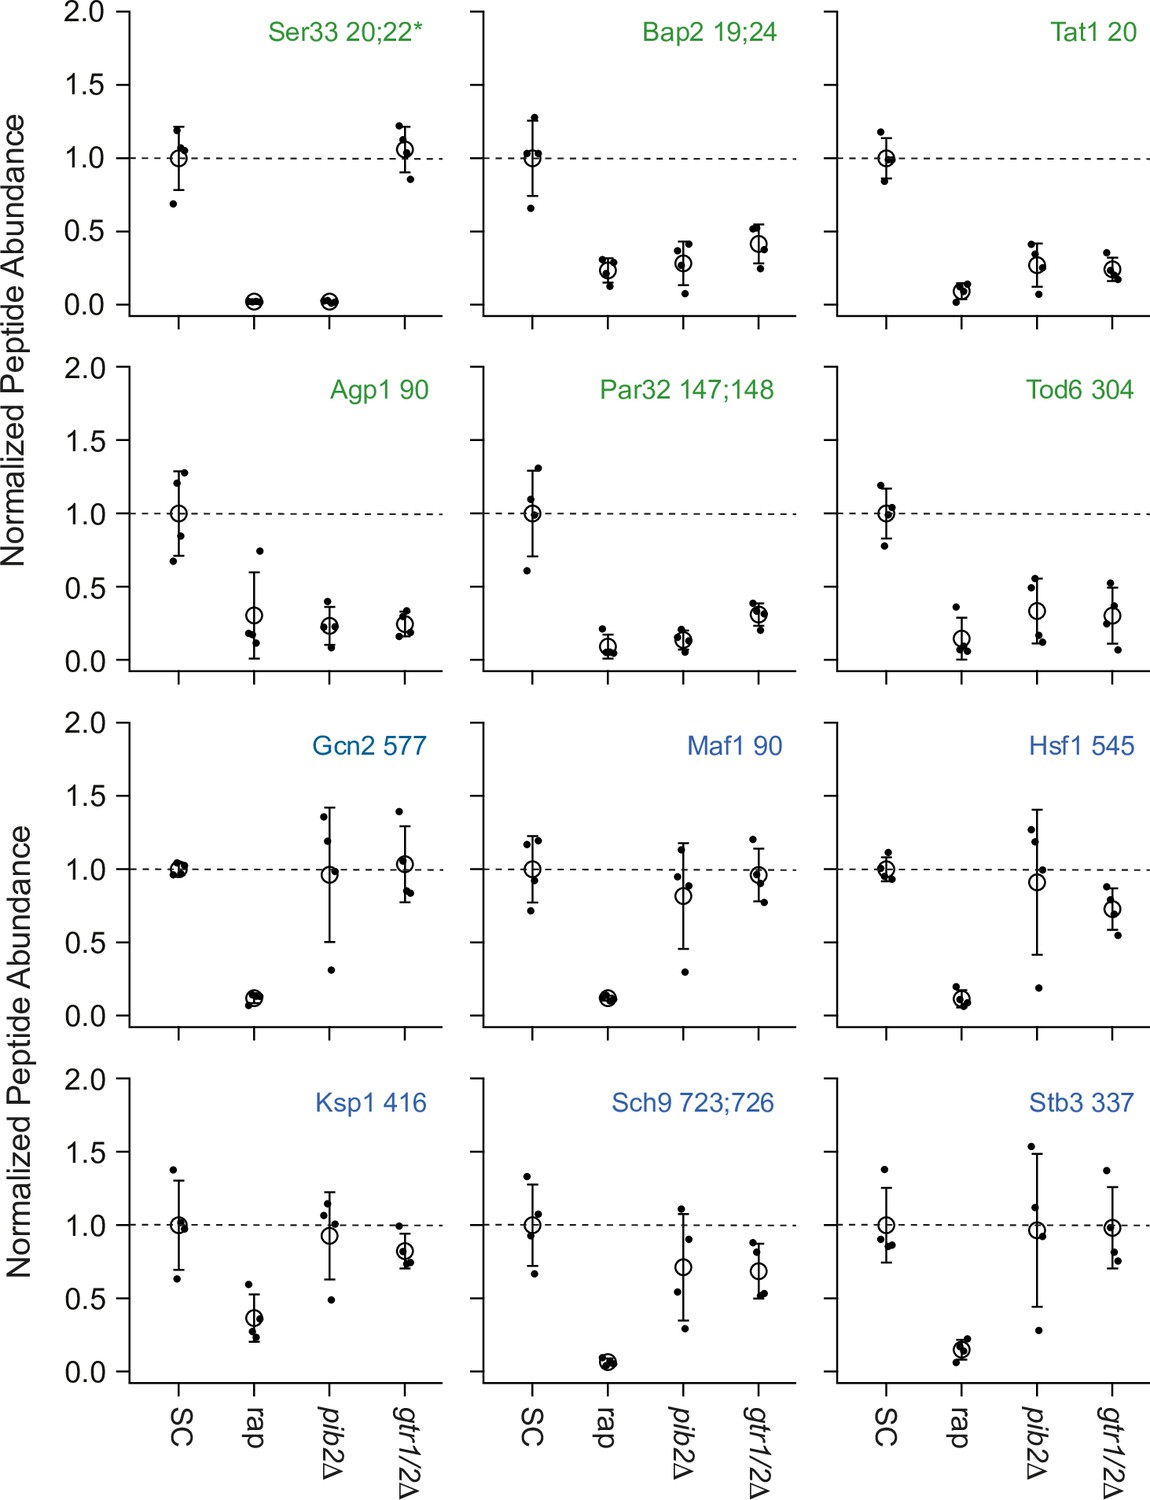
Impact of rapamycin, Gtr1/2 deletion, and Pib2 deletion on select TORC1-dependent phosphopeptides.
Normalized peptide abundance for select phosphopeptides extracted from wild-type cells growing in synthetic complete (SC) medium, wild-type cells growing in SC medium and treated with 200 nM rapamycin for 30 min, or pib2∆ or gtr1∆gtr2∆ cells growing in SC medium (as labeled). The open circles and error bars show the average and standard deviation from four replicates (filled circles), and all data is divided by the average signal (for the relevant peptide) in the wild-type strain growing in SC medium. The phosphopeptides are named based on the protein they are from, followed by the number of the phosphorylated residue(s). Entries with an asterisk (*) indicate that there are other possible phosphorylation site assignments (see Supplementary file 1). Phosphopeptides labeled in green (top panels) change significantly in the pib2∆ and/or gtr1∆gtr2∆ backgrounds.
Figure 4 with 2 supplements
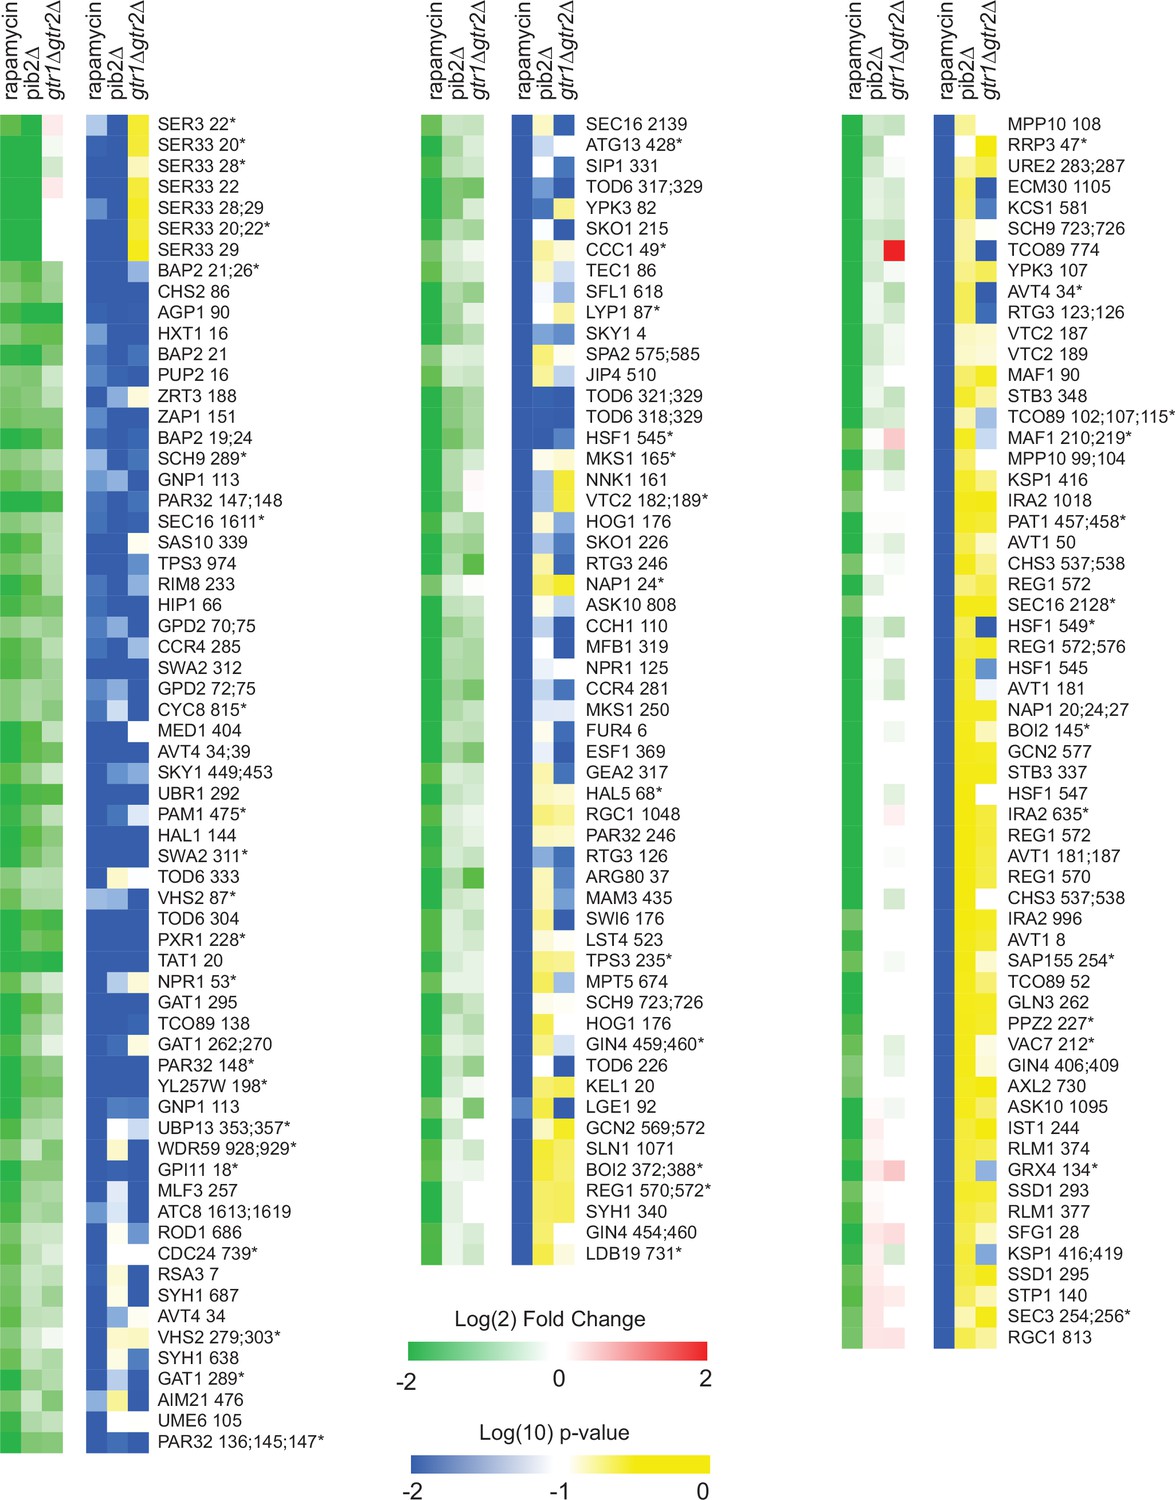
Phosphopeptides significantly downregulated in rapamycin.
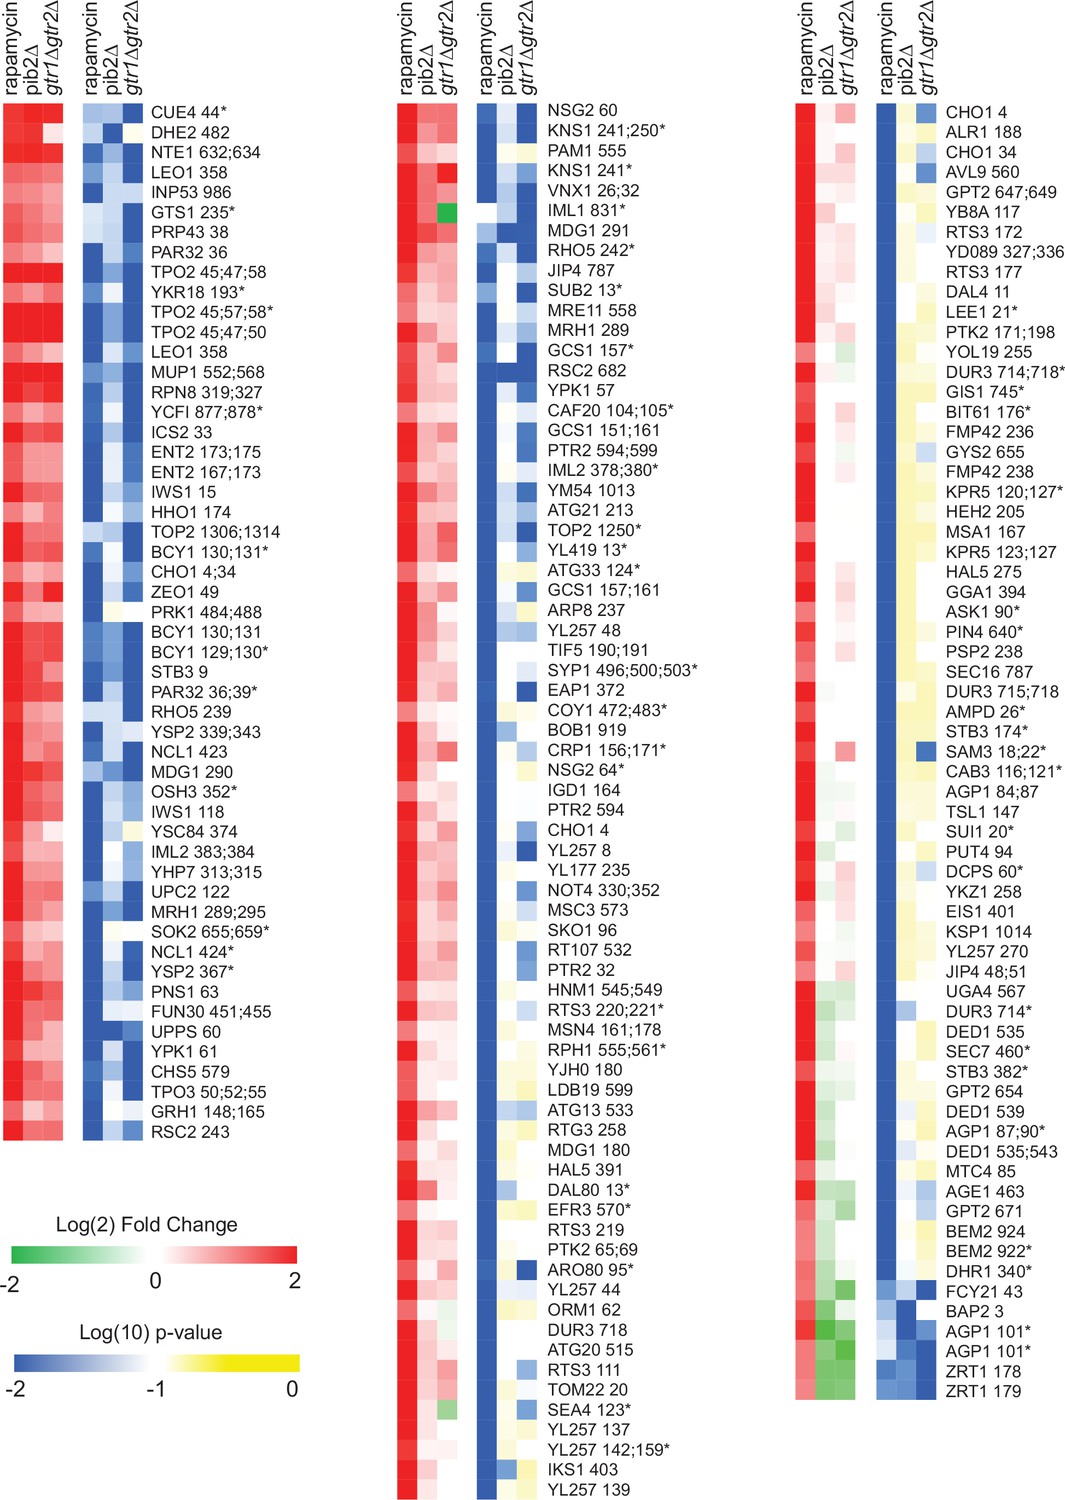
Heatmap showing the abundance of all the phosphopeptides that are downregulated in rapamycin more than twofold with p-value <0.01; t-test. Columns 1–3 (green-red) show the peptide levels after 30-min rapamycin treatment, in the pib2∆ strain growing in synthetic complete (SC) medium, and in the gtr1∆gtr2∆ strain growing in SC medium (as labeled), all compared to those in the wild-type strain growing in SC medium. The values are the average from four replicate experiments. Columns 4–6 (blue-yellow) show the statistical significance of any change in columns 1–3 based on a t-test. The expression data is ordered based on the fraction of the rapamycin response found in the pib2Δ strain (top left, to bottom right). The phosphopeptides are named based on the protein they are from, followed by the number of the phosphorylated residue(s). Entries with an asterisk (*) indicate that there are other possible phosphorylation site assignments (see Supplementary file 1).
Figure 4—figure supplement 1
Phosphopeptides significantly upregulated in rapamycin.
Heatmap showing the abundance of all the phosphopeptides that are upregulated in rapamycin (more than twofold with p-value <0.01; t-test). The figure is laid out as described for Figure 4.
Figure 4—figure supplement 2
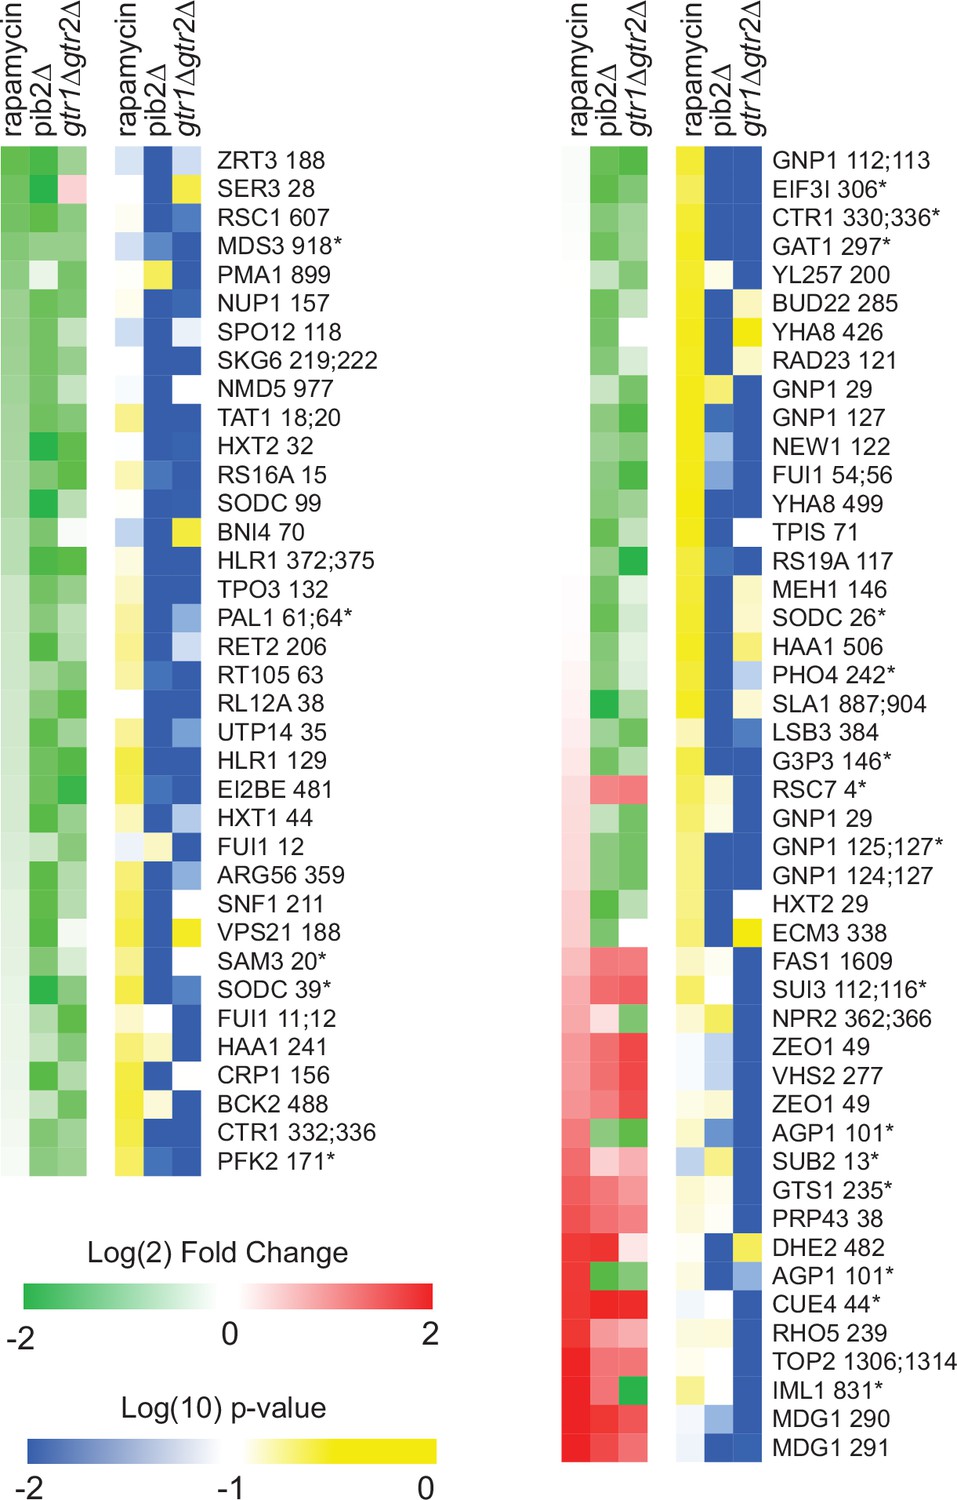
Phosphopeptides significantly up/downregulated by deletion of Gtr1/2 or Pib2 but not by rapamycin.
Heatmap showing the abundance of the phosphopeptides that are up- or downregulated in the Gtr1/2 and/or Pib2 delete strains (more than twofold with p-value<0.01; t-test) but with no statistically significant change in rapamycin treatment (i.e., not assigned to Figure 4 or Figure 4—figure supplement 1). The figure is laid out as described for Figure 4. Note that a significant number of the peptides in this heatmap are sensitive to rapamycin but failed to make the (twofold and p<0.01; t-test) cutoff threshold due to noise (see top left column, and bottom right column). Some of the other data in this heatmap may also represent noise—particularly for the peptides where there is a significant change in the pib2∆ or gtr1∆gtr2∆ strains, but not both. Where there is a bona fide change in the pib2∆ and gtr1∆gtr2∆ strains but no change in rapamycin, for example at the multiple target sites in the glutamine transporter Gnp1 (top and middle, right column), we suspect that there are competing TORC1-dependent regulatory events. The first is a Gtr1/2 and Pib2 sensitive phosphorylation event. The second is a TORC1-repressed (Gtr1/2 and Pib2 insensitive) phosphorylation event. This dual control mechanism could be used to activate/repress proteins during intermediate, but not complete, starvation.
Figure 5 with 1 supplement
Function of, and mechanism underlying, the TORC1- and Pib2-dependent phosphorylation of the phosphoglycerate dehydrogenase Ser33.
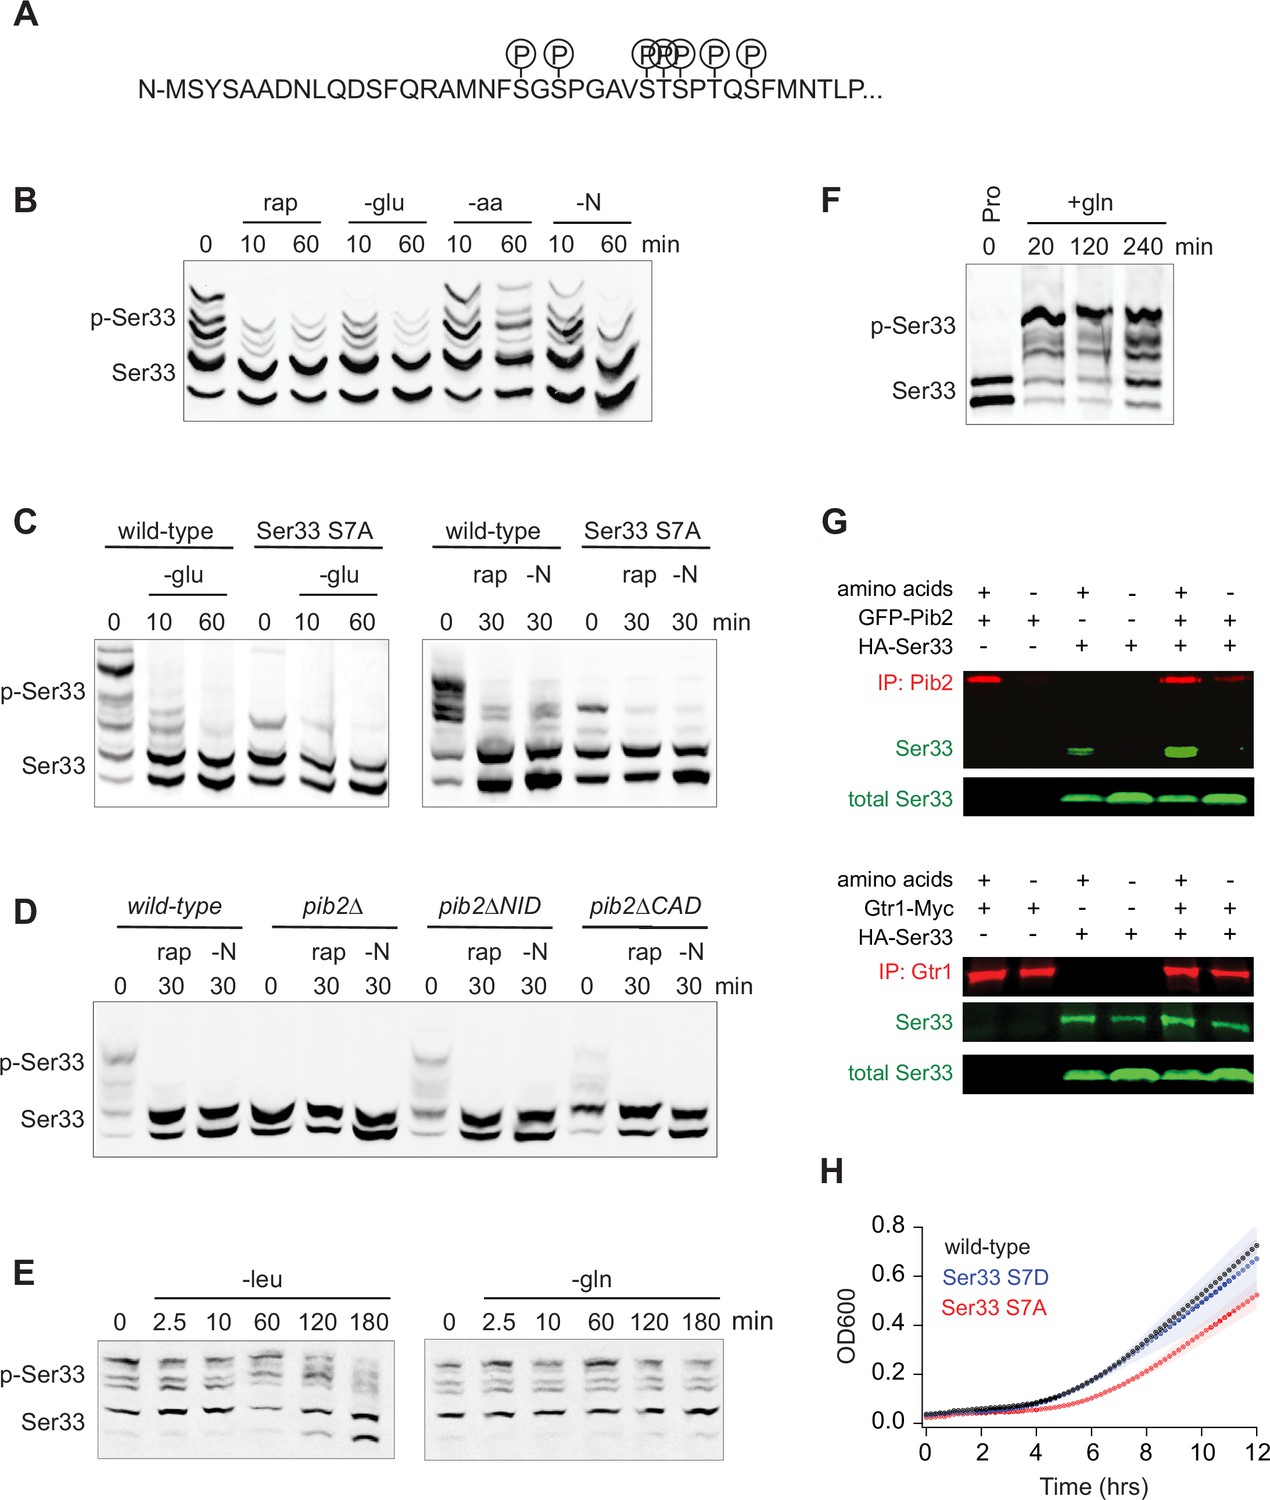
(A) TORC1-dependent phosphorylation sites compiled from global phosphoproteomics data, and mass-spectrometry-based analysis of Ser33 immunopurified from cells in mid-log phase before and after treatment with 200 nM rapamycin. (B) Phos-tag gel measuring Ser33 phosphorylation before and after treatment with 200 nM rapamycin (rap) or starvation for glucose (-glu), amino acids (-aa), or all nitrogen (-N). (C) Phos-tag gel comparing Ser33 phosphorylation in wild-type and Ser33S7A cells following glucose starvation (transfer to synthetic medium +3% lactate), rapamycin treatment, or nitrogen starvation. (D) Phos-tag gel examining Ser33 phosphorylation in wild-type, pib2∆, pib2∆NID, or pib2∆CAD cells during log phase growth (0), after 30 min of rapamycin treatment (rap), or complete nitrogen starvation (-N). (E) Phos-tag gel examining Ser33 phosphorylation in cells grown to mid-log phase and then starved for leucine (left gel) or starved for glutamine and treated with MSX (right gel). (F) Phos-tag gel examining Ser33 phosphorylation in cells grown to mid-log phase in media containing 0.5 g/L proline as the sole nitrogen source and then after addition of 0.5 g/L glutamine to the medium. (G) Co-immunoprecipitations showing an interaction between GFP-Pib2 and Ser33-HA (top panel), but not Gtr1-myc and Ser33-HA (bottom panel). Note we were not able to capture Pib2 from cells exposed to 2 h of amino acid starvation. (H) Growth of wild-type, Ser33S7A, and Ser33S7D strains in synthetic medium missing serine and glycine. Cells were grown overnight in SD medium and then diluted into fresh medium missing serine and glycine at the start of the time course. The lines and color-matched shadows show the average and standard deviation from four replicates. Note that all strains are missing Ser3 to isolate the effect of Ser33.
-
Figure 5—source data 1
Original western blots for Figure 5B–G indicating the relevant bands and treatments.
- https://cdn.elifesciences.org/articles/94628/elife-94628-fig5-data1-v1.pdf
-
Figure 5—source data 2
Original files for western blots displayed in Figure 5.
- https://cdn.elifesciences.org/articles/94628/elife-94628-fig5-data2-v1.zip
Figure 5—figure supplement 1
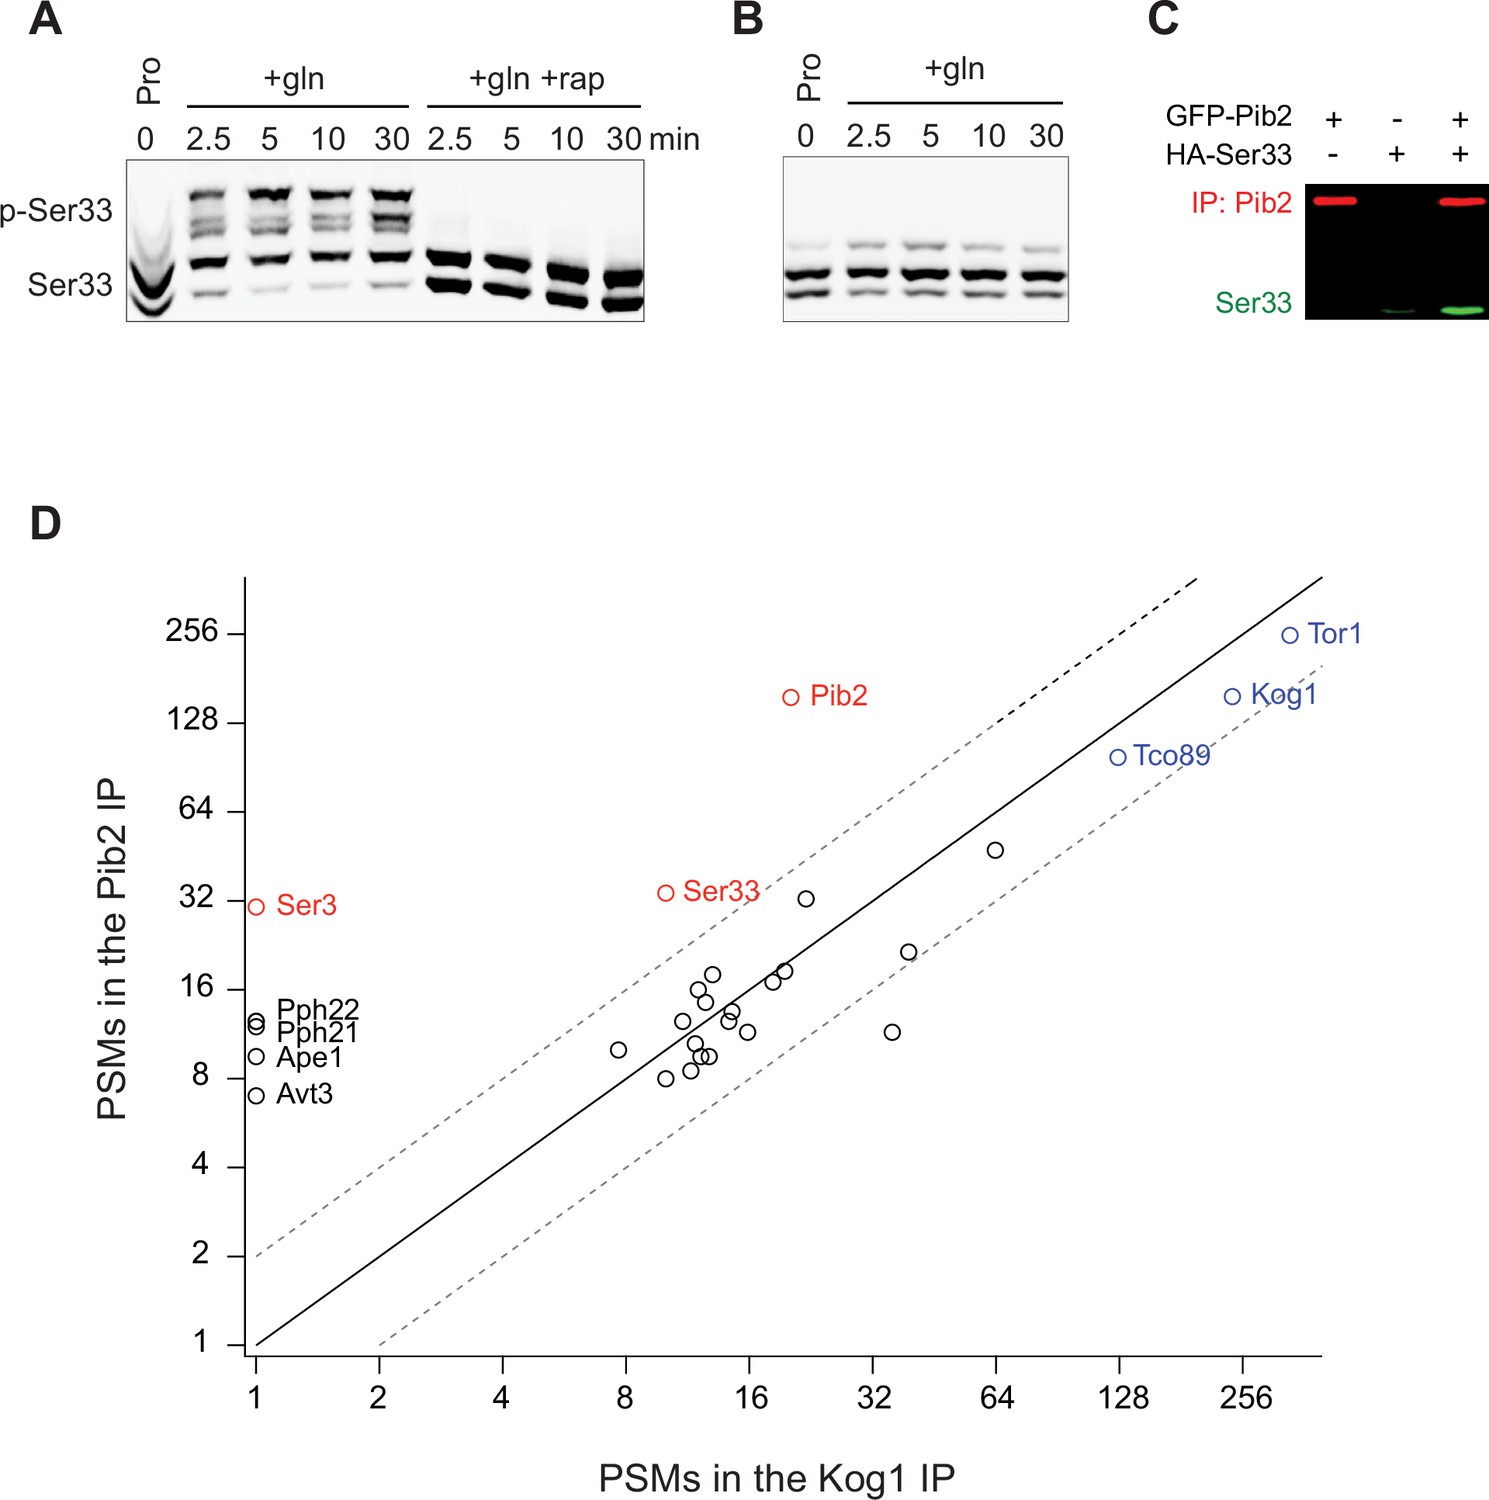
Rapid Ser33 phosphorylation by TORC1 in response to glutamine stimulation and evidence for a direct interaction with Pib2.
(A) Phos-tag gel examining Ser33 phosphorylation in cells grown to mid-log phase in proline medium (time 0) and then after addition of 0.5 g/L glutamine (with or without rapamycin). (B) Phos-tag gel examining the phosphorylation of SER33S7A grown to mid-log phase in proline medium (time 0) and then after addition of 0.5 g/L glutamine. (C) Co-immunoprecipitation showing an interaction between GFP-Pib2 and Ser33-HA during log phase growth (repeat of Figure 5F). (D) Comparison between the amount of 30 proteins captured (as determined by the number of Peptide Spectral Maps) in a Pib2 immunopurification and a Kog1 immunopurification. Proteins are included on the graph if they were captured in both published Pib2 IPs (Wallace et al., 2022) (many proteins are captured in a Kog1 IP, but not a Pib2 IP).
-
Figure 5—figure supplement 1—source data 1
Original western blots for Figure 5—figure supplement 1A–C, indicating the relevant bands and treatments.
- https://cdn.elifesciences.org/articles/94628/elife-94628-fig5-figsupp1-data1-v1.pdf
-
Figure 5—figure supplement 1—source data 2
Original files for western blots displayed in Figure 5—figure supplement 1.
- https://cdn.elifesciences.org/articles/94628/elife-94628-fig5-figsupp1-data2-v1.zip
Figure 6
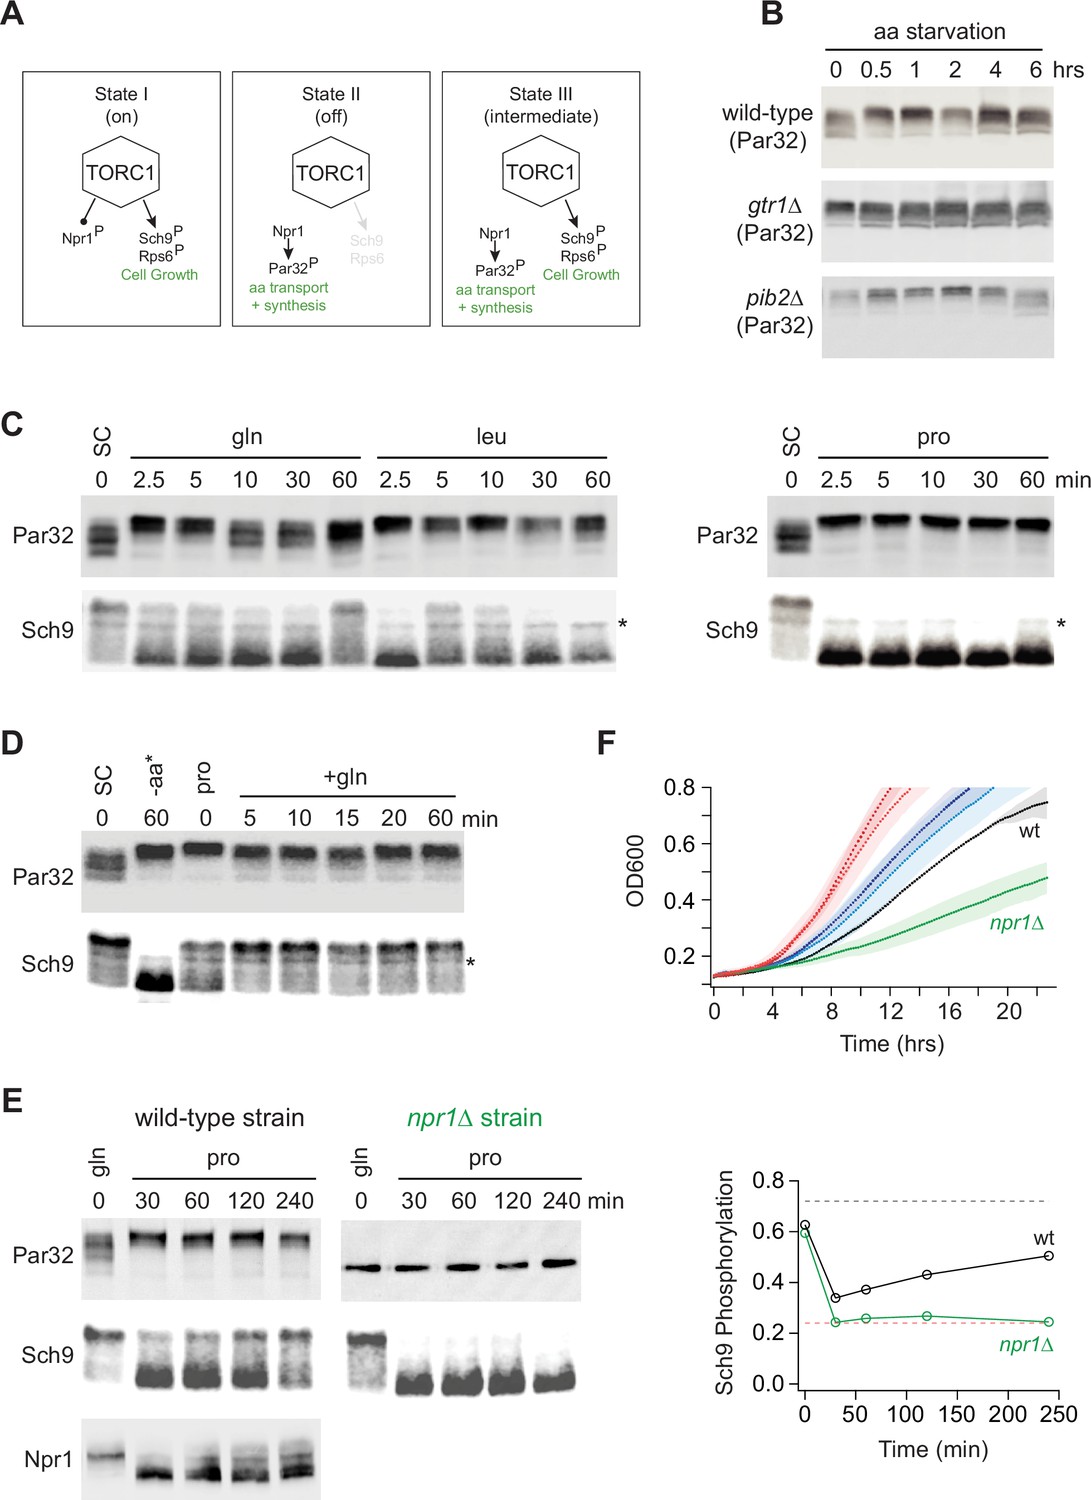
Growth in a poor nitrogen source pushes TORC1 into an intermediate signaling state.
(A) Three-state model of TORC1 signaling as described in the text. (B) Par32 phosphorylation measured by SDS-PAGE mobility shift during complete amino acid starvation in wild-type, gtr1∆, and pib2∆ strains. (C) Par32 and Sch9 phosphorylation in cells grown to mid-log phase in synthetic complete media and then transferred to media containing either glutamine, leucine, or proline as the sole nitrogen source. The asterisk (*) highlights a non-specific band in the western. (D) Par32 and Sch9 phosphorylation in cells grown to mid-log phase in synthetic complete (SC) medium and then exposed to complete amino acid starvation for 60 min (-aa) or grown in medium containing 0.5 g/L proline as the sole nitrogen source (pro) before 0.5 g/L glutamine was added to the culture. (E) Par32 and Sch9 phosphorylation in wild-type cells (left panel) and npr1∆ cells (right panel) grown to mid-log phase in medium containing 0.5 g/L glutamine as the sole nitrogen source (gln), and then transferred to media containing 0.5 g/L proline as the sole nitrogen source. The graphs on the right show the fraction of Sch9 phosphorylated at each time point, quantified by measuring the fraction of the Sch9 signal that runs above the fastest migrating band. The broken black and red lines show the fraction of Sch9 phosphorylated in SD medium, and after 1 h of rapamycin treatment, respectively. (F) Growth of wild-type and npr1∆ cells in SC medium (wild-type dark red, npr1∆ light red), glutamine medium (wild-type dark blue, npr1∆ light blue), and proline medium (wild-type black, npr1∆ green). The lines and color-matched shadows show the average and standard deviation from three replicates.
-
Figure 6—source data 1
Original western blots for Figure 6B–E, indicating the relevant bands and treatments.
- https://cdn.elifesciences.org/articles/94628/elife-94628-fig6-data1-v1.pdf
-
Figure 6—source data 2
Original files for western blots displayed in Figure 6.
- https://cdn.elifesciences.org/articles/94628/elife-94628-fig6-data2-v1.zip
Figure 7
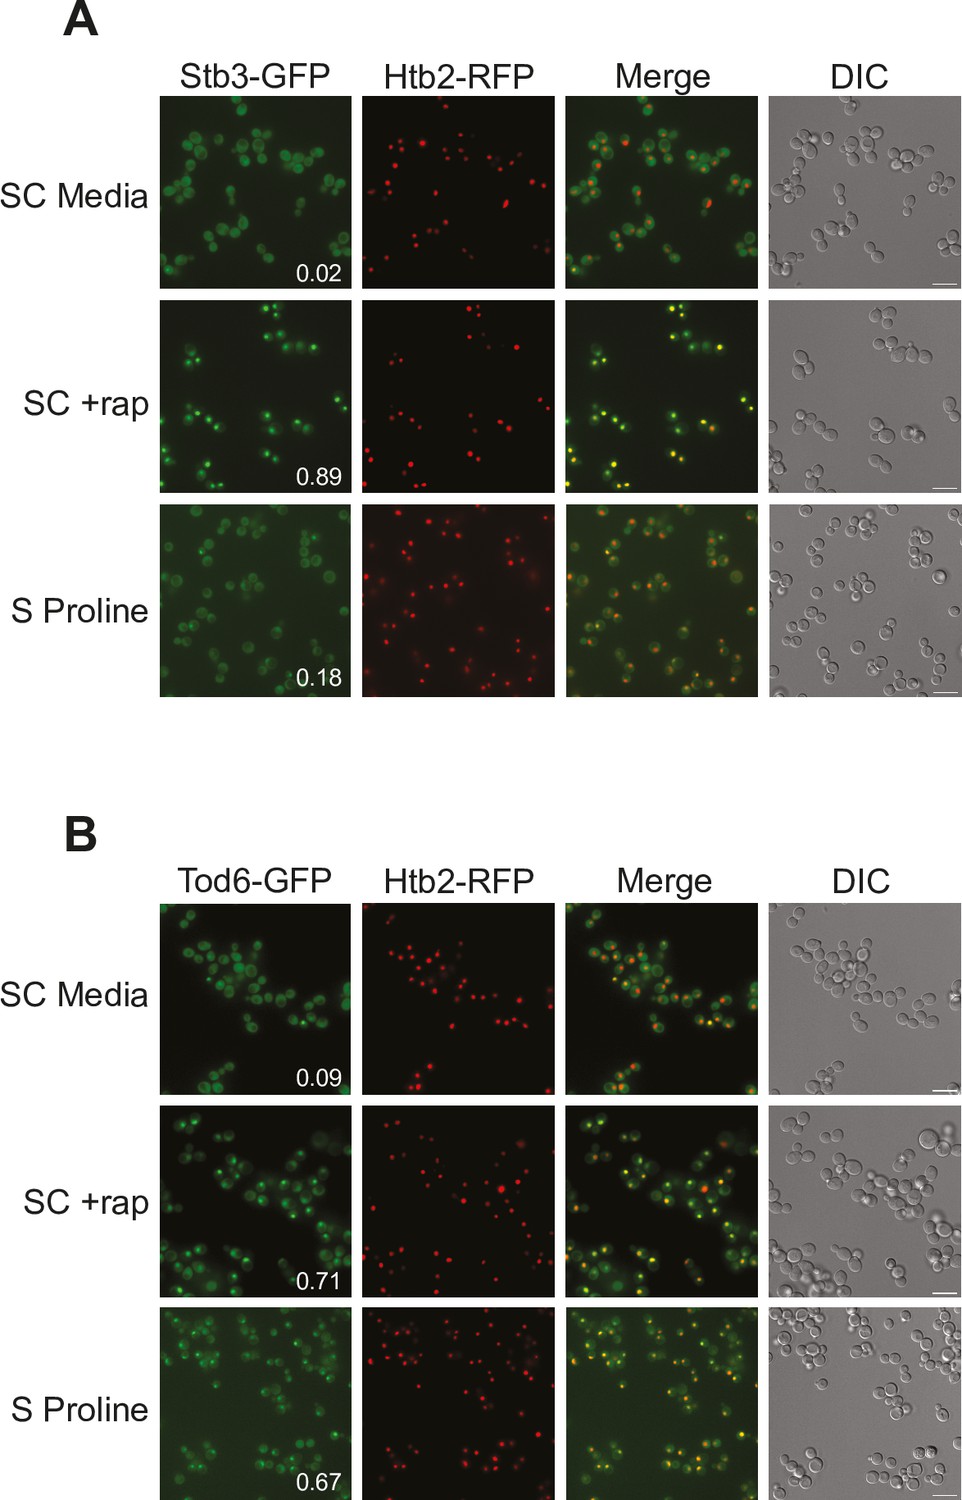
Tod6 moves to the nucleus during growth in a poor-quality nitrogen source.
Localization of Stb3-GFP (A) and Tod6-GFP (B) during mid-log phase in the synthetic complete (SC) medium, following exposure to 200 nM rapamycin for 1 h, and during log phase in media containing 0.5 g/L proline as the sole nitrogen source (as labeled). The Tod6-GFP and Stb3-GFP strains are both prototrophic and carry the nuclear marker, Htb2-RFP, at its native locus. Scale bars (in DIC) are 10 μm. The numbers in the Stb3-GFP and Tod6-GFP panels show the fraction of cells with a strong nuclear GFP signal. In the SD and rapamycin control experiments, these values are from a single experiment examining >200 cells. In the proline experiments the values are an average from three biological replicates, with >200 cells per replicate. In those three replicates, Stb3 was nuclear in 21–17%, and 15% (18 ± 3%) of the cells, while Tod6 was nuclear in 70%, 70%, and 60% (67 ± 6%) of the cells.
Figure 8
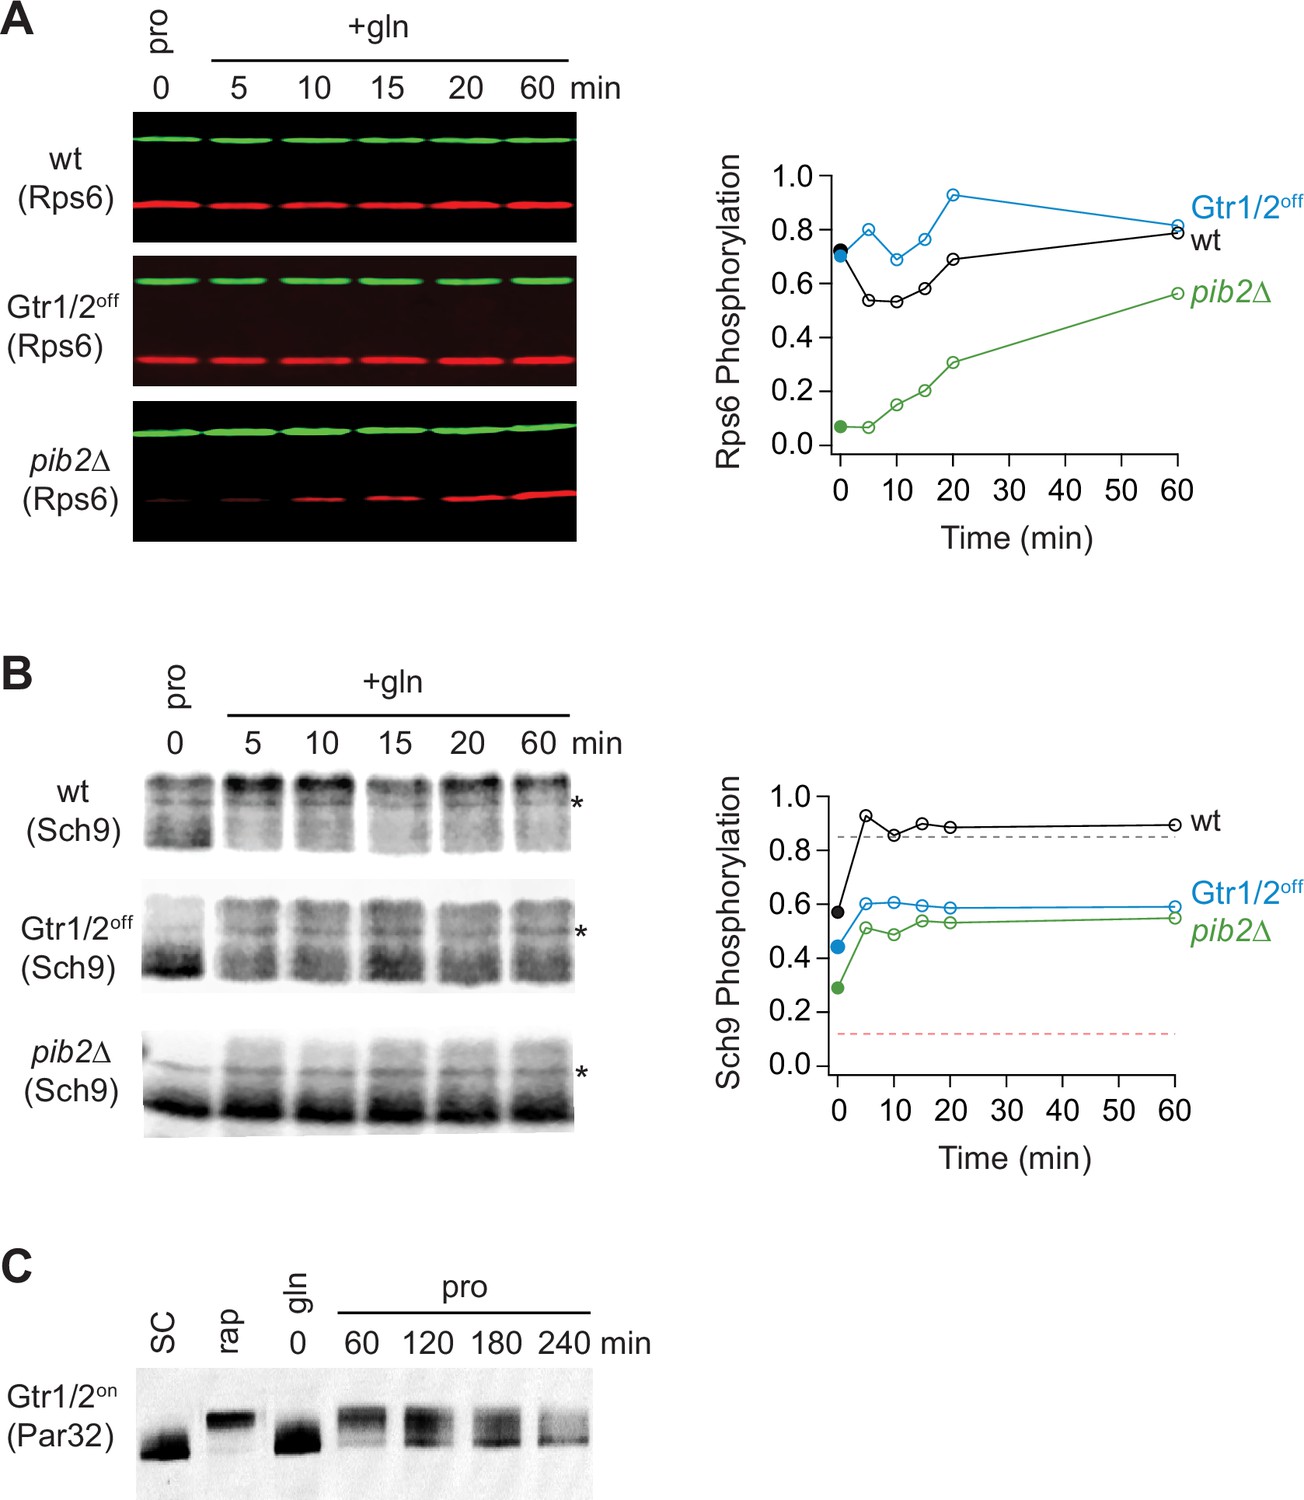
Partial Gtr1/2 inactivation drives TORC1 into the intermediate signaling state.
(A) Rps6 and (B) Sch9 phosphorylation, measured in wild-type, GTR1/2off, and pib2Δ strains, as cells transition from growth in proline medium to growth in glutamine medium. The data are quantified as described in Figures 1 and 6E. Note, wild-type SC samples were included on each gel but were trimmed off the images presented for clarity. (C) Par32 phosphorylation as measured by SDS-PAGE mobility shift in GTR1/2on cells, either grown to mid-log phase in synthetic complete (SC) medium then treated with 200 nM rapamycin, or grown to mid-log phase in glutamine medium and then switched to proline medium (compare to Figure 6E).
-
Figure 8—source data 1
Original western blots for Figure 8A–C, indicating the relevant bands and treatments.
- https://cdn.elifesciences.org/articles/94628/elife-94628-fig8-data1-v1.pdf
-
Figure 8—source data 2
Original files for western blots displayed in Figure 8.
- https://cdn.elifesciences.org/articles/94628/elife-94628-fig8-data2-v1.zip
Figure 9
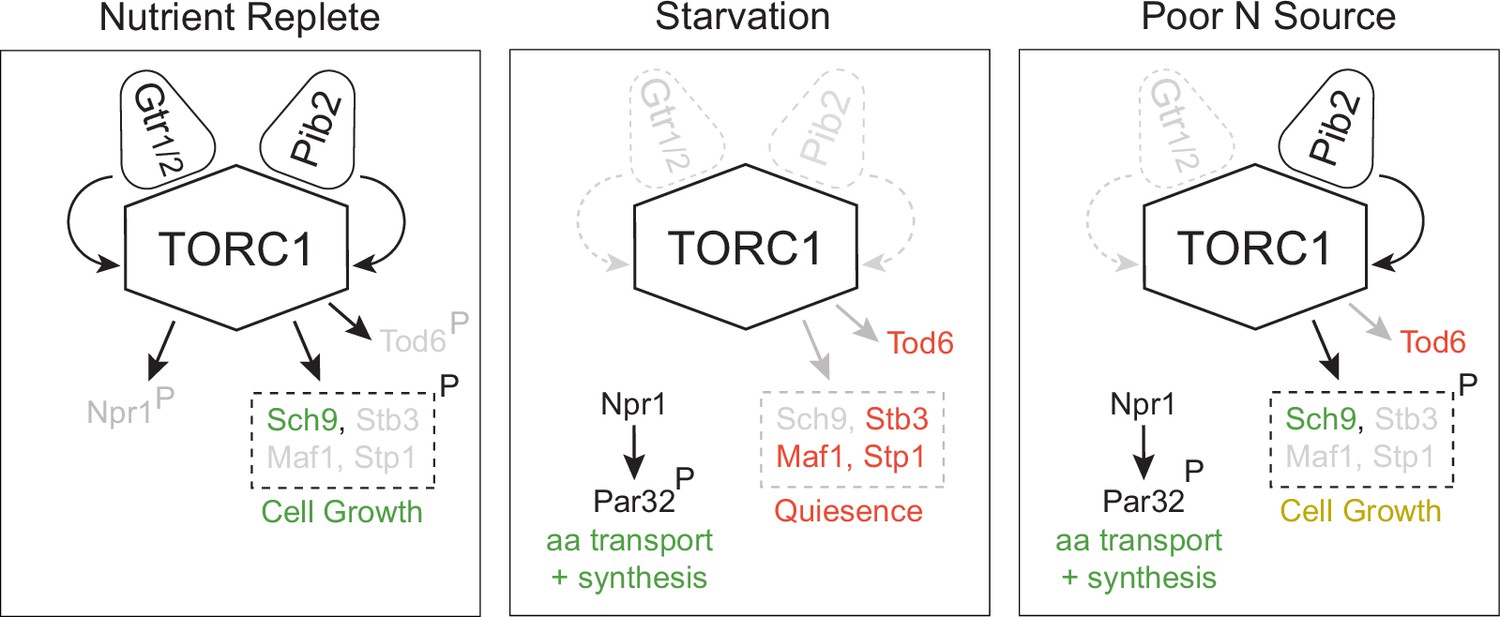
Three-state signaling through the TORC1 pathway.
Schema describing the three signaling states of the TORC1 pathway, as described in the text. Gray arrows and names show inactive signaling events and proteins. Red names show active repressors; green names show active activators. Sch9, Stb3, Maf1, and Stp1 are phosphorylated in the same conditions and thus shown as a single functional unit (box with broken lines). Rapid cell growth is labeled green, while slow cell growth is labeled yellow.
Additional files
-
MDAR checklist
- https://cdn.elifesciences.org/articles/94628/elife-94628-mdarchecklist1-v1.docx
-
Supplementary file 1
Phosphoproteomic data for wild-type, Gtr1/2 delete and Pib2 delete strains.
- https://cdn.elifesciences.org/articles/94628/elife-94628-supp1-v1.xlsx
-
Supplementary file 2
Summary of rapamycin dependent phosphorylation sites in Ser33.
- https://cdn.elifesciences.org/articles/94628/elife-94628-supp2-v1.docx
-
Supplementary file 3
Strain table.
- https://cdn.elifesciences.org/articles/94628/elife-94628-supp3-v1.xlsx
-
Supplementary file 4
Raw data mapping Ser33 phophorylation sites (Part I).
- https://cdn.elifesciences.org/articles/94628/elife-94628-supp4-v1.xlsx
-
Supplementary file 5
Raw data mapping Ser33 phophorylation sites (Part II).
- https://cdn.elifesciences.org/articles/94628/elife-94628-supp5-v1.xlsx
-
Supplementary file 6
Raw data mapping Ser33 phophorylation sites (Part III).
- https://cdn.elifesciences.org/articles/94628/elife-94628-supp6-v1.xlsx
-
Supplementary file 7
Raw data mapping Ser33 phophorylation sites (Part IV).
- https://cdn.elifesciences.org/articles/94628/elife-94628-supp7-v1.xlsx
Download links
A two-part list of links to download the article, or parts of the article, in various formats.
Downloads (link to download the article as PDF)
Open citations (links to open the citations from this article in various online reference manager services)
Cite this article (links to download the citations from this article in formats compatible with various reference manager tools)
The molecular logic of Gtr1/2- and Pib2-dependent TORC1 regulation in budding yeast
eLife 13:RP94628.
https://doi.org/10.7554/eLife.94628.2


