Mouse SAS-6 is required for centriole formation in embryos and integrity in embryonic stem cells
- Department of Cell Biology of the Skin and Department of Dermatology and Venereology, Medical Faculty, University of Cologne, Germany
- The Cologne Cluster of Excellence in Cellular Stress Responses in Aging-associated Diseases (CECAD), Medical Faculty, University of Cologne, Germany
- Graduate School for Biological Sciences, University of Cologne, Germany
- Center for Molecular Medicine Cologne (CMMC), Medical Faculty, University of Cologne, Germany
Figures
Figure 1 with 1 supplement
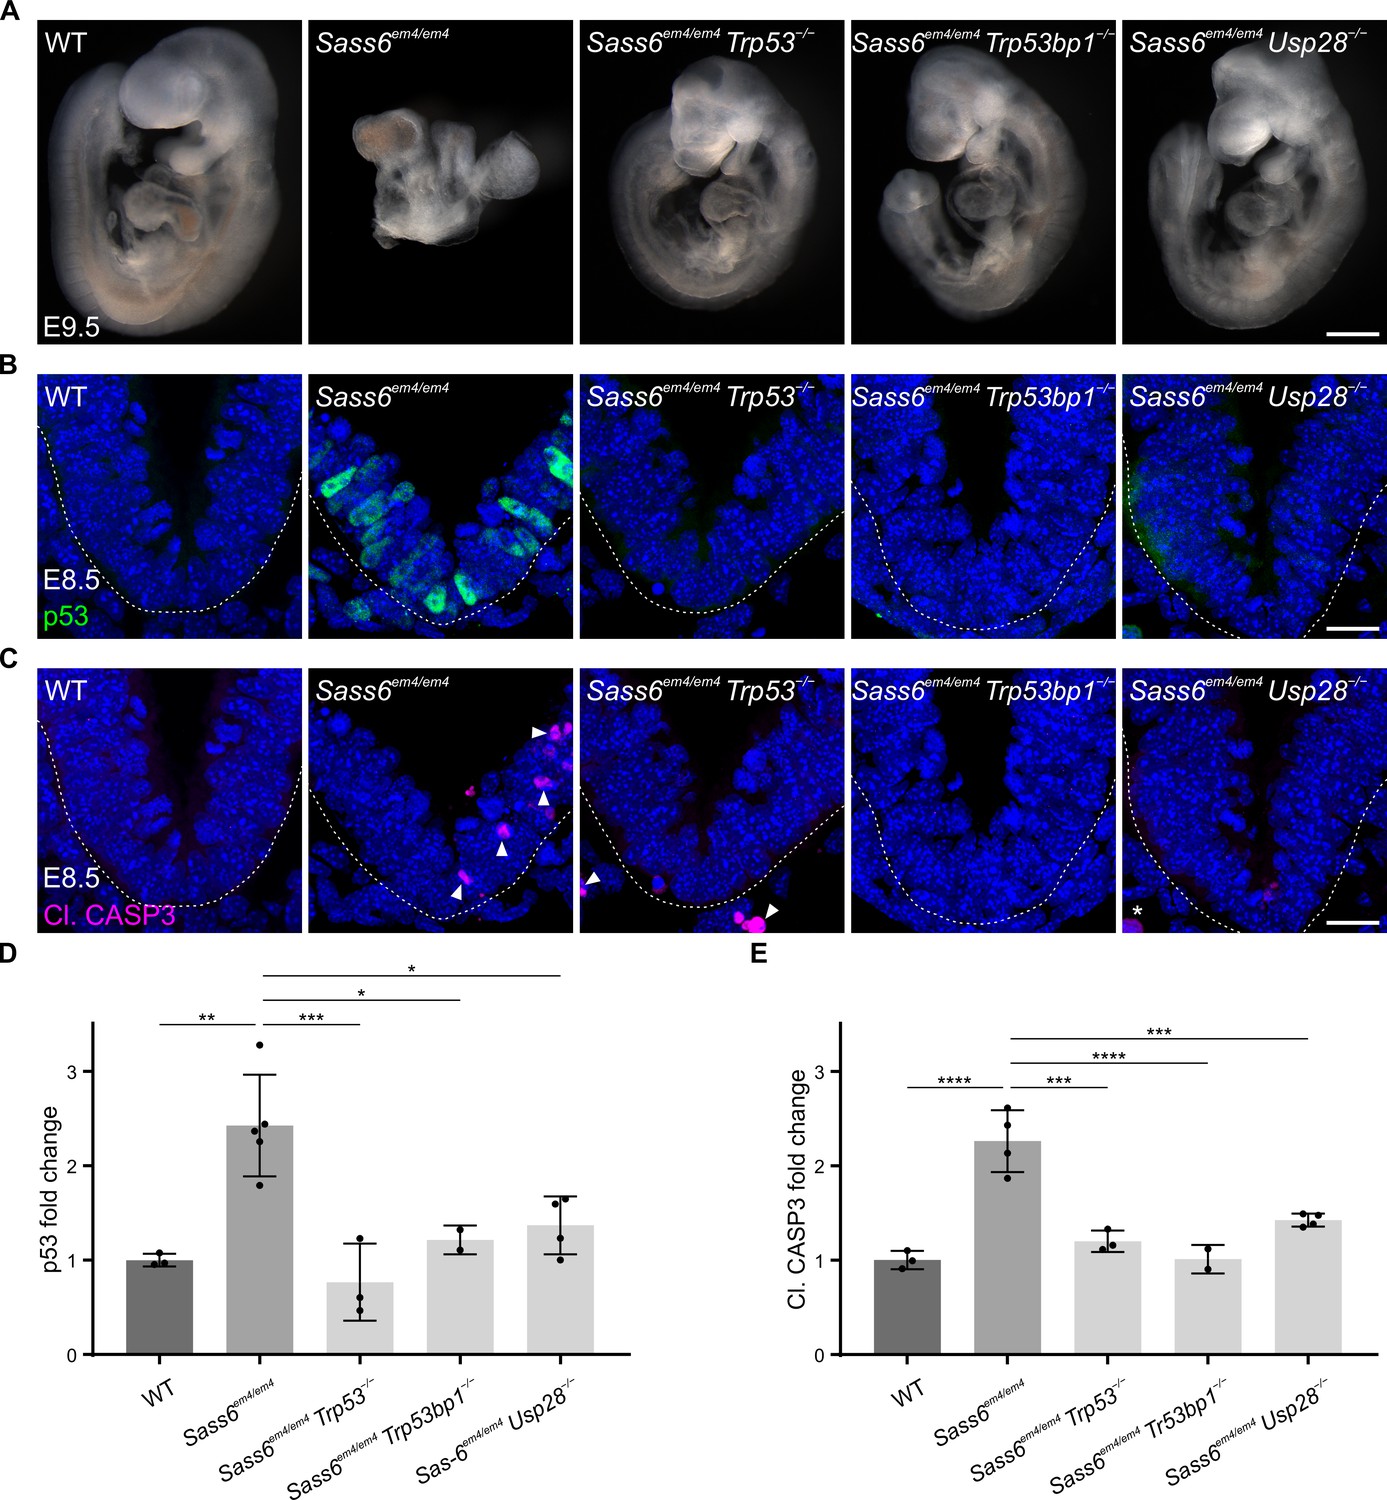
Mutation in mouse Sass6 activates the 53BP1-USP28-p53 mitotic surveillance pathway.
(A) Left-side views of wild-type (WT), Sass6em4/em4, Sass6em4/em4 Trp53−/−, Sass6em4/em4 Trp53bp1−/−, and Sass6em4/em4 Usp28−/− embryos at E9.5. Anterior is up in all images. At least three embryos per genotype showed similar phenotypes. Scale bar = 500 µm. (B) Immunostaining for p53 on transverse sections of WT, Sass6em4/em4, Sass6em4/em4 Trp53−/−, Sass6em4/em4 Trp53bp1−/−, and Sass6em4/em4 Usp28−/− embryos at E8.5. The sections shown encompass the neural plate (top) and mesenchyme (bottom), demarcated by the dashed line. Dorsal is up in all images. Scale bars = 25 µm. (C) Immunostaining for Cleaved-Caspase3 (Cl. CASP3) as mentioned in (B). Arrowheads indicate Cl. CASP3-positive cells, while asterisks mark non-specific staining of blood cells. (D) Quantification of the nuclear p53 in (B). Values were normalized to WT. Error bars represent mean ± SD WT: 1.00 ± 0.06 (n=2582 cells from three embryos); Sass6em4/em4: 2.4 ± 0.5 (n=2372 from four embryos); Sass6em4/em4 Trp53−/−: 0.8 ± 0.3 (n=2379 from three embryos); Sass6em4/em4 Usp28−/−: 1.4 ± 0.3 (n=2775 from four embryos); Sass6em4/em4 Trp53bp1−/−: 1.2 ± 0.1 (n=1840 from two embryos). *p<0.05, **p<0.01, ***p<0.001 (one-way ANOVA with Tukey’s multiple comparisons). (E) Quantification of Cl. CASP3 in (C) as mentioned in (D). WT: 1.00 ± 0.1 (n=2582 cells from three embryos); Sass6em4/em4: 2.3 ± 0.3 (n=2372 from four embryos); Sass6em4/em4 Trp53−/−: 1.2 ± 0.1 (n=2379 from three embryos); Sass6em4/em4 Usp28−/−: 1.4 ± 0.1 (n=2775 from four embryos); Sass6em4/em4 Trp53bp1−/−: 1 ± 0.1 (n=1840 from two embryos). ***p<0.001, ****p<0.0001 (one-way ANOVA with Tukey’s multiple comparisons).
Figure 1—figure supplement 1

Mutations in Sass6 lead to an increase in the mitotic index in mouse embryos.
The percentage of phospho-Histone H3-positive neural and mesenchymal cells of wild-type (WT), Sass6em4/em4, and Sass6em5/em5 at E8.5. Three embryos per genotype were used for the quantifications. Error bars represent mean ± SD WT: 5 ± 1% (n=1449 cells); Sass6em4/em4: 10 ± 1% (n=896); Sass6em5/em5: 11 ± 2% (n=941). *p<0.05, ns = not significant with p>0.05 (one-way ANOVA with Tukey’s multiple comparisons).
Figure 2 with 1 supplement
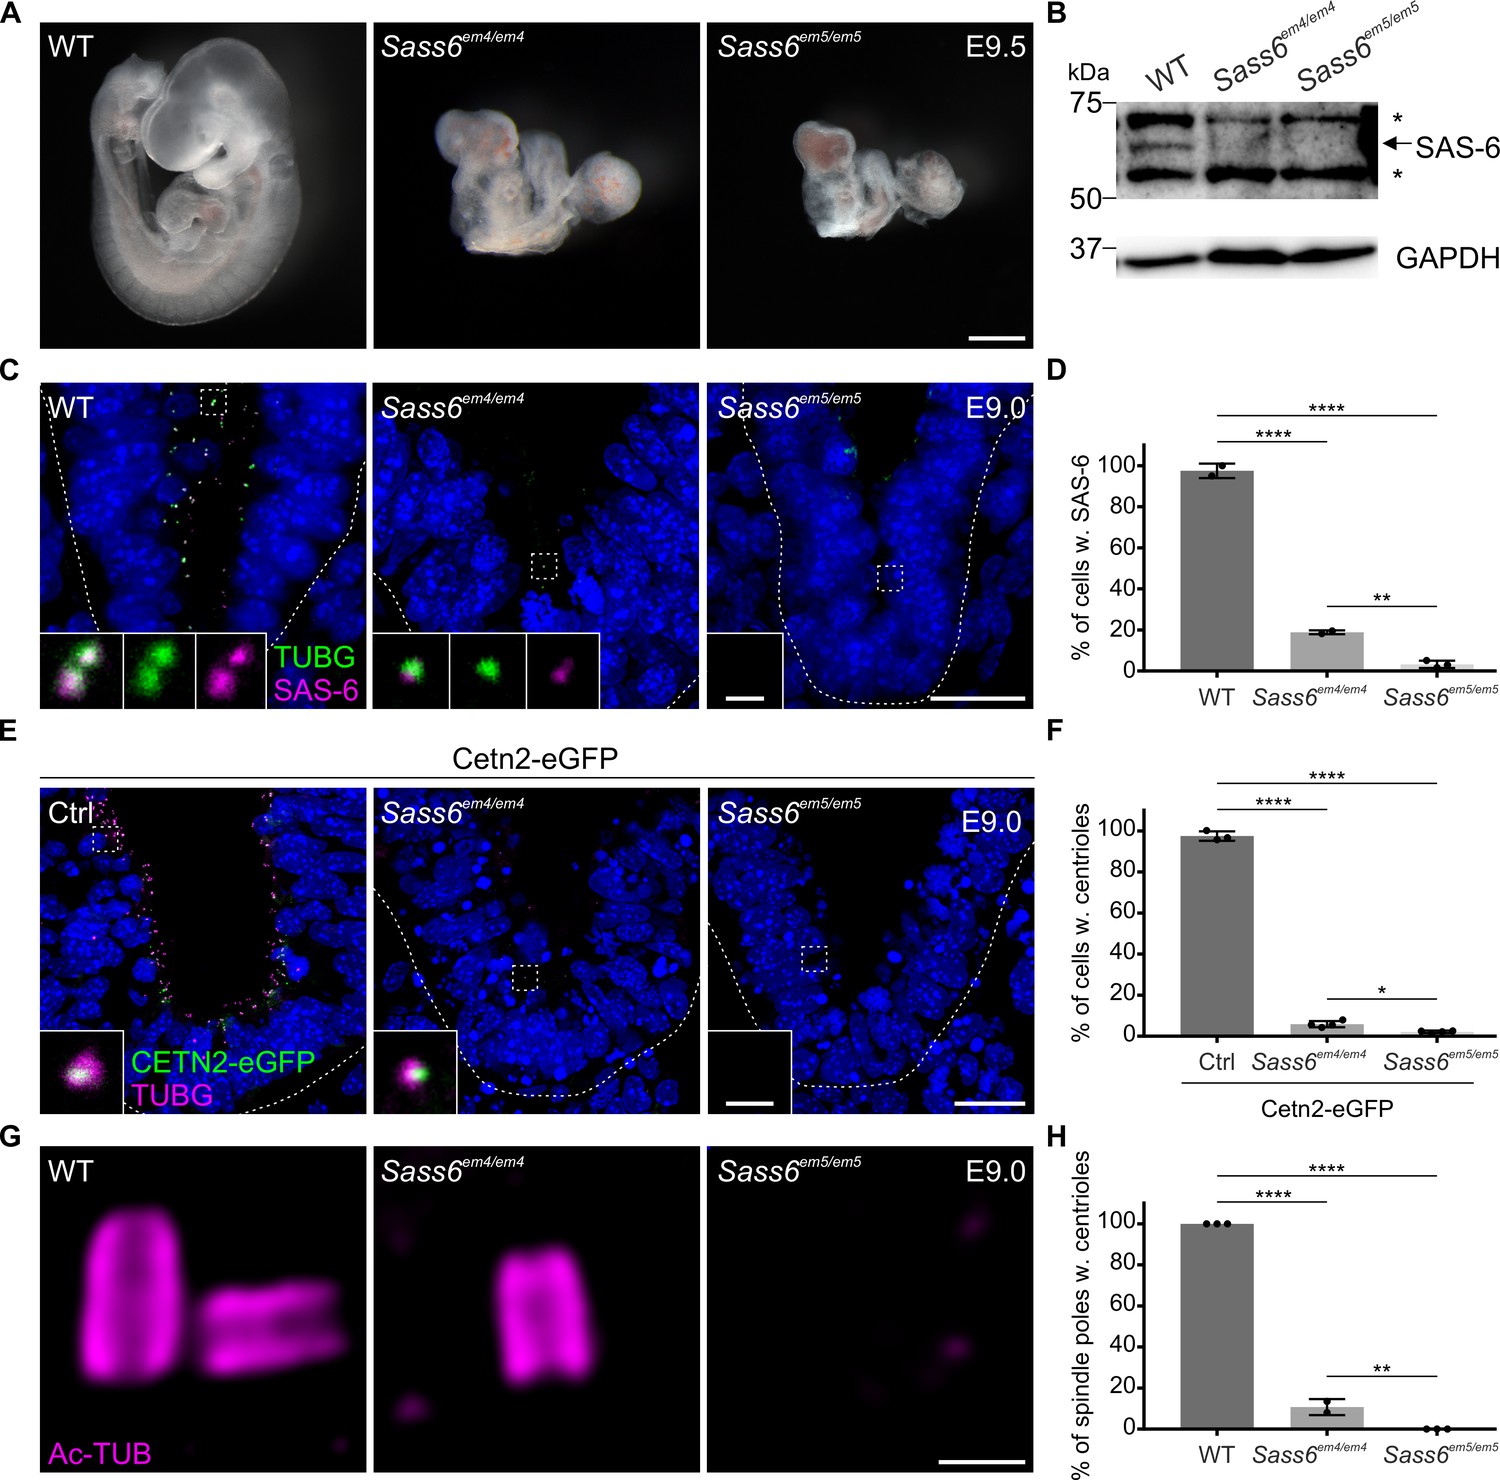
Sass6em4/em4 are severe hypomorphs while Sass6em5/em5 embryos lack centrioles.
(A) Left-side views of wild-type (WT), Sass6em4/em4, and Sass6em5/em5 embryos at E9.5. Anterior is up in all images. At least five embryos were analyzed per genotype. Scale bar = 500 µm. (B) Western blot analysis using a SAS-6-specific antibody on E9.5 WT, Sass6em4/em4, and Sass6 em5/em5 embryo extracts. Asterisks mark non-specific bands. GAPDH is used as a loading control. (C) Immunostaining for TUBG and SAS-6 on sagittal sections of WT, Sass6em4/em4, and Sass6em5/em5 embryos at E9.0. The sections shown encompass the neural plate (top) and mesenchyme (bottom), demarcated by the dashed line. Insets are magnifications of the center of the dashed squares. Dorsal is up in all images. Scale bars = 20 µm and 1 µm (insets). (D) Quantification of the percentage of cells with SAS-6 signal co-localization with TUBG in (C). Error bars represent mean ± SD WT: 95 ± 3% (n=1929 cells from three embryos); Sass6em4/em4: 19 ± 1% (n=542 from two embryos); Sass6em5/em5: 4 ± 2% (n=2458 from four embryos). ****p<0.0001, **p<0.01 (one-way ANOVA with Tukey’s multiple comparisons). (E) Immunostaining for TUBG on transverse sections of Cetn2-eGFP, Sass6em4/em4 Cetn2-eGFP, and Sass6em5/em5 Cetn2-eGFP embryos at E9.0. The sections shown are similar to those described in (C). Insets are magnifications of the center of the dashed squares. Scale bars = 20 µm and 1 µm (insets). (F) Quantification of the percentage of cells with centrioles (TUBG and Centrin-eGFP) is shown in (E). Error bars represent mean ± SD Cetn2-eGFP: 98 ± 2% (n=11,196 cells from three embryos); Sass6em4/em4 Cetn2-eGFP: 6 ± 1% (n=9752 from four embryos); Sass6em5/em5 Cetn2-eGFP: 2 ± 0.5% (n=5559 from four embryos). ****p<0.0001, *p<0.05 (one-way ANOVA with Tukey’s multiple comparisons). (G) Immunostaining for Ac-TUB on U-ExM sections from E9.0 embryos of the indicated genotypes. Scale bar = 200 nm. (H) Quantification of the percentage of mitotic spindle poles with centrioles in (G). Error bars represent mean ± SD WT: 100 ± 0% (n=65 spindle poles from three embryos); Sass6em4/em4: 11 ± 0.03% (n=62 from two embryos); Sass6em5/em5: 0 ± 0% (n=45 from three embryos). ****p<0.0001, **p<0.01 (one-way ANOVA with Tukey’s multiple comparisons).
-
Figure 2—source data 1
Western blot analysis on embryos.
(A) Uncropped blot from Figure 2B upper panel. Western blot analysis using a SAS-6-specific antibody on E9.5 wild-type (WT), Sass6em4/em4, and Sass6em5/em5 embryo extracts. Asterisks mark non-specific bands. (B) Uncropped blot from Figure 2B lower panel. GAPDH (and TUBA) Western blot analysis was used as a loading control.
- https://cdn.elifesciences.org/articles/94694/elife-94694-fig2-data1-v2.zip
Figure 2—figure supplement 1
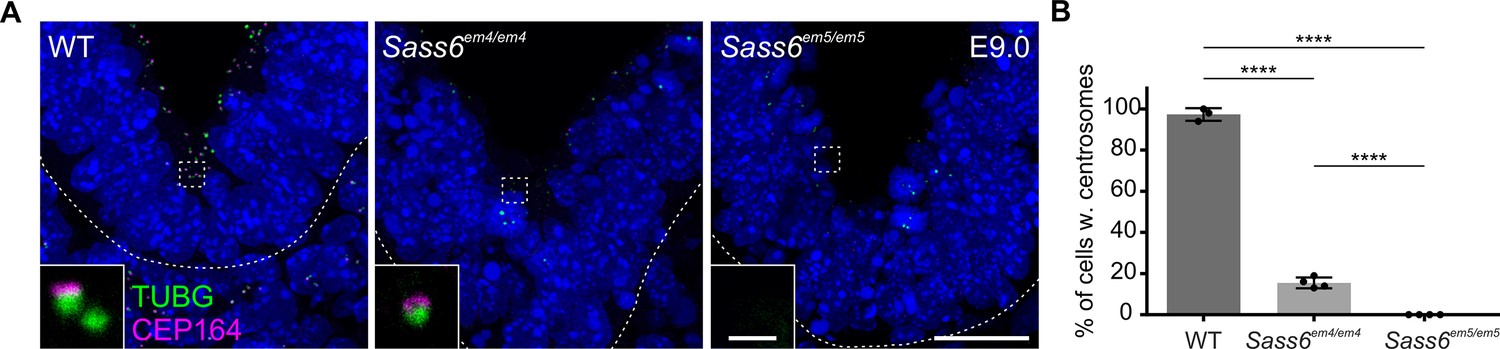
Sass6em5/em5 embryos lack mother centrioles marked with CEP164.
(A) Immunostaining for TUBG and CEP164 on transverse sections of wild-type (WT), Sass6em4/em4, and Sass6em5/em5 embryos at E9.0. The sections shown are similar to those described in Figure 1B. Insets are magnifications of the center of the dashed squares. Scale bars = 20 µm and 1 µm (insets). (B) Quantification of the percentage of cells with centrosomes (TUBG and CEP164) in (B). Error bars represent mean ± SD WT: 97 ± 0.03% (n=2843 cells from three embryos); Sass6em4/em4: 16 ± 0.2% (n=2375 from four embryos); Sass6em5/em5: 0 ± 0% (n=2152 from four embryos). ****p<0.0001 (one-way ANOVA with Tukey’s multiple comparisons).
Figure 3 with 1 supplement
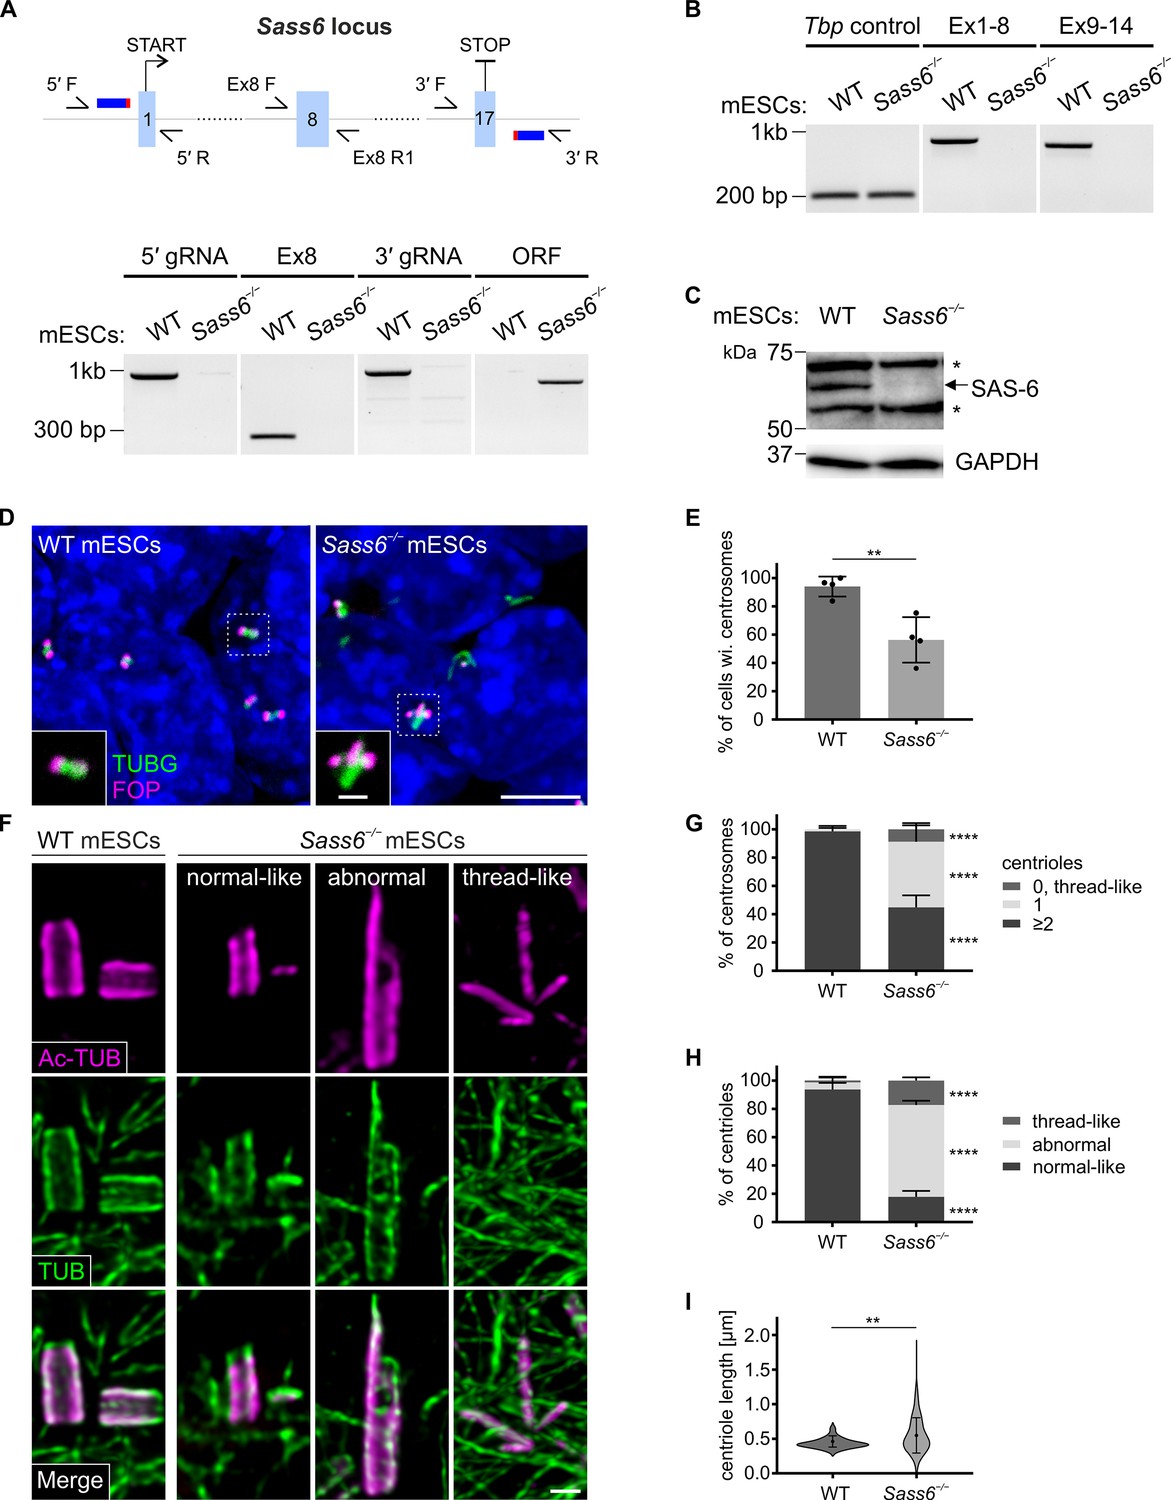
SAS 6 is required for centriole integrity, but not formation, in mouse embryonic stem cells (mESCs).
(A) (Top) Schematic showing the CRISPR/Cas9 strategy using two gRNAs to delete the entire Sass6 open reading frame (ORF) in mESCs. Exons (Ex) are represented by light blue boxes, gRNAs by dark blue thick horizontal lines, and PAM sites in red. Half arrows indicate the primers used for PCR analyses (below). (Bottom) Confirmation of the Sass6 deletion in Sass6−/− mESCs by genomic PCR. The picture shows the PCR products using the following primers indicated in the schematic above: 5′ gRNA (5′ F and 5′ R, band = 977 bp), Ex8 (Ex8 F and Ex8 R1, band = 281 bp), 3′ gRNA (3′ F and 3′ R, band = 992 bp), Sass6 ORF (5′ F and 3′ R, 825 bp in Sass6−/−, 34,349 bp in wild-type (WT), product too long to be amplified). (B) RT-PCR analyses of Sass6 transcripts in WT and Sass6−/− mESCs. The picture shows the PCR products from RT-PCR using the following primers: from Ex1 to Ex8 (Ex1 F and Ex8 R2, band = 734 bp), from Ex9 to Ex14 (Ex9 F and Ex14 R, band = 617 bp), Tbp Ctrl (Tbp F and Tbp R, band = 156 bp). (C) Western blot analysis using a SAS-6-specific antibody on WT and Sass6−/− mESCs extracts. Asterisks mark non-specific bands. GAPDH is used as a loading control. (D) Immunostaining for TUBG and FOP in WT and Sass6−/− mESCs. Insets are magnifications of the center of the dashed squares. Scale bars = 5 µm and 1 µm (insets). (E) Quantification of the percentage of cells with centrosomes (TUBG and FOP) in (D) from four independent experiments. Error bars represent mean ± SD WT: 94 ± 6% (n=2450 cells); Sass6−/−: 56 ± 14% (n=2766). **p<0.01 (two-tailed Student’s t-test). (F) Centrioles were visualized using U-ExM and immunostaining for α- and β-tubulin (TUB) and Ac-TUB in WT and Sass6−/− mESCs. Scale bar = 200 nm. (G) Quantification of the percentage of centrosomes with ≥2, 1, or 0 centrioles in (F) in WT and Sass6−/− mESCs from five independent experiments. Error bars represent mean ± SD WT (n=156 centrosomes):≥2 centrioles = 99 ± 2%; 1 centriole = 1 ± 2%; Sass6−/− (n=254):≥2 centrioles = 45 ± 8%, 1 centriole = 46 ± 10%, 0 centrioles = 9 ± 4%. ****p<0.0001 (two-tailed Student’s t-test) (H) Quantifications of the percentage of centrioles within each category in (F) from five independent experiments. Error bars represent mean ± s.d. WT (n=330 centrioles): normal-like centrioles = 94 ± 4%; abnormal centrioles = 5 ± 3%; thread-like structures = 1 ± 2%; Sass6−/− (n=432): normal-like centrioles = 18 ± 4%, abnormal centrioles = 65 ± 3%, thread-like structures = 17 ± 2%. ****p<0.0001, (two-tailed Student’s t-test). (I) Violin plots of centriole length of normal-like centrioles in (F) in WT and Sass6−/− mESCs from five independent experiments. Error bars represent mean ± SD WT: 0.46 ± 0.07 µm (n=72 centrioles); Sass6−/−: 0.55 ± 0.25 µm (n=72). **p<0.01 (two-tailed Student’s t-test).
-
Figure 3—source data 1
PCR, RT-PCR, and Western blot analyses on mouse embryonic stem cells (mESCs).
(A) Uncropped gel picture from Figure 3A. Genomic PCR on wild-type (WT) and Sass6−/− mESCs. The picture shows the PCR products using the following primers indicated in the schematic above: 5′ gRNA (5′ F and 5′ R, band = 977 bp), Ex8 (Ex8 F and Ex8 R1, band = 281 bp), 3′ gRNA (3′ F and 3′ R, band = 992 bp), Sass6 ORF (5′ F and 3′ R, 825 bp in Sass6−/−, 34,349 bp in WT, product too long to be amplified). (B) Uncropped gel picture from Figure 3B. RT-PCR analyses of Sass6 transcripts in WT and Sass6−/− mESCs. The picture shows the PCR products from RT-PCR using the following primers: from Ex1 to Ex8 (Ex1 F and Ex8 R2, band = 734 bp), from Ex9 to Ex14 (Ex9 F and Ex14 R, band = 617 bp), Tbp Ctrl (Tbp F and Tbp R, band = 156 bp). (C) Uncropped blot from Figure 3C upper panel. Western blot analysis using a SAS-6-specific antibody on WT and Sass6−/− mESCs extracts. Asterisks mark non-specific bands. (D) Uncropped blot from Figure 3C lower panel. GAPDH (and TUBA) Western blot analysis was used as a loading control.
- https://cdn.elifesciences.org/articles/94694/elife-94694-fig3-data1-v2.zip
Figure 3—figure supplement 1
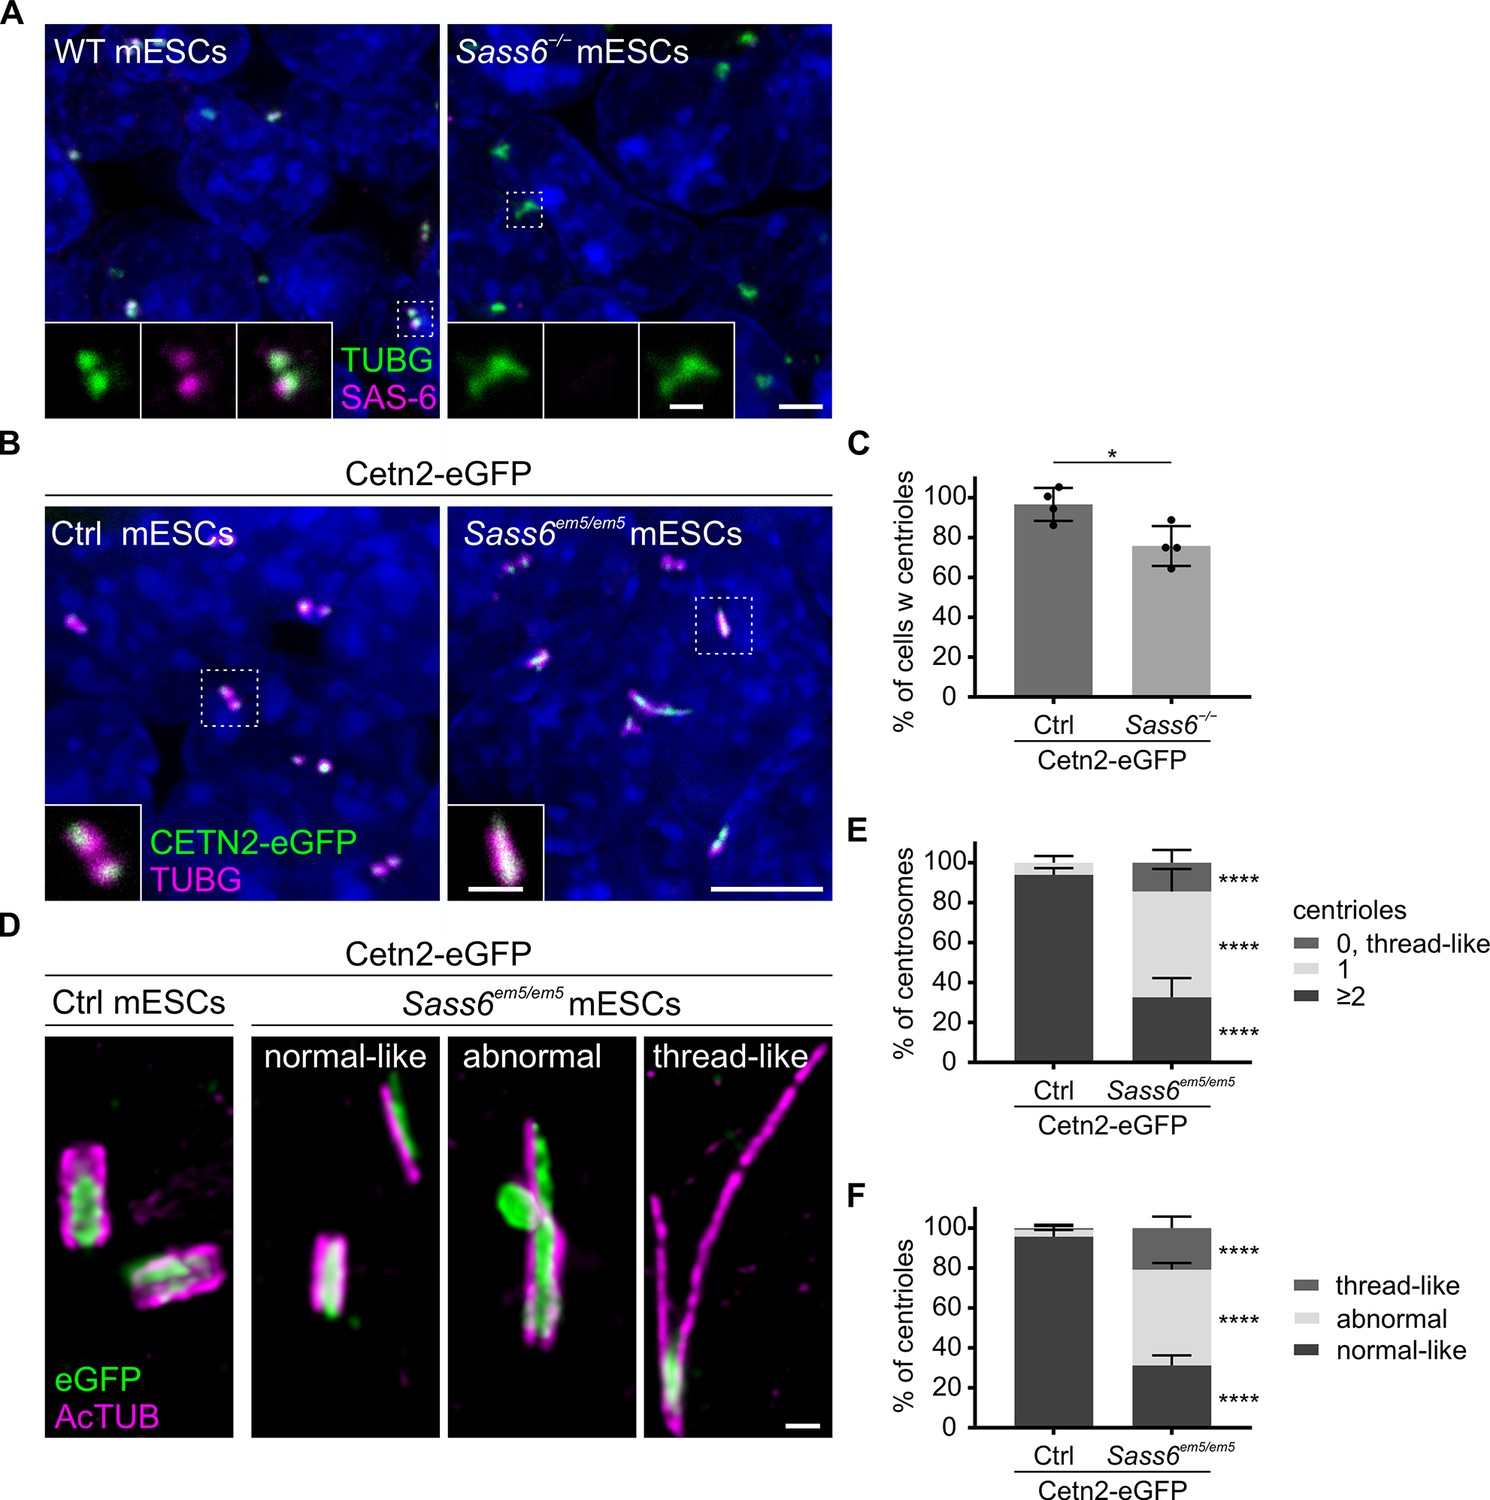
SAS-6 is not essential for centriole formation in mouse embryonic stem cells (mESCs).
(A) Immunostaining for TUBG and SAS-6 in wild-type (WT) and Sass6−/− mESCs. Insets are magnifications of the center of the dashed squares. Scale bars = 5 µm and 1 µm (insets). (B) Immunostaining for TUBG in control Cetn2-eGFP and Sass6em5/em5 Cetn2-eGFP mESCs. Insets are magnifications of the center of the dashed squares. Scale bars = 5 µm and 1 µm (insets). (C) Quantification of the percentage of cells with centrosomes (TUBG and CETN2-eGFP) in (B) from four independent experiments. Error bars represent mean ± SD WT: 97 ± 7% (n=10,858 cells); Sass6−/−: 76 ± 9% (n=6436). *p<0.05 (two-tailed Student’s t-test). (D) Immunostaining for Ac-TUB and eGFP of U-ExM of centrioles from control Cetn2-eGFP and Sass6em5/em5 Cetn2-eGFP mESCs divided into categories: normal-like centrioles, abnormal centrioles, thread-like structures. Scale bar = 200 nm. (E) Quantification of the percentage of centrosomes with ≥2, 1, or 0 centrioles in (D) in Cetn2-eGFP and Sass6em5/em5 Cetn2-eGFP mESCs. Compare to Figure 3G. Error bars represent mean ± s.d. Cetn2-eGFP (n=121 centrosomes from four independent experiments):≥2 centrioles = 94 ± 3%; 1 centriole = 6 ± 3%; Sass6−/− (n=152 from five independent experiments):≥2 centrioles = 33 ± 9%, 1 centriole = 53 ± 10%, 0 centrioles = 14 ± 6%. ****p<0.0001 (two-tailed Student’s t-test) (F) Quantifications of the percentage of centrioles within each category in (D). Compare to Figure 3H. Error bars represent mean ± SD WT (n=249 centrioles from four independent experiments): normal-like centrioles = 96 ± 3%; abnormal centrioles = 3 ± 2%; thread-like structures = 1 ± 1%; Sass6−/− (n=231 from five independent experiments): normal-like centrioles = 31 ± 4%, abnormal centrioles = 48 ± 3%, thread-like structures = 21 ± 5%. ****p<0.0001, (two-tailed Student’s t-test).
Figure 4 with 1 supplement
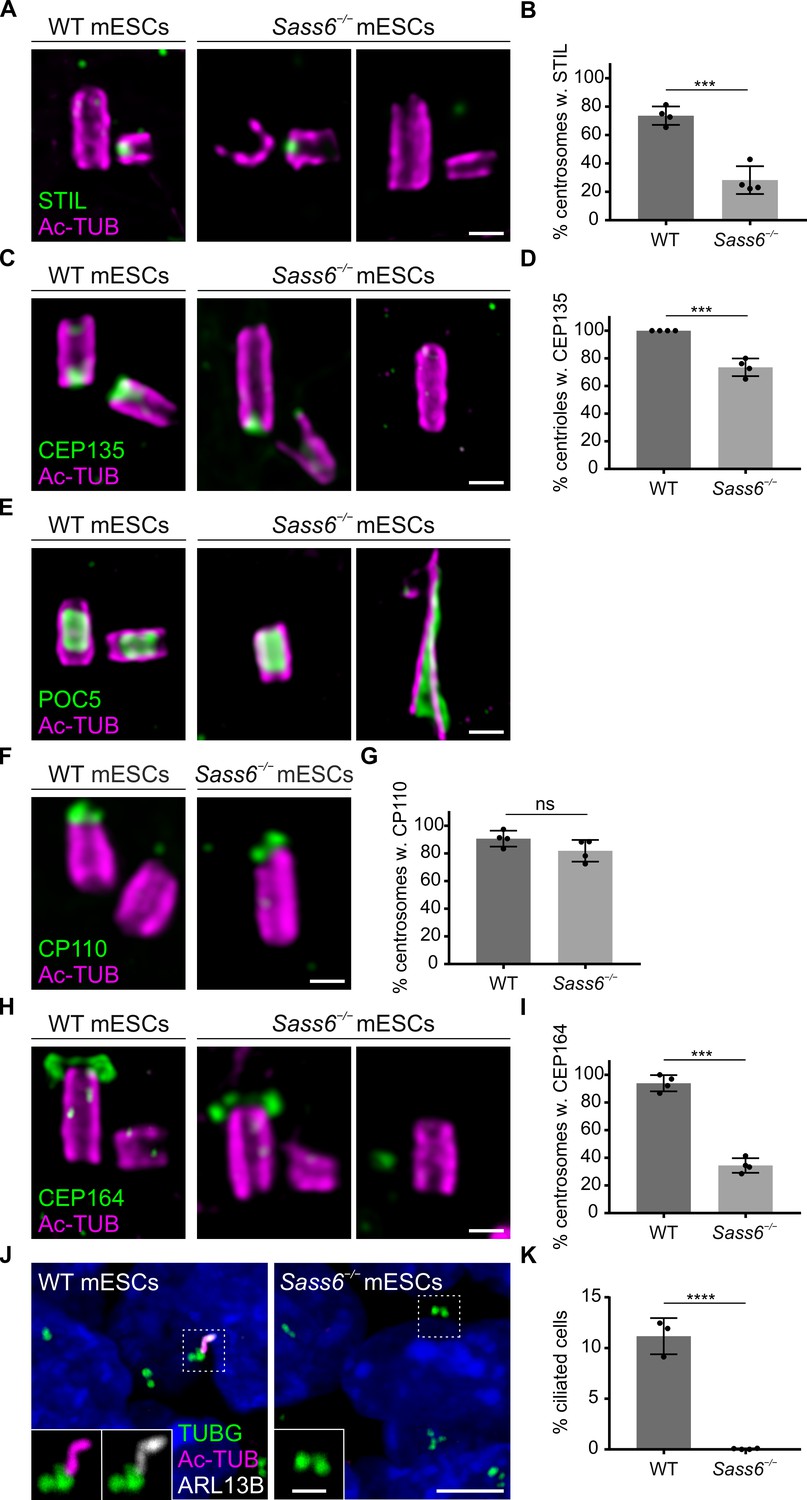
Centrioles in Sass6−/− mouse embryonic stem cells (mESCs) exhibit proximal and distal defects.
(A) Immunostaining for Ac-TUB and STIL of U-ExM of centrioles from wild-type (WT) and Sass6−/− mESCs. Examples of centrioles with or without STIL are shown. Scale bar = 200 nm. (B) Quantification of the percentage of centrosomes with (w.) STIL in (A) from four independent experiments. Error bars represent mean ± SD WT: 74 ± 6% (n=72 centrosomes); Sass6−/−: 29 ± 8% (n=94). ***p<0.001, (two-tailed Student’s t-test). (C) Immunostaining for Ac-TUB and cartwheel protein (CEP135) of U-ExM of centrioles from WT and Sass6−/− mESCs. Examples of centrioles with or without CEP135 are shown. Scale bar = 200 nm. (D) Quantifications of the percentage of centrioles with CEP135 in (C) from four independent experiments. Error bars represent mean ± SD WT: 100 ± 0% (n=160 centrioles); Sass6−/−: 73 ± 6% (n=98). ***p<0.001, (two-tailed Student’s t-test). (E) Immunostaining for Ac-TUB and the inner scaffold protein POC5 of U-ExM of centrioles from WT and Sass6−/− mESCs. Examples of normal-like or abnormal centrioles with POC5 are shown. Scale bar = 200 nm. (F) Immunostaining for Ac-TUB and the distal-end capping protein CP110 of U-ExM of centrioles from WT and Sass6−/− mESCs. Scale bar = 200 nm. (G) Quantification of the percentage of centrosomes with CP110 in (F) from four independent experiments. Error bars represent mean ± SD WT: 91 ± 5% (n=116 centrosomes); Sass6−/−: 82 ± 7% (n=106). ns = not significant with p>0.05 (two-tailed Student’s t-test). (H) Immunostaining for Ac-TUB and CEP164 of U-ExM of centrioles from WT and Sass6−/− mESCs. Examples of centrioles with or without CEP164 are shown. Scale bar = 200 nm. (I) Quantification of the percentage of centrosomes with mother centrioles (Ac-TUB) with the distal appendage marker (CEP164) in (H). Error bars represent mean ± SD WT: 94 ± 5% (n=104 centrosomes from four independent experiments); Sass6−/−: 28 ± 14% (n=140 from five experiments). ***p<0.001 (two-tailed Student’s t-test). (J) Immunostaining of the cilia markers ARL13B and Ac-TUB, and basal bodies marked with TUBG, on WT and Sass6−/− mESCs. The insets show separate channels for the magnifications of the center of the dashed squares. Scale bars = 5 µm and 1 µm (insets). (K) Quantification of the percentage of ciliated cells in (J). Error bars represent mean ± SD WT: 11 ± 1% (n=2602 cells from three experiments); Sass6−/−: 0 ± 0% (n=4602 from four experiments). ****p<0.0001 (two-tailed Student’s t-test).
Figure 4—figure supplement 1
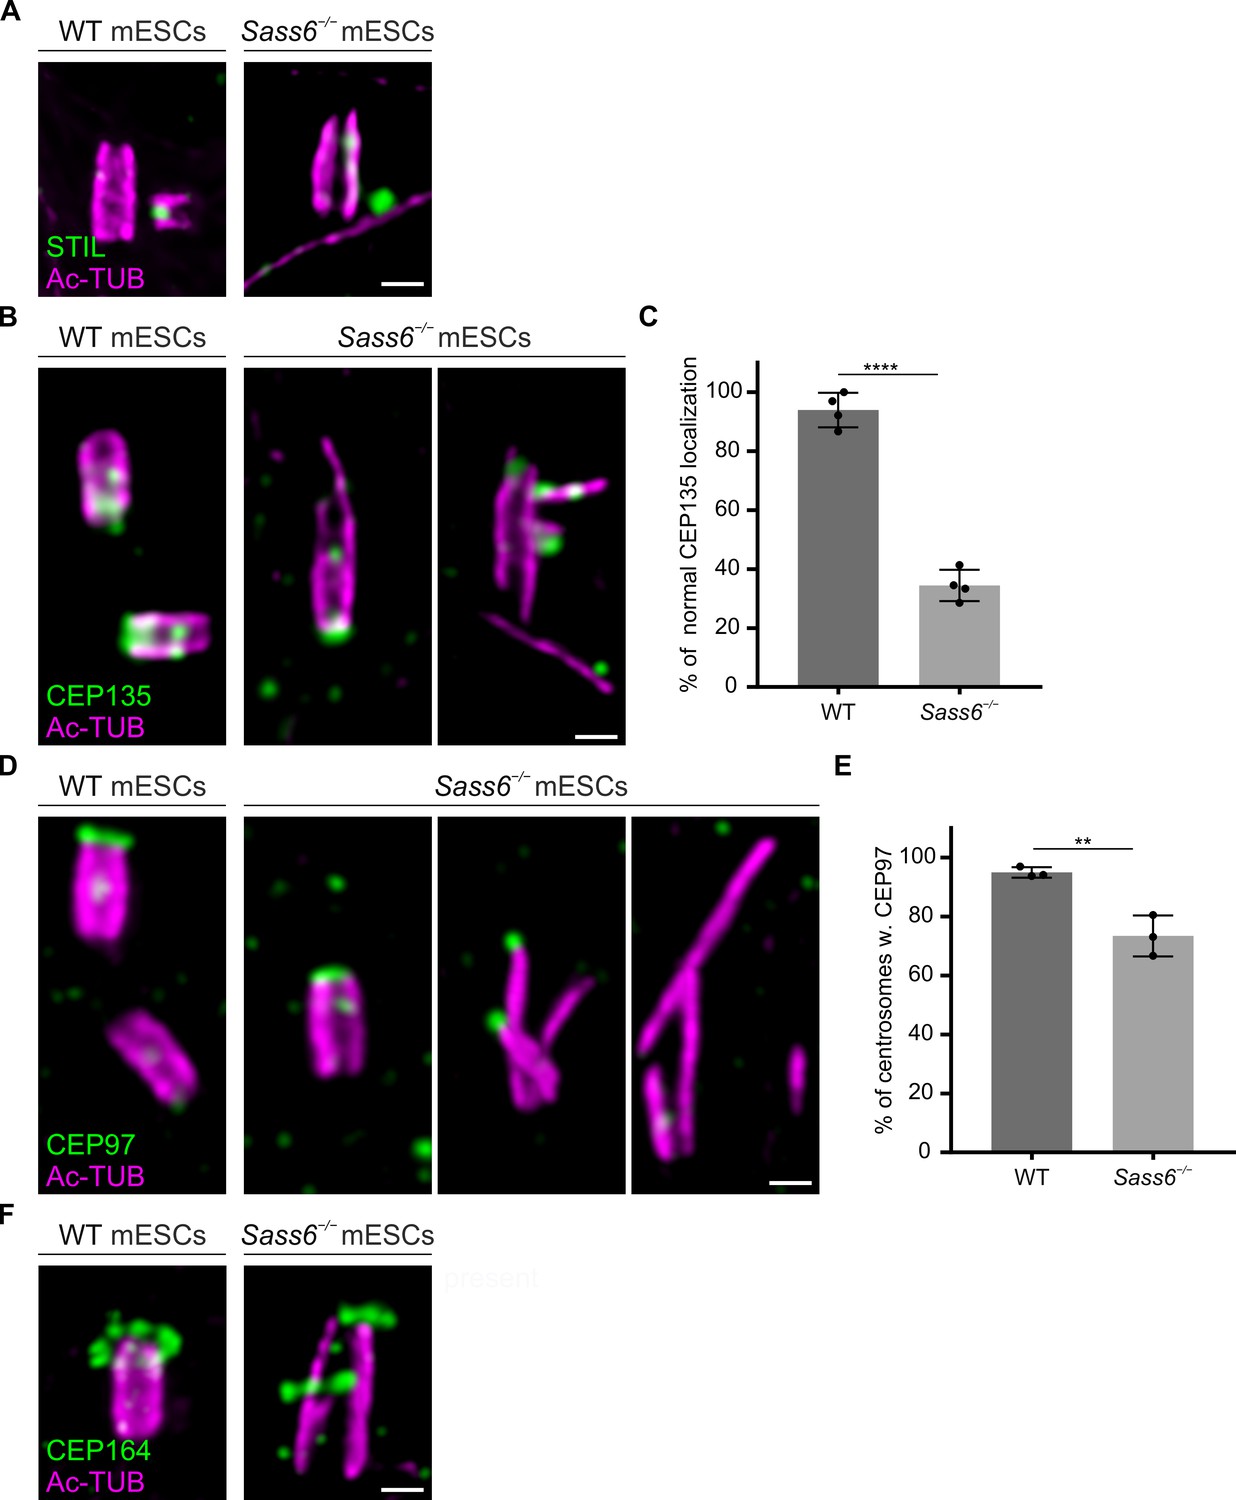
Centrioles in Sass6−/− mouse embryonic stem cells (mESCs) exhibit structural abnormalities.
(A) Immunostaining for Ac-TUB and STIL of U-ExM of centrioles from wild-type (WT) and Sass6−/− mESCs. Examples of centrioles with STIL are shown. Scale bar = 200 nm. (B) Immunostaining for Ac-TUB and the cartwheel protein CEP135 of U-ExM of centrioles from WT and Sass6−/− mESCs. Examples of centrioles with normal or abnormal localization of CEP135 are shown. Scale bar = 200 nm. (C) Quantifications of normal localization of CEP135 in CEP135-positive centrosomes in (B) from four independent experiments. Error bars represent mean ± SD WT: 96 ± 3% (n=160 centrioles); Sass6−/−: 12 ± 8% (n=98). ****p<0.0001, (two-tailed Student’s t-test). (D) Immunostaining for Ac-TUB and the distal-end capping protein CEP97 of U-ExM of centrioles from WT and Sass6−/− mESCs. Examples of centrioles with or without CEP97 are shown. Scale bar = 1 µm. (E) Quantification of the percentage of centrosomes with CEP97 in (D) from four independent experiments. Error bars represent mean ± SD WT: 95 ± 1% (n=116 centrosomes); Sass6−/−: 73 ± 6% (n=106). **p<0.01, (two-tailed Student’s t-test). (F) Immunostaining for Ac-TUB and CEP164 in U-ExM of centrioles from WT and Sass6−/− mESCs. Examples of centrioles with CEP164 are shown. Scale bar = 200 nm.
Figure 5 with 1 supplement
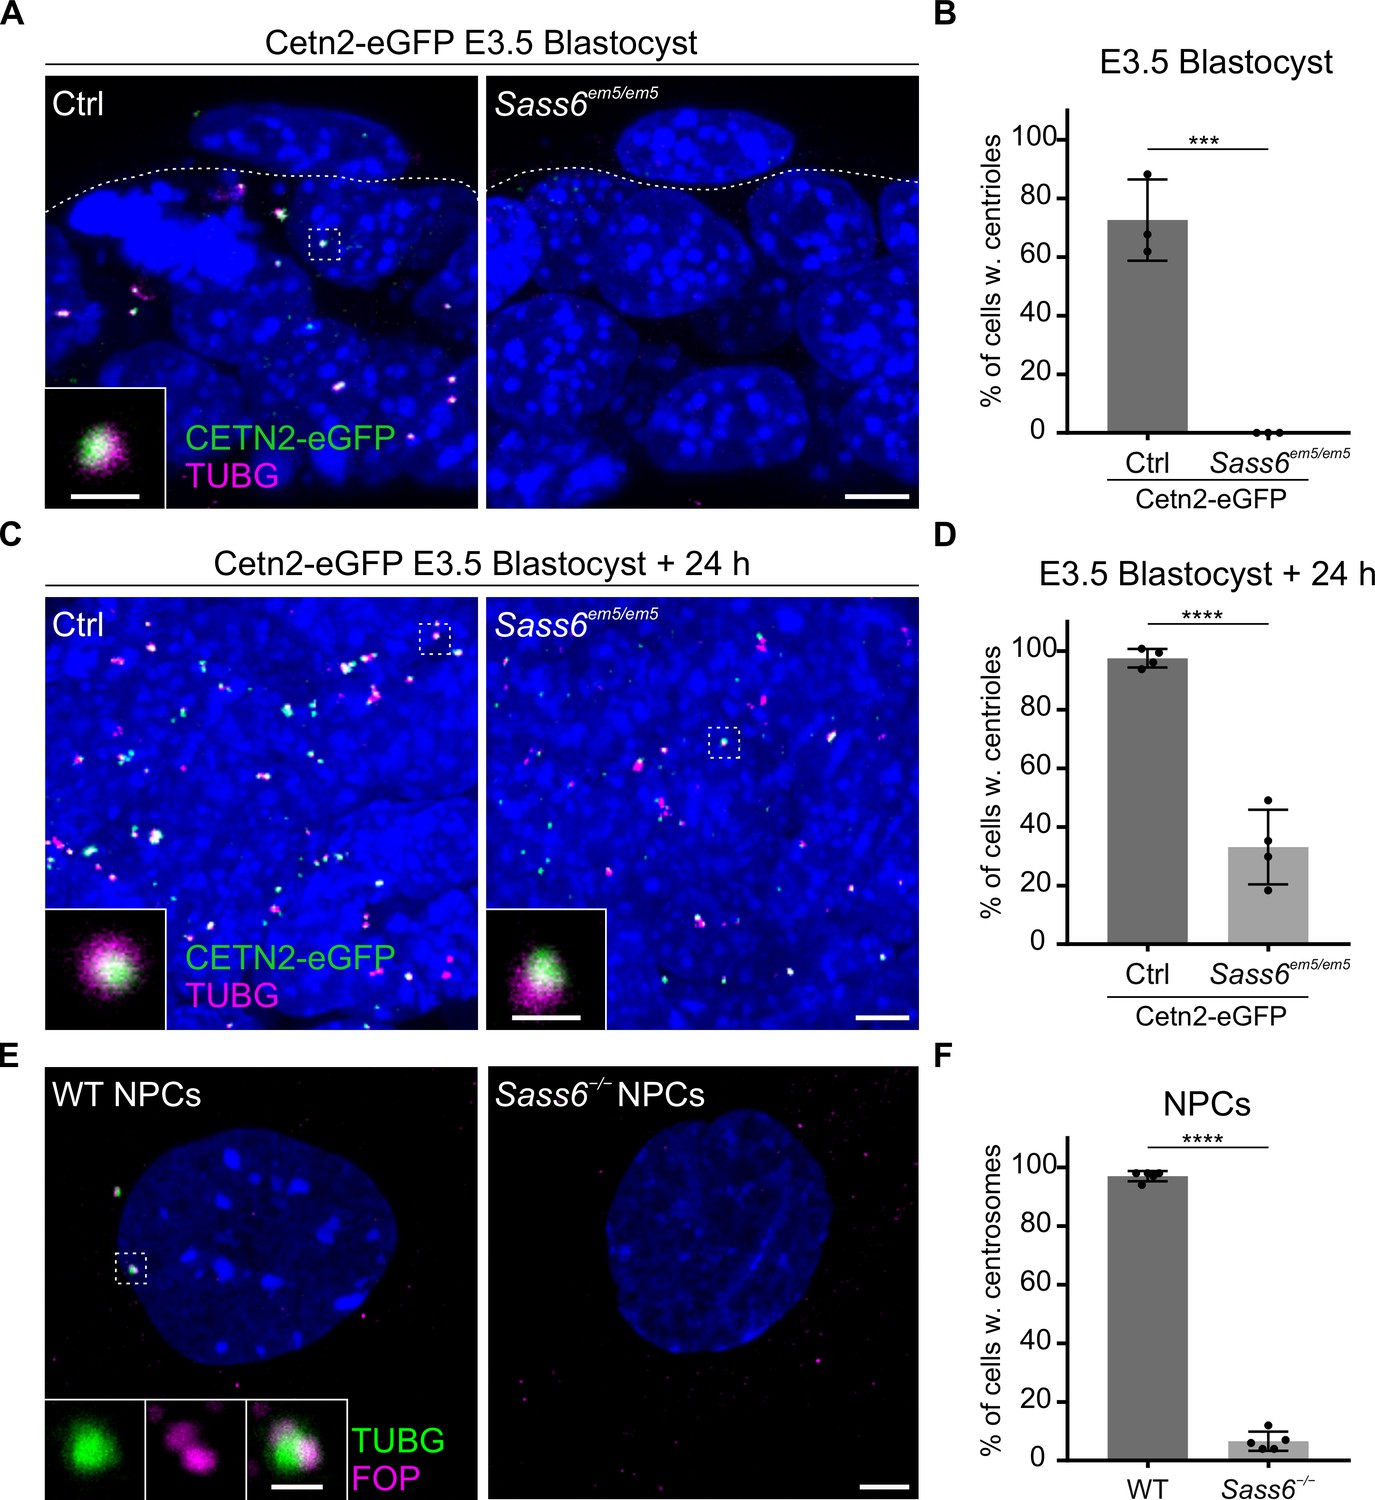
Centrioles in Sass6 em5/em5 mouse embryonic stem cells (mESCs) are formed de novo during derivation from blastocysts and are lost upon differentiation.
(A) Whole-mount immunostaining for TUBG on Cetn2-eGFP and Sass6em5/em5 Cetn2-eGFP blastocysts at E3.5. Trophoblasts (top) and inner cell mass cells (bottom) are demarcated by the dashed line. The Inset is a magnification of the dashed square. Scale bars = 5 µm and 1 µm (inset). (B) Quantification of the percentage of cells with centrioles (TUBG and Centrin-eGFP) from E3.5 blastocysts in (A). Three blastocysts per genotype were used for the quantifications. Error bars represent mean ± SD WT: 73 ± 11% (n=200 cells); Sass6em5/em5: 0 ± 0% (n=175). ***p<0.001, (two-tailed Student’s t-test). (C) Whole-mount immunostaining as mentioned in (A) on blastocysts after 24 hr in culture. (D) Quantification from (C) as mentioned in (B). Four blastocysts per genotype were used for the quantifications. WT: 98 ± 30% (n=630 cells); Sass6em5/em5: 33 ± 11% (n=690). ****p<0.0001. (E) Immunostaining for TUBG and FOP in WT and Sass6−/− cells after in vitro neural differentiation (NPCs). Insets are magnifications of the center of the dashed squares. Scale bars = 5 µm and 1 µm (insets). (F) Quantification of the percentage of cells with centrosomes (TUBG and FOP) in (E) from five independent experiments. Error bars represent mean ± SD WT: 97 ± 0% (n=1388 cells); Sass6−/−: 6 ± 0% (n=1068). ****p<0.0001, (two-tailed Student’s t-test).
Figure 5—figure supplement 1
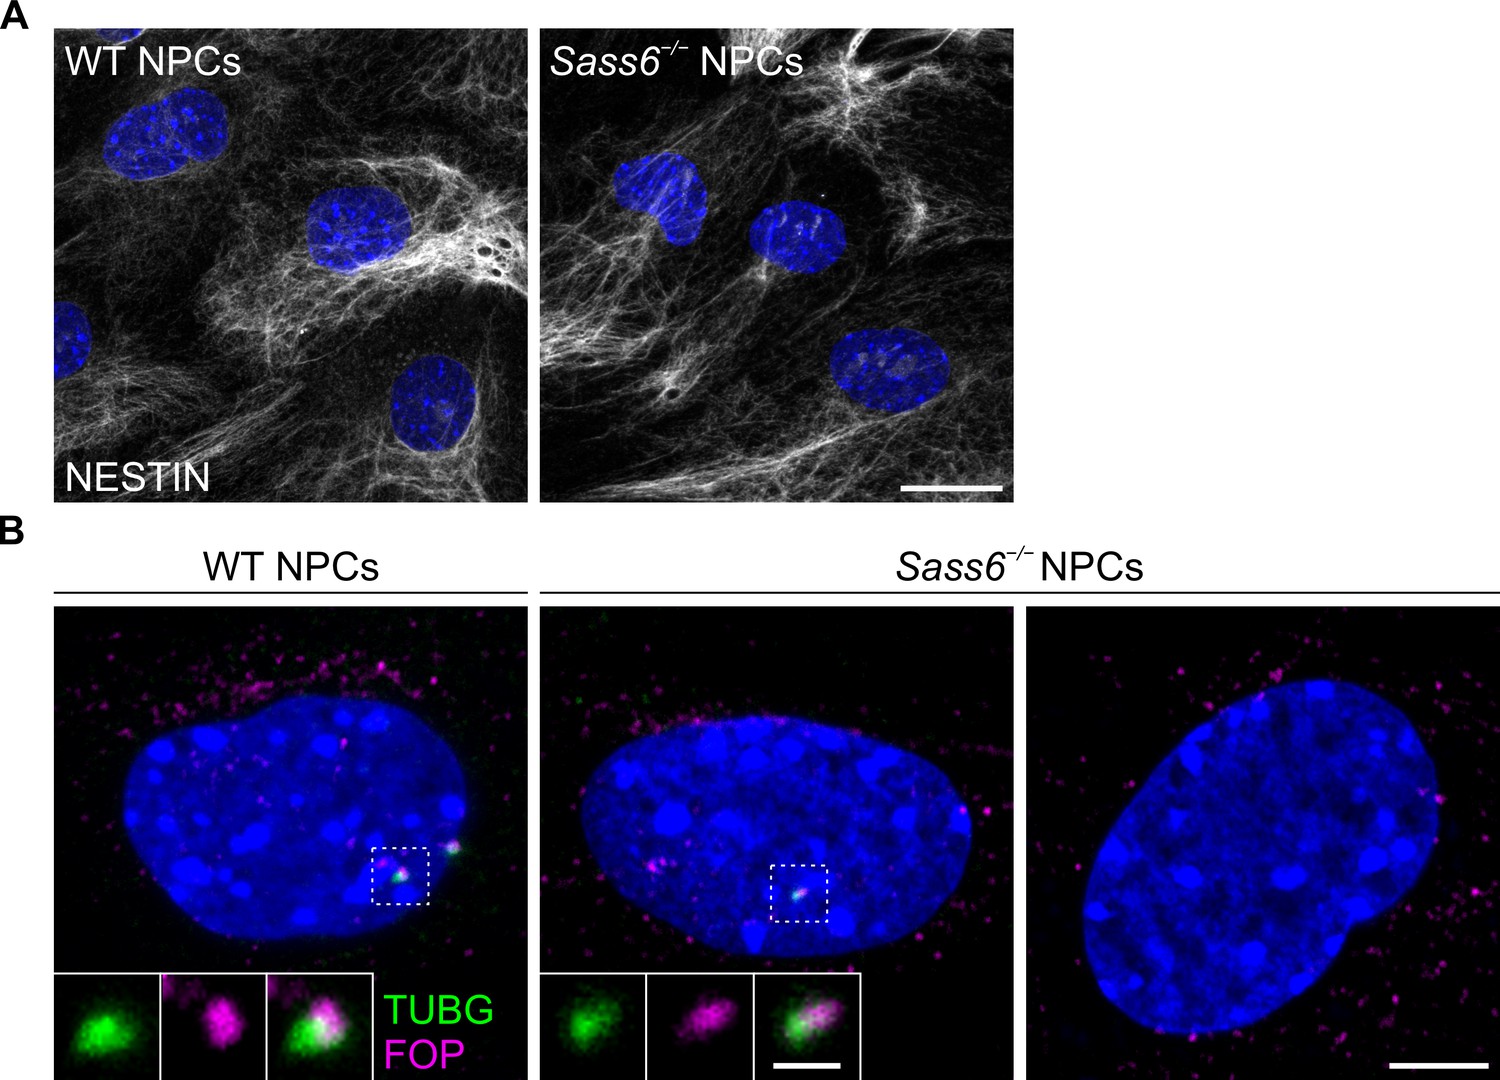
Wild-type (WT) and Sass6−/− mouse embryonic stem cells (mESCs) differentiated into neural progenitor cells (NPCs).
(A) Immunostaining for NESTIN on WT and Sass6−/− cells after in vitro neural differentiation of mESCs into NPCs. Scale bar = 20 µm. (B) Immunostaining for TUBG and FOP in WT and Sass6−/− cells after in vitro neural differentiation (NPCs). Examples of cells with or without (in Sass6−/−) centrosomes are shown. Insets are magnifications of the center of the dashed squares. Scale bars = 5 µm and 1 µm (insets).
Figure 6
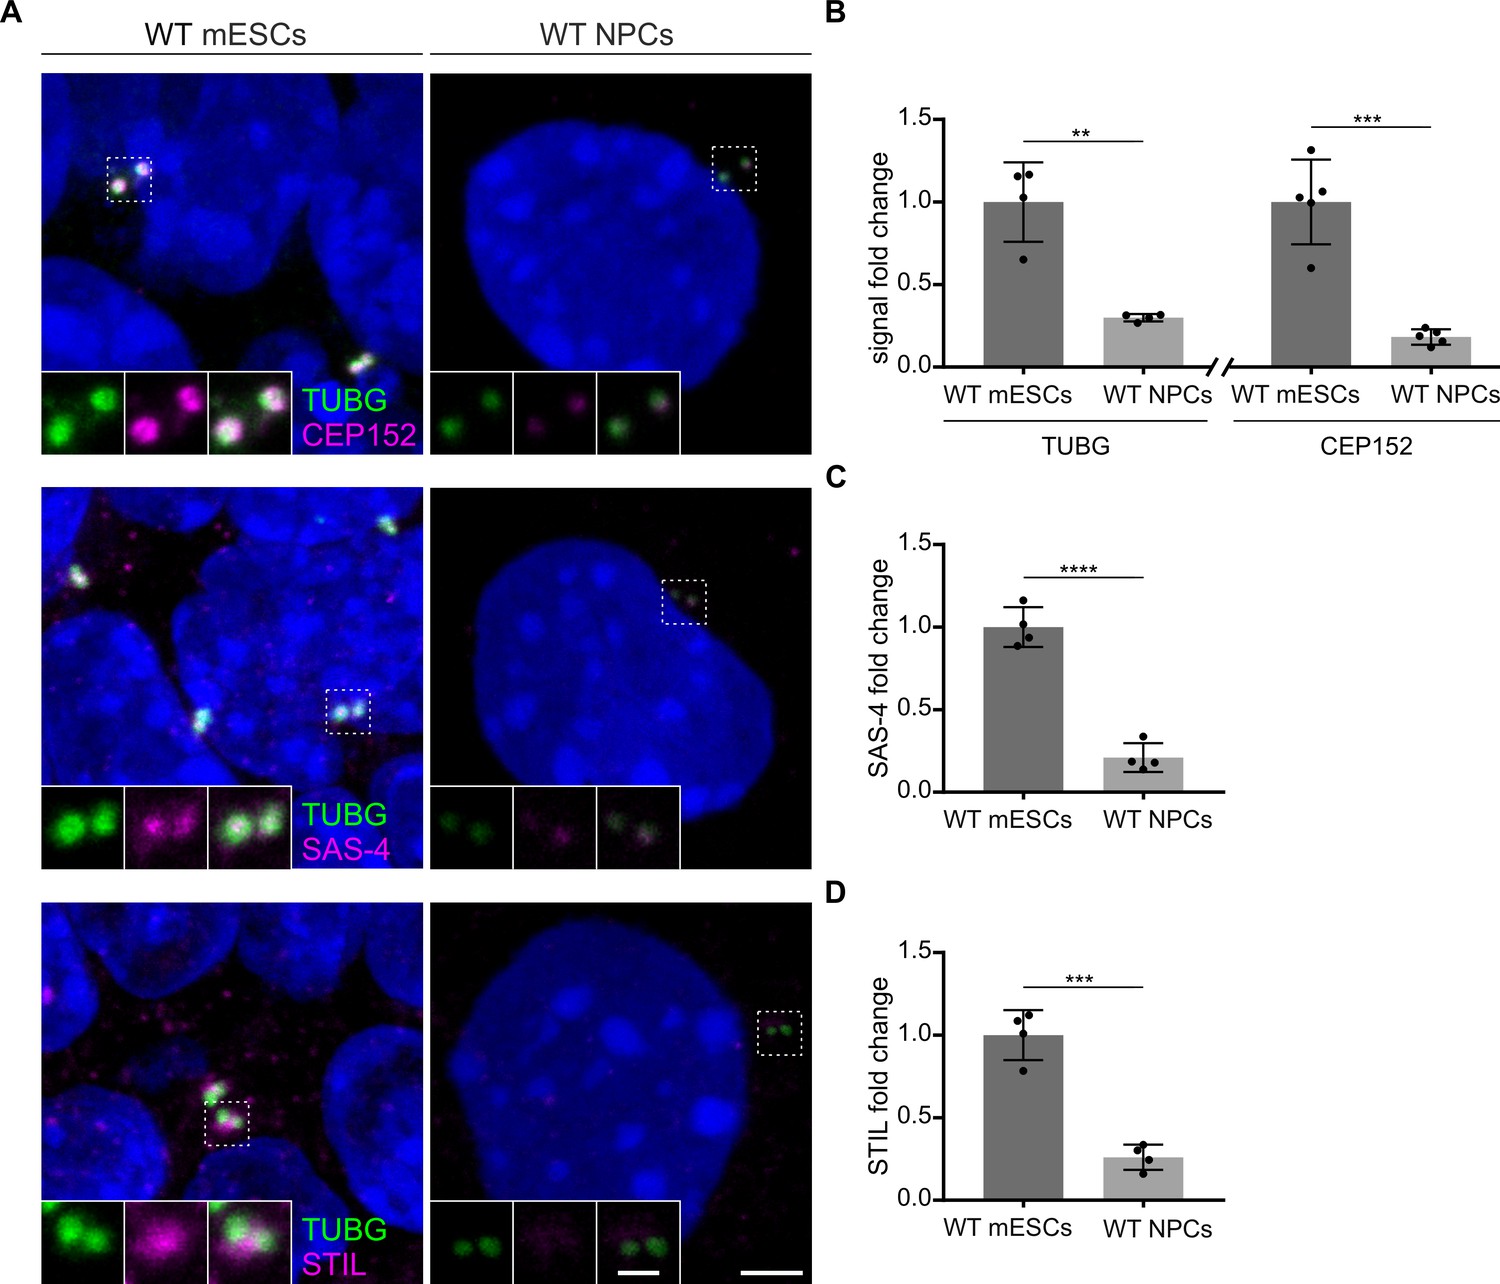
Levels of centrosomal components are reduced upon neural differentiation.
(A) Immunostaining for TUBG and CEP152, TUBG and SAS-4, or TUBG and STIL in wild-type (WT) mouse embryonic stem cells (mESCs) and in vitro differentiated (neural progenitor cells, NPCs). Insets are magnifications of the center of the dashed squares. Scale bars = 3 µm and 1 µm (insets). (B) Quantification of the centrosomal TUBG and CEP152 signal from (A). Values were normalized to mESCs. Error bars represent mean ± s.d. Quantification of TUBG, mESCs: 1.00 ± 0.2 (n=1325 centrosomes from four independent experiments); NPCs: 0.03 ± 0.02% (n=789 from 4fourindependent experiments). Quantification of CEP152, mESCs: 1.00 ± 0.2 (n=1006 cells from five independent experiments); NPCs: 0.2 ± 0.04% (n=973 from five independent experiments). **p<0.01, ***p<0.001 (two-tailed Student’s t-test). (C) Quantification of the centrosomal SAS-4 signal from (A) from four independent experiments. Values were normalized to mESCs. Error bars represent mean ± SD mESCs: 1.00 ± 0.1 (n=1297 centrosomes); NPCs: 0.2 ± 0.08% (n=790). ****p<0.0001, (two-tailed Student’s t-test). (D) Quantification of the centrosomal STIL signal from (A) from four independent experiments. Values were normalized to mESCs. Error bars represent mean ± SD mESCs: 1.00 ± 0.13 (n=1132 centrosomes from four independent experiments); NPCs: 0.3 ± 0.07% (n=798). ***p<0.001, (two-tailed Student’s t-test).
Figure 7
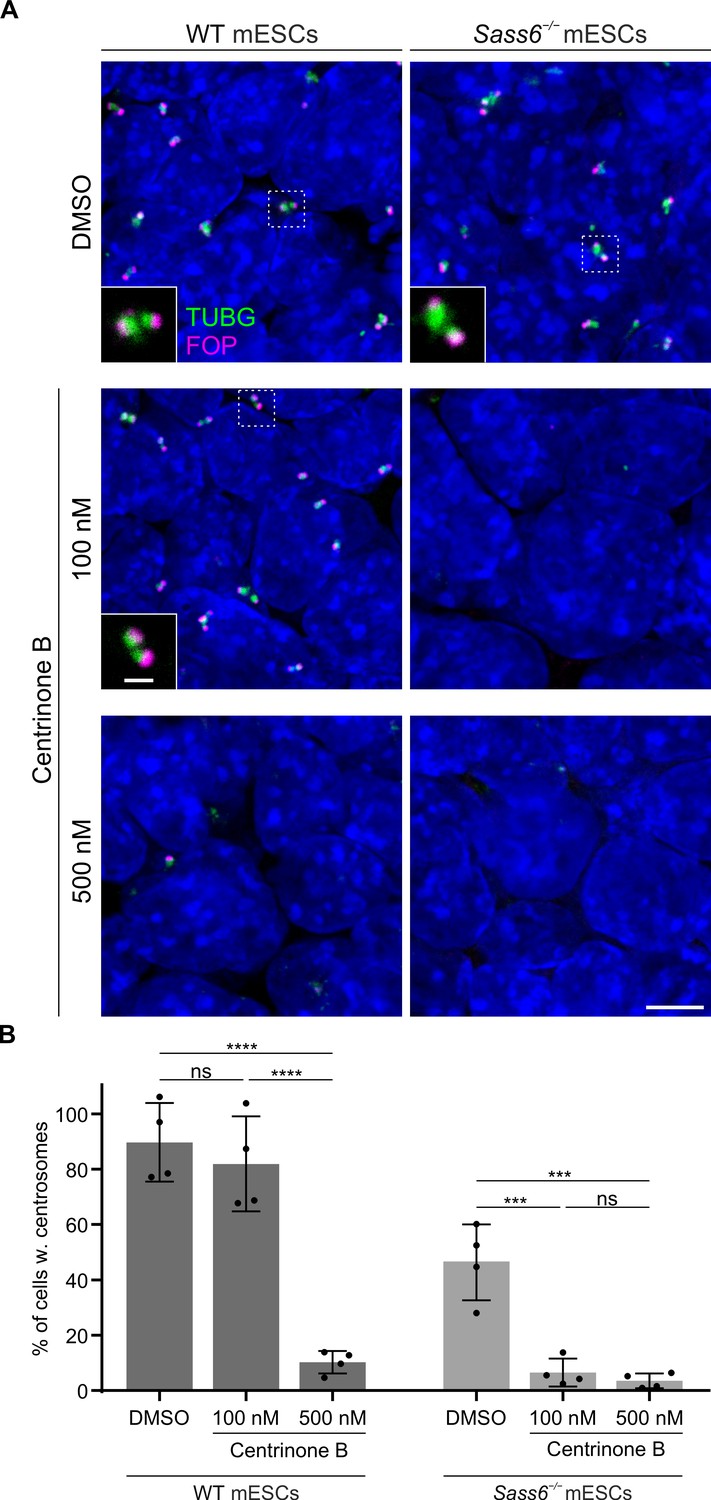
SAS-6-independent centriole formation in mouse embryonic stem cells (mESCs) depends on a threshold Polo-Like Kinase 4 (PLK4) activity.
(A) Immunostaining for TUBG and FOP in wild-type (WT) and Sass6−/− mESCs treated for 4 days with DMSO, 100 nM or 500 nM centrinone B. Insets are magnifications of the center of the dashed squares and show the representative image of the majority of population. Scale bars = 5 µm and 1 µm (insets). (B) Quantification of the percentage of cells with centrosomes (TUBG and FOP) from (A) from four independent experiments. Error bars represent mean ± SD WT, DMSO: 90 ± 12% (n=5280 cells), 100 nM: 82 ± 15% (n=6083 cells), 500 nM: 10 ± 4% (n=4809 cells); Sass6−/−, DMSO: 46 ± 12% (n=5786 cells), 100 nM: 6 ± 4% (n=7502 cells), 500 nM: 4 ± 2% (n=6220 cells). ***p<0.001, ****p<0.0001, ns = not significant with p>0.05 (one-way ANOVA with Tukey’s multiple comparisons).
Figure 8
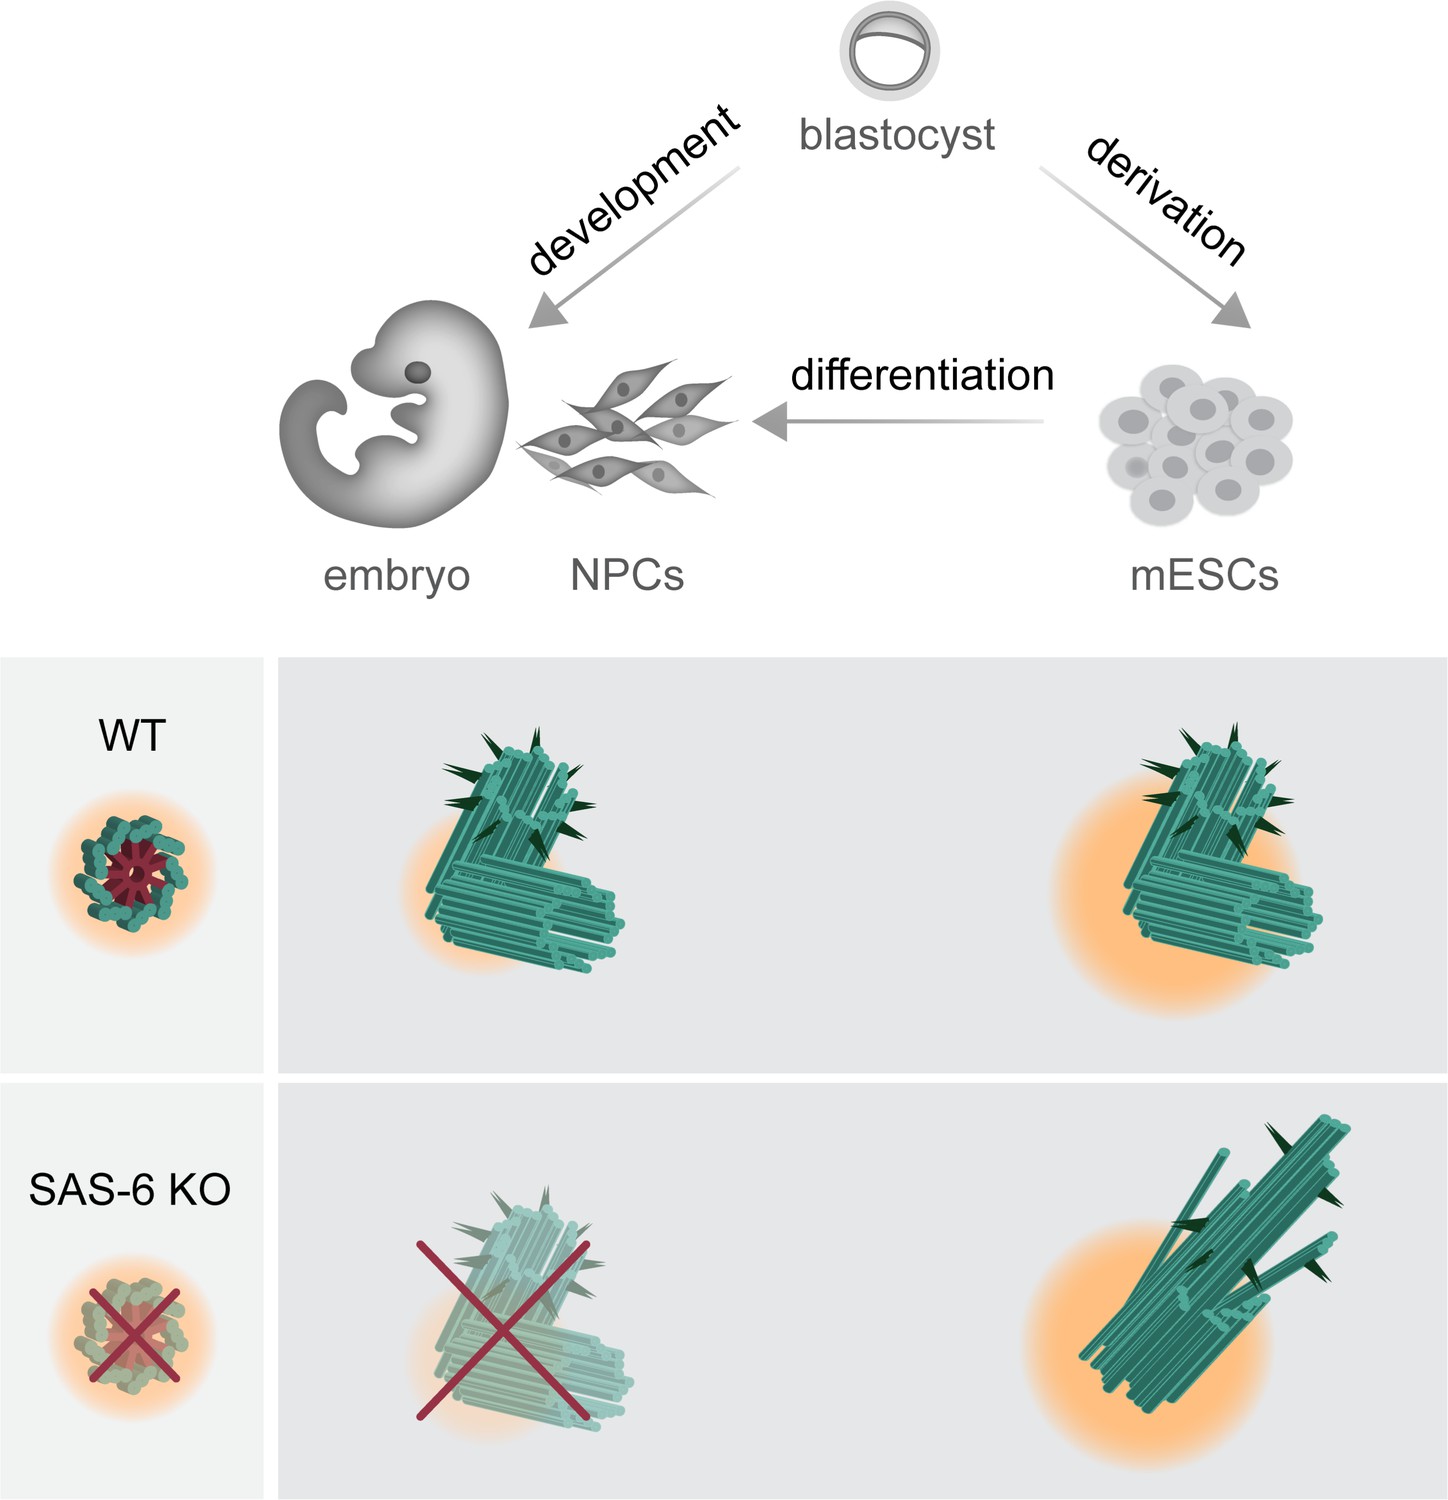
Graphical model depicting the consequences of SAS-6 loss in mouse embryos, mouse embryonic stem cells (mESCs), and neural progenitor cells (NPCs).
Compared to mouse embryos and in vitro differentiated NPCs, mESCs exhibit a higher concentration of centrosomal components and a robust Polo-Like Kinase 4 (PLK4) activity, as indicated by changes in pericentriolar material color and size. This difference permits the formation of abnormal centrioles in Sass6−/− mESCs, while it results in the loss of centrioles in developing mouse embryos and NPCs.
Tables
Table 1
Description of CRISPR/Cas9-mediated knockouts of Sass6 in the mouse in vivo.
| Sass6em4/em4 | Sass6em5/em5 | |
|---|---|---|
| Location | exon 4 | exon 5 |
| gRNA | 5′-GGTGGACTTCTTAGCTTTCC-3′ | 5′-ACCGGTCCTTTTAAACGTAG-3′ |
| Change | 3 bp del and 1 bp insertion (a net of 2 bp deletion) | 5 bp del |
| Mutation | NC_000069.7(Chr3)*: g.116399341_116399343delinsC | NC_000069.7(Chr3)*: g.116401034_116399338del |
| InDel | GGTCTTCTTAGCTTTCC | ACCGGTCCTTTTAAACG |
| Predicted STOP codon | 130 amino acids downstream of the translation start site, with 78 amino acids not native to the protein | 129 amino acids downstream of the translation start site, with six amino acids not native to the protein |
-
*
RefSeq sequence number from GRCm39 assembly, NCBI annotation release 109.
Table 2
Description of CRISPR/Cas9 mediated knockout of Sass6 in mouse embryonic stem cells (mESCs).
| Sass6−/− mESCs | |
|---|---|
| Location | Deletion of entire ORF of Sass6 |
| gRNAs | 5′-TAACAAACGTGGCCGCCTGA-3′ 5′-ACCAAGCCTGAGTTACACAA-3′ |
| Change | 34,524 bp deletion |
| Mutation | NC_000069.7(Chr3)*:g.116388519_116423042del |
| Predicted protein | No predicted protein expression |
-
*
RefSeq sequence number from GRCm39 assembly, NCBI annotation release 109.
Table 3
List of primary antibodies used in this study.
| Antigen | Company | Catalog number | Dilution |
|---|---|---|---|
| Ac-TUB | Sigma-Aldrich | T6793 | IF (1:1000) U-ExM (1:500) |
| α-TUB | Sigma-Aldrich | T6074 | U-ExM (1:500) |
| β-TUB | Sigma-Aldrich | T8328 | U-ExM (1:200) |
| ARL13B | Proteintech | 17711–1-AP | IF (1:1000) |
| CEP97 | Proteintech | 22050–1-AP | U-ExM (1:50) |
| CEP135 | Proteintech | 24428–1-AP | U-ExM (1:200) |
| CEP152 | Sigma-Aldrich | HPA039408 | IF (1:100) |
| CEP164 | Proteintech | 22227–1-AP | IF (1:1000) U-ExM (1:500) |
| Cl. CASP3 | Cell Signaling | 9661 | IF (1:400) |
| CP110 | Proteintech | 12780–1-AP | U-ExM (1:250) |
| FOP | Sigma-Aldrich | WH0011116M1 | IF (1:500) |
| NESTIN | BioLegend R&D Systems | PRB-315C MAB2736 | IF (1:500) IF (1:300) |
| GAPDH | Merck | CB1001 | WB (1:10,000) |
| p53 | Cell Signaling | 2524 | IF (1:2000) |
| POC5 | Bethyl Laboratories | A303-341A | U-ExM (1:250) |
| SAS-4 | A kind gift from Pierre Gönczy, Ecole Polytechnique Fédérale de Lausanne (EPFL), Lausanne, Switzerland | IF (1:500) | |
| SAS-6 | A kind gift from Renata Basto, Institut Curie, Paris, France | IF (1:300) WB (1:1000) | |
| STIL | Bethyl Laboratories | A302-441A | IF (1: 400) U-ExM (1:200) |
| TUBG | Sigma-Aldrich | T6557 | IF (1:1000) |
Additional files
Download links
A two-part list of links to download the article, or parts of the article, in various formats.
Downloads (link to download the article as PDF)
Open citations (links to open the citations from this article in various online reference manager services)
Cite this article (links to download the citations from this article in formats compatible with various reference manager tools)
Mouse SAS-6 is required for centriole formation in embryos and integrity in embryonic stem cells
eLife 13:e94694.
https://doi.org/10.7554/eLife.94694


