Taste triggers a homeostatic temperature control in hungry flies
- Department of Neurobiology, Physiology and Behavior, University of California, Davis, United States
- Department of Entomology and Nematology, University of California, Davis, United States
- Division of Developmental Biology, Cincinnati Children’s Hospital Medical Center, United States
Figures
Figure 1 with 1 supplement
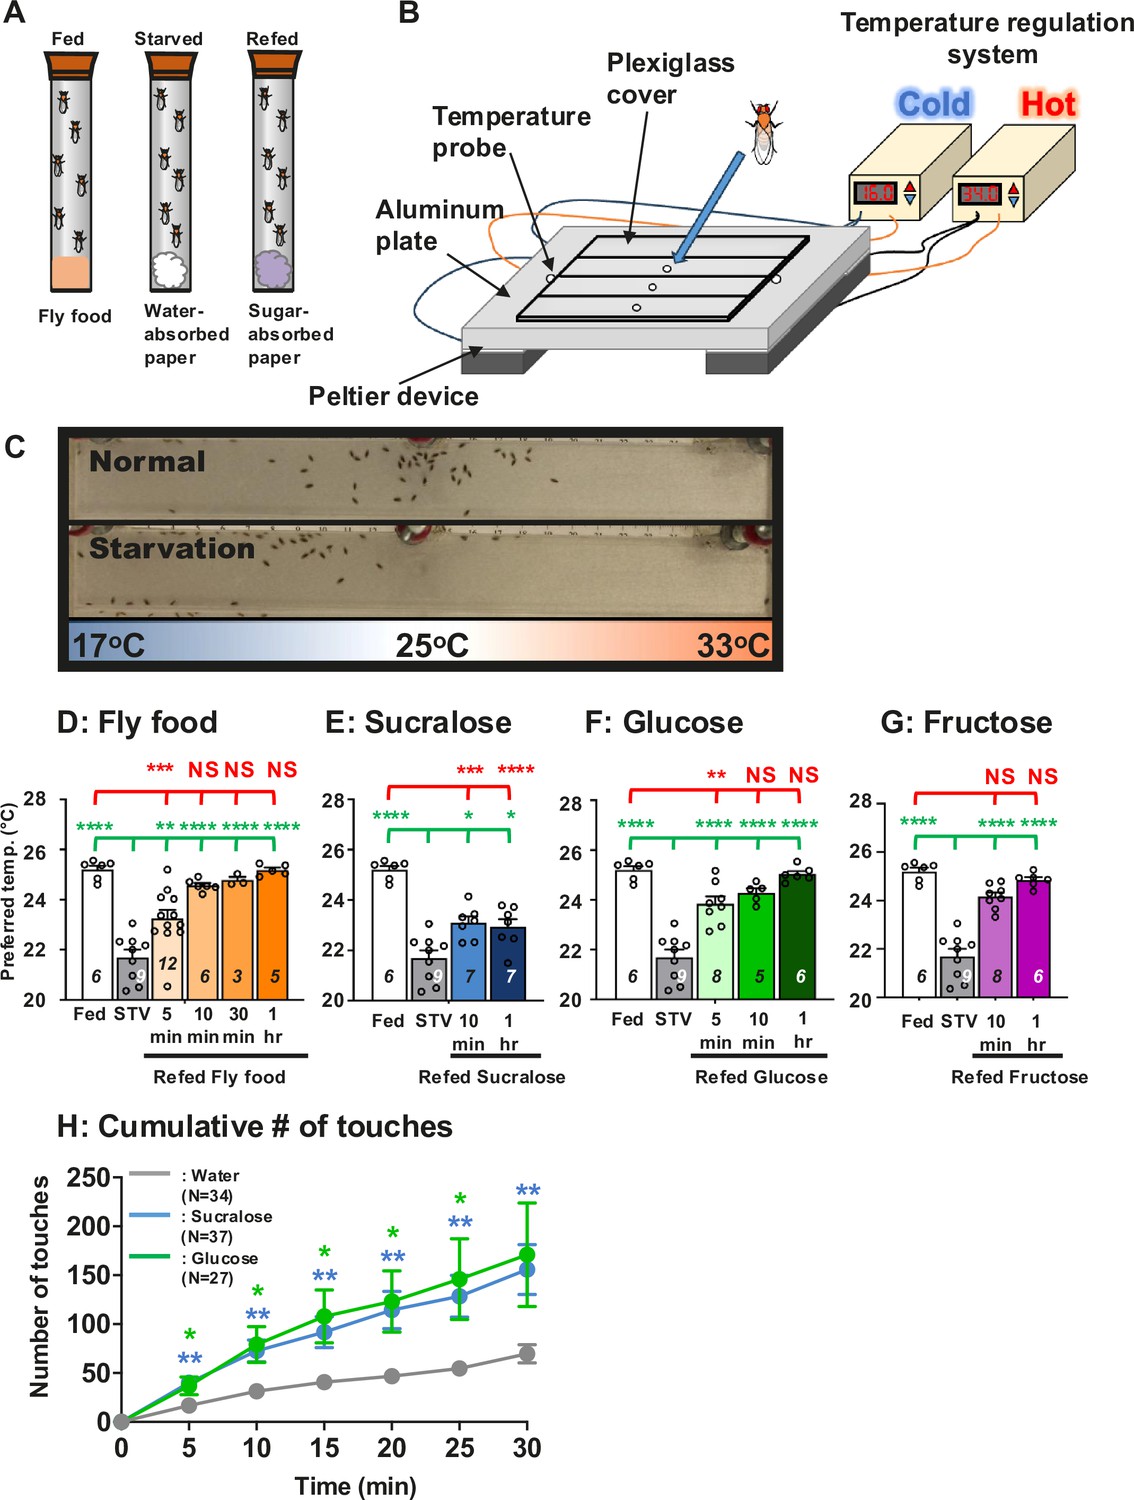
Hungry flies switch from cold to warm preference upon food detection.
(A) Three different feeding conditions, fed, starved and refed, were used in this study. (B) A temperature gradient of 17–33°C in air is established in the chamber between the aluminum metal plate and the plexiglas cover. Flies are applied through the hole into the chamber. Once the flies are applied, they spread out in the chamber and then gradually accumulate at the specific temperature ranges within 30 min, which is called the preferred temperature (Tp). (C) One of the representative results of Tp experiments (top, normal (fed flies); bottom, starvation (starved flies)). Since their body temperature is close to the temperature of their surrounding microenvironment, their body temperature is determined by measuring their Tp. (D–G) Comparison of preferred temperature (Tp) of white1118 (w1118) control flies between fed (white bar), starved (STV; gray bar), and refed (orange, blue, or green bar) states. Starvation was applied for 1 overnight (ON). Starved flies were refed with fly food (orange bar) for 5, 10, 30, or 60 min (1 hr) (D), 2.8 mM sucralose solution (blue bar) for 10 min or 1 hr (E), 2.8 mM (equivalent to 5%) glucose solution (green bar) for 5 min, 10 min, or 1 hr (F), or 2.8 mM fructose solution (purple bar) for 10 min or 1 hr (G). Behavioral experiments were performed at the specific time points, Zeitgeber time (ZT) 4–7. ZT0 and ZT12 are light on and light off, respectively. Dots on each bar indicate individual Tp in the assays. Numbers in italics indicate the number of trials. The Shapiro–Wilk test was performed to test for normality. One-way ANOVA was performed to compare Tp between each refeeding condition. Red or green stars indicate Tukey’s post hoc test comparing differences between experimental and fed or starved conditions, respectively. Data are presented as mean Tp with SEM. *p < 0.05. **p < 0.01. ***p < 0.001. ****p < 0.0001. NS indicates no significance. (H) Feeding assay: The number of touches to water (gray), 2.8 mM (equivalent to 5%) glucose (green), or 2.8 mM sucralose in each solution (blue) was examined using w1118 flies starved for 24 hr. Water, glucose, and sucralose were tested individually in the separate experiments. A cumulative number of touches to water or sugar solution for 0–30 min was plotted. Two-way ANOVA was used for multiple comparisons. Blue and green stars show Fisher’s LSD post hoc test comparing sucralose (blue stars) or glucose (green stars) solution feeding to water drinking. All data shown are means with SEM. *p < 0.05. **p < 0.01. ***p < 0.001. ****p < 0.0001.
-
Figure 1—source data 1
Statistical analysis for preferred temperatures (Tp).
- https://cdn.elifesciences.org/articles/94703/elife-94703-fig1-data1-v1.docx
Figure 1—figure supplement 1

Compilation of refeeding experiments derived from Figure 1D–G.
Comparison of Tp among the following conditions in w1118 (control) flies: fed (white bar), starved overnight (O/N) (water or STV; gray bar), refed with fly food (fly food; orange bar), sucralose (blue bars), glucose (green bars), or fructose (purple bars). The same data are used in Figure 1D–G. A distribution of temperature preference in each condition is shown in Figure 2—figure supplement 1A. The Shapiro–Wilk test was performed to test for normality. One-way ANOVA was performed to compare Tp between each refeeding condition. Red (or green) stars indicate Tukey’s post hoc test comparing differences between experimental and fed (or starved) conditions, respectively. *p < 0.05. ***p < 0.001. ****p < 0.0001. NS indicates not significant.
Figure 2 with 1 supplement
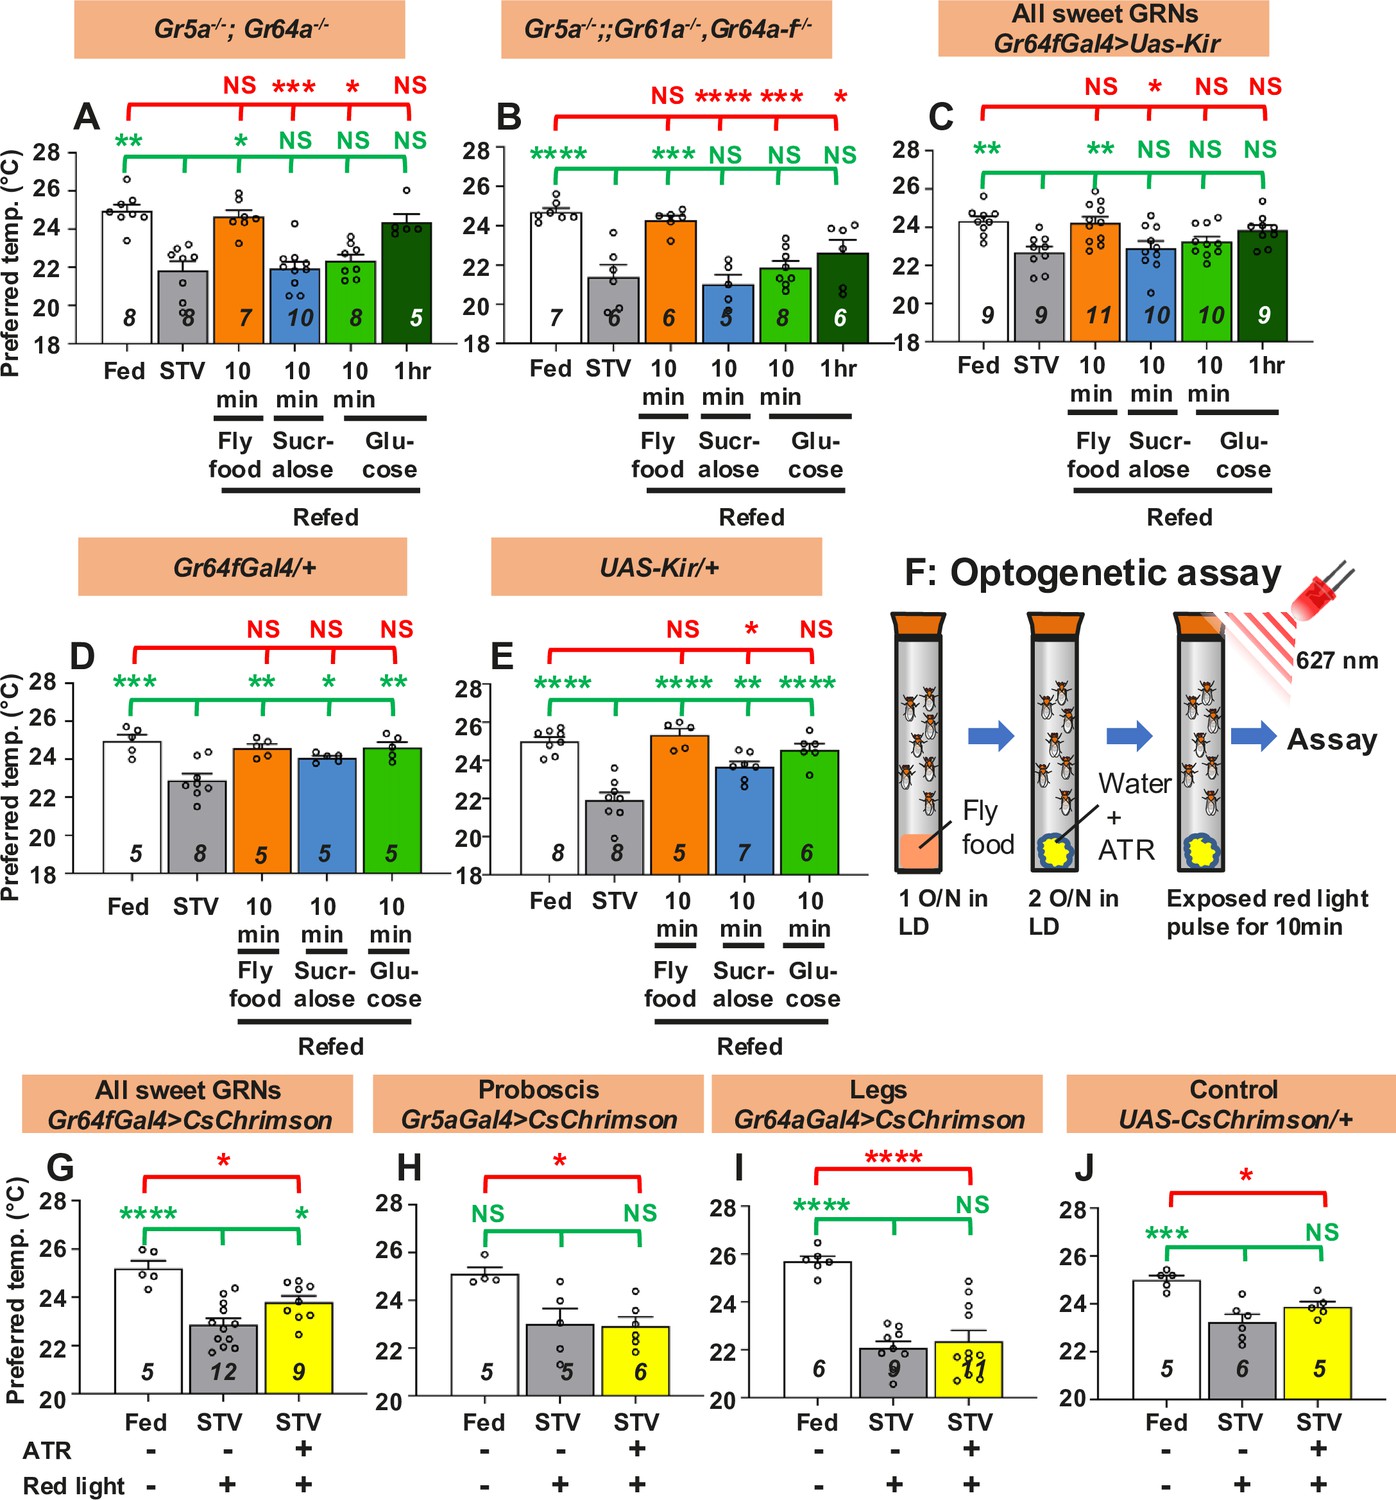
Gustatory neurons are essential for taste-evoked warm preference.
(A–E) Comparison of preferred temperature (Tp) of flies between fed (white bar), starved (STV; gray bar), and refed (orange, blue, green, or dark green bar) states. Flies were starved for two overnights (ON) except for Gr5a−/−;;Gr61a−/−, Gr64a-f−/− (1.5ON). Starved flies were refed with fly food for 10 min (fly food; orange bars), sucralose for 10 min (blue bars), or glucose for 10 min (green bars), or 1 hr (dark green bars). (F) Schematic of the optogenetic activation assay. (G–J) Comparison of Tp of flies between fed (white bar), starved (STV; gray bar), and starved with all-trans-retinal (ATR; yellow bars), which is the chromophore required for CsChrimson activation. Gustatory neurons in starved flies were excited by red light pulses (flashing on and off at 10 Hz) for 10 min. Starvation was performed for 2ON. Averaged fly distributions of flies in the temperature gradient for Gr64fGal4>CsChrimson are shown in Figure 2—figure supplement 1B. Behavioral experiments were performed on ZT4–7. Dots on each bar indicate individual Tp in assays. Numbers in italics indicate the number of trials. The Shapiro–Wilk test was used to test for normality. One-way ANOVA was used for statistical analysis. Red or green stars indicate Tukey’s post hoc test compared between each experiment and the fed (red) or starved (green) condition. All data presented are means with SEM. *p < 0.05. **p < 0.01. ***p < 0.001. ****p < 0.0001. NS indicates not significant.
-
Figure 2—source data 1
Statistical analysis for preferred temperatures (Tp).
- https://cdn.elifesciences.org/articles/94703/elife-94703-fig2-data1-v1.docx
Figure 2—figure supplement 1
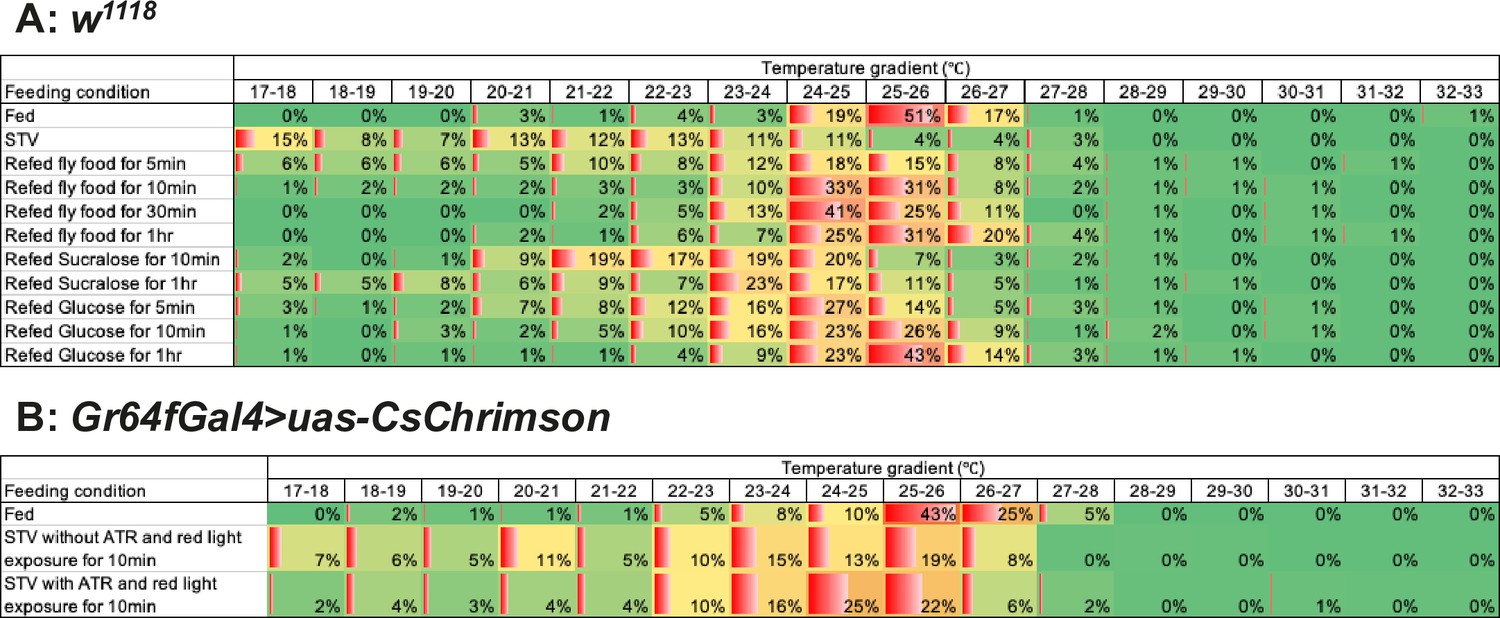
The distribution of temperature preference in each experimental condition.
Comparison of the distribution of temperature preference in each feeding condition in w1118 control flies (A) and the Gr64fGal4>CsChrimson flies (B). Heat maps were generated using the Conditional formatting tool in Microsoft Excel. The averaged percentages of flies settling on the apparatus within each one-degree temperature interval were used to create the heat maps. Each parameter to draw them using Conditional formatting tool is as follows: minimum value: 0, midpoint value: 15%, and maximum value: 60% for w1118. Minimum value: 0, midpoint value: 10%, and maximum value: 45% for Gr64fGal4>CsChrimson.
Figure 3 with 1 supplement
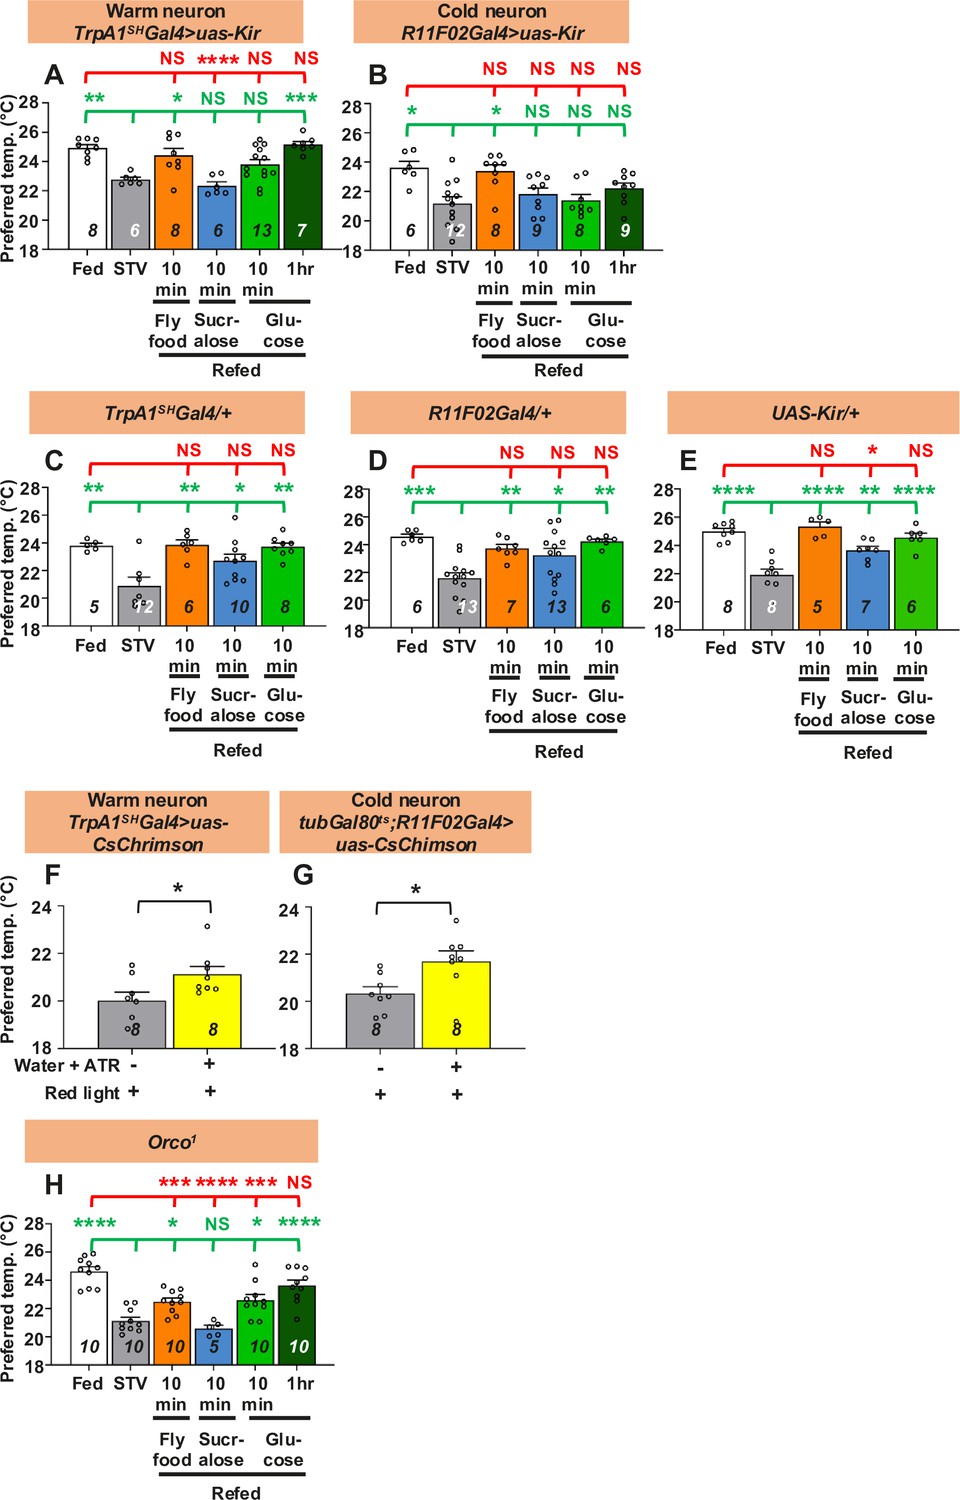
Both warm and cold temperature-sensing neurons are involved in taste-evoked warm preference.
(A–E, H) Comparison of preferred temperature (Tp) of flies between fed (white bar), starved (STV; gray bar), and refed (orange, blue, green, or dark green bar) conditions. Starvation was applied for two overnights (ON). Starved flies were refed with fly food for 10 min (orange bar), sucralose for 10 min (blue bar), or glucose for 10 min (green bar) or 1 hr (dark green bar). The Shapiro–Wilk test was used to test for normality. One-way ANOVA or Kruskal–Wallis test was used for statistical analysis. Red or green stars indicate Tukey’s post hoc test or Dunn’s test compared between each experiment and the fed (red) or starved (green) condition, respectively. (F, G) Comparison of Tp between starved (STV; gray bar) and all-trans-retinal (ATR; yellow bar) starved flies. Starvation was performed for 2ON. Warm neurons (F) or cold neurons (G) in starved flies expressed CsChrimson, which was excited by red light pulses for 10 min. The Shapiro–Wilk test was performed to test for normality. Student’s t-test or Kolmogorov–Smirnov test was used for statistical analysis. (G) tubGal80ts; R11F02-Gal4>uas-CsChrimson flies were reared at 18°C, and emerged adults were collected and stored at 29°C. See Materials and methods for details. These behavioral experiments were performed on ZT4–7. The dots on each bar indicate individual Tp in the assays. Numbers in italics indicate the number of experiments. All data shown are means with SEM. *p < 0.05. **p < 0.01. ***p < 0.001. ****p < 0.0001. NS indicates not significant.
-
Figure 3—source data 1
Statistical analysis for preferred temperatures (Tp).
- https://cdn.elifesciences.org/articles/94703/elife-94703-fig3-data1-v1.docx
Figure 3—figure supplement 1

Duration of starvation is unlikely to affect the ability to recover.
Comparison of preferred temperature (Tp) of w1118 control flies between fed (white bar), starved (STV; gray bar), and refed conditions (blue or green bar). Flies were starved for overnight (STV1ON; gray bar) or 1.5 ON (STV1.5ON; dark gray bar), that is starved for 18–21 or 26–29 hr, respectively. Starved flies were refed with sucralose for 10 min (blue bar) or glucose for 10 min (green bar). These behavioral experiments were performed on ZT4–7. Dots on each bar indicate individual Tp in the assays. Numbers in italics indicate the number of trials. Shapiro–Wilk test was performed to test for normality. One-way ANOVA or Kruskal–Wallis test was used for statistical analysis. Red or green stars indicate Tukey’s post hoc test or Dunn’s test comparing differences between experimental and fed or starved conditions, respectively. All data shown are means with SEM. **p < 0.01. ***p < 0.001. ****p < 0.0001. NS indicates no significance. The same data from Fed, STV1ON, STV1ON + refed sucralose for 10 min and STV1ON +refed sucralose for 10 min in Figure 1B–F are used in Figure 3—figure supplement 1.
-
Figure 3—figure supplement 1—source data 1
Statistical analysis for preferred temperatures (Tp).
- https://cdn.elifesciences.org/articles/94703/elife-94703-fig3-figsupp1-data1-v1.docx
Figure 4 with 1 supplement
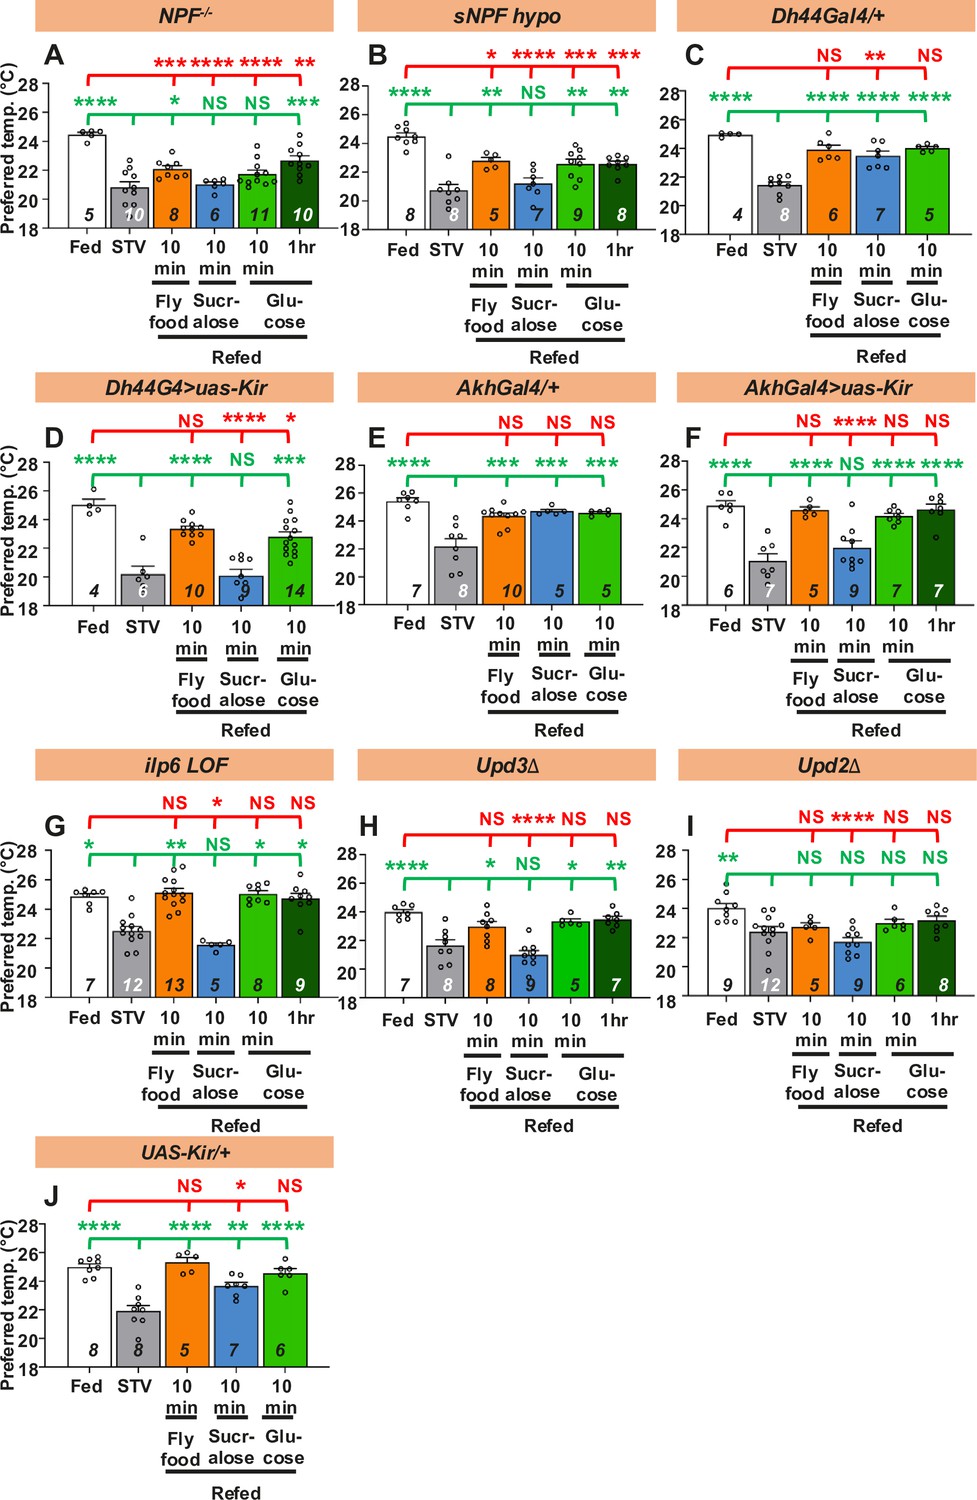
Hunger signals are involved in taste-evoked warm preference.
(A-J) Comparison of preferred temperature (Tp) of flies between fed (white bar), starved (STV; gray bar), and refed states (orange, blue, green, or dark green). Flies were starved for two overnights (ON) except for ilp6 mutant flies (3ON). Starved flies were refed with fly food (orange bar), sucralose (blue bar), or glucose (green bar) for 10 min. These behavioral experiments were conducted on ZT4–7. Dots on each bar indicate individual Tp in the assays. Numbers in italics indicate the number of trials. Shapiro–Wilk test was performed for normality test. One-way ANOVA was used for statistical analysis. Red or green stars indicate Tukey’s post hoc test comparing between each experiment to the fed (red) or starved (green) condition, respectively. All data presented are means with SEM. *p < 0.05. **p < 0.01. ***p < 0.001. ****p < 0.0001. NS indicates not significant.
-
Figure 4—source data 1
Statistical analysis for preferred temperatures (Tp).
- https://cdn.elifesciences.org/articles/94703/elife-94703-fig4-data1-v1.docx
Figure 4—figure supplement 1
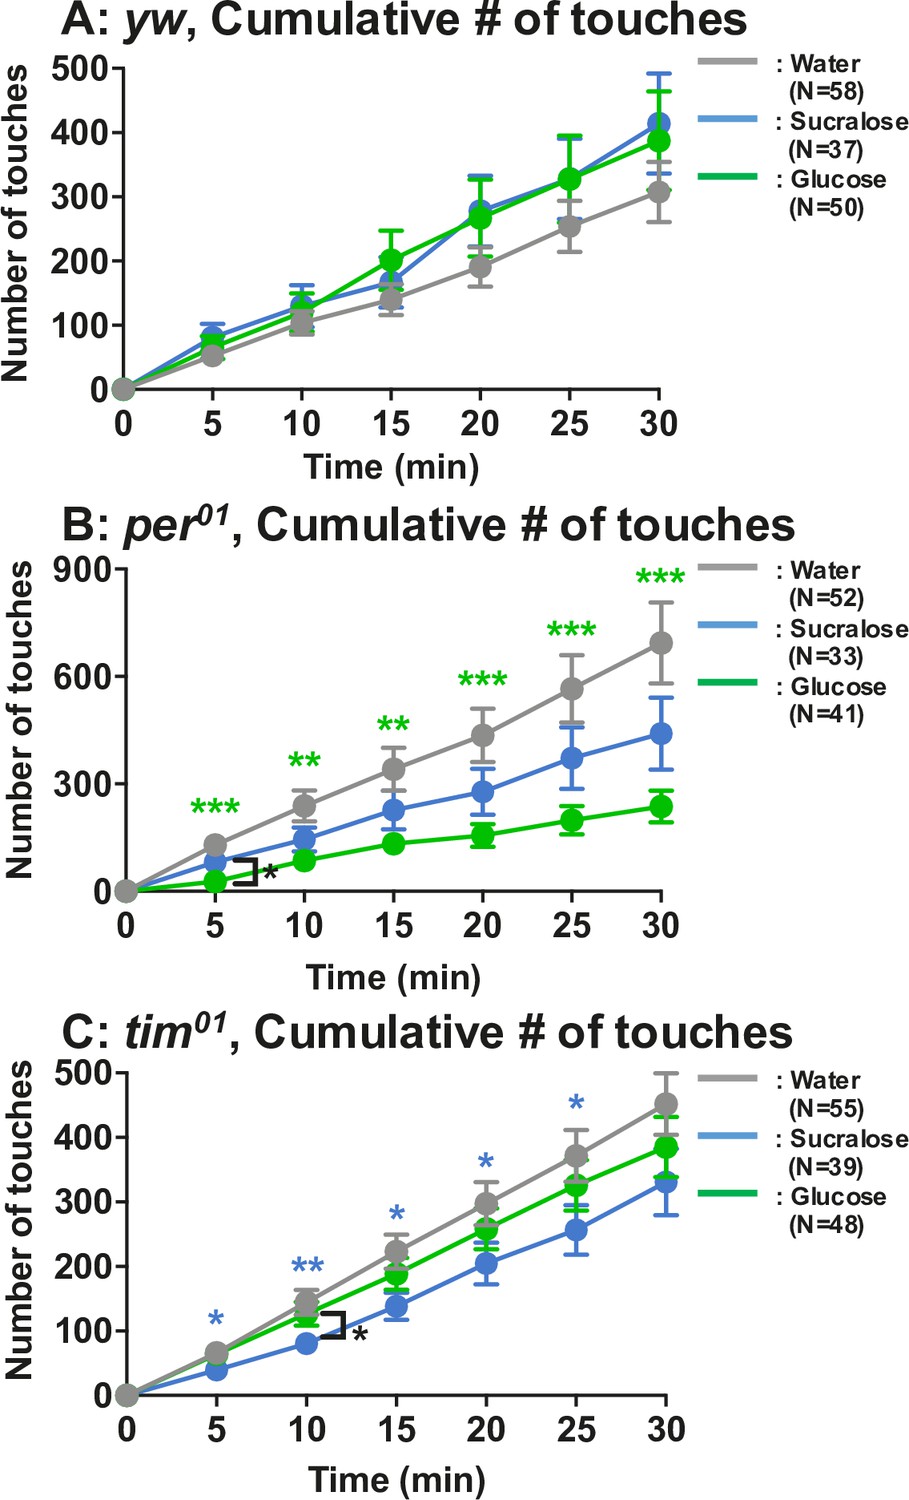
Number of touches to water, sucralose, and glucose using yw, per01, and tim01 flies.
Feeding assay: The number of touches to water (gray), 2.8 mM (equivalent to 5%) glucose (green), or 2.8 mM sucralose solution (blue) was examined using yw, per01, or tim01 flies starved for 24 hr. Cumulative number of touches for 0–30 min was plotted. Two-way ANOVA was used for multiple comparisons. Blue and green stars show Fisher’s LSD post hoc test comparing sucralose (blue stars) or glucose (green stars) solution feeding to water drinking. Black stars show the statistical difference between sucralose and glucose refeeding. All data presented are means with SEM. *p < 0.05. **p < 0.01. ***p < 0.001.
-
Figure 4—figure supplement 1—source data 1
Statistical analysis for preferred temperatures (Tp).
- https://cdn.elifesciences.org/articles/94703/elife-94703-fig4-figsupp1-data1-v1.docx
Figure 5
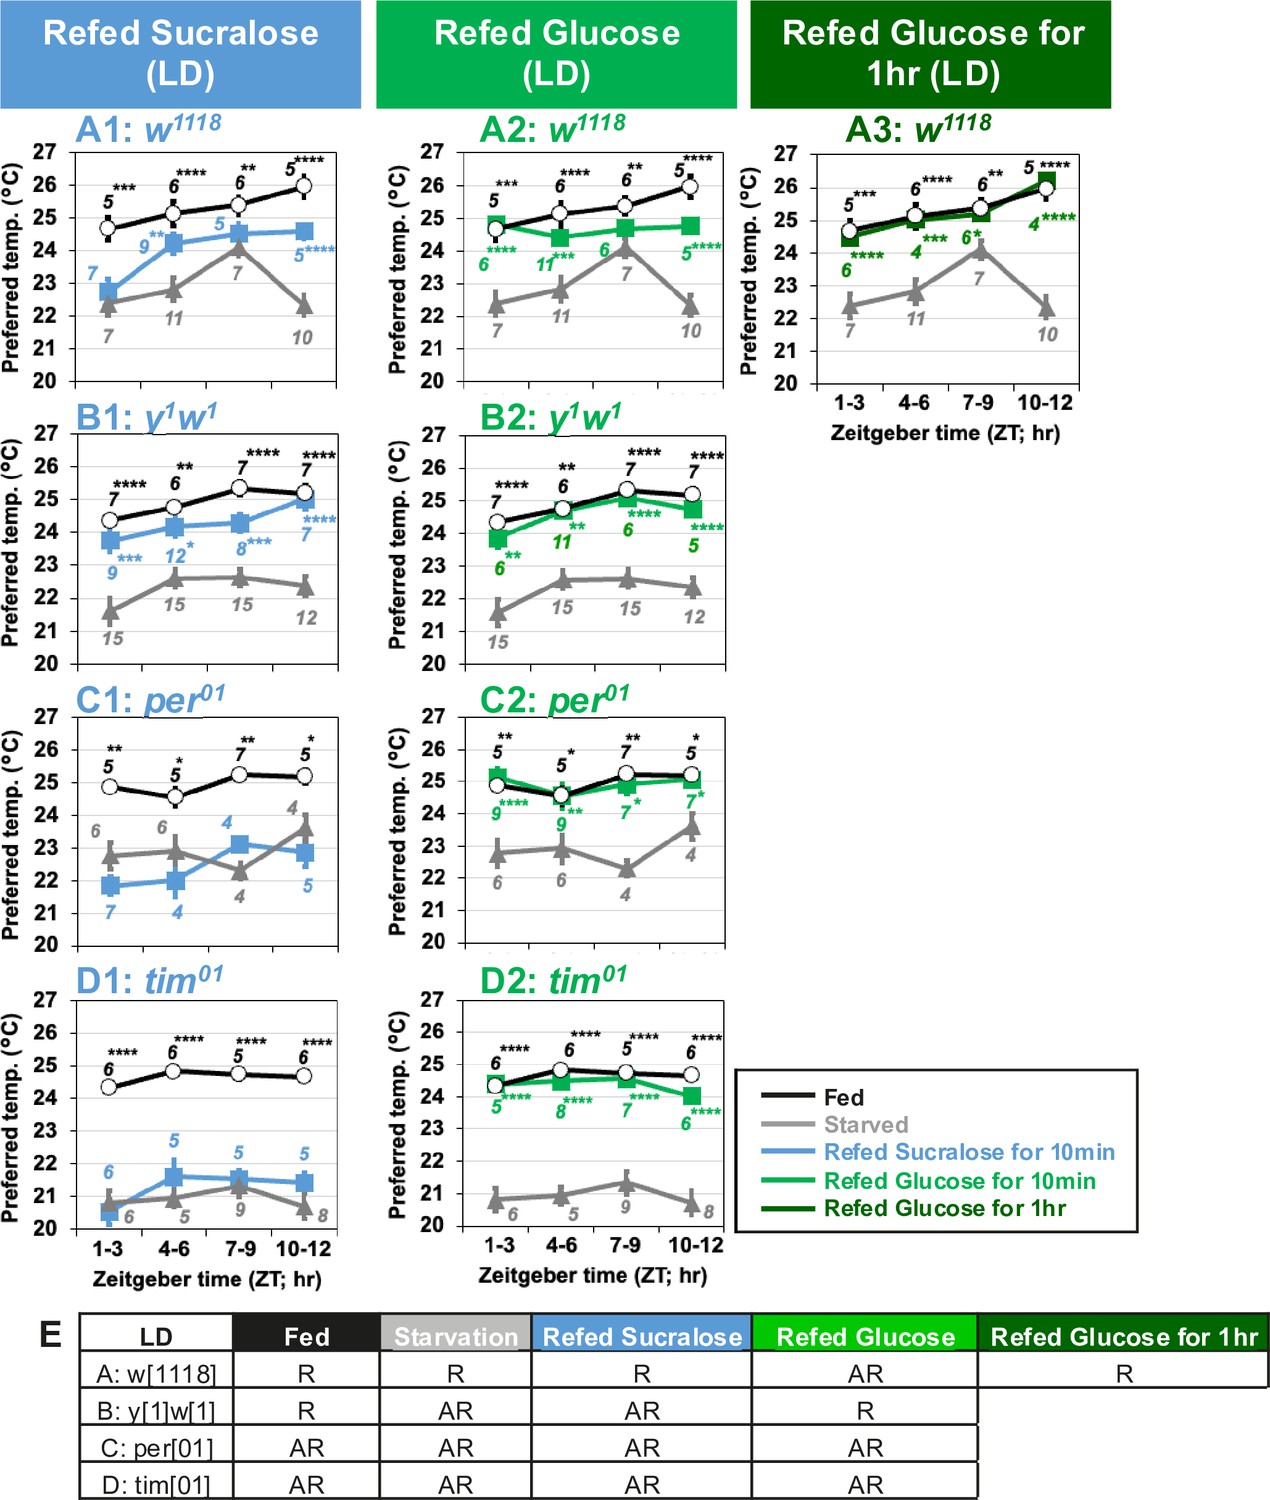
Clock genes are involved in taste-evoked warm preference.
(A–D) Comparison of preferred temperature (Tp) of flies between fed (white circles), starved (STV; gray triangles), and refed (blue, green, or dark green squares) states. Flies were starved for 24 hr. Starved flies were refed with sucralose blue squares (A1–D1) or glucose for 10 min green squares (A2–D2) or 1 hr dark green squares (A3). After the 10 min or 1 hr refeeding, the temperature preference behavior assays were performed immediately at ZT1–3, ZT4–6, ZT7–9, and ZT10–12 in LD. The Shapiro–Wilk test was performed to test for normality. One-way ANOVA or Kruskal–Wallis test was used for statistical analysis. Stars indicate Tukey’s post hoc test or Dunn’s test compared between each experiment and the starved condition at the same time point. All data presented are means with SEM. *p < 0.05. **p < 0.01. ***p < 0.001. ****p < 0.0001. (E) Comparison of Tp during the daytime in each feeding state. One-way ANOVA or Kruskal–Wallis test was used for statistical analysis between ZT1–3 and ZT7–9 or ZT10–12, respectively. R and AR indicate rhythmic and arrhythmic, respectively, during the daytime.
-
Figure 5—source data 1
Statistical analysis for preferred temperatures (Tp).
- https://cdn.elifesciences.org/articles/94703/elife-94703-fig5-data1-v1.docx
Figure 6

A schematic diagram of the recovery of preferred temperature (Tp) by taste-evoked warm preference (blue arrows) and nutrient-induced warm preference (green arrows).
Tables
Key resources table
| Reagent type (species) or resource | Designation | Source or reference | Identifiers | Additional information |
|---|---|---|---|---|
| Genetic reagent (D. melanogaster) | w1118 | Bloomington Drosophila Stock Center | BDSC:5905; RRID:BDSC_5905 | |
| Genetic reagent (D. melanogaster) | y1w1 | Bloomington Drosophila Stock Center | BDSC:1495; RRID:BDSC_1495 | |
| Genetic reagent (D. melanogaster) | EP5Δ; Gr64a1 | Dr. Anupama Dahanukar | PMID:17988633 | |
| Genetic reagent (D. melanogaster) | R1; Gr5a-LexA; +; ΔGr61a, ΔGr64a-f | Dr. Hubert Amrein | PMID:25984594; PMID:25702577 | |
| Genetic reagent (D. melanogaster) | Gr64f-Gal4 | Bloomington Drosophila Stock Center | BDSC:57669; RRID:BDSC_57669 | |
| Genetic reagent (D. melanogaster) | Gr5a-Gal4 | Bloomington Drosophila Stock Center | BDSC:57992; RRID:BDSC_57992 | |
| Genetic reagent (D. melanogaster) | Gr64a-Gal4 | Bloomington Drosophila Stock Center | BDSC:57661; RRID:BDSC_57661 | |
| Genetic reagent (D. melanogaster) | UAS-Kir | N/A | PMID:11222642 | |
| Genetic reagent (D. melanogaster) | UAS-CsChrimson | Bloomington Drosophila Stock Center | BDSC:82181; RRID:BDSC_82181 | |
| Genetic reagent (D. melanogaster) | TrpA1SH-Gal4 | Dr. Paul A. Garrity | PMID:18548007 | |
| Genetic reagent (D. melanogaster) | R11F02-Gal4 | Bloomington Drosophila Stock Center | BDSC:49828; RRID:BDSC_49828 | |
| Genetic reagent (D. melanogaster) | tubGal80ts | Bloomington Drosophila Stock Center | BDSC:7019; RRID:BDSC_7019 | |
| Genetic reagent (D. melanogaster) | Orco1 | Bloomington Drosophila Stock Center | BDSC:23129; RIDD:BDSC_23129 | |
| Genetic reagent (D. melanogaster) | NPF−/− | Bloomington Drosophila Stock Center | BDSC:83722; RRID:BDSC_83722 | |
| Genetic reagent (D. melanogaster) | sNPF hypomorph | Bloomington Drosophila Stock Center | BDSC:85000; RRID:BDSC_85000 | |
| Genetic reagent (D. melanogaster) | Dh44-Gal4 | Dr. Greg Suh | PMID:21709242 | |
| Genetic reagent (D. melanogaster) | Akh-Gal4 on II | Bloomington Drosophila Stock Center | BDSC:25683; RRID:BDSC_25683 | |
| Genetic reagent (D. melanogaster) | Ilp6 LOF | Bloomington Drosophila Stock Center | BDSC:30885; RRID:BDSC_30885 | |
| Genetic reagent (D. melanogaster) | Unpaird3Δ | Bloomington Drosophila Stock Center | BDSC:55728; RRID:BDSC_55728 | |
| Genetic reagent (D. melanogaster) | Unpaird2Δ | Bloomington Drosophila Stock Center | BDSC:55727; RRID:BDSC_55727 | |
| Genetic reagent (D. melanogaster) | period01 | Kindly shared from Dr. Paul H Taghert | PMID:5002428 PMID:6435882 | |
| Genetic reagent (D. melanogaster) | timeless01 | Kindly shared from Dr. Patrick Emery | PMID:8128246 | |
| Chemical compound, drug | PTFE | Sigma-Aldrich | Cat# 665800 | |
| Chemical compound, drug | PTFE plus | byFormica | https://byformica.com/collections/shop-intl/products/ptfe-3pc | |
| Chemical compound, drug | DMSO | Sigma-Aldrich | #472301 | |
| Chemical compound, drug | ATR | Sigma-Aldrich | #R2500 | |
| Chemical compound, drug | Sucralose | Sigma-Aldrich | #69293 | |
| Chemical compound, drug | Glucose | Sigma-Aldrich | #G7021 | |
| Chemical compound, drug | Fructose | Sigma-Aldrich | #F3510 | |
| Software, algorithm | GraphPad Prism | Dotmatics | https://www.graphpad.com/features | |
| Software, algorithm | Microsoft Excel | Microsoft | https://www.microsoft.com/en-us/microsoft-365/excel | |
| Software, algorithm | FLIC R code master | Dr. David Fletcher lab, PletcherLab, 2024 | https://github.com/PletcherLab/FLIC_R_Code |
Additional files
Download links
A two-part list of links to download the article, or parts of the article, in various formats.
Downloads (link to download the article as PDF)
Open citations (links to open the citations from this article in various online reference manager services)
Cite this article (links to download the citations from this article in formats compatible with various reference manager tools)
Taste triggers a homeostatic temperature control in hungry flies
eLife 13:RP94703.
https://doi.org/10.7554/eLife.94703.3


