Partial rejuvenation of the spermatogonial stem cell niche after gender-affirming hormone therapy in trans women
- Biology of the Testis (BITE) Laboratory, Genetics, Reproduction and Development (GRAD) Research Group, Vrije Universiteit Brussel, Belgium
- Inserm, EHESP, Institut de Recherche en Santé, Environnement et Travail (IRSET), Université de Rennes, France
- Core facility, Support for Quantitative and Qualitative Research (SQUARE), Vrije Universiteit Brussel, Belgium
- Department for Reproductive Medicine, Ghent University Hospital, Belgium
- Department of Endocrinology and Center for Sexology and Gender, Ghent University Hospital, Belgium
- In Vitro Toxicology and Dermato-Cosmetology (IVTD), Vrije Universiteit Brussel, Belgium
Figures
Figure 1
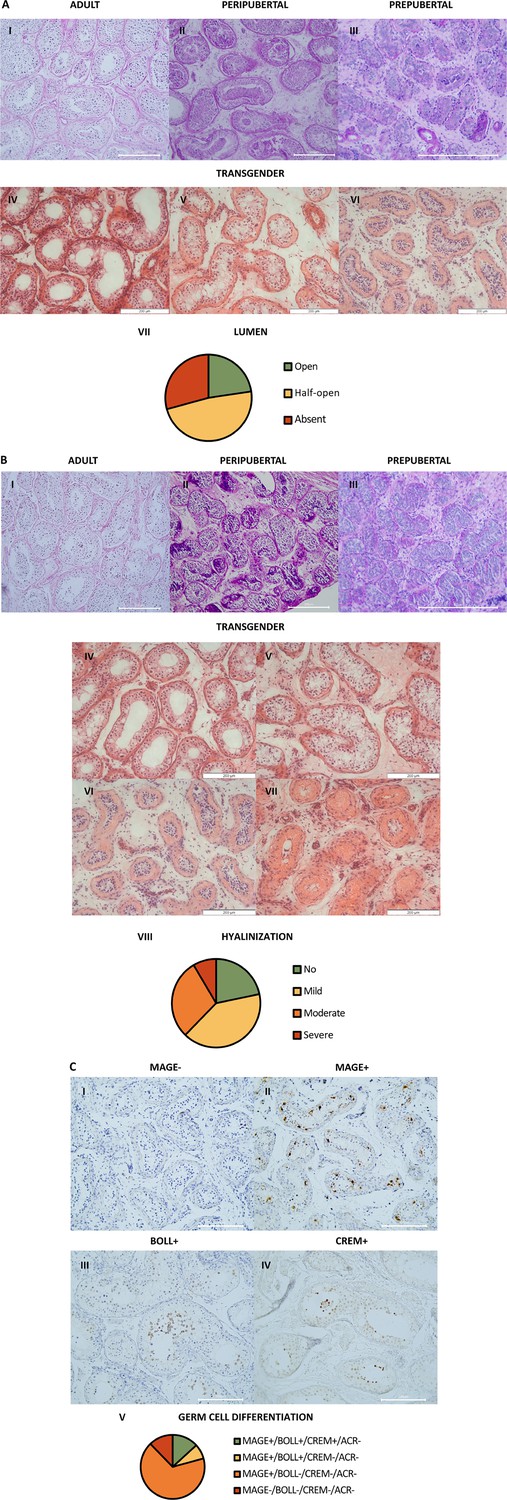
Atypical histology and arrest of germ cell differentiation in trans women.
(A) shows representative pictures of the lumen in adult (I), peripubertal (II), and prepubertal (III) controls, and an open (IV), half-open (V), or absent (VI) lumen in trans women. Graph VII shows the distribution of trans women over the three lumen categories. For each participant, the category was determined by the predominant pattern. (B) illustrates the hyalinization status in adult (I), peripubertal (II), and prepubertal (III) controls, and the hyalinization stages that could be observed in the trans women: no (IV), mild (V), moderate (VI), or severe (VII) hyalinization. Graph VIII shows the distribution of trans women over the hyalinization stages. For each participant, the category was determined by the predominant pattern. (C) demonstrates the different stages of germ cell differentiation that were present in trans women, namely MAGE-/BOLL-/CREM-/ACROSIN- (I), MAGE+/BOLL-/CREM-/ACROSIN- (II), MAGE+/BOLL+/CREM-/ACROSIN- (III), and MAGE+/BOLL+/CREM+/ACROSIN- (IV). No ACROSIN+ cells were detected. Graph V illustrates the distribution of trans women over the different stages of germ cell differentiation. Scale bars represent 200µm. MAGE: melanoma-associated antigen A4, BOLL: boule homolog RNA-binding protein, CREM: cAMP-responsive element modulator.
Figure 2
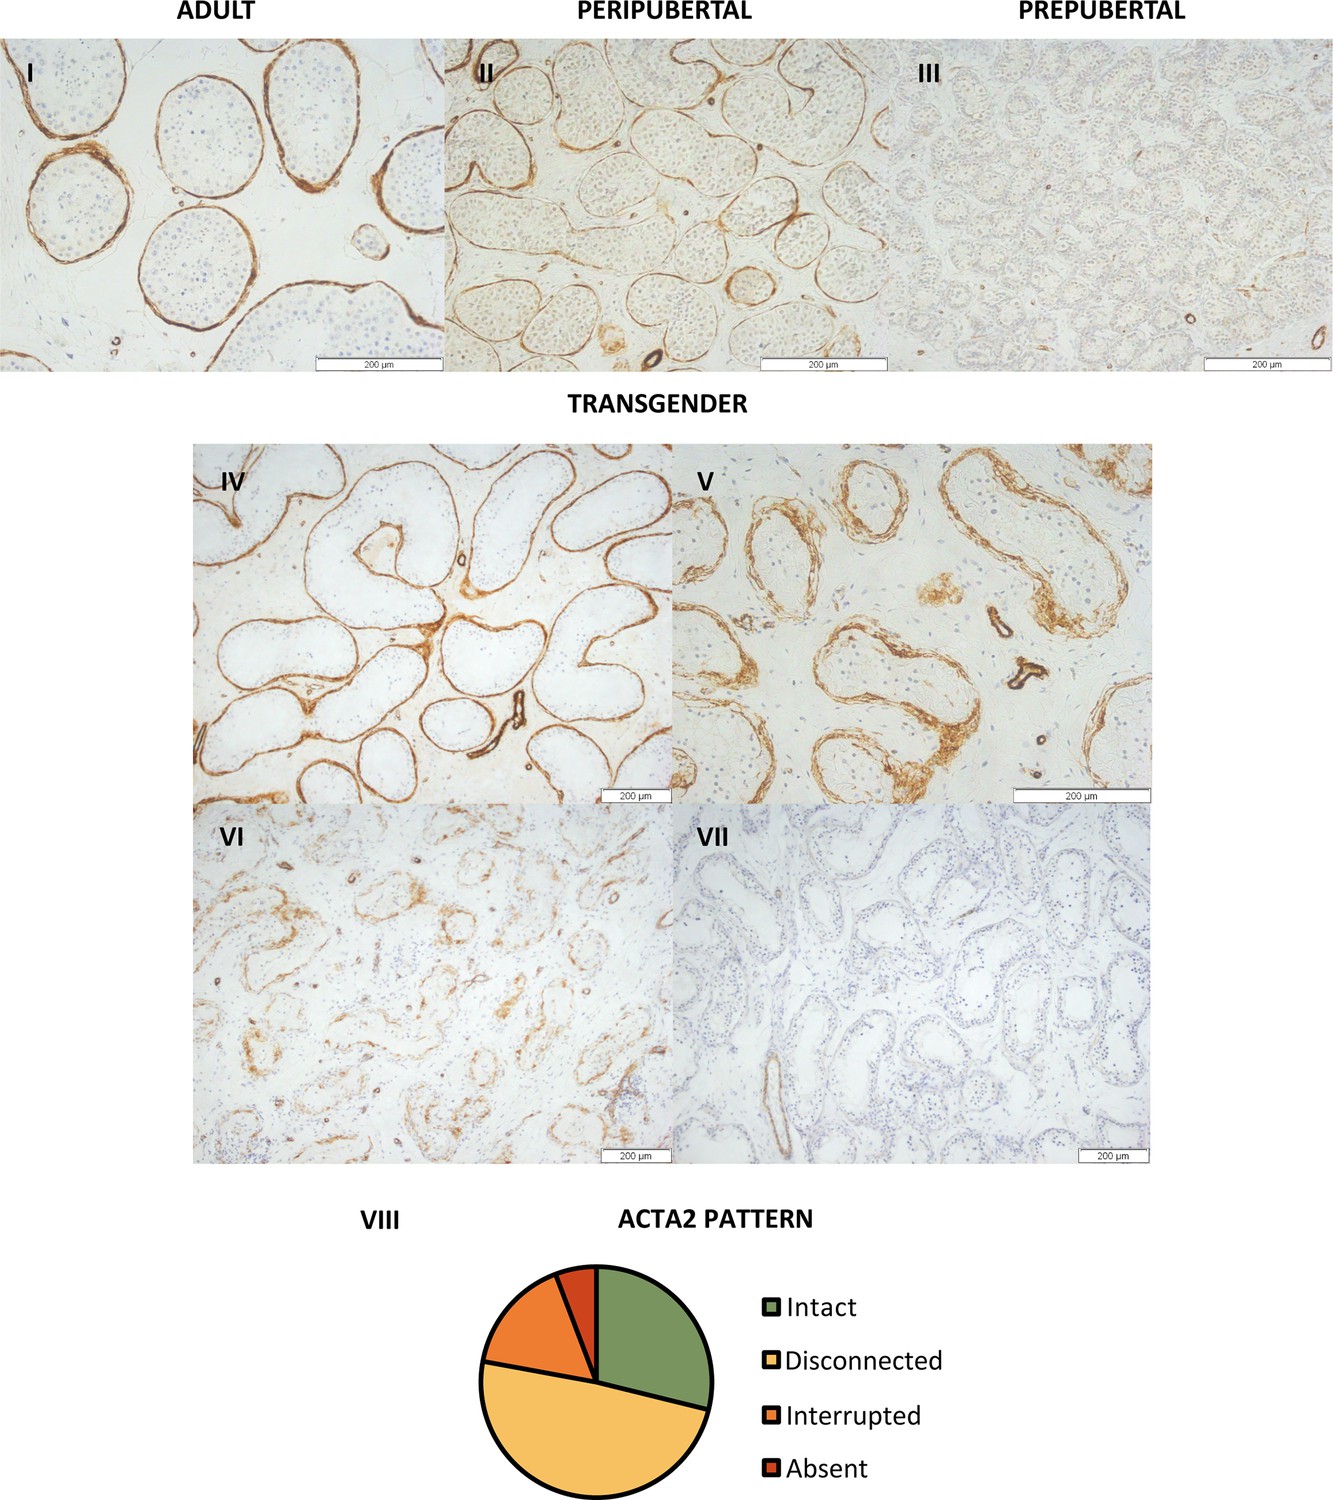
Distinct ACTA2 expression patterns in the peritubular myoid cells of trans women.
Representative images of the ACTA2 expression patterns in adult (I), peripubertal (II), and prepubertal control (III), together with the ‘intact’ (IV), ‘disconnected’ (V), ‘interrupted’ (VI), and ‘absent’ (VII) patterns seen in trans women. Panel VIII illustrates the distribution of trans women across the four ACTA2 patterns. For each participant, the ACTA2 category was determined by the predominant pattern. Scale bars represent 200 µm. ACTA2: alpha-smooth muscle actin 2.
Figure 3
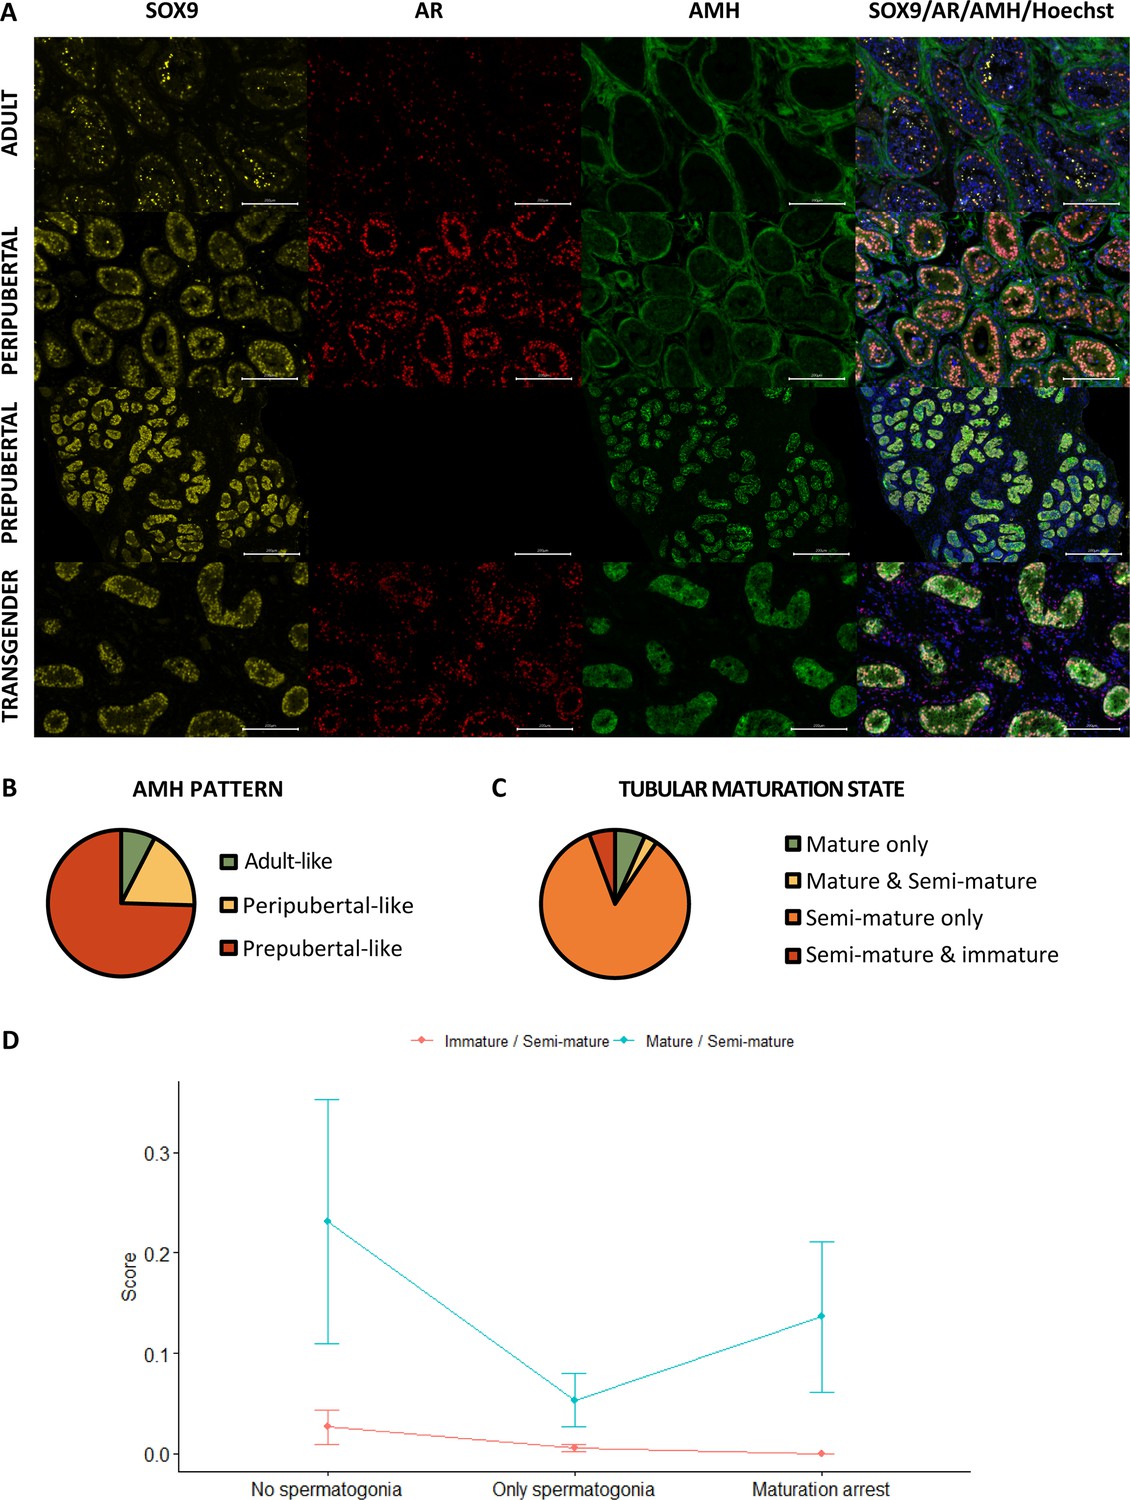
Partial Sertoli cell dedifferentiation in trans women.
(A) illustrates the presence of SOX9 (general marker), AR (mature marker), and AMH (immature marker) within the seminiferous tubules of adult, peripubertal, and prepubertal control tissues, as well as in transgender tissue. Graph B shows the presence of the different AMH expression patterns in trans women. Additionally, graph C summarizes the percentage of trans women with only mature tubules, both mature and semi-mature tubules, only semi-mature tubules, and a combination of semi-mature and immature tubules. Graph C shows the presence of the different AMH expression patterns in trans women. Graph D illustrates the variation in Sertoli cell maturation across the different spermatogenic conditions. Scale bars represent 200 µm. Data are shown as mean ± standard error. SOX9: SRY-box transcription factor 9, AR: androgen receptor, and AMH: anti-Müllerian hormone.
Figure 4
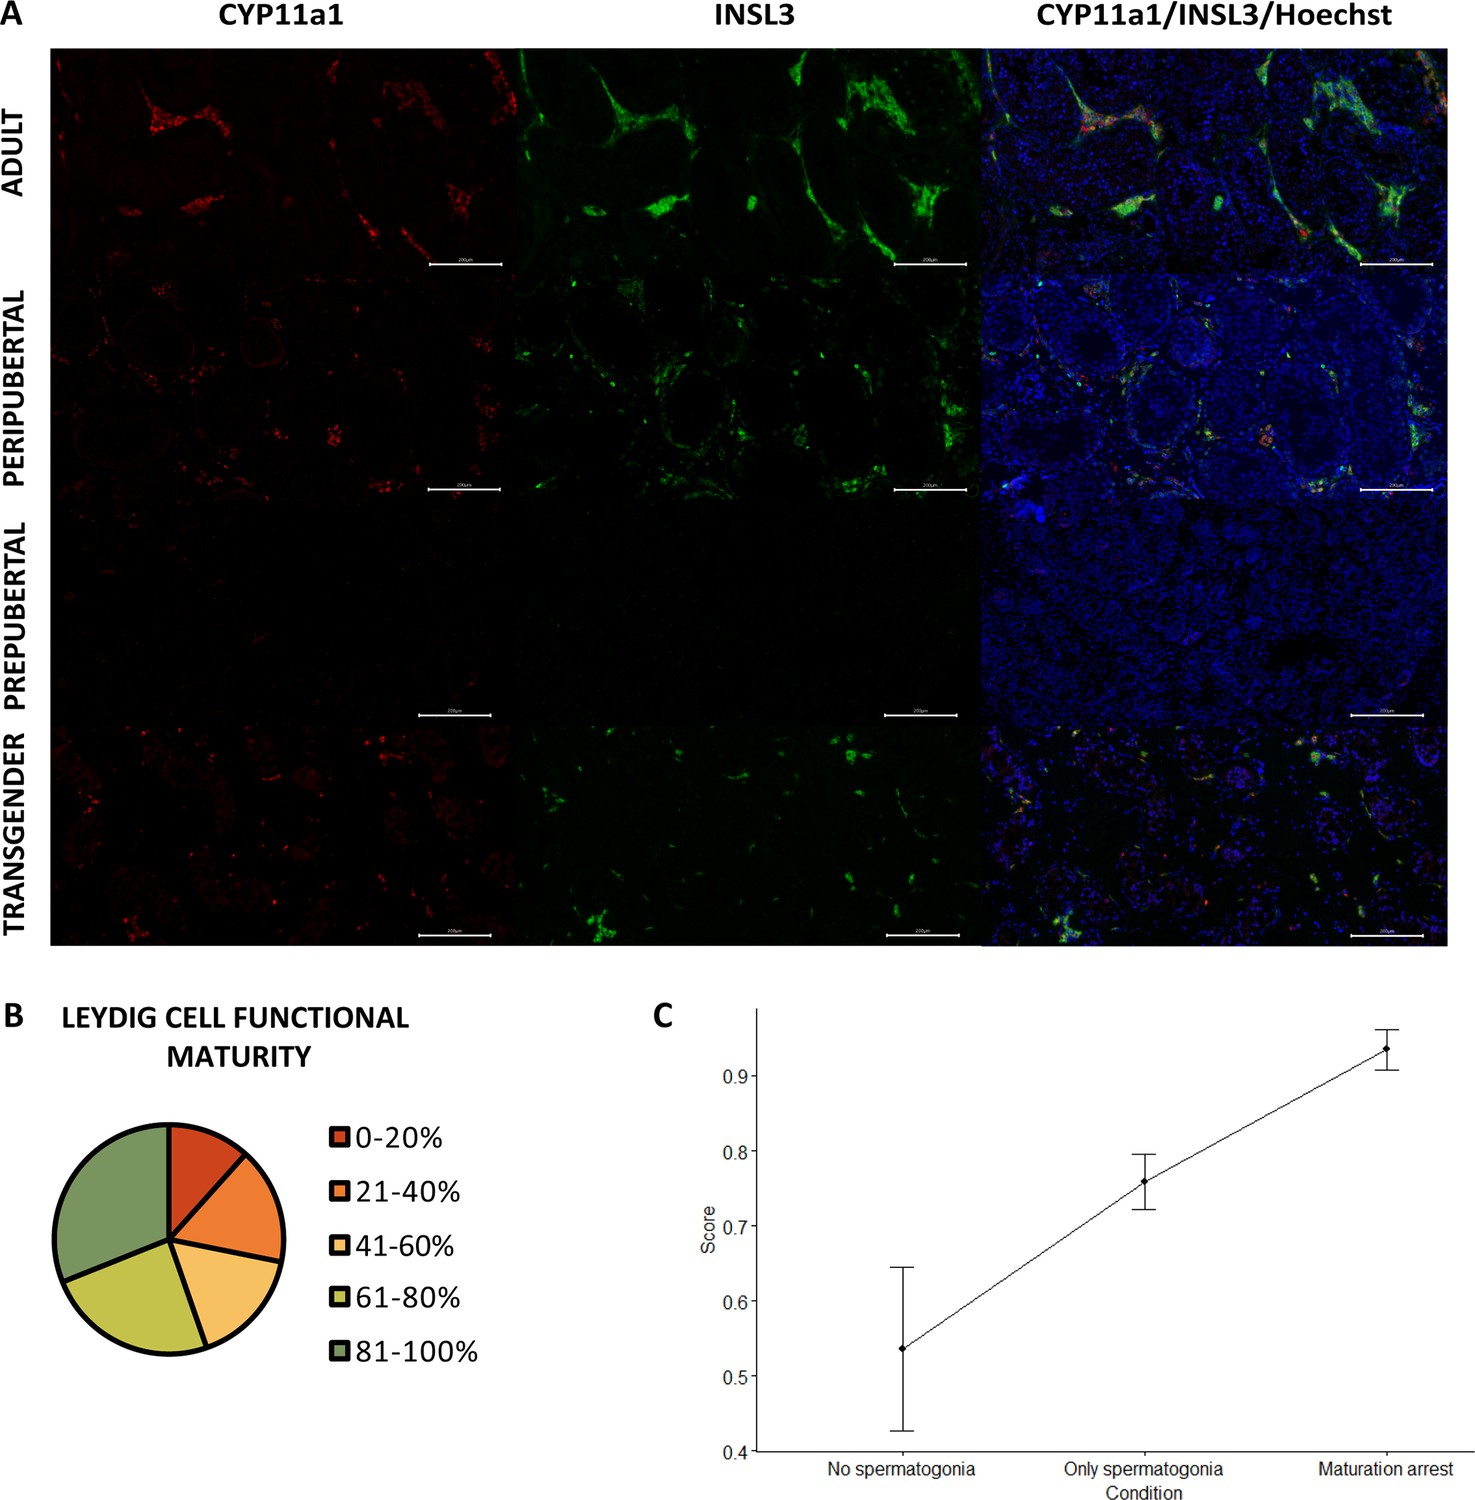
Reduced Leydig cell maturity and functionality in trans women.
(A) illustrates the presence of CYP11a1 (functional marker) and INSL3 (mature marker) within adult, peripubertal, and prepubertal control tissues, as well as in transgender tissue. Graph B categorizes the Leydig cell functional maturity. Graph C shows the difference in functional maturity between the conditions of spermatogenesis. Scale bars represent 200 µm. Data are shown as mean ± standard error. CYP11a1: cytochrome P45011 and INSL3: insulin-like factor 3.
Figure 5
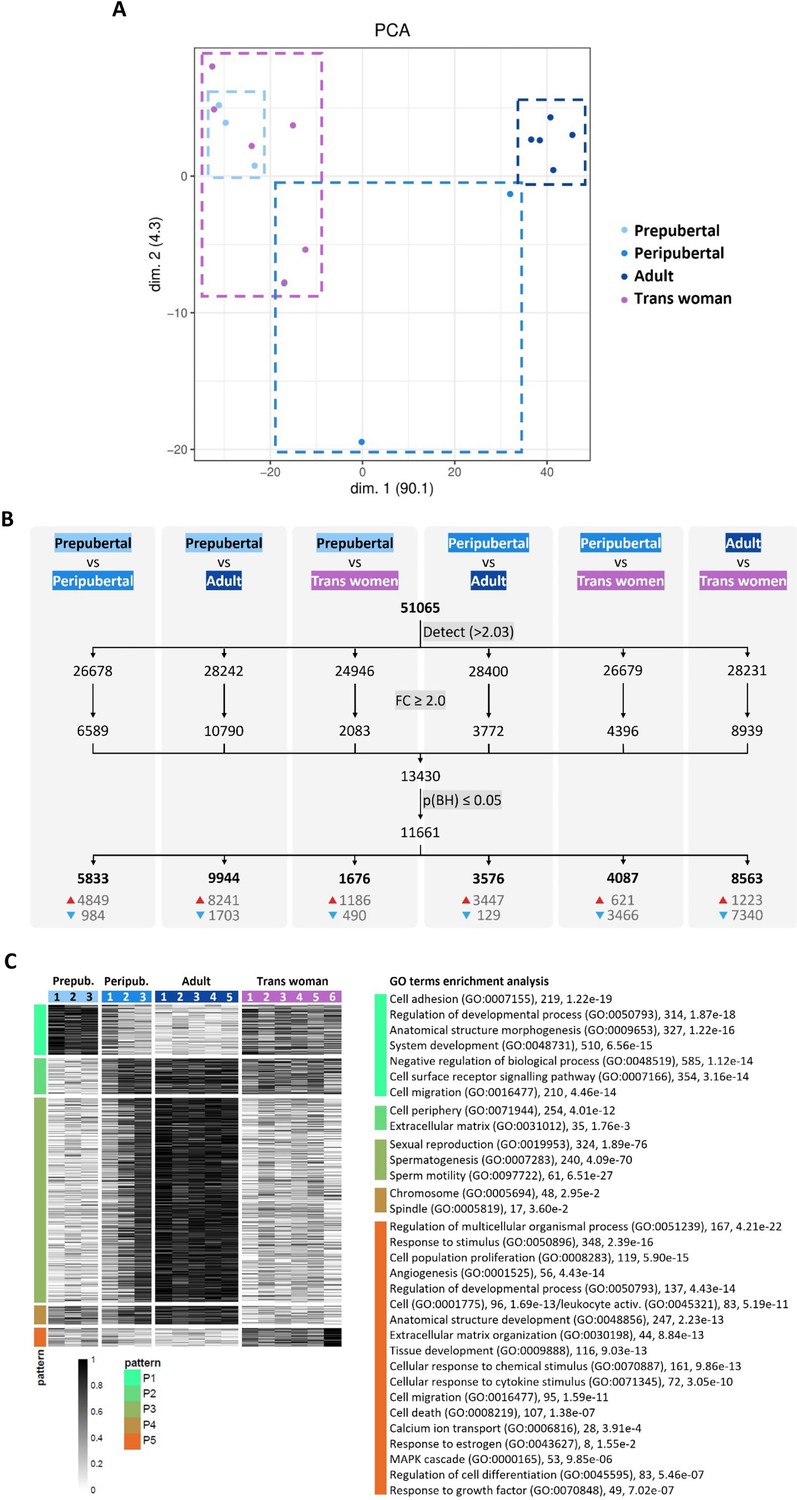
Transcriptome profile of control and transgender testicular tissue.
Projection on a two-dimensional PCA-based space of preprocessed sample data (A). The first dimension (dim. 1) represents around 90% of the variance in the data, segregating samples into two distinct groups: trans women/prepubertal and adult. Peripubertal samples were distributed across dim. 1. For each comparison (B), the number of genes above the background expression cutoff (2.032) is given (a total of 51,065 were analyzed). The threshold for identifying differentially expressed genes (DEGs) was set to ≥2.0 fold change (FC) and significance was determined using an adjusted p-value of ≤0.05 (B). The numbers at the bottom of the columns show upregulated (red arrow) and downregulated (blue arrow) DEGs. Heatmap representation of DEGs between the different types of testicular tissue analyzed (C). In total, 11,661 DEGs were detected and grouped into five expression patterns (P1–P5) highlighting similarities and differences between the tissue groups. Each row represents a gene and each column a different donor. On the right side, GO terms enrichment analysis reveals biological processes (and some cellular components) significantly associated with each expression pattern. Next to each GO term, the number of associated genes and the corresponding p-value are provided.
Tables
Table 1
Participant characteristics.
| Parameter | Median (range) | n |
|---|---|---|
| Age at start GAHT (years) | 27.4 (16.0–69.0) | 106 |
| Duration of GAHT (years) | 1.8 (0.4–7.0) | 106 |
| Type of GAHT | ||
| Oral | 72.6% | 106 |
| Transdermal | 27.4% | 106 |
| Age at surgery (years) | 31.0 (18.1–70.1) | 106 |
| Time last visit to SRS (days) | 92 (1–764) | 104 |
| Serum hormone levels | ||
| LH (U/L) | 0.1 (0.09–9.6) | 104 |
| FSH (U/L) | 0.19 (0.09–12.0) | 104 |
| T (ng/dL) | 18.1 (0.1–499.1) | 104 |
| E2 (ng/L) | 66.0 (14.1–776.0) | 105 |
| AMH (μg/L) | 7.5 (0.03–143.0) | 68 |
| Inhibin B (pg/mL) | 59.5 (0.8–193.6) | 69 |
Table 2
Testicular tissue characterization for gene expression analysis.
| Sample name | Age at biopsy/ orchidectomy (years) | Histological notes |
|---|---|---|
| Prepubertal 1 | 1 | Spermatogonia |
| Prepubertal 2 | 4 | Spermatogonia |
| Prepubertal 3 | 1 | Spermatogonia |
| Peripubertal 1 | 13 | Spermatocytes Absent seminiferous lumen |
| Peripubertal 2 | 15 | Spermatocytes Half-open seminiferous lumen |
| Peripubertal 3 | 12 | Elongated spermatids Half-open seminiferous lumen |
| Adult 1 | 72 | Normal spermatogenesis Orchidectomy |
| Adult 2 | 84 | Normal spermatogenesis Orchidectomy |
| Adult 3 | 38 | Normal spermatogenesis Re-anastomosis |
| Adult 4 | 73 | Normal spermatogenesis Orchidectomy |
| Adult 5 | 78 | Normal spermatogenesis, signs of fibrosis orchidectomy |
| Trans woman 1 | 18 | Spermatogonia |
| Trans woman 2 | 19 | Spermatogonia |
| Trans woman 3 | 25 | Spermatogonia |
| Trans woman 4 | 26 | Spermatogonia |
| Trans woman 5 | 34 | Spermatogonia |
| Trans woman 6 | 44 | Sertoli cell only |
Table 3
Antibody specifications.
| Antibody | Target cells | Dilution | Reference number | Company |
|---|---|---|---|---|
| MAGE-A4 | Spermatogonia and primary spermatocytes | 1/200 | / | Provided by Dr Giulio Spagnoli, University of Basel, Switzerland |
| BOLL | Secondary spermatocytes and round spermatids | 1/400 | H0006637 | Novusbio Bio-Techne, Oxon, UK |
| CREM | Round spermatids | 1/2000 | hpa001818 | Merck, Overijse, Belgium |
| ACROSIN | Round, elongating and elongated spermatids | 1/500 | sc67151 | Tebu-bio, Boechout, Belgium |
| ACTA2 | Peritubular myoid cells | 1/2000 | A2547 | Sigma-Aldrich, Overijse, Belgium |
| AMH | Immature Sertoli cells | 1/200 | MCA2246 | Bio-Rad, Temse, Belgium |
| AR | Mature Sertoli cells | 1/2000 | ab133273 | Abcam, Cambridge, UK |
| SOX9 | Sertoli cells | 1/200 | AB5535 | EMD Millipores, Overijse, Belgium |
| INSL3 | Mature Leydig cells | 1/2000 | HPA028615 | Sigma-Aldrich, Machelen, Belgium |
| CYP11a1 | Functional Leydig cells | 1/50 | 13363-I-AP | Proteintech, Manchester, UK |
| Goat anti-mouse-HRP | / | 1/200 | P0447 | Agilent Technologies, Glostrup, Denmark |
| Goat anti-rabbit-HRP | / | 1/200 | PI-1000 | Vector Laboratories, CA, USA |
| Goat anti-rabbit Alexa Fluor 647 | / | 1/200 | A21245 | Life Technologies, Carlsbad, CA, USA |
Additional files
-
Supplementary file 1
Reference values for luteinizing hormone.
- https://cdn.elifesciences.org/articles/94825/elife-94825-supp1-v1.docx
-
Supplementary file 2
Reference values for follicle-stimulating hormone.
- https://cdn.elifesciences.org/articles/94825/elife-94825-supp2-v1.docx
-
Supplementary file 3
Reference values for testosterone.
- https://cdn.elifesciences.org/articles/94825/elife-94825-supp3-v1.docx
-
Supplementary file 4
Reference values for estradiol.
- https://cdn.elifesciences.org/articles/94825/elife-94825-supp4-v1.docx
-
Supplementary file 5
Reference values for anti-Müllerian hormone.
- https://cdn.elifesciences.org/articles/94825/elife-94825-supp5-v1.docx
-
Supplementary file 6
Reference values for inhibin B.
- https://cdn.elifesciences.org/articles/94825/elife-94825-supp6-v1.docx
-
Supplementary file 7
Full list of GO terms enrichment analysis.
- https://cdn.elifesciences.org/articles/94825/elife-94825-supp7-v1.xlsx
-
MDAR checklist
- https://cdn.elifesciences.org/articles/94825/elife-94825-mdarchecklist1-v1.docx
Download links
A two-part list of links to download the article, or parts of the article, in various formats.
Downloads (link to download the article as PDF)
Open citations (links to open the citations from this article in various online reference manager services)
Cite this article (links to download the citations from this article in formats compatible with various reference manager tools)
Partial rejuvenation of the spermatogonial stem cell niche after gender-affirming hormone therapy in trans women
eLife 13:RP94825.
https://doi.org/10.7554/eLife.94825.3


