Differential conformational dynamics in two type-A RNA-binding domains drive the double-stranded RNA recognition and binding
- Department of Biology, Indian Institute of Science Education and Research (IISER), India
- Department of Biotechnology (with jointly merged Institute of Bioinformatics and Biotechnology), Savitribai Phule Pune University, India
- Department of Chemistry, Indian Institute of Science Education and Research (IISER), India
Figures
Figure 1 with 3 supplements
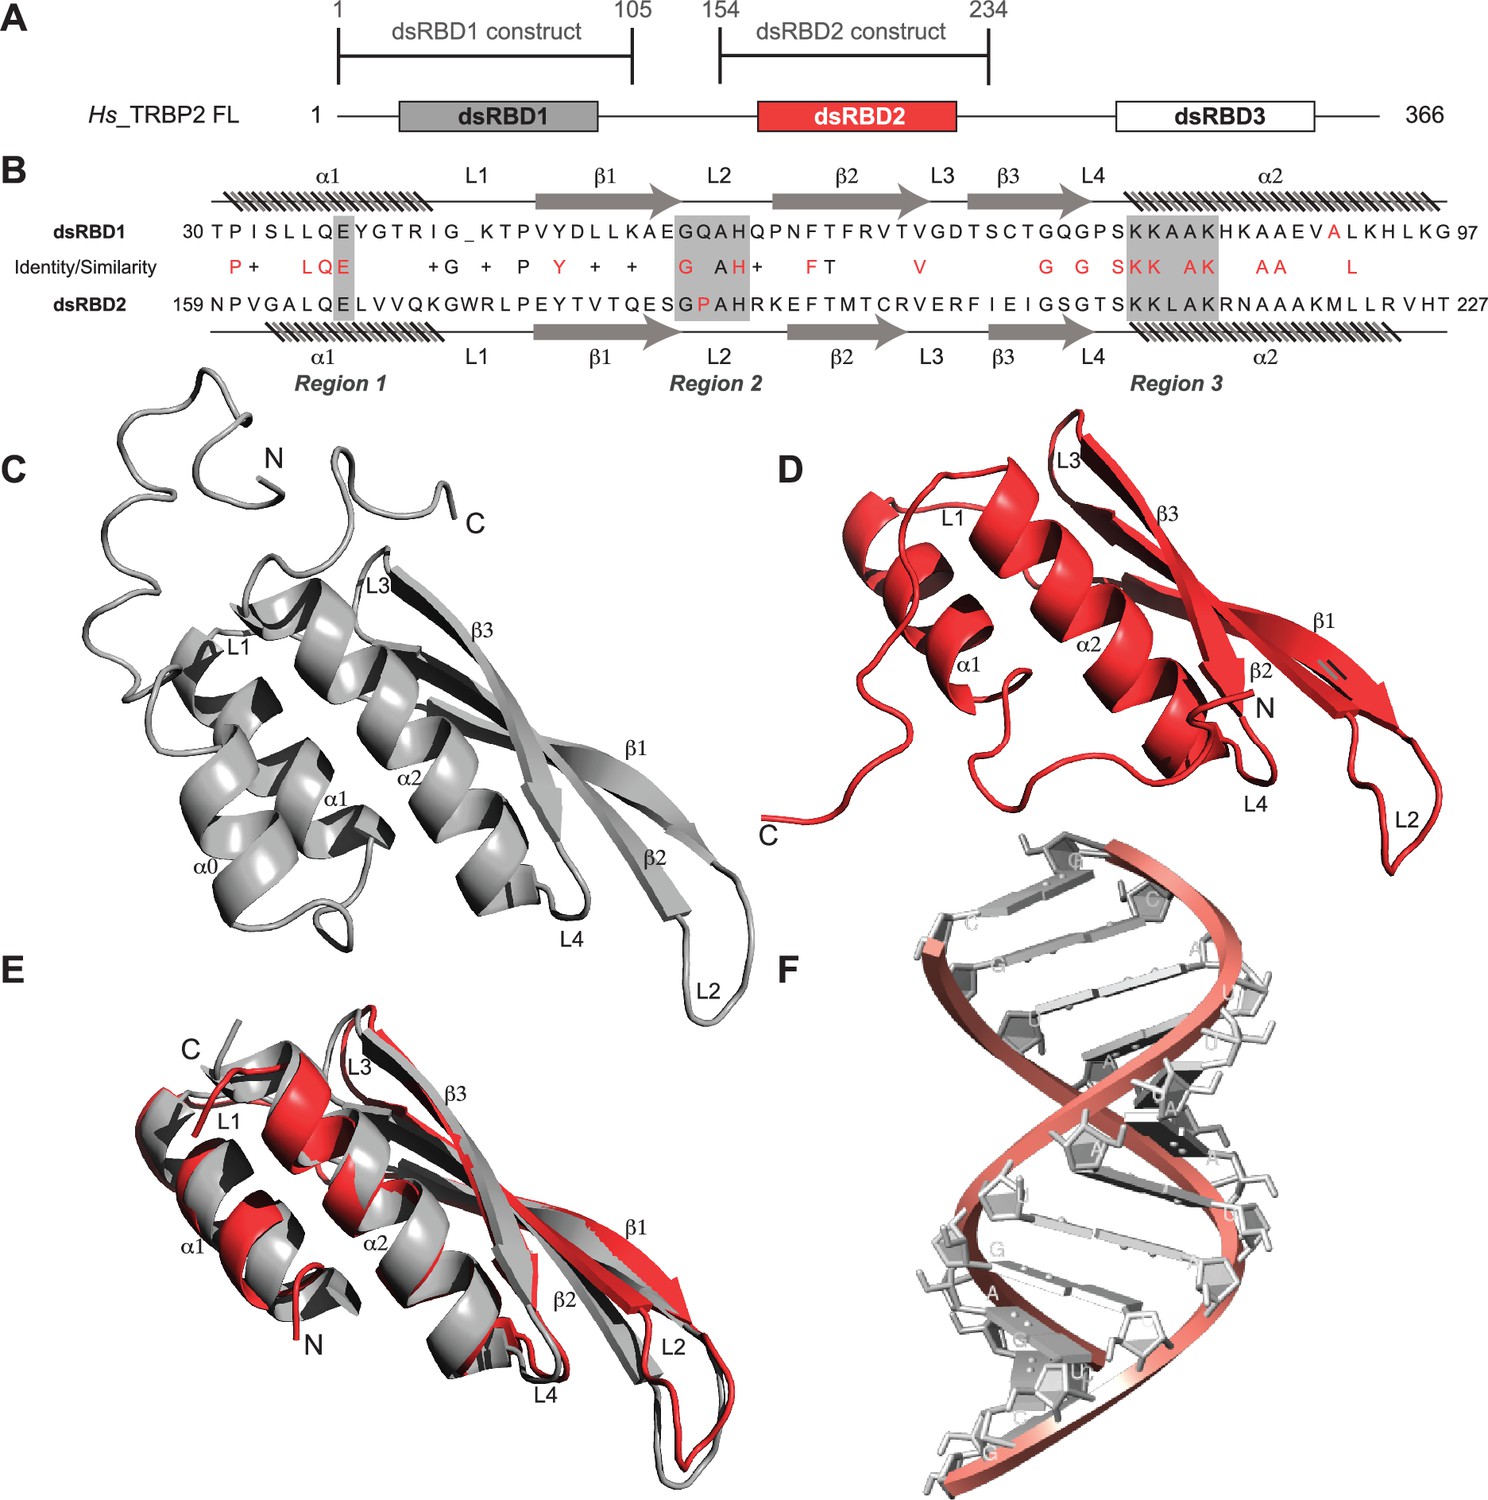
Sequence and structure comparisons for dsRBD1 and dsRBD2 of TRBP2 along with the structure of the D12 RNA duplex.
(A) dsRBD constructs [TRBP2-dsRBD1 (1–105 aa) and TRBP2-dsRBD2 (154–234 aa)] of Human TRBP2 full-length protein used in this study. (B) Sequence alignment of the two constructs mentioned in (A). CS-Rosetta structures of (C) TRBP2-dsRBD1 (Paithankar et al., 2018), (D) TRBP2-dsRBD2, (E) an alignment of core residues of dsRBD1 and dsRBD2, and (F) model structure of 12 bp duplex D12 RNA.
Figure 1—figure supplement 1

Size-exclusion chromatography coupled with multiple angle light scattering (SEC-MALS) elution profile for TRBP2-dsRBD2 showing that the protein remains monomeric in the buffer conditions used for NMR studies.
Figure 1—figure supplement 2

Backbone resonance assignments for TRBP2-dsRBD2 marked on the 1H-15N HSQC recorded on 600 MHz NMR spectrometer at 298 K in buffer D, pH 6.4.
Figure 1—figure supplement 3

1H-NMR spectrum of the imine region of the annealed D12 RNA indicating the duplex formation.
Figure 2
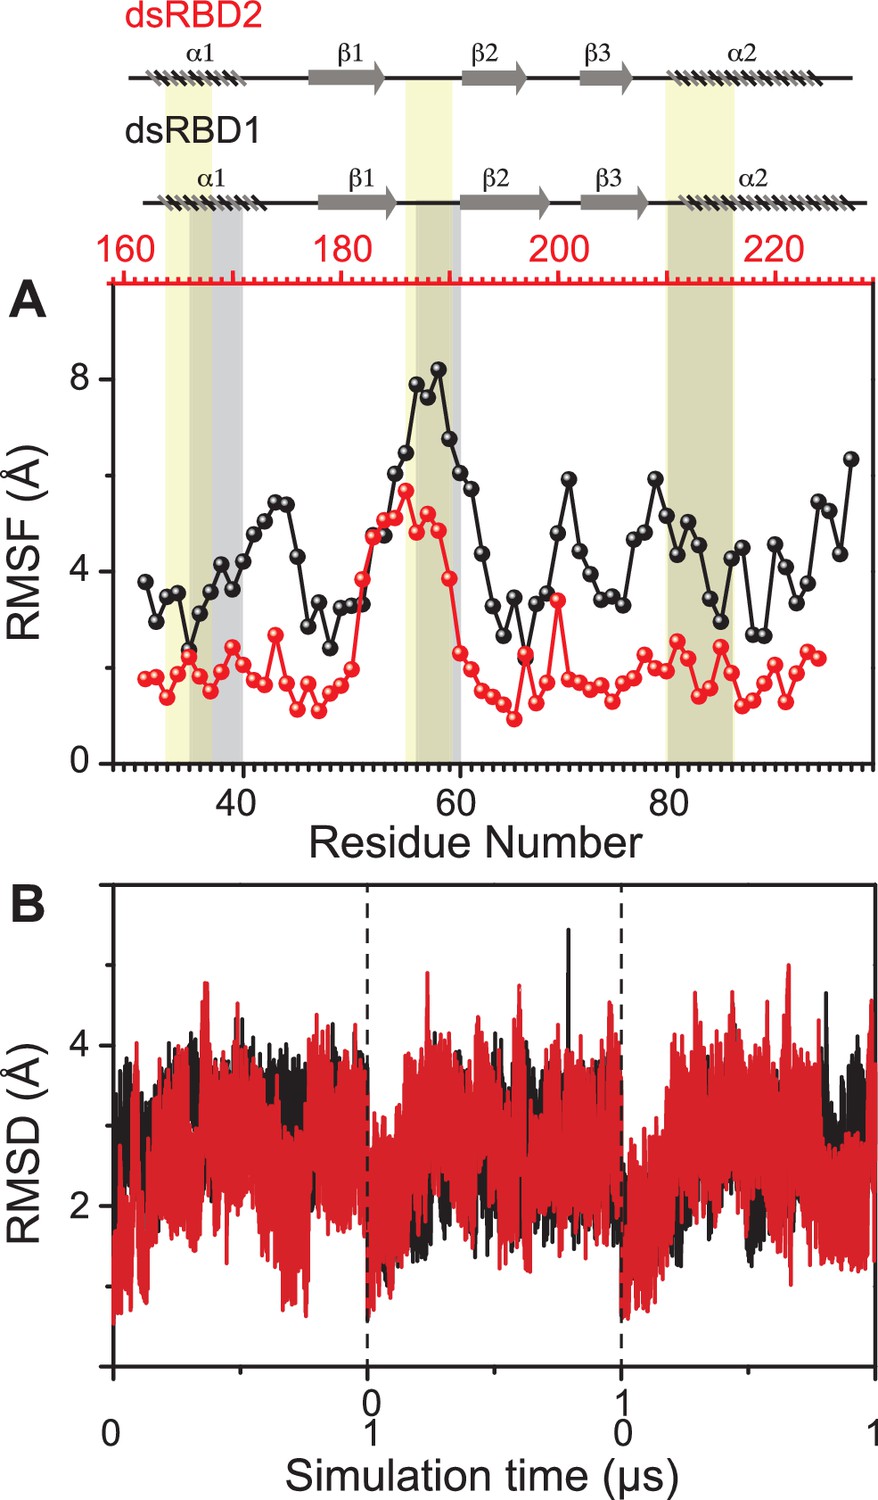
Dynamics comparison of dsRBD1 and dsRBD2 as measured by MD simulations.
(A) RMSF profile (by Cα) of core dsRBD1 (black) and dsRBD2 (red). The secondary structure for the two domains has been shown on the top, and three RNA-binding regions in dsRBD1 and dsRBD2 have been highlighted using vertical grey and yellow bars, respectively. (B) RMSD of profiles of dsRBD1 (black) and dsRBD2 (red) over 1 μs simulation time. RMSD values for data measured in triplicate have been separated by vertical dashed lines.
Figure 3 with 5 supplements

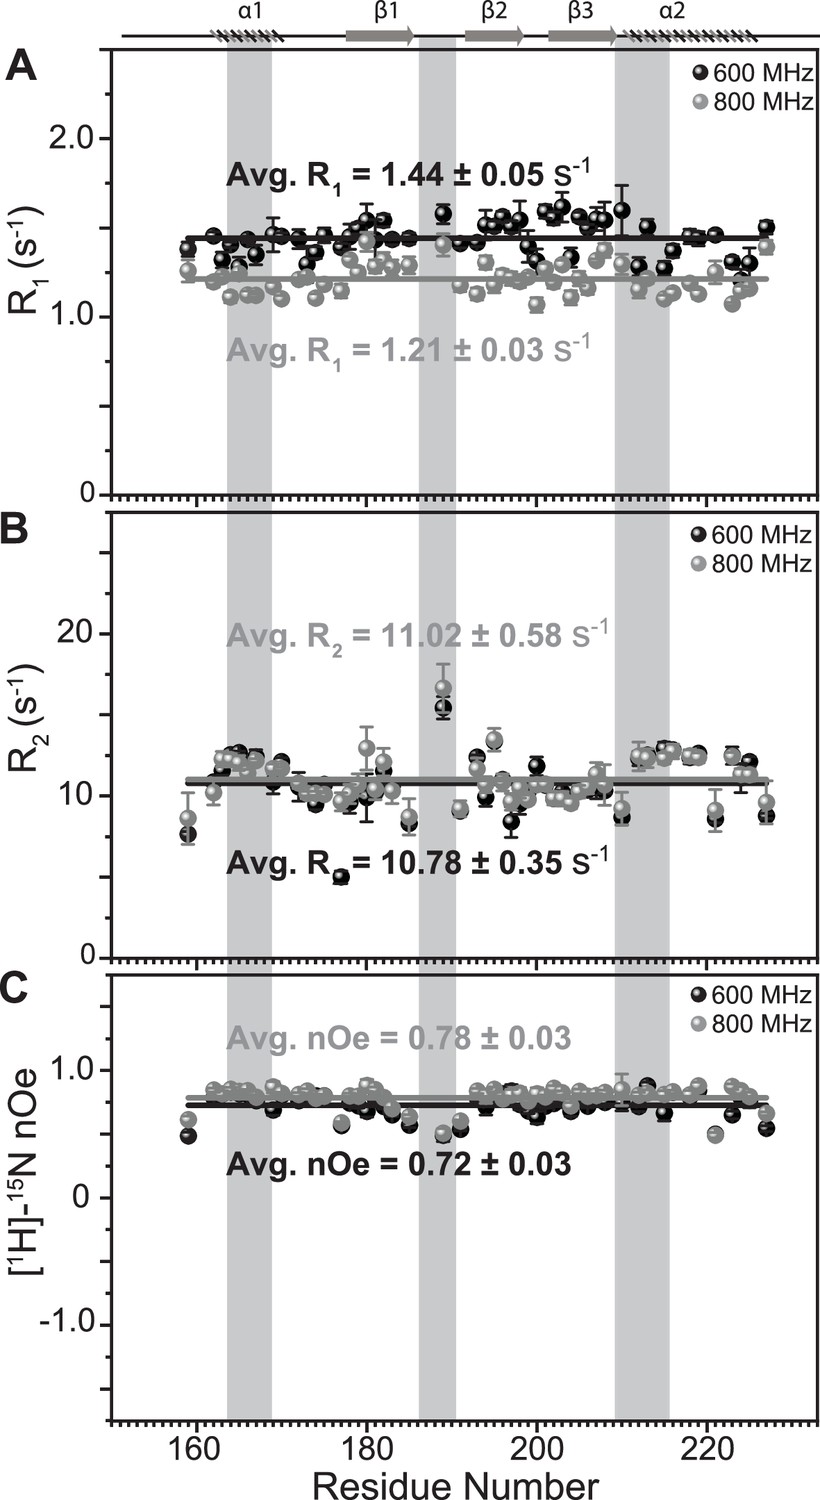
Spin relaxation parameters (A) R1, (B) R2, and (C) [1H]-15N nOe plotted against the residues for (left panel) apo TRBP2-dsRBD2 and (right panel) D12-bound TRBP2-dsRBD2.
Experiments were recorded on a 600-MHz NMR spectrometer at 298 K. The secondary structure of TRBP2-dsRBD2 has been mentioned at the top, and the RNA-binding region of the protein has been marked in grey vertical columns. Average R1, R2, and [1H]-15N-nOe of the core residues (159–227 aa) at 600 MHz has been depicted in the green bar, and at 800 MHz has been depicted in the red bars. The average values for spin relaxation parameters were calculated for 68 core residues (159-227 aa), and the standard error of the mean is calculated. The errors in the relaxation rates were calculated using duplicate delay data (two delays in duplicate) and Monte Carlo simulations (n=500). Errors in nOe values were obtained by propagating the errors from root-mean-square deviation (RMSD) values of baseline noise as obtained from Sparky in the respective spectra.
Figure 3—figure supplement 1
Comparison of fast dynamics (ps-ns timescale) for TRBP2-dsRBD2 as measured on two magnetic field strengths.
(A) Longitudinal relaxation rates (R1), B transverse relaxation rates (R2), and heteronuclear [1H]-15N-nOe, as measured for common residues of TRBP2-dsRBD2 on 600 MHz (black) and 800 MHz (grey) magnetic fields at 298 K plotted against residue numbers for both fields. Average R1, R2, and [1H]-15N-nOe of the core residues (159–227 aa) at 600 MHz has been depicted in the green bar, and at 800 MHz has been depicted in the grey bar (average is calculated only for the common residues that could be analyzed between the data measured at two magnetic fields). The secondary structure of the protein has been shown on the top, and three RNA-binding regions have been highlighted using vertical grey bars. The average values for spin relaxation parameters were calculated for 68 core residues (159-227 aa), and the standard error of the mean was calculated. The errors in the relaxation rates were calculated using duplicate delay data (two delays in duplicate) and Monte Carlo simulations (n=500). Errors in nOe values were obtained by propagating the errors from root-mean-square deviation (RMSD) values of baseline noise as obtained from Sparky in the respective spectra.
Figure 3—figure supplement 2
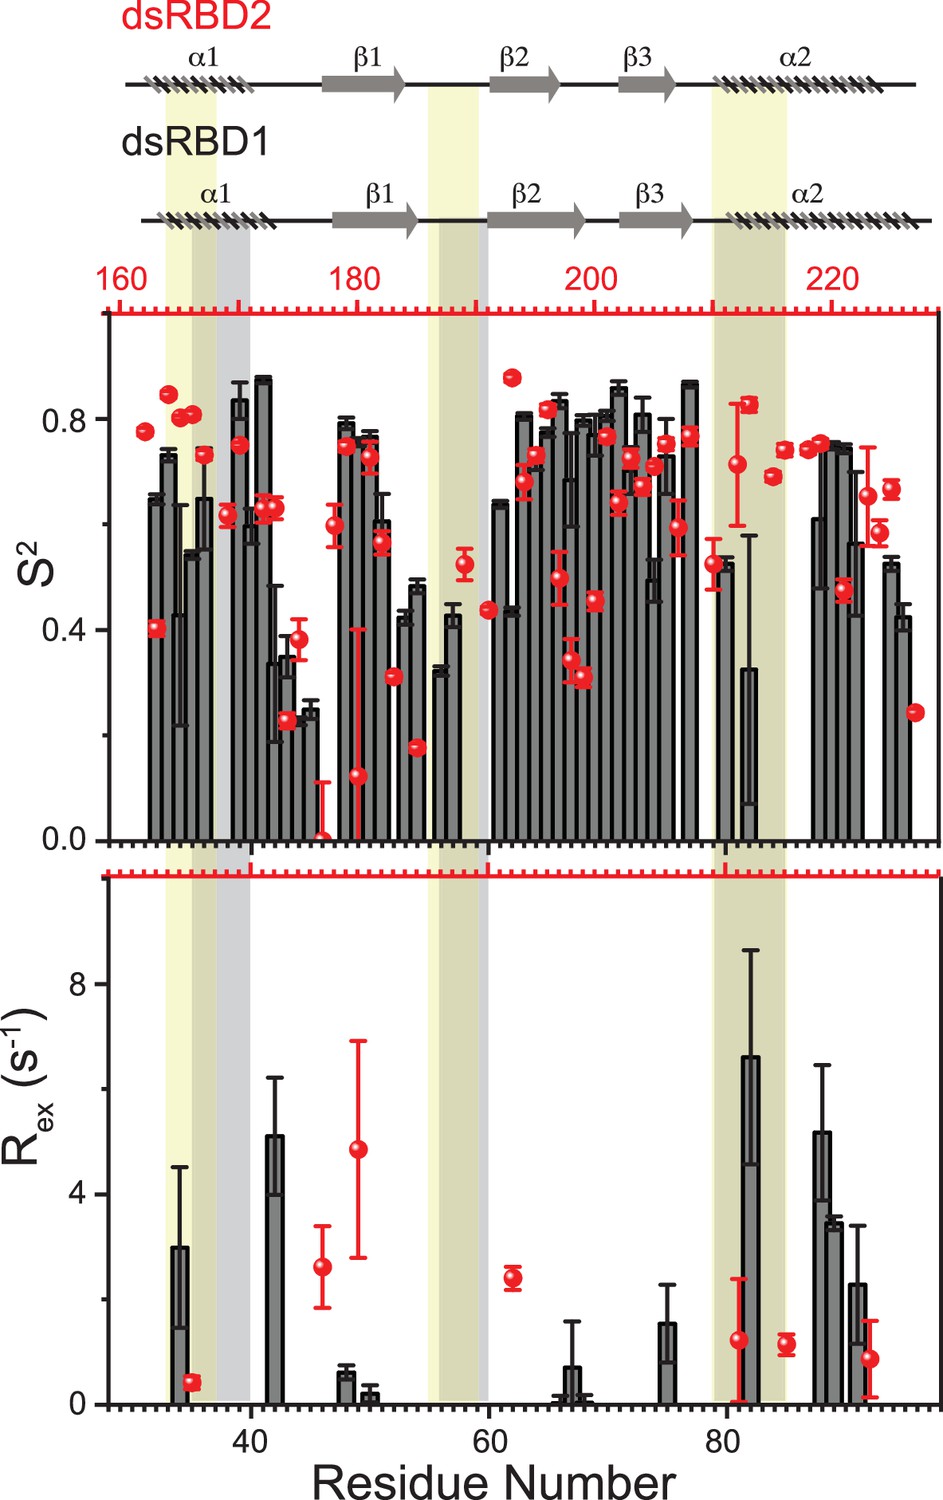
Top panel: Order parameters (S2), and bottom panel: Rex as calculated using model-free fitting of the fast relaxation data for core residues of TRBP2-dsRBD1 (histograms) and TRBP2-dsRBD2 (red scatter) plotted against residue numbers.
The secondary structure of both proteins has been shown on the top, and three RNA-binding regions have been highlighted using vertical grey bars (for TRBP2-dsRBD1) and vertical yellow bars (for TRBP2-dsRBD2). The analysis was done for 80 residues (154-234 aa). The errors in different fitted parameters were obtained using Monte-Carlo simulations (n=500) in addition to the duplicate relaxation data points (two delays in duplicate).
Figure 3—figure supplement 3
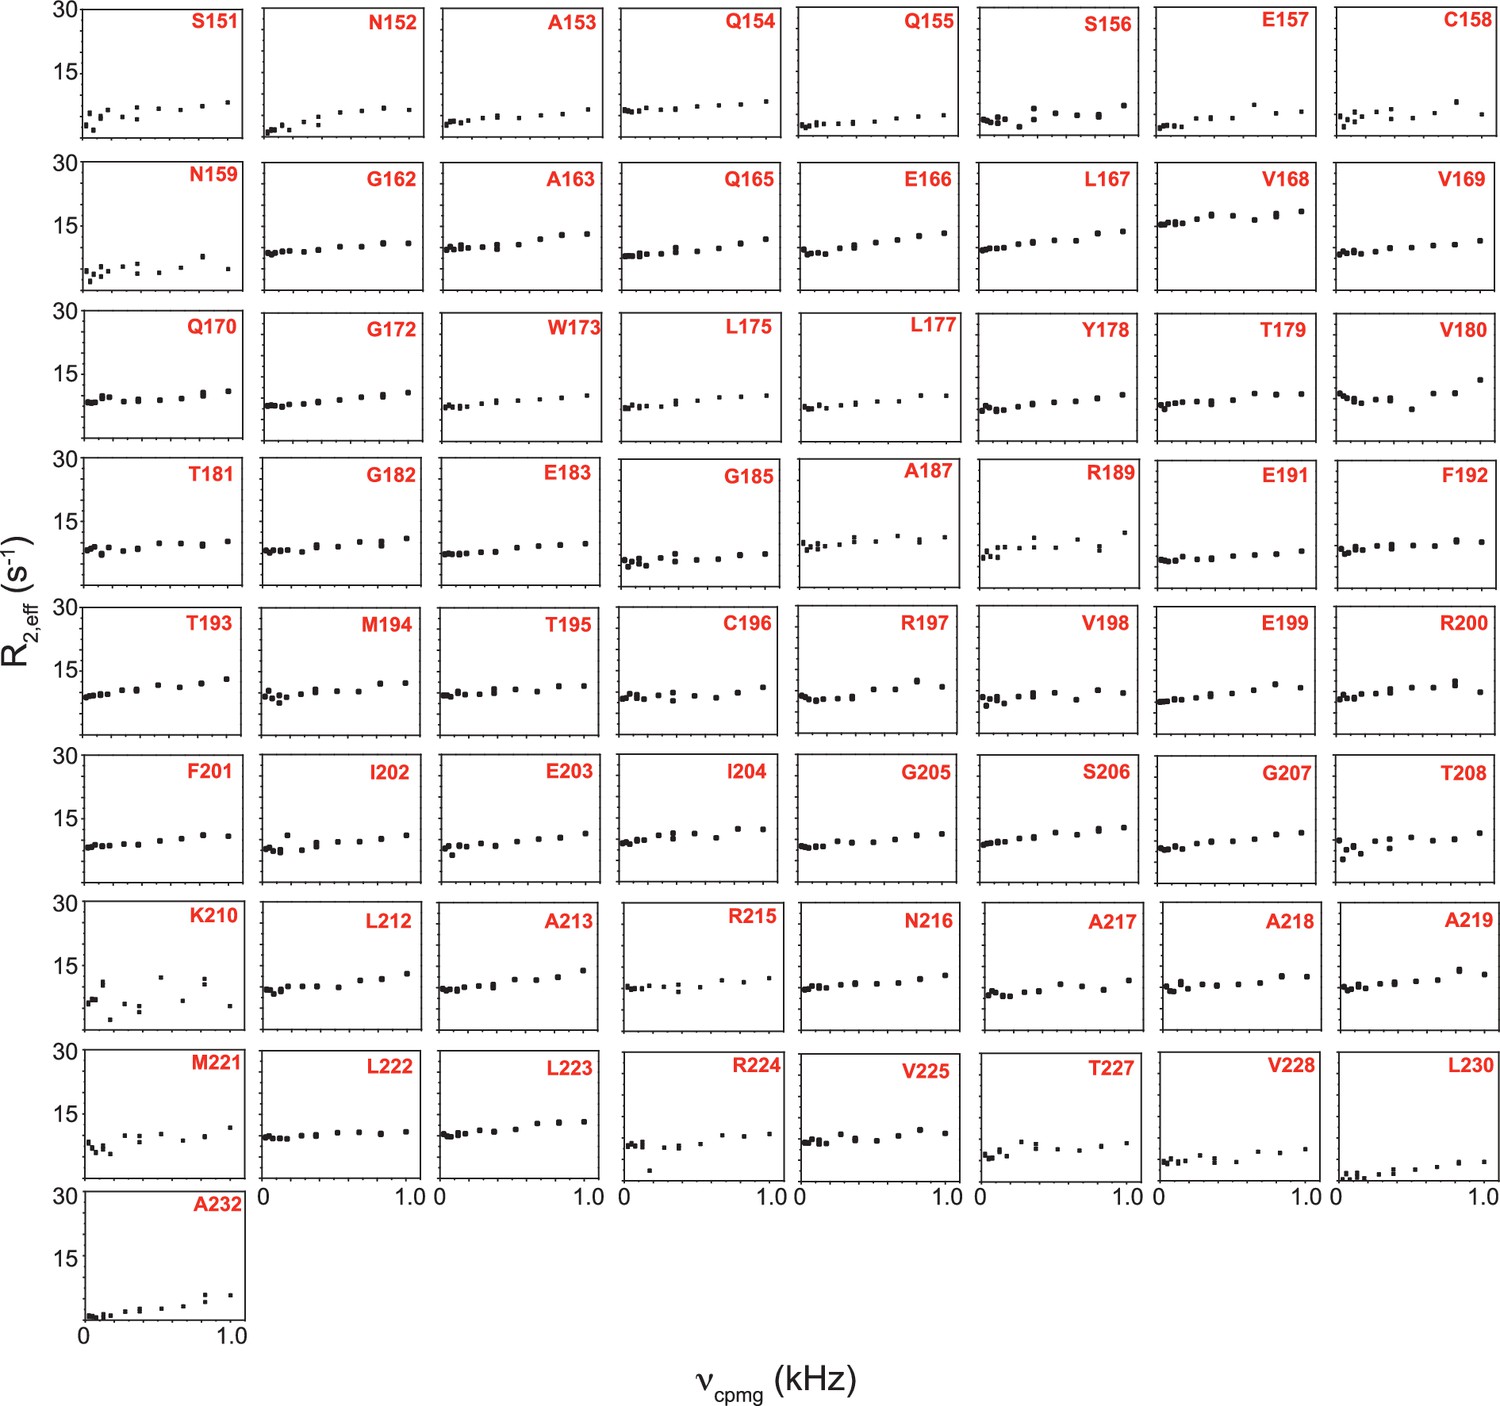
R2,eff rates plotted against νCPMG for the 65 non-overlapping residues of apo TRBP2-dsRBD2 measured at 600 MHz at 298 K.
Residue names and respective positions in the TRBP2 protein have been mentioned in each plot.
Figure 3—figure supplement 4

Top panel: Order parameters (S2), and bottom panel: Rex as calculated using model-free fitting of the fast relaxation data for apo TRBP2-dsRBD2 (left panel) and D12 RNA-bound TRBP2-dsRBD2 (right panel) plotted against residue numbers.
The secondary structure has been shown on the top, and three RNA-binding regions have been highlighted using vertical grey bars. The analysis was done for 68 core residues (159-227 aa). The error analysis for the selected model was done using the Monte Carlo simulations (n=500).
Figure 3—figure supplement 5
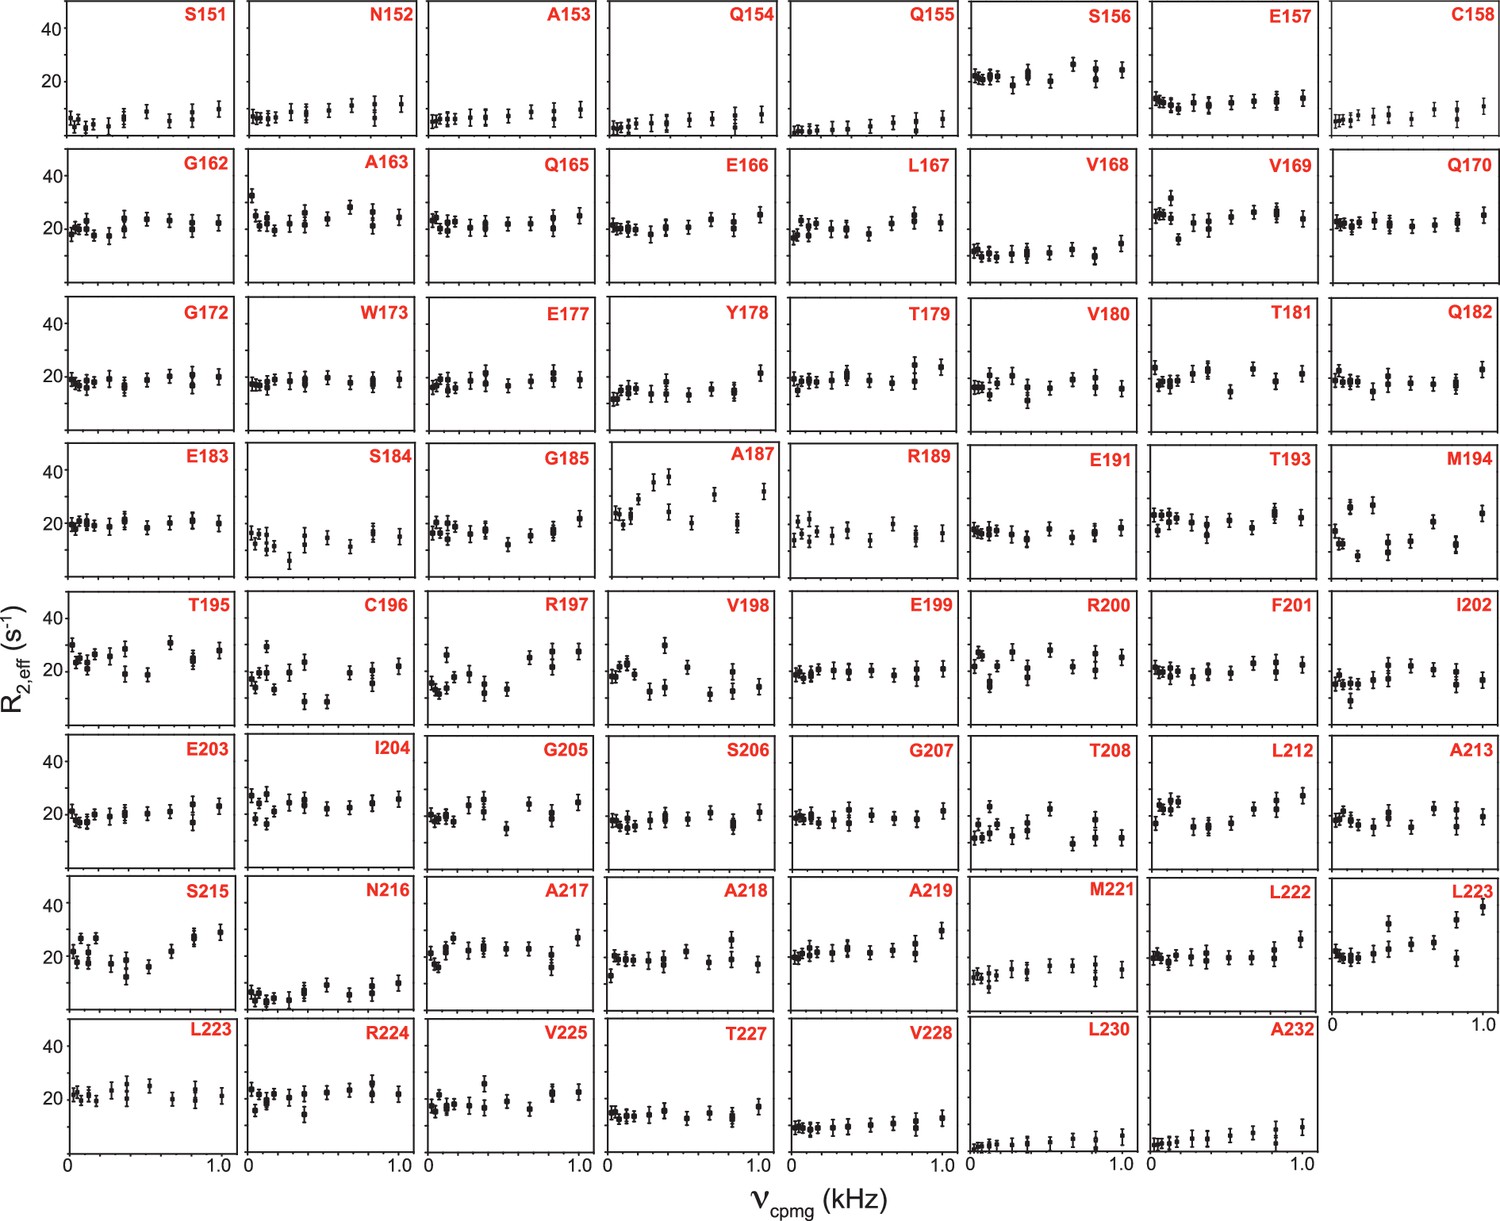
R2,eff rates plotted against νCPMG for the 63 non-overlapping residues of TRBP2-dsRBD2 measured in the presence of D12 RNA at 600 MHz at 298 K.
Residue names, along with respective positions in the TRBP2 protein, have been mentioned in each plot. Errors in R2,eff rates were obtained by propagating the errors from RMSD values of baseline noise obtained from Sparky in the respective spectra.
Figure 4
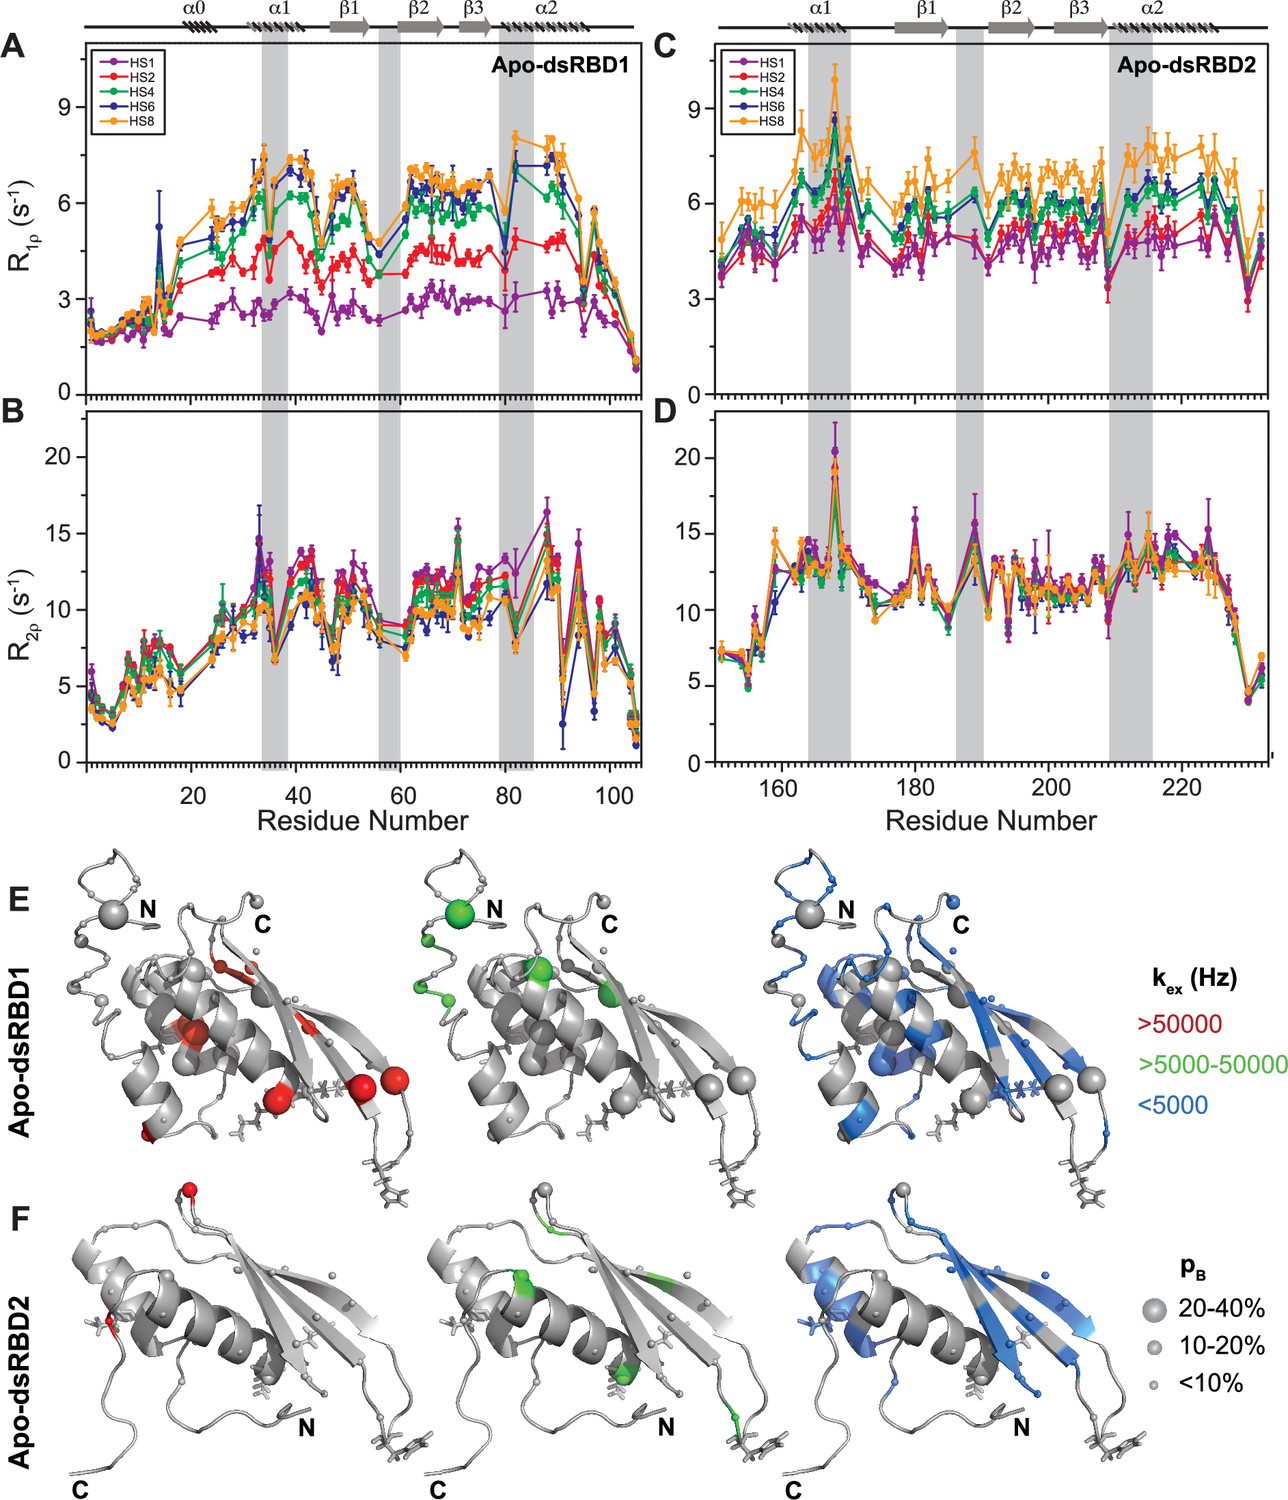
Comparison of slow dynamics (μs-ms timescale) for dsRBD1 and dsRDB2 of TRBP2 as measured by NMR relaxation dispersion experiments.
(A) R1ρ data, (B) R2ρ data, recorded on apo 15N-TRBP2-dsRBD1, (C) R1ρ data, (D) R2ρ data, recorded on apo 15N-TRBP2-dsRBD2 using heteronuclear adiabatic relaxation dispersion (HARD) experiments on a 600-MHz NMR spectrometer at 298 K, plotted against residue numbers. An increase in the spin-lock field strength is achieved by an increase in the stretching factor of the adiabatic pulse used to create the spin lock, n (in HSn). The secondary structure has been depicted on the top, and three RNA-binding regions have been highlighted using vertical grey bars. Mapping of conformational exchange parameters (exchange rate constant between the ground state and excited state (kex), and excited state population (pB)) obtained by fitting the above-described data to a two-state model on the CS-Rosetta structures of (E) apo-dsRBD1, and (F) apo-dsRBD2. Residues have been marked in different colors to highlight the distribution of kex values, and the diameters of the sphere indicate the extent of pB along the protein backbone. The RNA-binding residues have been depicted in stick mode. The analysis was done for 105 residues of TRBP2-dsRBD1 (1–105 aa) and 80 residues of dsRBD2 (154-234 aa). The errors in different fitted parameters were obtained using Monte-Carlo simulations (n=500) and the duplicate relaxation data points (two delays in duplicate).
Figure 5 with 1 supplement
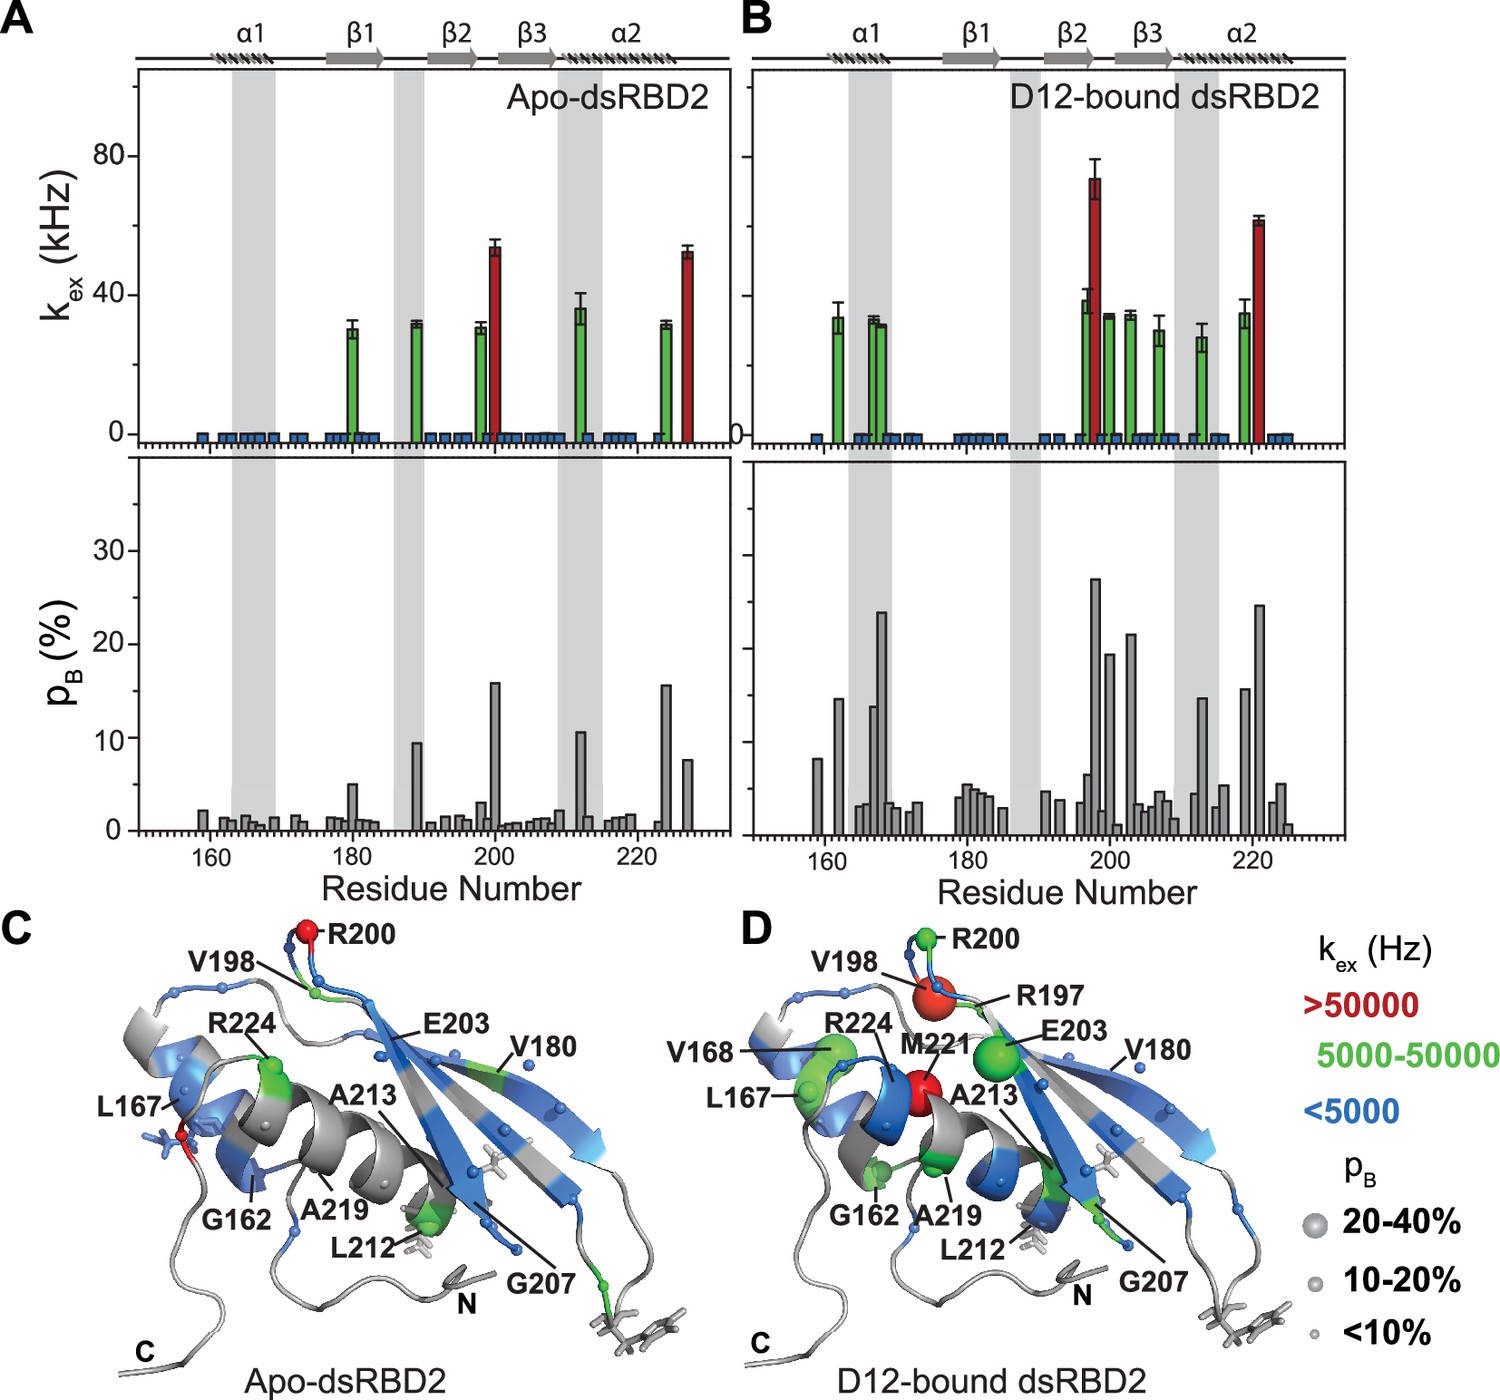
Conformational exchange in (A) apo- and (B) D12-bound TRBP2-dsRBD2.
Top panel: The exchange rate constant between the ground state and excited state (kex); bottom panel: excited state population (pB) as obtained by the geometric approximation method, using the heteronuclear adiabatic relaxation dispersion (HARD) experiment, plotted against residue numbers. Mapping of core kex, and pB, on the CS-Rosetta structure of apo TRBP2-dsRBD2, as extracted for (C) apo TRBP2-dsRBD2 and (D) D12-bound TRBP2-dsRBD2. Different colors highlight the distribution of kex values, and the sphere’s diameter indicates the extent of pB along the protein backbone. The RNA-binding residues have been depicted in stick mode. The analysis was done for 68 residues of dsRBD2 (159-227 aa) in -apo and RNA bound state. The errors in different fitted parameters were obtained using Monte-Carlo simulations (n=500) and the duplicate relaxation data points (two delays in duplicate).
Figure 5—figure supplement 1

Heteronuclear adiabatic relaxation dispersion (HARD) experiments recorded on 15N-TRBP2-dsRBD2 in the presence of D12-RNA on the 600 MHz NMR spectrometer at 298 K.
Top panel: R1ρ, and bottom panel: R2ρ rates plotted against residue numbers. Increasing applied spin-lock field strength is denoted by increasing the stretching factor, n (in HSn). The secondary structure has been shown on the top, and three RNA-binding regions have been highlighted using vertical grey bars. The analysis was done for 80 residues of dsRBD2 (154-234 aa) in apo and RNA bound state. The errors in different fitted parameters were obtained using Monte-Carlo simulations (n=500) and the duplicate relaxation data points (two delays in duplicate).
Figure 6 with 3 supplements
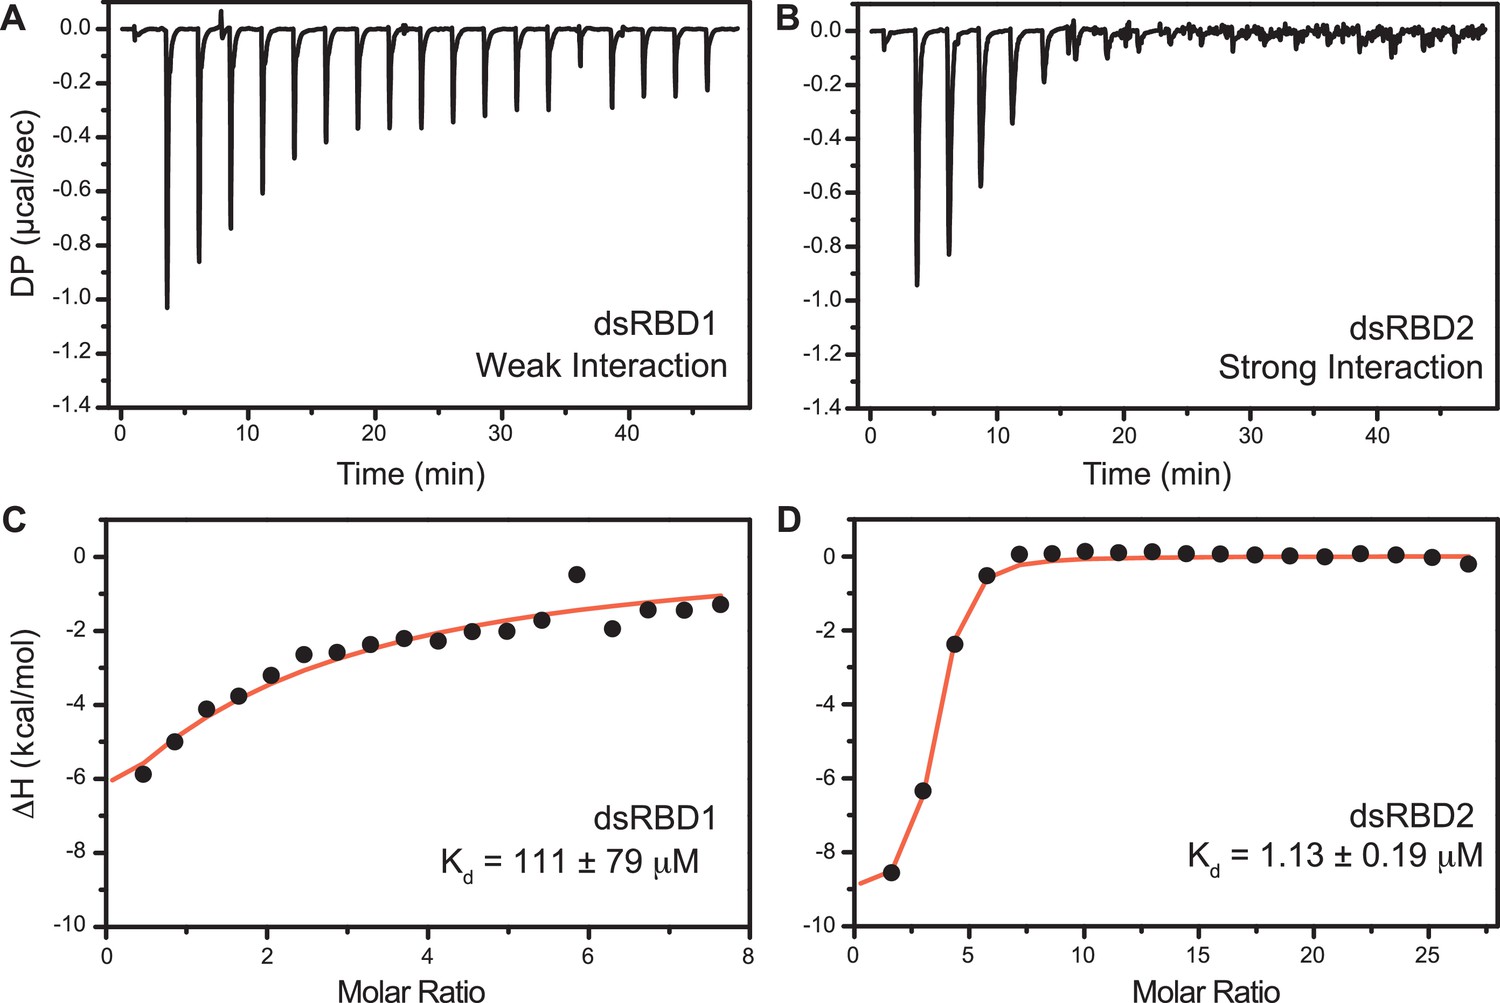
Isothermal titration calorimetry (ITC)-based binding study of D12 duplex RNA with TRBP2-dsRBD1 and TRBP2-dsRBD2.
Top panel: the raw differential potential for each injection is plotted against the titration time for (A) TRBP2-dsRBD1 and (B) TRBP2-dsRBD2. Bottom panel: the integrated heat (enthalpy change) upon each injection (black dots) and the data fit for a single set of binding sites (red line) plotted against per mole of injectant for (C) TRBP2-dsRBD1 and (D) TRBP2-dsRBD2.
Figure 6—figure supplement 1

Titration of 15N-TRBP2-dsRBD2 with miR-16-1-M (an overlay of 1H-15N -HSQC spectra of apo-protein (green) RNA:protein (R:P) = 0.25:1 (red) and (R:P) = 1:1 (black)); miR-16-1-B, miR-16-1-D, and miR-16-1-A (wt) [overlaid 1H-15N -HSQC spectra of apo-protein (green), (R:P) = 0.1:1 (red) and (R:P) = 0.2:1 (black)].
All the data were measured on a 600-MHz NMR spectrometer at 298 K in buffer D, pH 6.4.
Figure 6—figure supplement 2

Titration of 15N-TRBP2-dsRBD2 with D12 RNA.
An overlay of 1H-15N -HSQC spectra of apo-protein (green), (R:P) = 0.1:1 (red), (R:P) = 0.35:1 (yellow), and (R:P) = 5:1 (blue) measured on 600 MHz NMR spectrometer at 298 K in buffer D, pH 6.4.
Figure 6—figure supplement 3
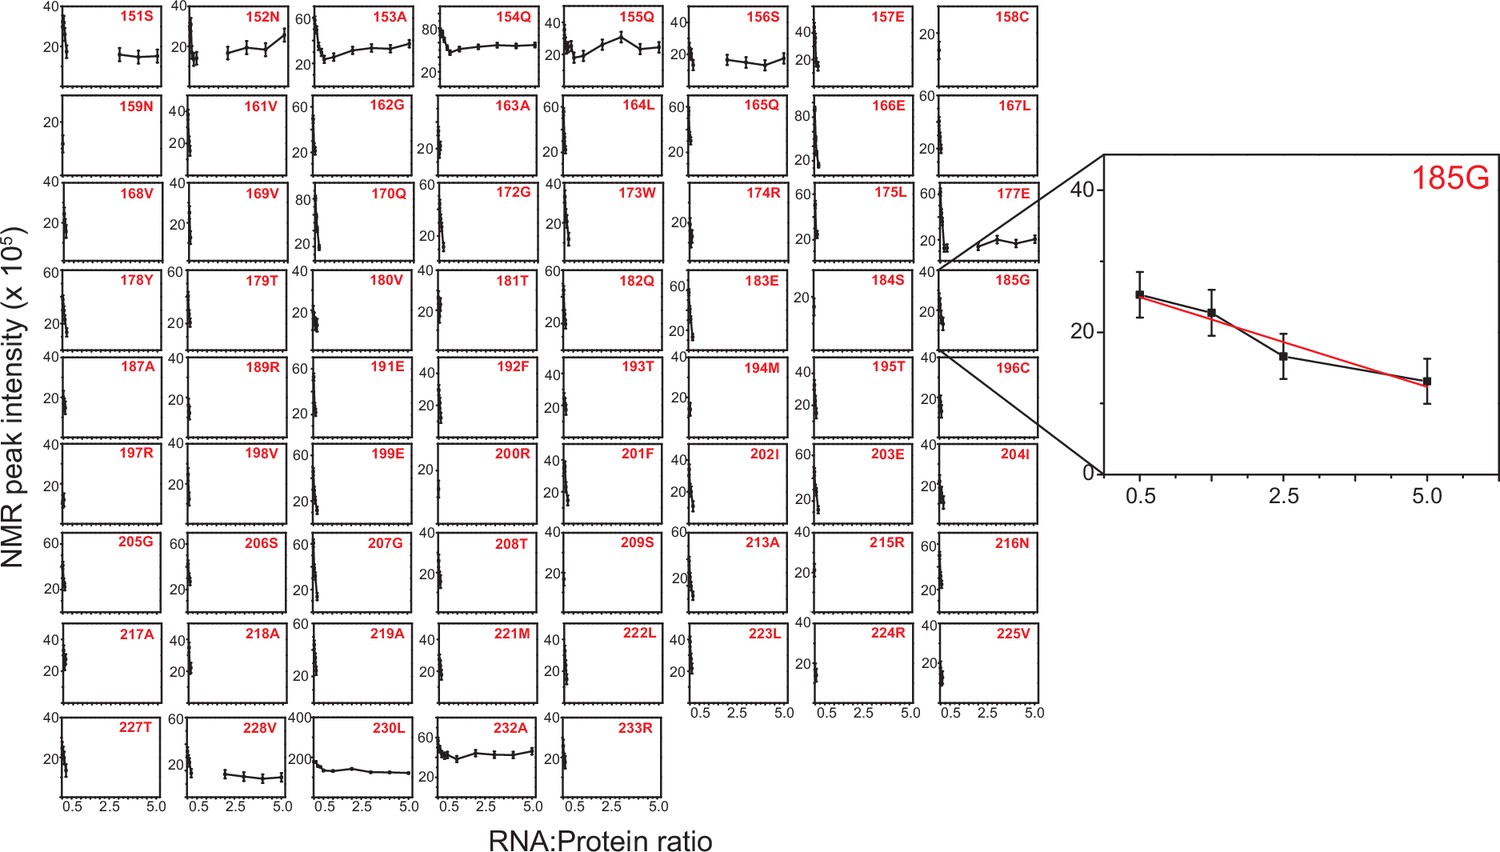
Normalized NMR peak intensity from 1H-15N HSQC spectra of TRBP2-dsRBD2 plotted against protein: D12 RNA ratio from the titration carried out in Figure 6—figure supplement 2.
Errors in R2,eff rates were obtained for 69 non-overlapping residues by propagating the errors from RMSD values of baseline noise as obtained from Sparky in the respective spectra. An example residue has been zoomed in to highlight the intensity decay.
Figure 7
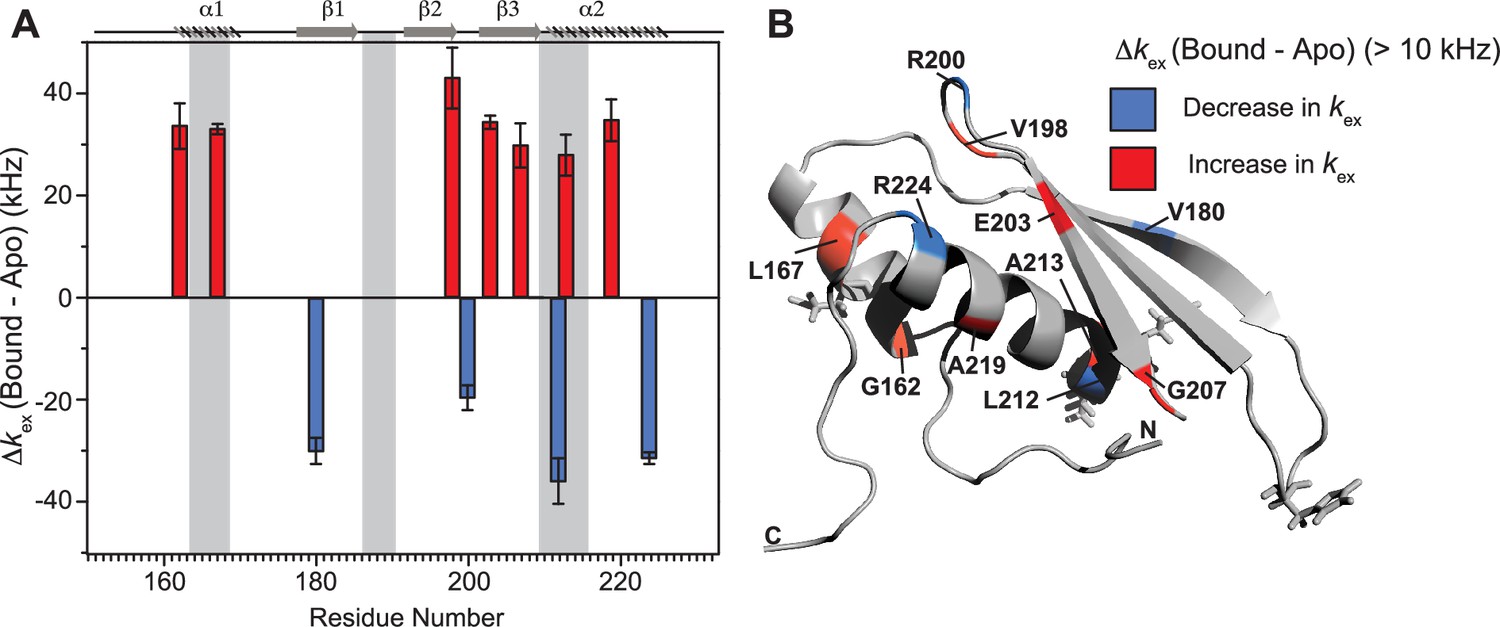
Conformational exchange perturbations in core TRBP2-dsRBD2 in the presence of D12 RNA.
(A) Δkex (D12-bound – apo) TRBP2-dsRBD2 plotted against residue numbers. The secondary structure has been shown on the top, and three RNA-binding regions have been highlighted using vertical grey bars. Only residues having significant perturbation (Δkex > 10 kHz) have been plotted, where an increase is shown in red, and a decrease is shown in blue, (B) An increase in kex (red) and a decrease (blue) in the presence of D12 RNA indicated on the backbone of the CS-Rosetta structure of apo TRBP2-dsRBD2. The RNA-binding residues have been depicted in stick mode in the tertiary structure.
Figure 8

The model proposed for the two type-A dsRBDs in TRBP2 protein.
dsRBD2 with rigid and conserved RNA-binding regions is able to bind the RNA tightly, whereas dsRBD1 with high conformational exchange is able to recognize different RNA structures (often with bulges and internal loops). Following this, the two dsRBDs upon contacting the RNA undergoes enhanced conformational exchange at different extents. This enhanced conformational exchange coupled with differential binding affinity toward dsRNA might enable the tandem dsRBDs to move along the backbone of the RNA molecule, leading to ATP-independent diffusion.
Tables
Key resources table
| Reagent type (species) or resource | Designation | Source or reference | Identifiers | Additional information |
|---|---|---|---|---|
| Gene (Homo sapiens) | TARBP2 | GenBank | HGNC:HGNC :11569 | Gene ID: 6895 (Uniprot ID: Q15633) |
| Strain, strain background (Escherichia coli) | BL21(DE3) and DH5a | Others | Chemically competent cells obtained from Dr. Gayathri Pananghat (Indian Institute of Science Education and Research Pune, Pune, India) as kind gift and further amplified in our lab. | |
| Recombinant DNA reagent | pHMGWA (plasmid) | Others | TRBP2-dsRBD2 (154–234 aa) was cloned in pHMGWA vector via Gateway cloning and was obtained as a kind gift from N. L. Prof. Jennifer Doudna (University of California, Berkeley, CA, USA) | |
| Sequence-based reagent | miR-16-1-A; miR-16-1-D; miR-16-1-M; miR-16-1-B; D12 RNA | Integrated DNA Technologies (Coralville, IA, USA) or GenScript Biotech Corporation (Piscataway, NJ, USA) | RNA oligos | Guide:UAGCAGC ACGUAAA UAUUGGCG Passenger:CCAGU AUUAACUG UGCUGCUGAA; Guide:UAGCAGC ACGUAAA UAUUGGCG Passenger: CCAGUAU UUACGUGCUG CUGAA; Guide:UAGCAGCA CGUAAAUAUUG GCG Passenger: CCAGUAUUAACG UGCUGCUGAA; Guide:UAGCA GCACGUAAAUA UUGGCG Passenger: CCAGUAU UAACGUGCU GCUGAA; Guide:CGUAAA UAUUCG Passenger:CGAGUA UUUACG |
| Chemical compound, drug | 15NH4Cl; 13C-glucose | Cambridge Isotope Laboratories | NLM-467-50; CLM1396-10 | |
| Software, algorithm | MicroCal PEAQ-ITC analysis software | Malvern Panalytical, Malvern, UK | ||
| Software, algorithm | NMRPipe | https://doi.org/10.1007/BF00197809 | ||
| Software, algorithm | SPARKY (version 3.115) | https://doi.org/10.1093/bioinformatics/btu830 | ||
| Software, algorithm | CARA | ISBN 3-85600-112-3 | ||
| Software, algorithm | Relax v4.0.3 software | https://doi.org/10.1093/bioinformatics/btu166 |
Additional files
-
Supplementary file 1
Tables providing analyzed data numbers of all the experiments.
(a) Amino acid length of different secondary structures in TRBP2-dsRBD1 and TRBP2-dsRBD2 CS-ROSSETA structures. α represents an α-helix, L represents a loop, and β represents the β-strand. (b) RNA sequences used to study interaction with dsRBDs. (c) Nuclear spin relaxation data for apo TRBP2-dsRBD2 recorded at 600 and 800 MHz NMR spectrometer. Data for some residues are missing in this table due to line-broadening issues in the corresponding experiments. (d) Order parameter (S2) extracted from model-free analysis of the nuclear spin relaxation data for apo TRBP2-dsRBD2 recorded at 600 and 800 MHz NMR spectrometer. (e) Rex of residues extracted from model-free analysis of the nuclear spin relaxation data for apo TRBP2-dsRBD2 recorded at 600 and 800 MHz NMR spectrometer. (f) R2,eff values measured at different Carr–Purcell–Meiboom–Gill (CPMG) frequencies from CPMG relaxation dispersion experiment for apo TRBP2-dsRBD2 at 600 MHz NMR spectrometer. (g) R1ρ relaxation rates measured using HSn pulses (n = 1, 2, 4, 6, 8) from heteronuclear adiabatic relaxation dispersion (HARD) experiment for apo TRBP2-dsRBD2 at 600 MHz NMR spectrometer. (h) R2ρ relaxation rates measured using HSn pulses (n = 1, 2, 4, 6, 8) from HARD experiment for apo TRBP2-dsRBD2 at 600 MHz NMR spectrometer. (i) Dynamics parameters extracted from HARD experimental data from geoHARD method for apo TRBP2-dsRBD2. (j) Isothermal titration calorimetry (ITC)-binding study of TRBP2-dsRBD2 and D12 RNA carried out in triplicate. (k) Nuclear spin relaxation data for RNA-bound TRBP2-dsRBD2 recorded at 600 and 800 MHz NMR spectrometer. Data for some residues are missing in this table due to line-broadening issues in the corresponding experiments. (l) Order parameter (S2) extracted from model-free analysis of the nuclear spin relaxation data for RNA-bound TRBP2-dsRBD2 recorded at 600 and 800 MHz NMR spectrometer. (m) Rex of residues extracted from model-free analysis of nuclear spin relaxation data for RNA-bound TRBP2-dsRBD2 recorded at 600 and 800 MHz NMR spectrometer. (n) R2,eff values measured at different CPMG frequencies from CPMG relaxation dispersion experiment for bound TRBP2-dsRBD2 at 600 MHz NMR spectrometer. (o) R1ρ relaxation rates measured using HSn pulses (n = 1, 2, 4, 6, 8) from HARD experiment for RNA-bound TRBP2-dsRBD2 at 600 MHz NMR spectrometer. (p) R2ρ relaxation rates measured using HSn pulses (n = 1, 2, 4, 6, 8) from HARD experiment for RNA-bound TRBP2-dsRBD2 at 600 MHz NMR spectrometer. (q) Dynamics parameters extracted from HARD experimental data from geoHARD method for RNA-bound TRBP2-dsRBD2. (r) R1 relaxation rates measured from HARD experiment for apo TRBP2-dsRBD2 at 600 MHz NMR spectrometer. (s) R1 relaxation rates measured from HARD experiment for RNA-bound TRBP2-dsRBD2 at 600 MHz NMR spectrometer. (t) Assignment Report of TRBP2-dsRBD2 (as obtained from CARA in NMR-STAR 3.1 format).
- https://cdn.elifesciences.org/articles/94842/elife-94842-supp1-v1.docx
-
MDAR checklist
- https://cdn.elifesciences.org/articles/94842/elife-94842-mdarchecklist1-v1.pdf
Download links
A two-part list of links to download the article, or parts of the article, in various formats.
Downloads (link to download the article as PDF)
Open citations (links to open the citations from this article in various online reference manager services)
Cite this article (links to download the citations from this article in formats compatible with various reference manager tools)
Differential conformational dynamics in two type-A RNA-binding domains drive the double-stranded RNA recognition and binding
eLife 13:RP94842.
https://doi.org/10.7554/eLife.94842.3


