Metabolic disruption impairs ribosomal protein levels, resulting in enhanced aminoglycoside tolerance
- William A. Brookshire Department of Chemical and Biomolecular Engineering, University of Houston, United States
Figures
Figure 1 with 1 supplement

Deletions of the tricarboxylic acid (TCA) cycle and electron transport chain (ETC) genes enhanced tolerance to aminoglycosides.
In the mid-exponential phase (t = 3.5 hr), E. coli MG1655 wild-type and knockout strains underwent (A) streptomycin, (B) gentamicin, and (C) amikacin treatments at a concentration of 50 μg/ml for a duration of 5 hr in test tubes. Following the treatments, cells were washed to eliminate the antibiotics and then plated on LB agar plates to quantify the surviving cell fractions. CFU: colony-forming units; WT: wild type. For pairwise comparisons, one-way analysis of variance (ANOVA) with Dunnett’s post hoc test was used where **p < 0.01, ***p < 0.001, and ****p < 0.0001. N = 3. Data points represent mean and standard error.
Figure 1—figure supplement 1

Impact of lower gentamicin concentration on the tolerance of the mutant strains.
In the mid-exponential phase (t = 3.5 hr), E. coli MG1655 wild-type and knockout strains underwent gentamicin treatments at a concentration of 5 μg/ml for a duration of 5 hr in test tubes. Following the treatments, cells were washed to eliminate the antibiotics and then plated on LB agar plates to quantify the surviving cell fractions. For pairwise comparisons, one-way analysis of variance (ANOVA) with Dunnett’s post hoc test was used where ***p < 0.001 and ****p < 0.0001. N = 4. Data points represent mean and standard error.
Figure 2

The observed tolerance in the mutant strains is not linked to cell growth.
(A) Growth of E. coli MG1655 wild type, ΔsucA, ΔgltA, ΔnuoI, and Δicd strains was assessed by measuring the number of cells per ml with flow cytometry. (B) The cells of both the E. coli MG1655 WT and mutant strains were collected from culture flasks (see Materials and methods for details) at indicated time intervals and then subjected to gentamicin treatment. The figure shows the colony-forming unit (CFU) levels of both the treated and untreated cultures, indicating the surviving and total cell populations, respectively. N = 3. Data points represent mean and standard error.
Figure 3 with 3 supplements

Comparable ATP levels, redox activities, and cytoplasmic pH levels were observed between the wild-type and mutant strains.
(A) Redox sensor green (RSG) staining was conducted by suspending wild-type and mutant strains in 0.85% sodium chloride solution during the mid-exponential and early stationary phases, as outlined in the Materials and methods section. (B) The ATP levels were measured in wild-type and mutant cells during the mid-exponential and early stationary growth phases. (C) A comparison of the cytoplasmic pH of the WT and mutant cells during the mid-exponential and early stationary phases was performed using the ratiometric pHluorin. For pairwise comparisons, one-way analysis of variance (ANOVA) with Dunnett’s post hoc test was used where *p < 0.05, **p < 0.01, and ***p < 0.001. N ≥ 3. Data points represent mean and standard error.
Figure 3—figure supplement 1

Control staining for bacterial redox activities.
E. coli MG1655 wild-type cells in the exponential phase (t = 3.5 hr) were subjected to staining with 1 μM redox sensor green (RSG) for 10 min at 37°C, followed by analysis using flow cytometry. Controls included unstained cells and cells treated with a combination of 20 μM carbonyl cyanide 3-chlorophenylhydrazone (CCCP) and 1 μM RSG. CCCP was introduced into cell suspensions 5 min before RSG staining, aiming to reduce cellular redox activities. The presented panel serves as a representative biological replicate.
Figure 3—figure supplement 2

The ATP standard curve.
ATP was subjected to 10-fold serial dilutions (10 µM, 1 µM, 100 nM, and 10 nM), starting from an initial concentration of 10 μM in a culture medium. The resulting dilutions were then transferred to a 96-well plate, and an equivalent volume of BacTiter-Glo Reagent was introduced in a 1:1 ratio. The combined mixtures were incubated for 1 min, followed by luminescence measurement using a plate reader.
Figure 3—figure supplement 3
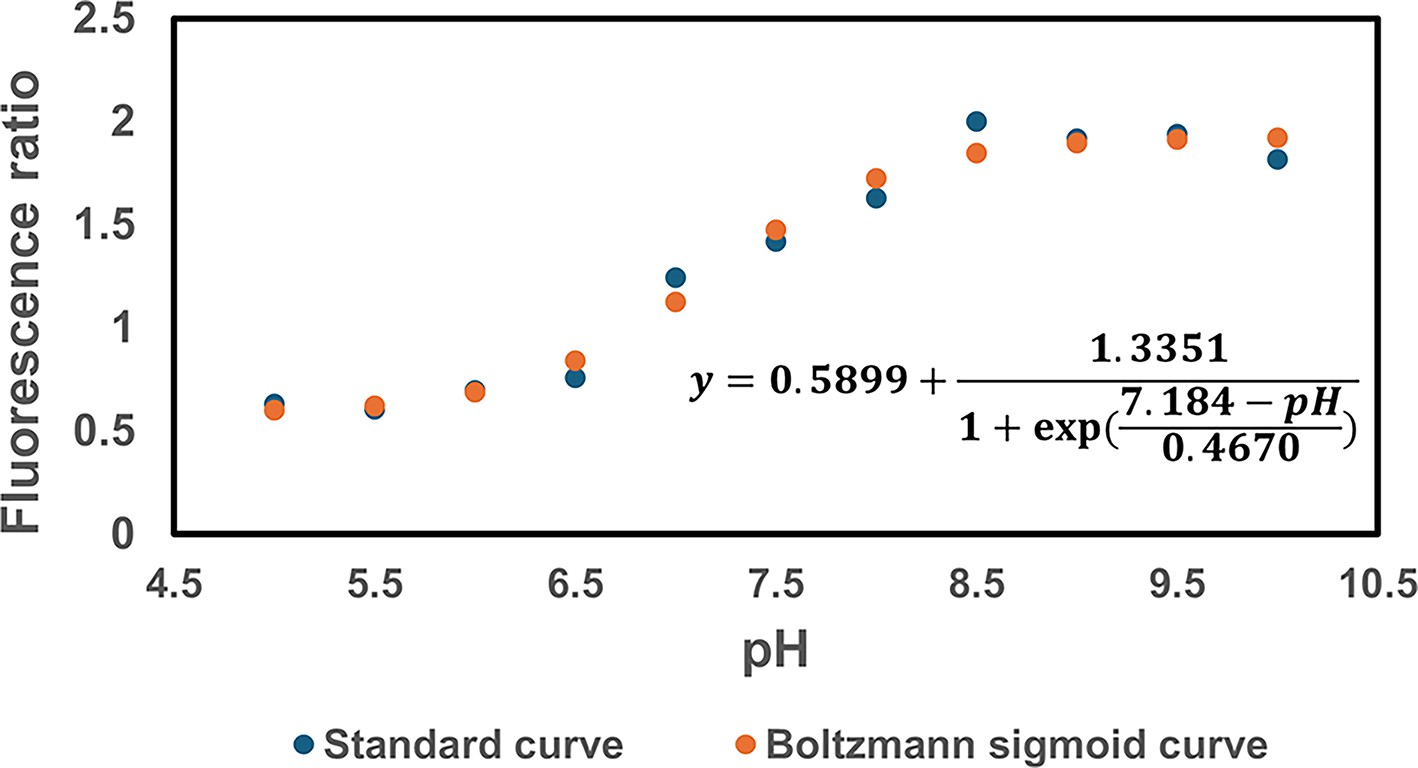
The pH standard curve.
The pH vs. fluorescence ratio (410/470 nm) was established for E. coli MG1655. The standard curve data were fitted using a Boltzmann sigmoid curve.
Figure 4 with 1 supplement

Deletion of genes associated with the tricarboxylic acid (TCA) cycle and electron transport chain (ETC) did not alter the drug uptake.
(A) Exemplary quantification of Gentamicin-Texas Red (GTTR) uptake in cells during the exponential growth phase (t = 3.5 hr). (B) GTTR assays were performed on cells in the mid-exponential phase for both the wild-type and mutant strains, followed by fluorescence measurement using flow cytometry after one hour. The concentration of GTTR is 25 µg/ml. For pairwise comparisons, one-way analysis of variance (ANOVA) with Dunnett’s post hoc test was used (no statistical significance was detected). N = 3. Data points represent mean and standard error.
Figure 4—figure supplement 1

Deletion of genes associated with the tricarboxylic acid (TCA) cycle and electron transport chain (ETC) did not significantly alter the drug uptake.
Gentamicin-Texas Red (GTTR) assays were performed on cells in the mid-exponential phase (t = 3.5 hr) for both the wild-type and mutant strains, followed by fluorescence measurement using flow cytometry. The concentration of GTTR is 5 µg/ml. For pairwise comparisons, one-way analysis of variance (ANOVA) with Dunnett’s post hoc test was used (no statistical significance was detected). N = 4. Data points represent mean and standard error.
Figure 5 with 4 supplements

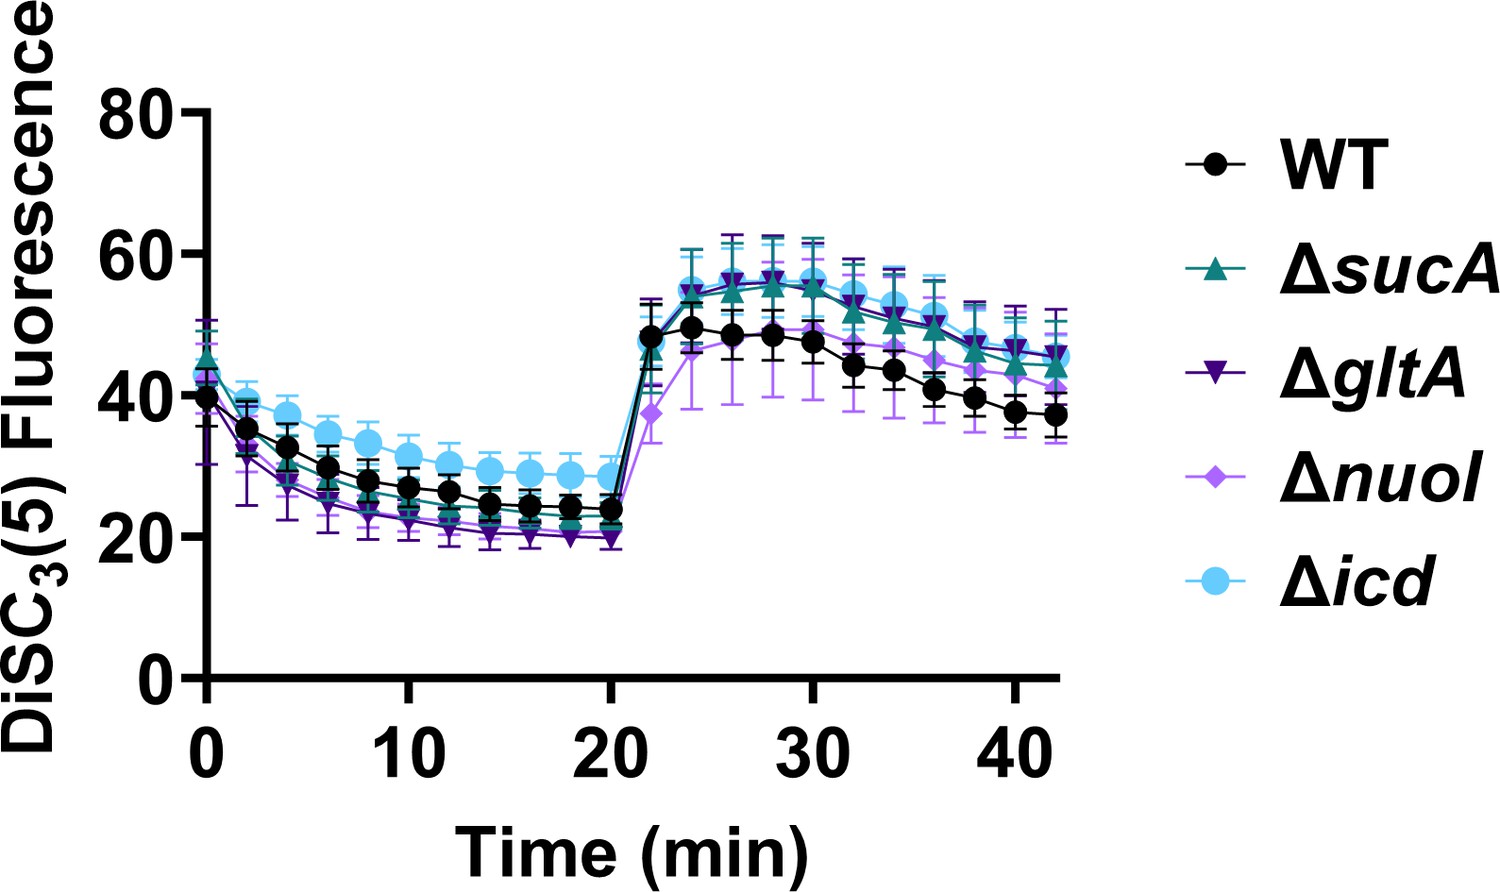
The dysregulation of membrane potential is not correlated with the observed aminoglycoside tolerance.
Deletions of the tricarboxylic acid (TCA) cycle and electron transport chain genes resulted in no significant change in proton motive force (PMF). Mid-exponential and early stationary phase cells of wild-type and mutant strains were stained with DiSC3(5), and at specified time intervals their fluorescence was measured using a plate reader. Cells were treated with gentamicin (50 µg/ml) after 20 min and fluorescence was measured again. N = 4. Data points represent mean and standard error.
Figure 5—figure supplement 1
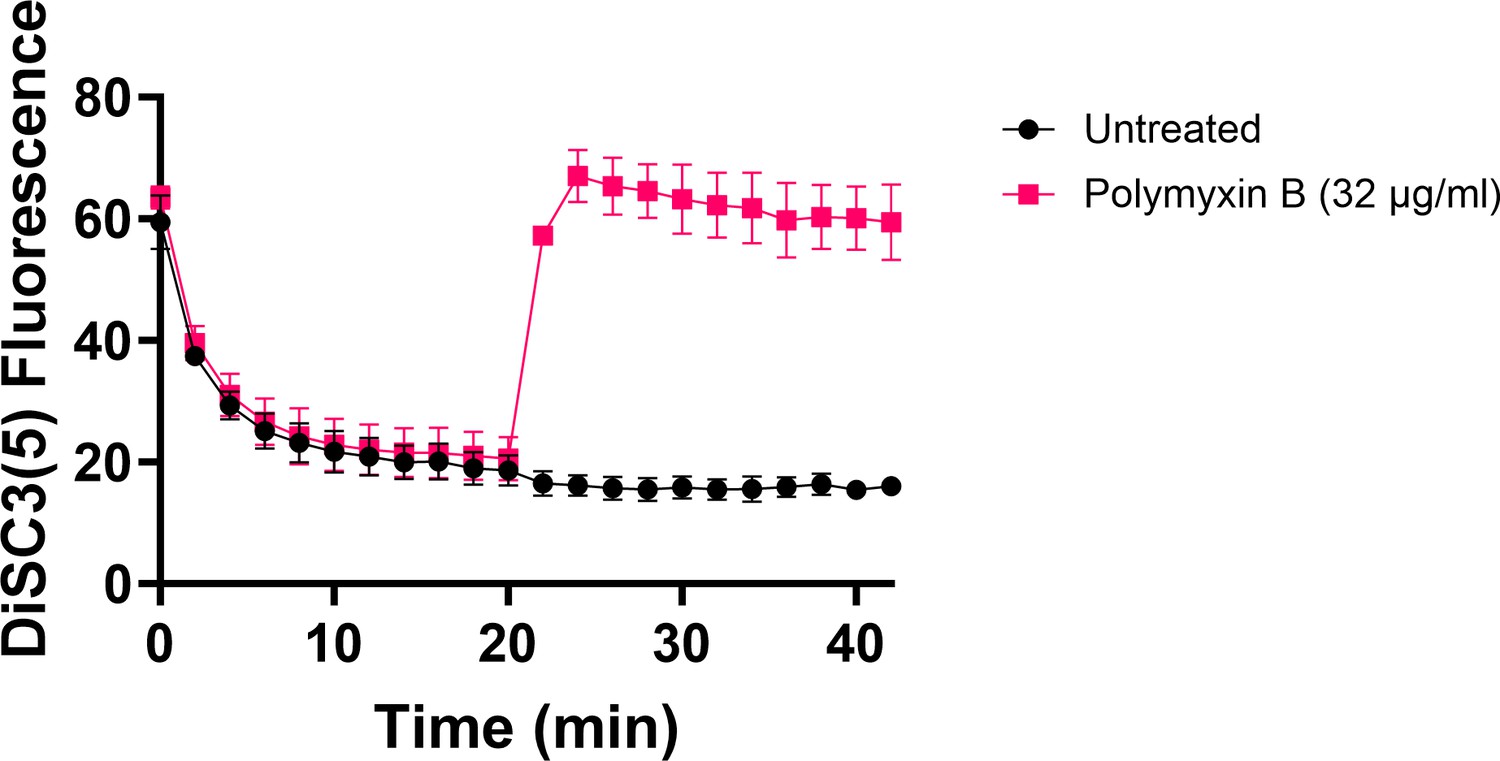
Polymyxin B, functioning as a control, leads to the disruption of the cytoplasmic membrane and proton motive force (PMF).
This disruption results in the release of DiSC3(5) from the membrane, accompanied by a concurrent increase in fluorescence. Polymyxin B achieves this effect by attaching its polycationic peptide ring to a negatively charged site within the lipopolysaccharide layer of the cellular membrane. N = 3. Data points represent mean and standard error.
Figure 5—figure supplement 2
The dysregulation of proton motive force (PMF) is not correlated with the observed aminoglycoside tolerance.
The mutant and wild-type strains showed no significant change in PMF. Mid-exponential phase cells of wild-type and mutant strains (t = 3.5 hr) were stained with DiSC3(5), and at specified time intervals their fluorescence was measured using a plate reader. Cells were treated with gentamicin (5 µg/ml) after 20 min and fluorescence was measured again. N = 4. Data points represent mean and standard error.
Figure 5—figure supplement 3
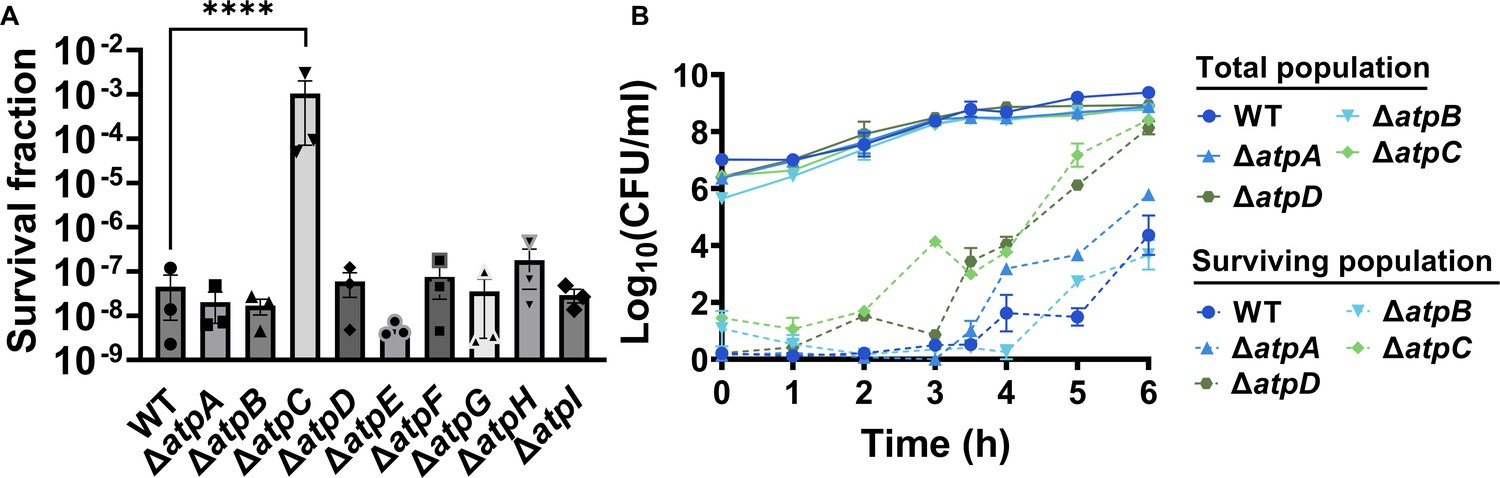
Deletions of the ATP synthase genes did not confer a reverse ATPase-mediated killing under the conditions studied here.
(A) During the mid-exponential phase (t = 3.5 hr), ATP synthase knockout strains of E. coli BW25113 were subjected to gentamicin treatment at a concentration of 50 μg/ml in test tubes for 5 hr. After the treatments, cells were washed to remove the antibiotics and then plated on LB agar plates to quantify the surviving cell fractions in terms of colony-forming units (CFU). (B) The cells of E. coli MG1655 wild-type and ATP synthase knockout strains were collected from flasks at indicated time intervals and then subjected to gentamicin treatment. The figure shows CFU levels of both the treated and untreated cultures. For pairwise comparisons, a one-way analysis of variance (ANOVA) with Dunnett’s post hoc test was employed, where ****p < 0.0001. N = 3. Data points represent mean and standard error.
Figure 5—figure supplement 4

Deletions in the ATP synthase genes did not confer a reverse ATPase-mediated killing under the conditions studied here.
The cells of E. coli MG1655 wild-type and ATP synthase knockout strains were exposed to 5 μg/ml gentamicin at the mid-exponential phase (t = 3.5 hr) for 5 hr in test tubes. After the treatments, cells were washed to remove the antibiotics and then plated on LB agar plates to quantify CFU levels. For pairwise comparisons, one-way analysis of variance (ANOVA) with Dunnett’s post hoc test was used where ****p < 0.0001. N = 4. Data points represent mean and standard error.
Figure 6

Proteomics data on the mutant strains, exhibiting increased gentamicin tolerance, indicate upregulation in proteins linked to energy metabolism.
Cells from both wild-type and mutant strains at the mid-exponential phase (t = 3.5 hr) were collected after which protein extraction and digestion were carried out for mass spectrometry analysis. The STRING visual network depicts upregulated protein interactions of ΔsucA (A), ΔgltA (B), and ΔnuoI (C) mutants, compared to those of the wild-type strain. The protein clusters and their corresponding gene names are visually distinguished through color-coding on the networks. N = 3.
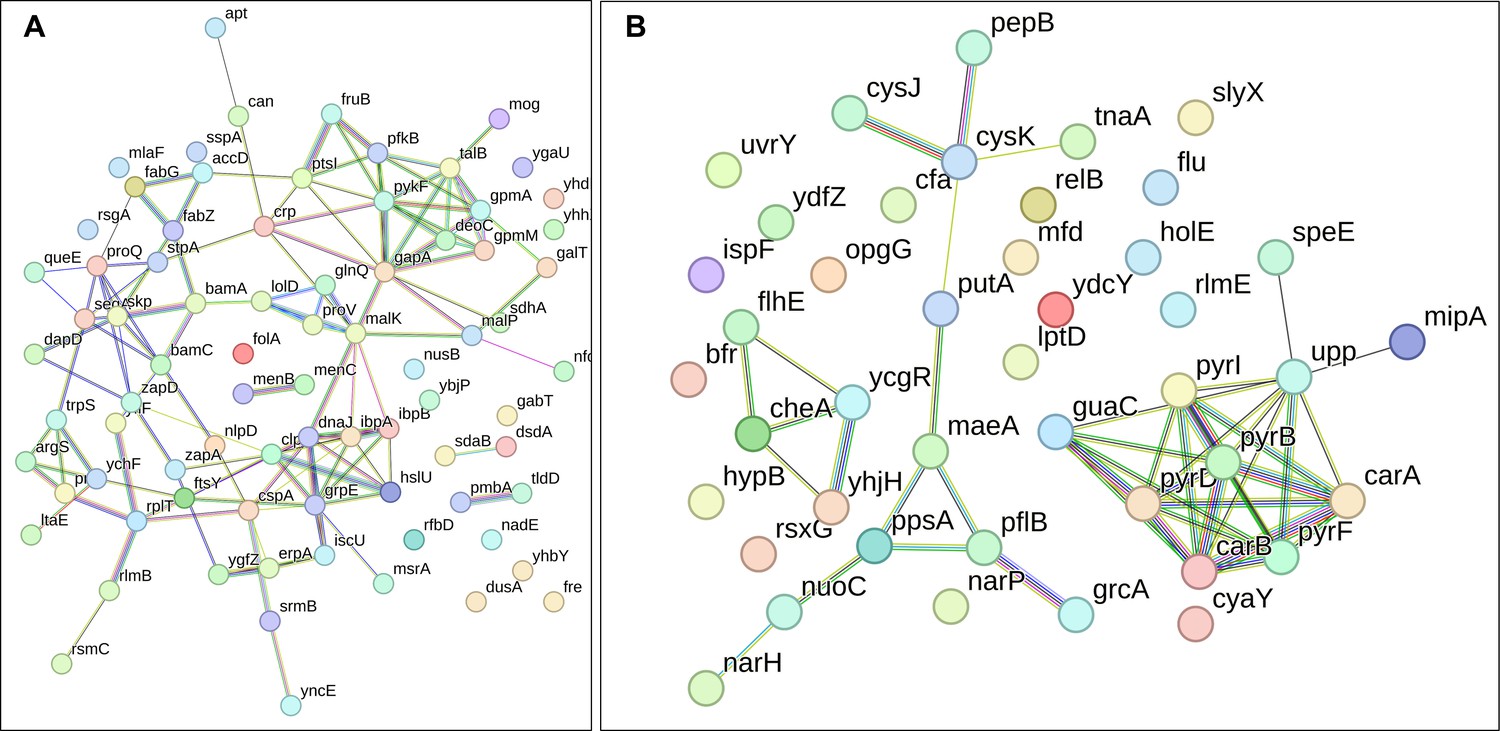
Figure 7 with 1 supplement

Proteomics data on the mutant strains, exhibiting increased gentamicin tolerance, reveal downregulation in proteins associated with ribosomes.
The STRING visual network displays downregulated protein interactions for ΔsucA (A), ΔgltA (B), and ΔnuoI (C) mutants. N = 3.
Figure 7—figure supplement 1
The proteomic analysis of the gentamicin-sensitive Δicd mutant strain did not show a notable increase in energy metabolism or a decrease in proteins associated with ribosomes, in contrast to the observed patterns in ΔsucA, ΔgltA, and ΔnuoI mutants.
The STRING visual networks depict both up- and downregulated protein interactions specific to the Δicd mutant (A, B), respectively.
Author response image 1

ATP levels in the icd mutant.
ATP levels of both the mutant and wild-type strains were measured at t=3 hours of cell growth and normalized to cell counts. The figure presents the raw data (a), linear plot (b), and logarithmic plot (c) of the same dataset. This data corresponds to the first panel of Figure 3B in the manuscript.
Author response image 2

Gentamicin tolerance of wild-type and icd mutant strains of E. coli BW25113.
Both wild type and mutant strains were treated with gentamicin (50 µg/ml) for 5 hours at the mid-exponential phase. Cells were plated before and after treatment for CFU/ml counts. The dashed line represents the limit of detection. CFU: Colony forming units.
Tables
Key resources table
| Reagent type (species) or resource | Designation | Source or reference | Identifiers | Additional information |
|---|---|---|---|---|
| Strain, strain background (Escherichia coli) | Escherichia coli MG1655 ΔsucA mutant | other | Ngo HG, Ngo et al., 2024. Unraveling Crp/cAMP-mediated metabolic regulation in Escherichia coli persister cells. bioRxiv. | |
| Strain, strain background (Escherichia coli) | Escherichia coli MG1655 ΔgltA mutant | other | Ngo et al., 2024 | |
| Strain, strain background (Escherichia coli) | Escherichia coli MG1655 ΔnuoI mutant | other | Ngo et al., 2024 | |
| Strain, strain background (Escherichia coli) | Escherichia coli MG1655 Δicd mutant | other | Ngo et al., 2024 | |
| Strain, strain background (Escherichia coli) | Escherichia coli MG1655 ΔsdhC mutant | other | Ngo et al., 2024 | |
| Strain, strain background (Escherichia coli) | Escherichia coli MG1655 Δmdh mutant | other | Ngo et al., 2024 | |
| Strain, strain background (Escherichia coli) | Escherichia coli MG1655 ΔacnB mutant | other | Ngo et al., 2024 | |
| Strain, strain background (Escherichia coli) | Escherichia coli MG1655 ΔfumA mutant | other | Ngo et al., 2024 | |
| Strain, strain background (Escherichia coli) | Escherichia coli MG1655 ΔnuoM mutant | other | Ngo et al., 2024 | |
| Strain, strain background (Escherichia coli) | Escherichia coli MG1655 ΔatpA mutant | other | Ngo et al., 2024 | |
| Strain, strain background (Escherichia coli) | Escherichi. coli MG1655 ΔatpB mutant | other | Ngo et al., 2024 | |
| Strain, strain background (Escherichia coli) | Escherichia coli MG1655 ΔatpC mutant | other | Ngo et al., 2024 | |
| Strain, strain background (Escherichia coli) | Escherichia coli MG1655 ΔatpD mutant | other | Ngo et al., 2024 | |
| Strain, strain background (Escherichia coli) | Escherichia coli K-12 BW25113 ΔatpA mutant | Horizon Discovery | Catalog # OEC4988 | |
| Strain, strain background (Escherichia coli) | Escherichia coli K-12 BW25113 ΔatpB mutant | Horizon Discovery | Catalog # OEC4988 | |
| Strain, strain background (Escherichia coli) | Escherichia coli K-12 BW25113 ΔatpC mutant | Horizon Discovery | Catalog # OEC4988 | |
| Strain, strain background (Escherichia coli) | Escherichia coli K-12 BW25113 ΔatpD mutant | Horizon Discovery | Catalog # OEC4988 | |
| Strain, strain background (Escherichia coli) | Escherichia coli K-12 BW25113 ΔatpE mutant | Horizon Discovery | Catalog # OEC4988 | |
| Strain, strain background (Escherichia coli) | Escherichia coli K-12 BW25113 ΔatpF mutant | Horizon Discovery | Catalog # OEC4988 | |
| Strain, strain background (Escherichia coli) | Escherichia coli K-12 BW25113 ΔatpG mutant | Horizon Discovery | Catalog # OEC4988 | |
| Strain, strain background (Escherichia coli) | Escherichia coli K-12 BW25113 ΔatpH mutant | Horizon Discovery | Catalog # OEC4988 | |
| Strain, strain background (Escherichia coli) | Escherichia coli K-12 BW25113 ΔatpI mutant | Horizon Discovery | Catalog # OEC4988 | |
| Recombinant DNA Reagent | pGFPR01 | Martinez et al., 2012 | ||
| Commercial assay or kit | BacTiter-Glo Microbial Cell Viability assay | Promega Corporation | Catalog # G8230 | |
| Commercial assay or kit | BacLight Redox Sensor Green Vitality kit | Thermo Fisher | Catalog # B34954 | |
| Chemical compound or drug | Gentamicin-Texas Red Conjugate | AAT Bioquest, Inc | Catalog # 24300 | |
| Chemical compound or drug | Polymyxin B Sulfate | Millipore Sigma | Catalog # 52-91-1GM | |
| Chemical compound or drug | DiSC3(5) (3,3′-Dipropylthiadicarbocyanine Iodide) | TCI America | Catalog # D4456 | |
| Commercial assay or kit | MIC Test Strips | Fisher Scientific | ||
| Software, algorithm | Prism (version 10.1.2) | GraphPad | RRID: SCR_002798 | http://www.graphpad.com/ |
| Software, algorithm | FlowJo (version 10.10.0) | Becton, Dickinson & Company | RRID: SCR_008520 | https://www.flowjo.com/solutions/flowjo |
Additional files
-
Supplementary file 1
The minimum inhibitory concentrations of aminoglycosides were assessed in both wild type and mutant E. coli MG1655 strains.
(a) The minimum inhibitory concentration (MIC) levels of streptomycin, gentamicin, and amikacin were examined in tricarboxylic acid cycle (TCA) and electron transport chain (ETC) mutants as well as the wild type.
- https://cdn.elifesciences.org/articles/94903/elife-94903-supp1-v1.docx
-
Supplementary file 2
Proteomics data analysis identified upregulated and downregulated proteins in mutant E. coli MG1655 strains with subsequent pathway analysis for these proteins compared to the wild type.
(a) Upregulated proteins at mid-exponential phase (t = 3.5 hr) in the ΔsucA mutant strain relative to the wild type. FC: fold change. A significance threshold of p < 0.05, based on F- and t-statistics (see Materials and methods), is applied. (b) Upregulated proteins at mid-exponential phase (t = 3.5 hr) in the ΔgltA mutant strain relative to the wild type. FC: fold change. A significance threshold of p < 0.05 is applied. (c) Upregulated proteins at mid-exponential phase (t = 3.5 hr) in the ΔnuoI mutant strain relative to the wild type. FC: fold change. A significance threshold of p < 0.05 is applied. (d) Upregulated proteins at mid-exponential phase (t = 3.5 hr) in the Δicd mutant strain relative to the wild type. FC: fold change. A significance threshold of p < 0.05 is applied. (e) Downregulated proteins at mid-exponential phase (t = 3.5 hr) in the ΔsucA mutant strain relative to the wild type. FC: fold change. A significance threshold of p < 0.05 is applied. (f) Downregulated proteins at mid-exponential phase (t = 3.5 hr) in the ΔgltA mutant strain relative to the wild type. FC: fold change. A significance threshold of p < 0.05 is applied. (g) Downregulated proteins at mid-exponential phase (t = 3.5 hr) in the ΔnuoI mutant strain relative to the wild type. FC: fold change. A significance threshold of p < 0.05 is applied. (h) Downregulated proteins at mid-exponential phase (t = 3.5 hr) in the Δicd mutant strain relative to the wild type. FC: fold change. A significance threshold of p < 0.05 is applied. (i) The pathway analysis for the upregulated proteins in the ΔsucA strain compared to the wild type. This analysis integrates statistical analysis across the entire genome and includes various functional pathway classification frameworks such as Gene Ontology annotations, KEGG pathways, Uniprot, and STRING. Count in network: The first number indicates how many proteins in our network are annotated with a particular term. The second number indicates how many proteins in total (in our network and the background) have this term assigned. Strength: Log10(observed/expected). This measure describes how large the enrichment effect is. It is the ratio between (1) the number of proteins in our network that are annotated with a term and (2) the number of proteins that we expect to be annotated with this term in a random network of the same size. False discovery rate: This measure describes how significant the enrichment is. Shown are p-values corrected for multiple testing within each category using the Benjamini–Hochberg procedure. Note: When discussing our findings in the manuscript, we primarily reference the local network cluster (STRING), as it offers the advantage of broader coverage, including potential novel modules that might not yet be classified as pathways. (j) The pathway analysis for the upregulated proteins in the ΔgltA strain compared to the wild type. See the legend of Supplementary file 2i for further details. (k) The pathway analysis for the upregulated proteins in the ΔnuoI strain compared to the wild type. See the legend of Supplementary file 2i for further details. (l) The pathway analysis for the upregulated proteins in the Δicd strain compared to the wild type. See the legend of Supplementary file 2i for further details. (m) The pathway analysis for the downregulated proteins in the ΔsucA strain compared to the wild type. See the legend of Supplementary file 2i for further details. (n) The pathway analysis for the downregulated proteins in the ΔgltA strain compared to the wild type. See the legend of Supplementary file 2i for further details. (o) The pathway analysis for the downregulated proteins in the ΔnuoI strain compared to the wild type. See the legend of Supplementary file 2i for further details. (p) The pathway analysis for the downregulated proteins in the Δicd strain compared to the wild type. See the legend of Supplementary file 2i for further details.
- https://cdn.elifesciences.org/articles/94903/elife-94903-supp2-v1.docx
-
Supplementary file 3
The raw proteomics data included quantified protein levels in samples from both wild type and mutant strains.
- https://cdn.elifesciences.org/articles/94903/elife-94903-supp3-v1.xlsx
-
MDAR checklist
- https://cdn.elifesciences.org/articles/94903/elife-94903-mdarchecklist1-v1.docx
Download links
A two-part list of links to download the article, or parts of the article, in various formats.
Downloads (link to download the article as PDF)
Open citations (links to open the citations from this article in various online reference manager services)
Cite this article (links to download the citations from this article in formats compatible with various reference manager tools)
Metabolic disruption impairs ribosomal protein levels, resulting in enhanced aminoglycoside tolerance
eLife 13:RP94903.
https://doi.org/10.7554/eLife.94903.3


