Hippocampal-occipital connectivity reflects autobiographical memory deficits in aphantasia
- Department of Psychology, University of Bonn, Germany
- German Center for Neurodegenerative Diseases, Germany
- Department of Old Age Psychiatry and Cognitive Disorders, University Hospital Bonn, Germany
- Center for Economics and Neuroscience, University of Bonn, Germany
- Institute of Experimental Epileptology and Cognition Research, Medical Faculty, University of Bonn, Germany
Figures
Figure 1
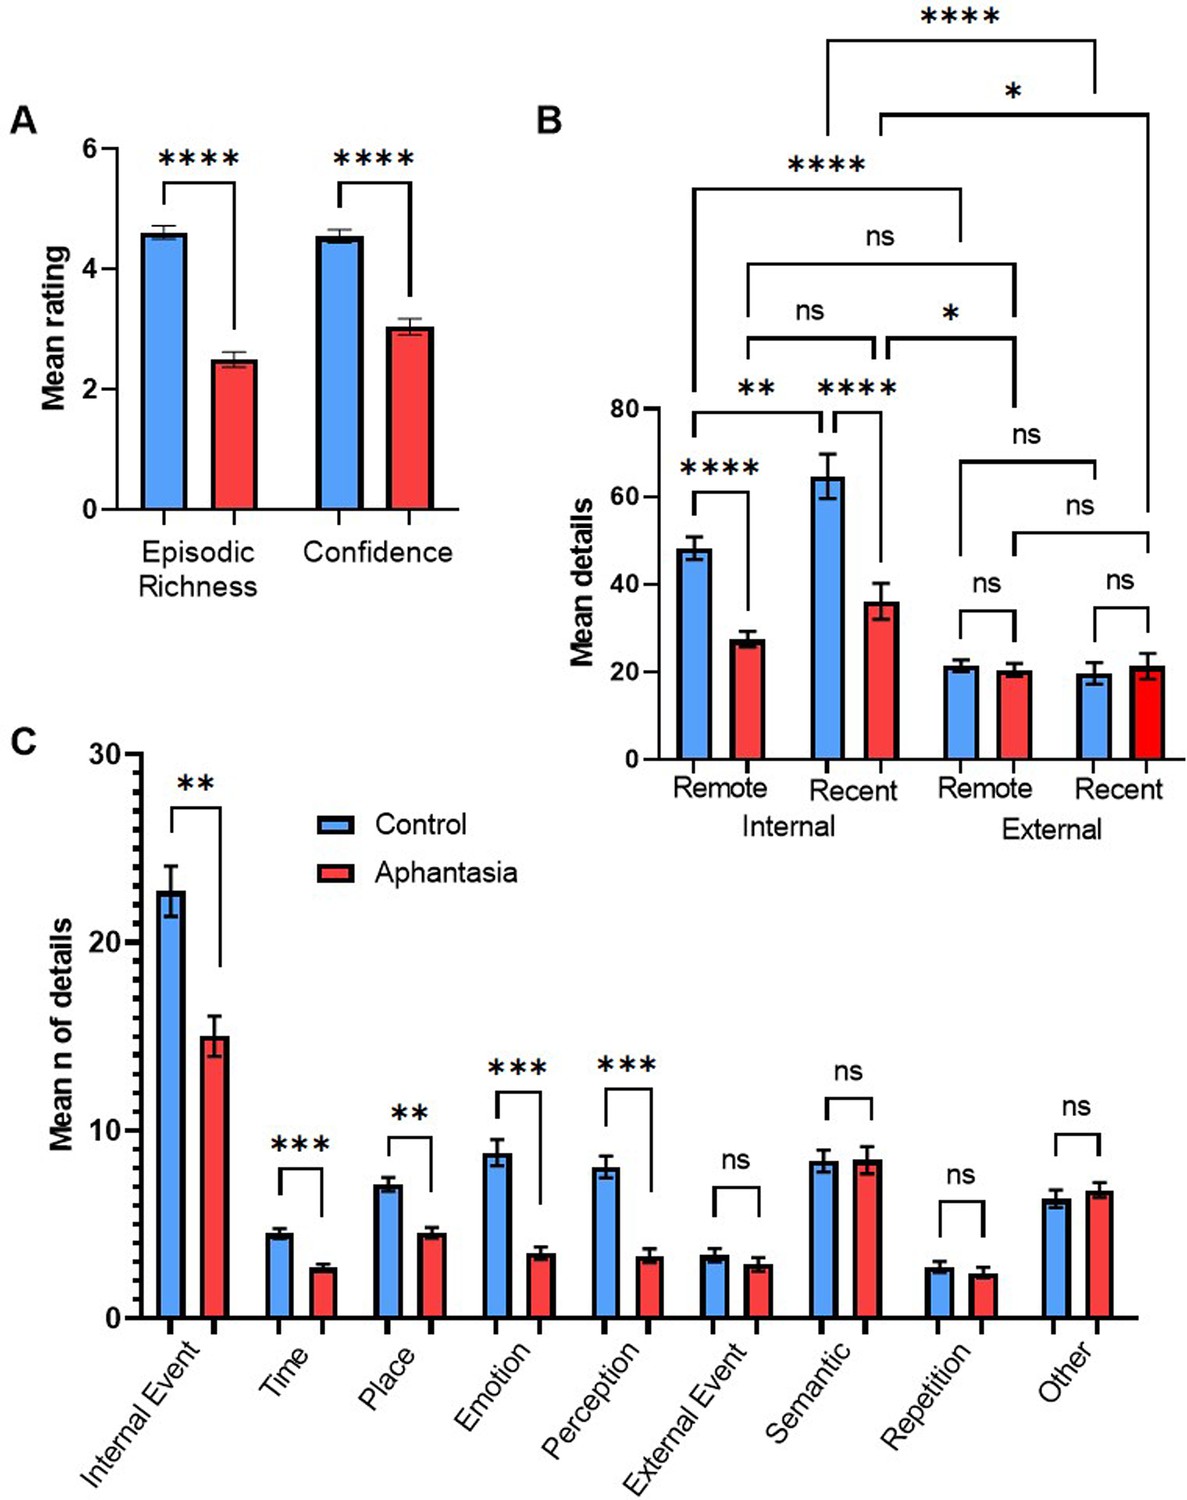
AM deficits associated with aphantasia.
(A) Mean amount (± SEM) of episodic richness and confidence in the Autobiographical Interview for controls and aphantasics. (B) Mean amount (± SEM) of internal details and external details for recent and remote memories. (C) Mean amount (± SEM) of specific internal and external memory details for aphantasics and controls. * p<0.05, ** p<0.01, *** p<0.001, **** p<0.0001, n.s.=non-significant.
Figure 2
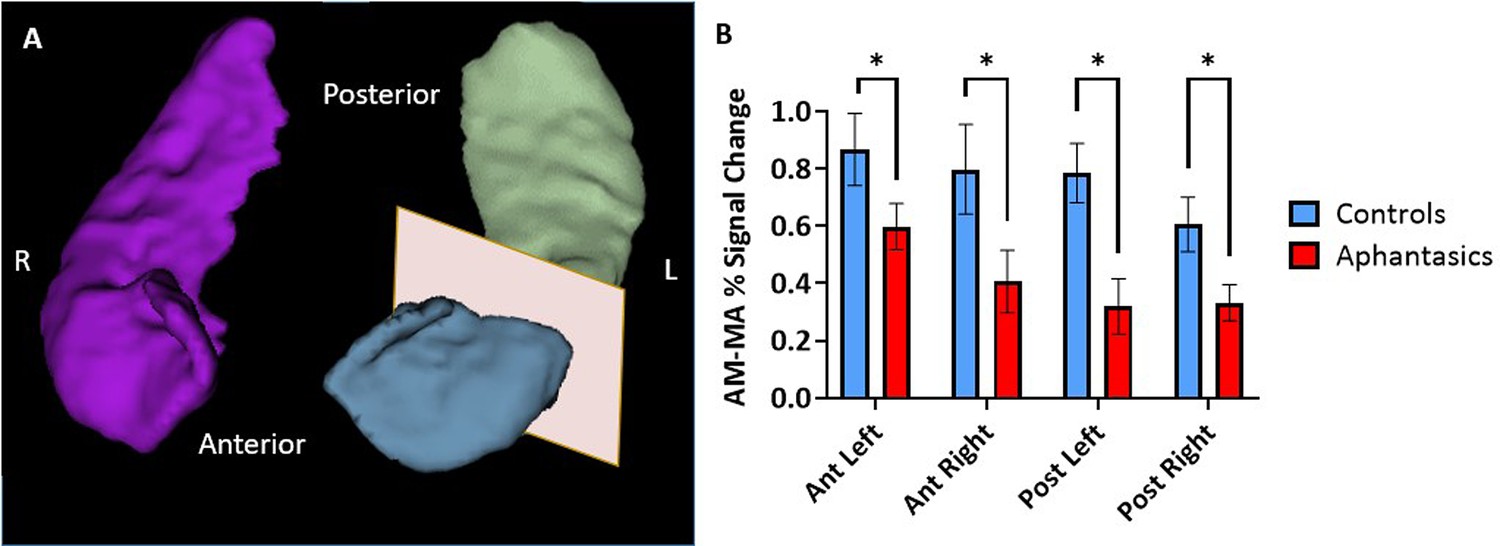
Reduced hippocampal activity during autobiographical memory retrieval associated with aphantasia.
The signal intensities during autobiographical memory (AM) and mental arithmetic (MA) were extracted from anatomical hippocampal masks created from each individual participant. (A) An example of a 3D reconstruction of the hippocampus, separated into anterior and posterior portions for the left hippocampus. (B) The comparison between the percentage of signal change during the AM and MA tasks in the hippocampus of aphantasics and controls. Aphantasics show reduced differentiation between AM and MA than controls in all portions of the hippocampus. * p<0.05.
Figure 3
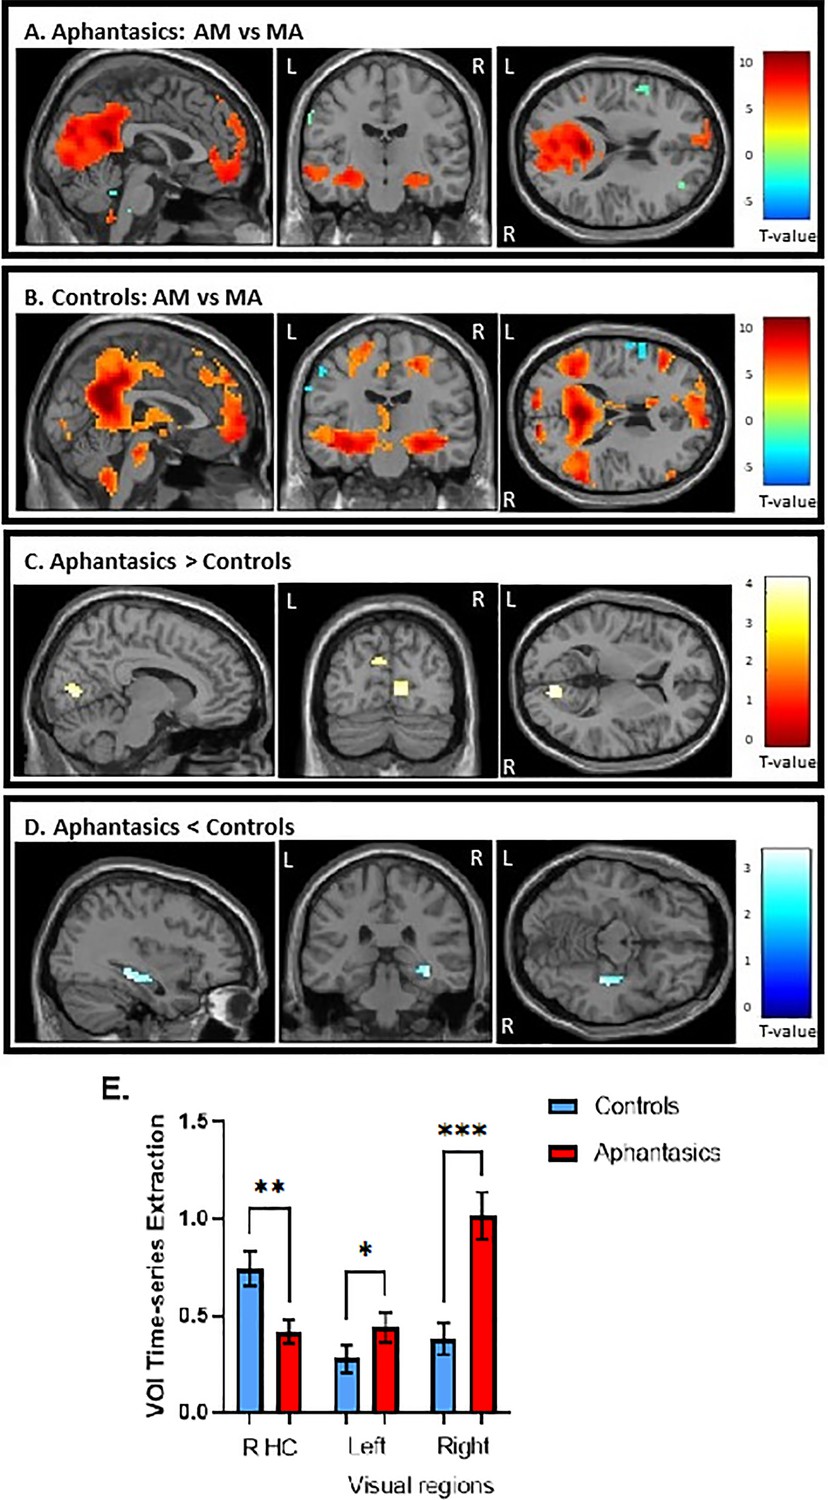
Activation during the autobiographical memory retrieval task.
(A) Stronger activated cortical regions during AM retrieval (in warm colors) in comparison to mental arithmetic (in cool colors) in aphantasics and (B) controls. (C) Aphantasics showed greater activation in visual-perceptual cortices than controls, and (D) controls showed stronger activation in the right posterior hippocampus than aphantasics. Images are thresholded at p<0.001, cluster size 10, uncorrected, except (D) which is thresholded at p<0.01, cluster size 10, for display purposes only (i.e. the peak voxel and adjacent 10 voxels also survived p<0.001, uncorrected). (E) The percentage of signal change for the contrast AM versus MA were extracted from the peaks of activated voxels, each with 1 mm sphere for display purposes.
Figure 4
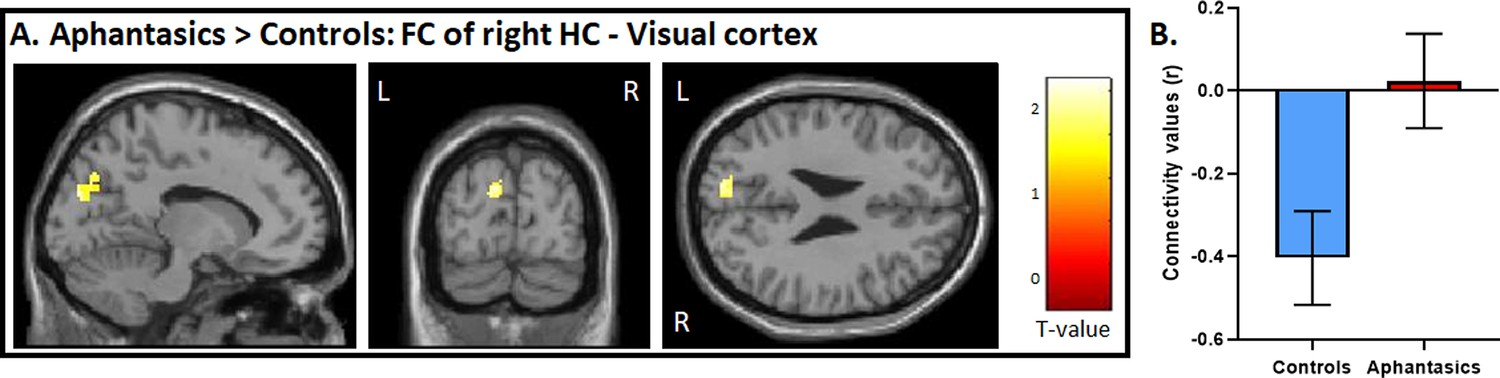
Functional connectivity between the visual-perceptual cortex and hippocampus during AM retrieval.
(A) During AM retrieval, group differences in functional connectivity amongst the ROIs were only found between the right hippocampus, and left visual-perceptual cortices. (B) Controls displayed a stark negative correlation, whereas aphantasics did not. Image is displayed at p<0.05, small volume corrected, and a voxel cluster threshold of 10 adjacent voxels.
Figure 5

Functional connectivity between the visual-perceptual cortex and hippocampus during resting-state explains visualization abilities.
Resting-state functional connectivity between the right hippocampus and the right visual-perceptual cortex correlates with visualization abilities. Fitted straight lines indicate a negative correlation for aphantasics (red) and a positive correlation for controls (blue).
Tables
Table 1
Peak coordinates of the AM and MA activation for Aphantasia.
| Region | Hemisphere | MNI Coordinates | Voxels | T-value | ||
|---|---|---|---|---|---|---|
| X | Y | Z | ||||
| Activation AM >MA | ||||||
| Posterior Cingulate Gyrus | Right | 18 | –57 | 11 | 4657 | 11.00 |
| Parahippocampual Gyrus* | Left | –21 | –31 | –13 | 9.06 | |
| Hippocampus | Left | –27 | –17 | –19 | 205 | 8.40 |
| Superior Frontal Gyrus | Left | –12 | 47 | 50 | 926 | 8.38 |
| Angular Gyrus | Left | –42 | –55 | 23 | 165 | 7.88 |
| Lateral Orbitofrontal Cortex | Left | –42 | 38 | –16 | 208 | 7.58 |
| Hippocampus | Right | 18 | –37 | -1 | 199 | 6.89 |
| Cerebellum | Right | 15 | –79 | –37 | 109 | 6.33 |
| Brainstem | Right | 3 | –46 | –52 | 43 | 6.03 |
| Parahippocampual Gyrus* | Right | 24 | –31 | –13 | 6.02 | |
| Middle Temporal Gyrus | Right | 60 | 2 | -–19 | 76 | 5.27 |
| Supramarginal Gyrus | Right | 54 | –58 | 32 | 26 | 4.99 |
| Middle Frontal Gyrus | Left | –39 | 20 | 50 | 12 | 4.52 |
| Activation MA >AM | ||||||
| Precuneus | Left | –18 | –58 | 41 | 594 | –3.85 |
| Inferior Temporal Gyrus | Right | 51 | –46 | –13 | 123 | –3.85 |
| Precuneus | Right | 24 | –49 | 53 | 718 | –3.85 |
| Insula | Left | –30 | 23 | 11 | 48 | –3.85 |
| Inferior Temporal Gyrus | Left | –51 | –49 | –13 | 67 | –3.86 |
| Cerebellum | Right | 30 | –67 | –52 | 27 | –3.87 |
| Middle Frontal Gyrus | Right | 33 | 41 | 17 | 34 | –3.87 |
| Superior Frontal Gyrus | Right | 30 | 5 | 59 | 52 | –3.87 |
| Inferior Frontal Gyrus | Right | 54 | 14 | 29 | 35 | –3.88 |
| Insula | Right | 39 | 11 | 8 | 51 | –3.88 |
| Inferior Frontal Gyrus | Left | –57 | 11 | 26 | 182 | –3.88 |
| Lateral Globus Pallidus | Right | 23 | -7 | 14 | 14 | –3.92 |
| Cerebellum | Left | –24 | –64 | –46 | 16 | –3.93 |
-
*
Sub-cluster level, Cluster size = 10 voxels, p-value = 0.001.
Table 2
Peak coordinates of the AM and MA activation for healthy controls.
| Region | Hemisphere | MNI Coordinates | Voxels | T-value | ||
|---|---|---|---|---|---|---|
| X | Y | Z | ||||
| Activation AM >MA | ||||||
| Parahippocampal Gyrus | Right | 27 | –28 | –19 | 11319 | 12.41 |
| Parahippocampal Gyrus* | Left | –24 | –25 | –16 | 9.01 | |
| Cerebellum | Left | –18 | –76 | –37 | 108 | 7.67 |
| Anterior Cingulate | Right | 9 | 35 | 11 | 13 | 7.01 |
| Medial Frontal Gyrus | Right | 18 | 32 | 29 | 233 | 6.93 |
| Inferior Frontal Gyrus | Right | 60 | 32 | 11 | 53 | 5.94 |
| Hippocampus | Left | –36 | –22 | –16 | 252 | 5.64 |
| Hippocampus | Right | 27 | –22 | –16 | 233 | 5.28 |
| Hypothalamus | Right | 3 | -4 | –10 | 16 | 4.93 |
| Activation MA >AM | ||||||
| Post Central Gyrus | Left | –33 | –43 | 62 | 643 | –3.73 |
| Precuneus | Right | 21 | –52 | 53 | 483 | –3.74 |
| Inferior Frontal Gyrus | Right | 51 | 8 | 26 | 16 | –3.74 |
| Middle Occipital Gyrus | Right | 33 | –82 | 2 | 26 | –3.75 |
| Middle Temporal Gyrus | Left | –51 | –58 | -1 | 18 | –3.76 |
-
*
Sub-cluster level, Cluster size = 10 voxels, p-value = 0.001.
Table 3
Demographic data for aphantasics, controls and the total sample.
| Total (n=30) | Aphantasics(n=14) | Controls(n=16) | Test statistic | p | BF01 | |
|---|---|---|---|---|---|---|
| Age | 0.80* | .431 | 2.30 | |||
| M | 29.77 | 31.47 | 28.19 | |||
| SD | 11.36 | 10.45 | 12.27 | |||
| IQ | ||||||
| M | 93.77 | 91.73 | 95.69 | 0.81* | .425 | 2.29 |
| SD | 13.53 | 16.61 | 10.02 | |||
| Sex | 2.76† | .097 | 0.69 | |||
| Male (%) | 32.3 | 53.3 | 81.3 | |||
| Female (%) | 67.7 | 46.7 | 18.8 | |||
| Education | 1.59† | .662 | 7.90 | |||
| Secondary school (%) | 6.5 | 6.7 | 6.3 | |||
| A-levels (%) | 35.5 | 40.0 | 31.3 | |||
| University degree (%) | 54.8 | 46.7 | 62.5 | |||
| Doctoral degree (%) | 3.2 | 6.7 | 0.0 |
-
Note. BF01=Bayes Factor, indicates how much more likely H0 is compared to H1.
-
*
t-test.
-
†
χ2-test.
Additional files
Download links
A two-part list of links to download the article, or parts of the article, in various formats.
Downloads (link to download the article as PDF)
Open citations (links to open the citations from this article in various online reference manager services)
Cite this article (links to download the citations from this article in formats compatible with various reference manager tools)
Hippocampal-occipital connectivity reflects autobiographical memory deficits in aphantasia
eLife 13:RP94916.
https://doi.org/10.7554/eLife.94916.3


