Short-term social isolation acts on hypothalamic neurons to promote social behavior in a sex- and context-dependent manner
- Department of Psychology, Cornell University, United States
Figures
Figure 1 with 1 supplement
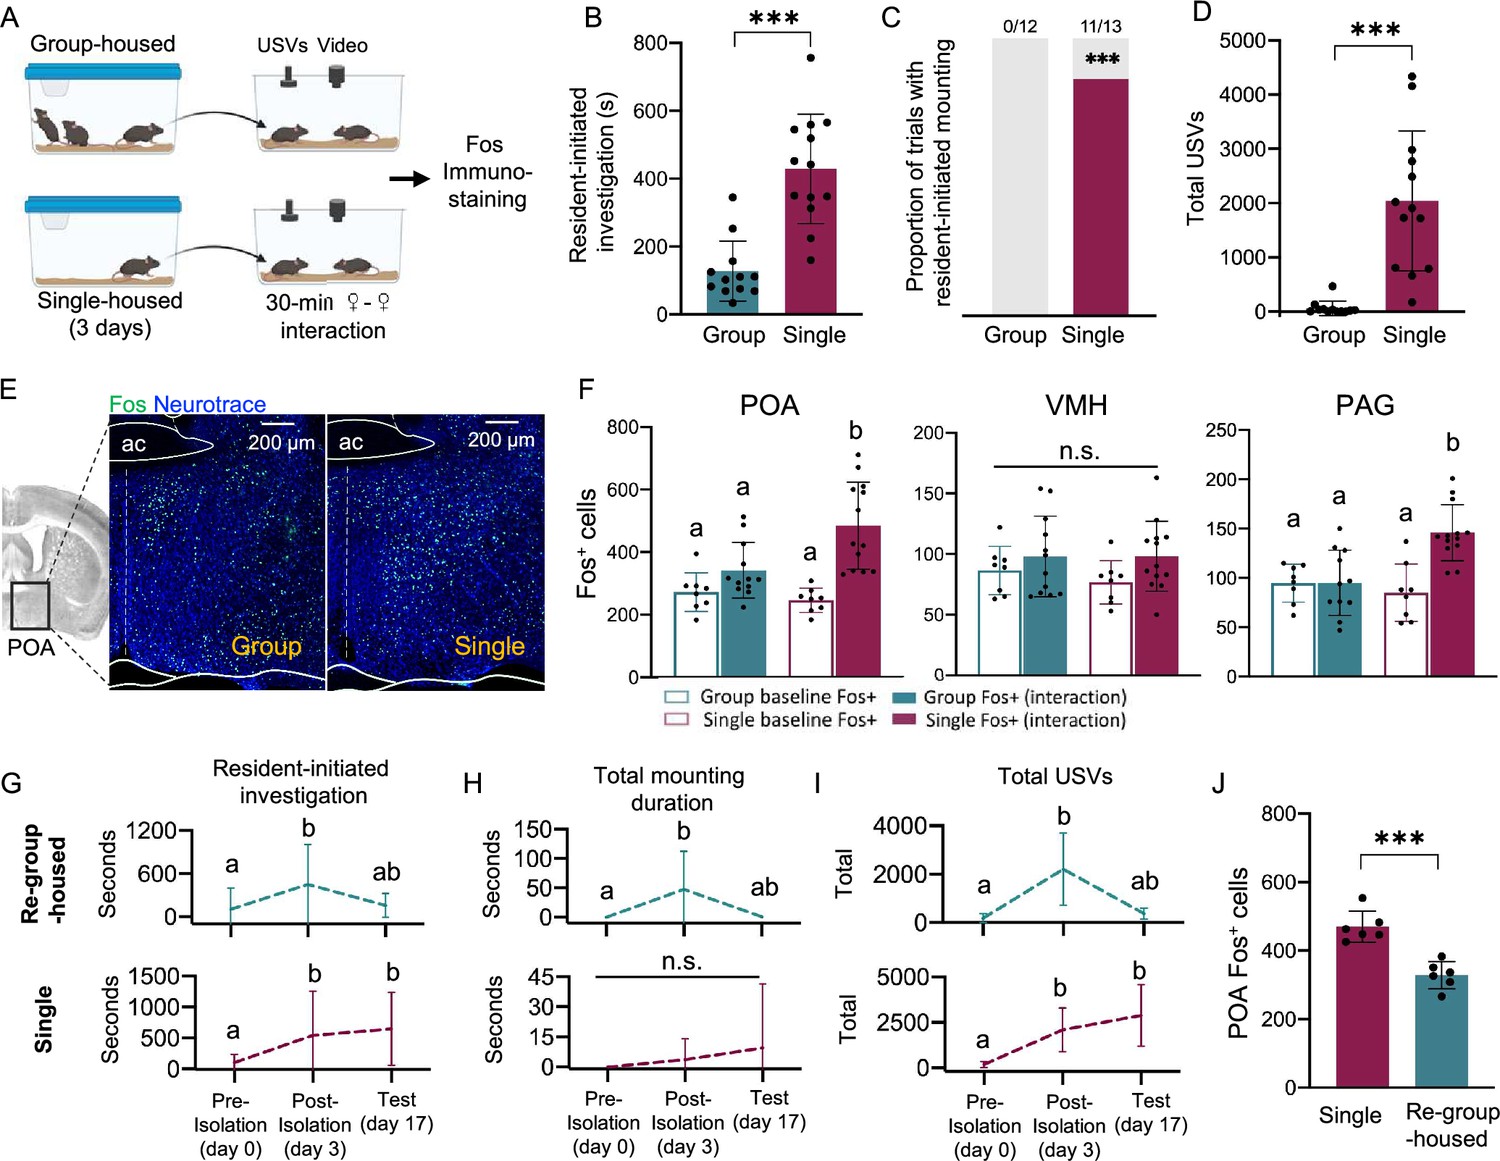
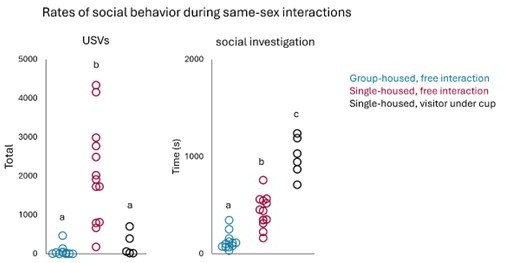
The POA contains neurons that increase Fos expression in single-housed females following same-sex interactions.
(A) Schematic of experiment to measure Fos expression in group-housed and single-housed females following same-sex social interactions. (B) Total time spent engaged in resident-initiated social investigation for group-housed residents (teal) and single-housed residents (maroon). (C) Same as (B), for proportion of trials with resident-initiated mounting. (D) Same as (B), for total USVs recorded from pairs containing group-housed or single-housed residents. (E) Left-most image shows the location of the POA in a coronal brain section. Representative confocal images show Fos expression (green) in the POA of a group-housed female (left) and a single-housed female (right) following same-sex social interactions. Blue, Neurotrace. (F) Quantification of Fos-positive neurons is shown for the POA (left), the VMH (middle), and the caudolateral PAG (right) for group-housed and single-housed females. Open bars show data from females that did not engage in social interactions with novel females (baseline), and closed bars show data from females following social interactions with novel females (interaction). (G) Total time spent in resident-initiated interaction is plotted for 17 day single-housed (maroon) and re-group-housed females (teal) during same-sex interactions that occurred prior to isolation (day 0), following 3 days of isolation (day 3), and on the test day (day 17). (H) Same as (G), for total resident-initiated mounting time. (I) Same as (G), for total USVs. (J) Quantification of Fos-positive POA neurons is shown for 17 day single-housed females (maroon) and re-group-housed females (teal). All error bars show standard deviation.
Figure 1—figure supplement 1
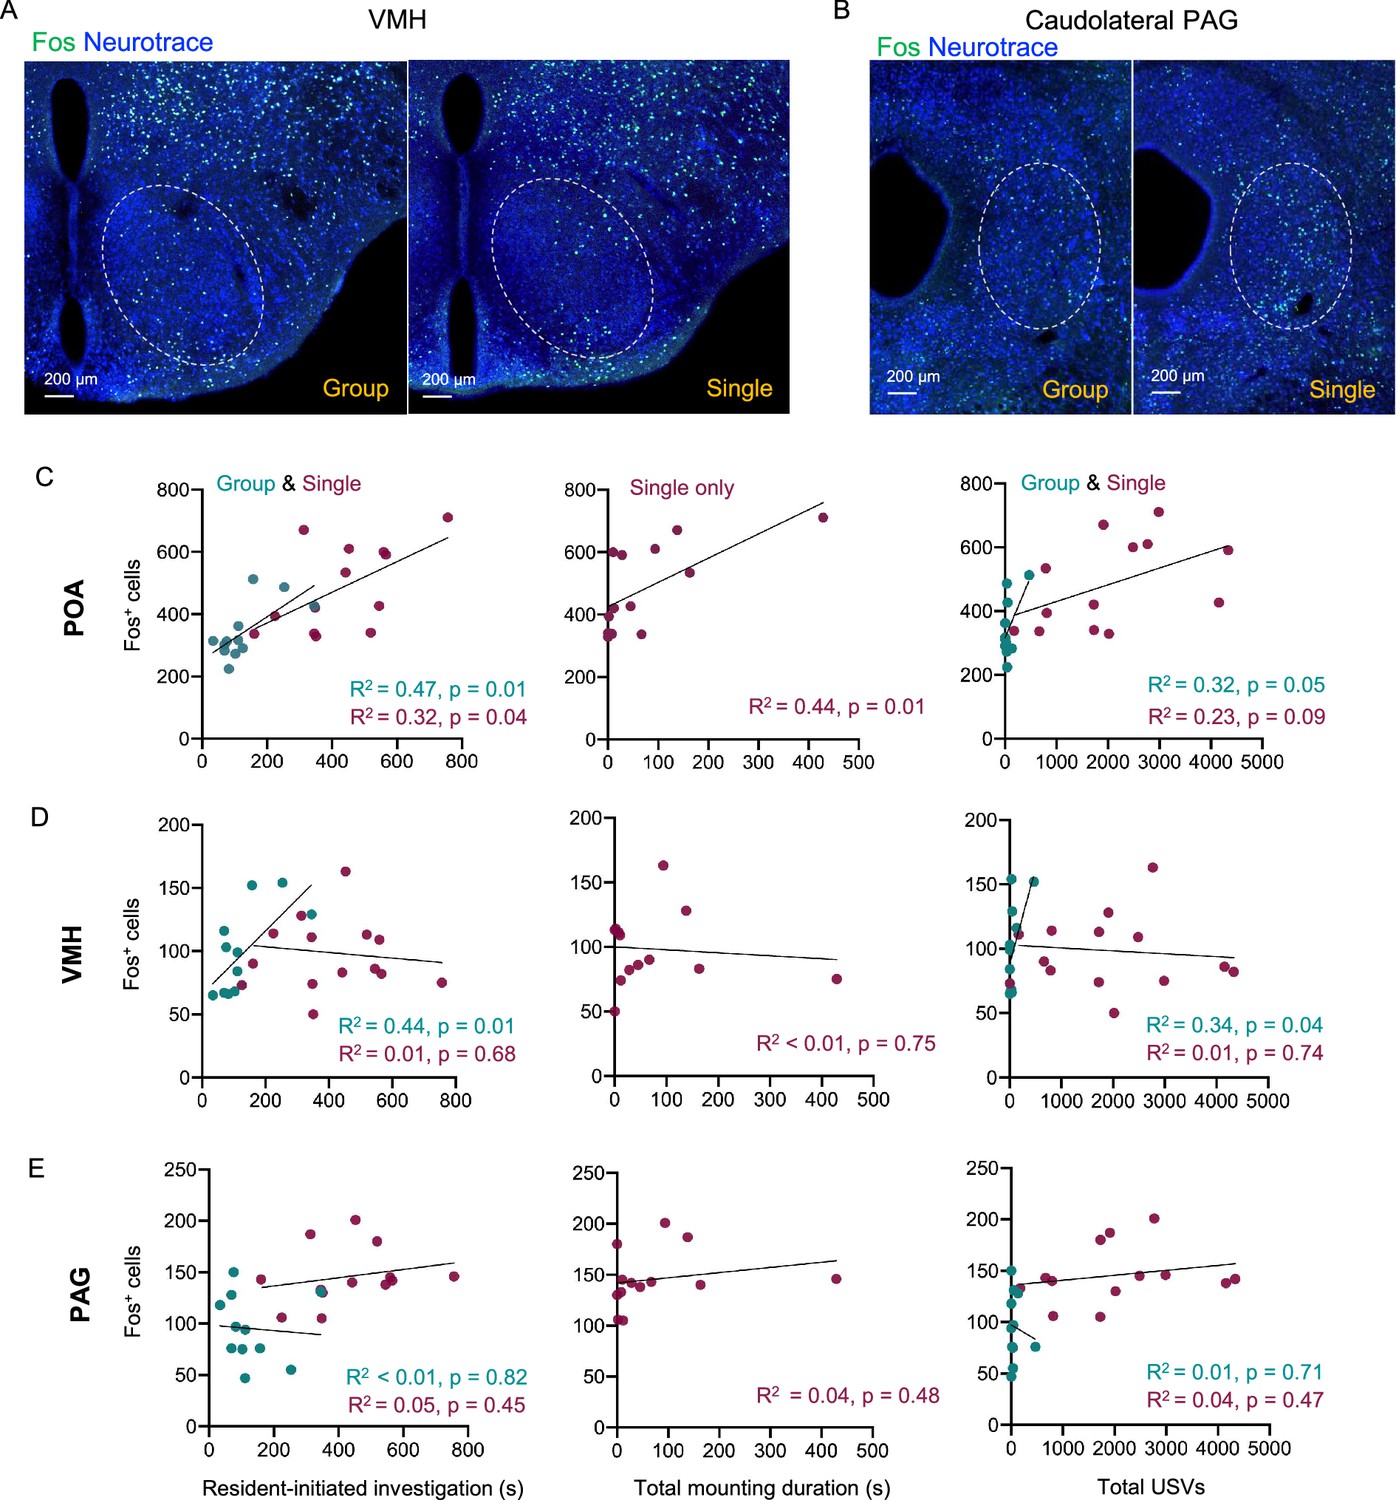
Additional characterization of Fos expression in single-housed vs. group-housed females and comparison to rates of female social behaviors.
(A) Representative confocal images show Fos expression (green) in the VMH of a group-housed female (left) and a single-housed female (right) following same-sex social interactions. Blue, Neurotrace. (B) Same as (A), for the caudolateral PAG. (C) Left, the relationship between total time spent in resident-initiated social investigation and numbers of Fos-positive POA neurons is shown for group-housed (teal) and single-housed (maroon) female residents following interactions with novel females. Middle, same as left, for total resident-initiated mounting time vs. numbers of Fos-positive POA neurons. Data only shown for single-housed residents because group-housed residents did not mount female visitors. Right, same as left, for total USVs vs. numbers of Fos-positive POA neurons. (D) Left, the relationship between total time spent in resident-initiated social investigation and numbers of Fos-positive VMH neurons is shown for group-housed (teal) and single-housed (maroon) female residents following interactions with novel females. Middle, same as left, for total resident-initiated mounting time vs. numbers of Fos-positive VMH neurons. Right, same as left, for total USVs vs. numbers of Fos-positive VMH neurons. (E) Left, the relationship between total time spent in resident-initiated social investigation and numbers of Fos-positive caudolateral PAG neurons is shown for group-housed (teal) and single-housed (maroon) female residents following interactions with novel females. Middle, same as left, for total resident-initiated mounting time vs. numbers of Fos-positive PAG neurons. Right, same as left, for total USVs vs. numbers of Fos-positive PAG neurons.
Figure 2 with 1 supplement
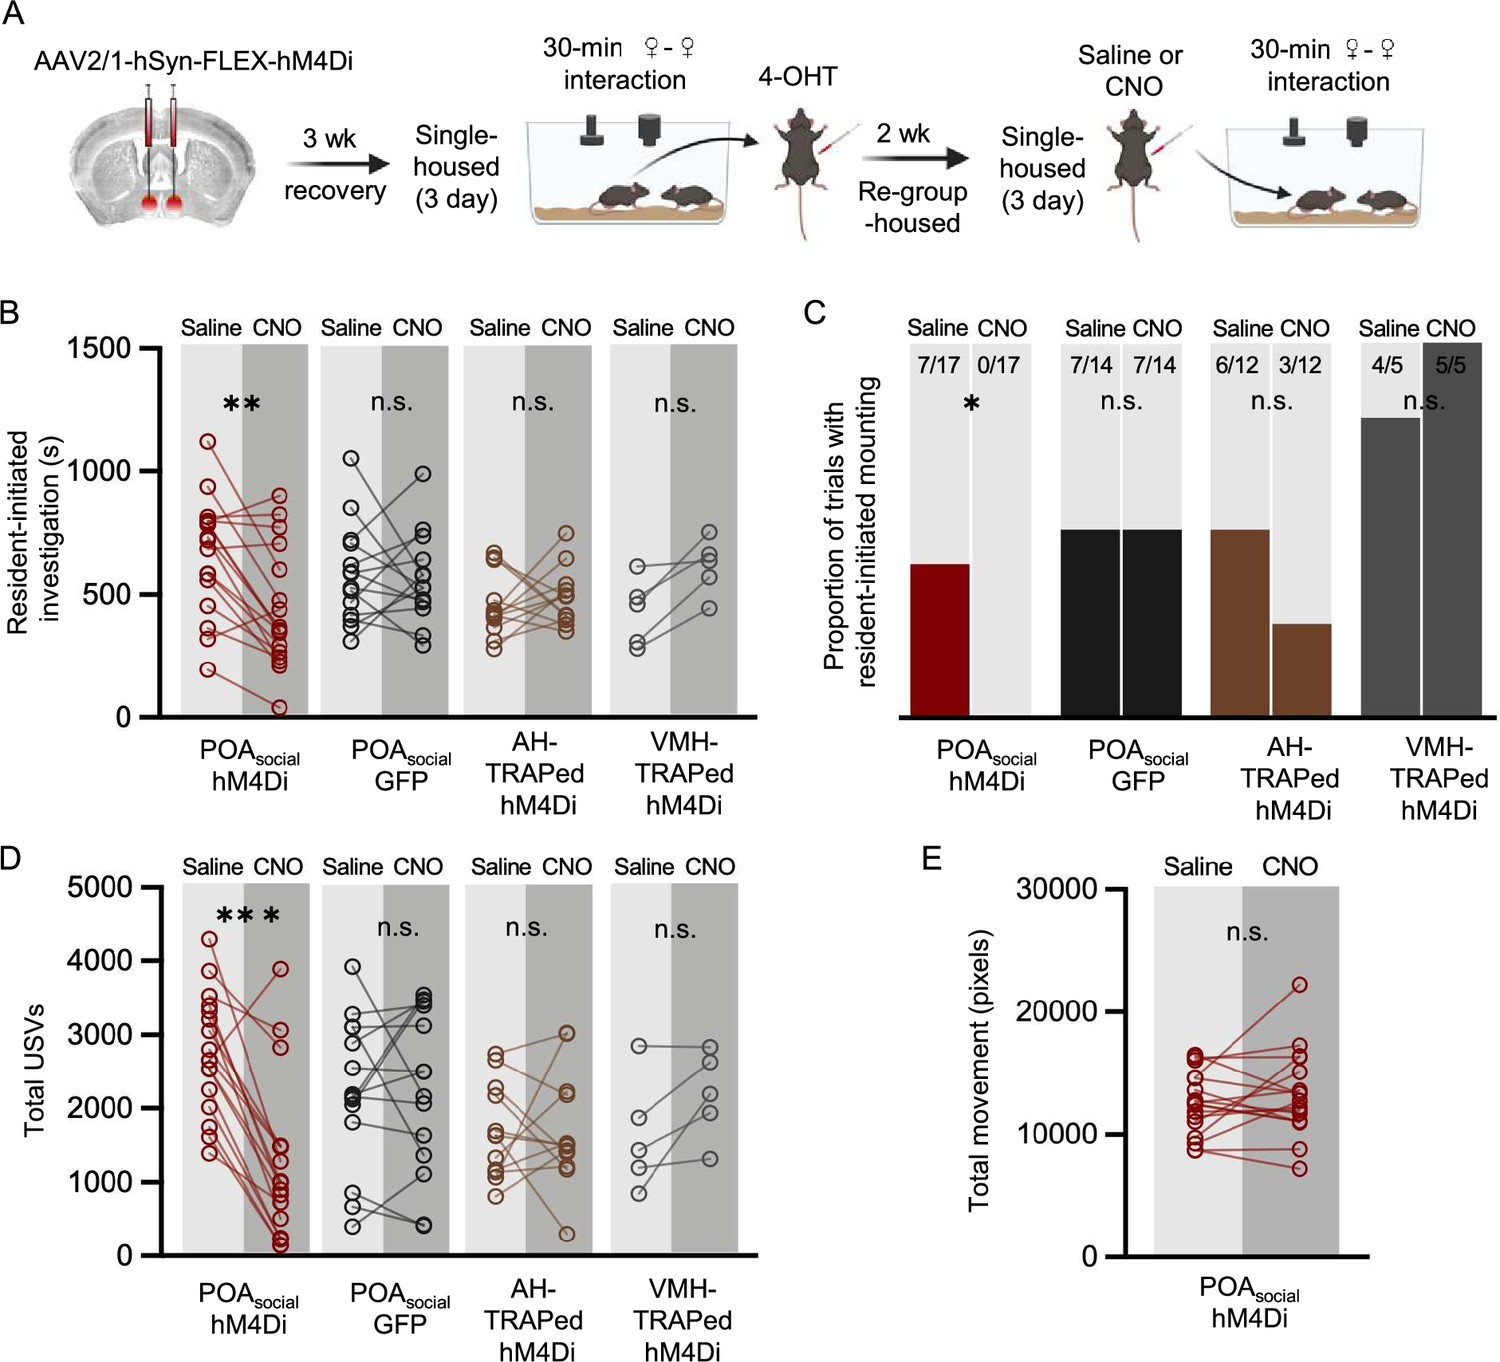
Effects of chemogenetic inhibition of POAsocial neurons on the social behaviors of single-housed female mice.
(A) Experimental timeline and viral strategy to chemogenetically inhibit the activity of POAsocial neurons in single-housed females. (B) Total time spent in resident-initiated social investigation is shown on saline and CNO days for 4 experimental groups: (red symbols) experimental females in which hM4Di is expressed in POAsocial neurons; (black symbols) control females in which GFP is expressed in POAsocial neurons; (brown symbols) control females in which hM4Di is expressed in ‘TRAPed’ AH neurons; (gray symbols) control females in which hM4Di is expressed in ‘TRAPed’ VMH neurons. (C) Same as (B), for proportion of trials with resident-initiated mounting. (D) Same as (B), for total USVs. (E) Total movement is plotted for females with hM4Di expressed in POAsocial neurons, on saline days vs. CNO days.
Figure 2—figure supplement 1

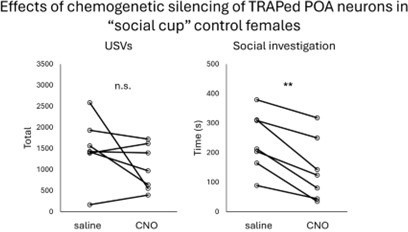
Additional analyses and control experiments related to Figure 2.
(A) Time spent by POAsocial-hM4Di females engaged in social investigation during the TRAPing session is compared to the subsequent change in social investigation in the test sessions (CNO minus saline). (B) Same as (A), for time spent mounting. (C) Same as (A), for total USVs. (D) Experimental timeline and viral strategy to chemogenetically inhibit the activity of POA neurons TRAPed in single-housed females that were not given a social interaction. (E) Total time spent in resident-initiated social investigation is shown on saline and CNO days. (F) Same as (E), for proportion of trials with resident-initiated mounting. (G) Same as (E), for total USVs.
Figure 3 with 1 supplement
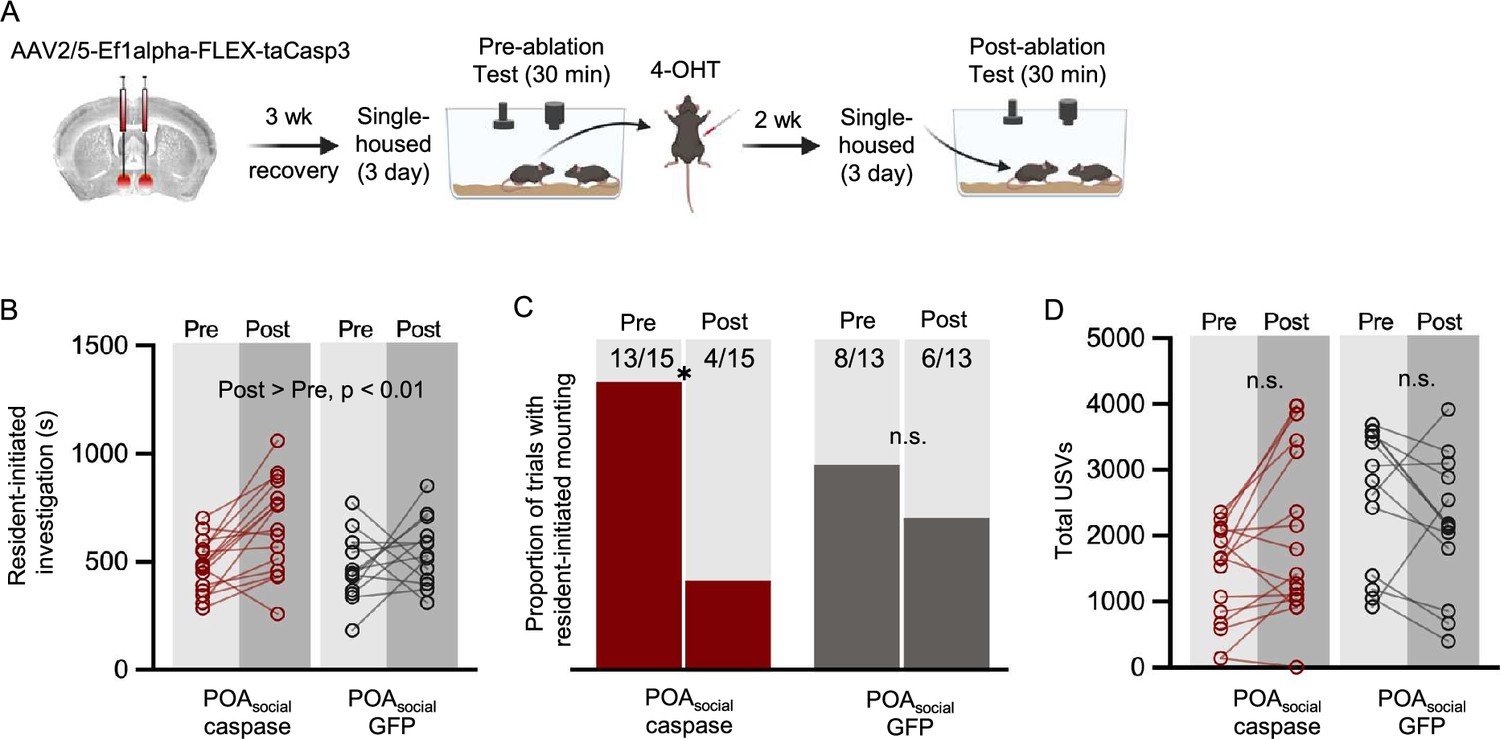
Effects of caspase-mediated ablation of POAsocial neurons on the social behaviors of single-housed female mice.
(A) Experimental timeline and viral strategy for caspase-mediated ablation of POAsocial neurons in single-housed females. (B) Total time spent in resident-initiated social investigation is shown pre- and post-4-OHT treatment for 2 experimental groups: (red symbols) experimental females in which caspase is expressed in POAsocial neurons; (black symbols) control females in which GFP is expressed in POAsocial neurons. (C) Same as (B), for proportion of trials with resident-initiated mounting. (D) Same as (B), for total USVs.
Figure 3—figure supplement 1
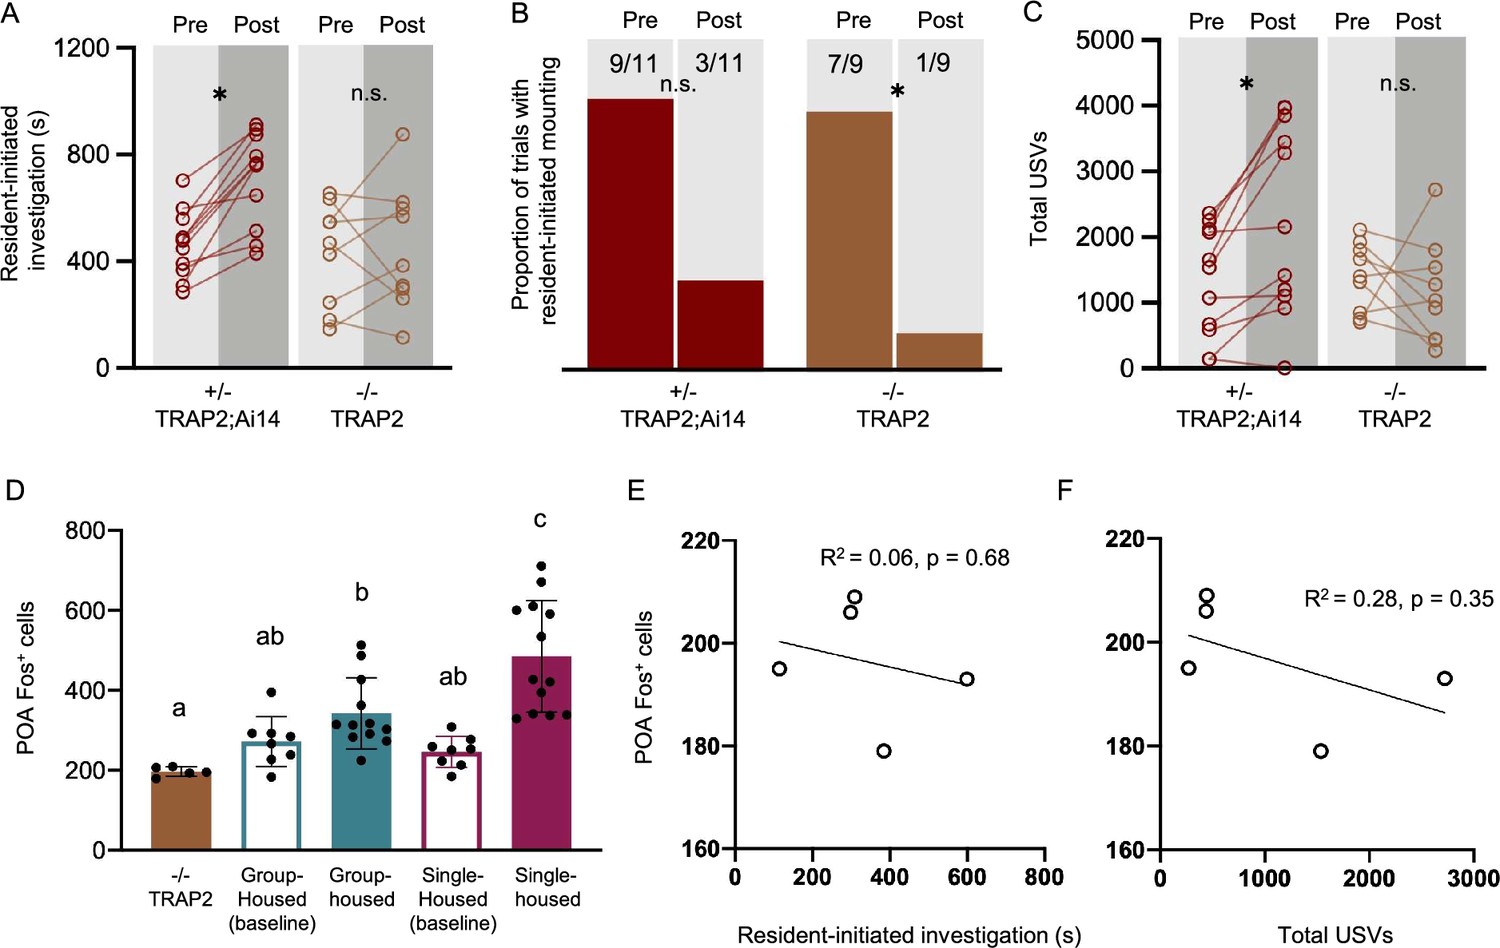
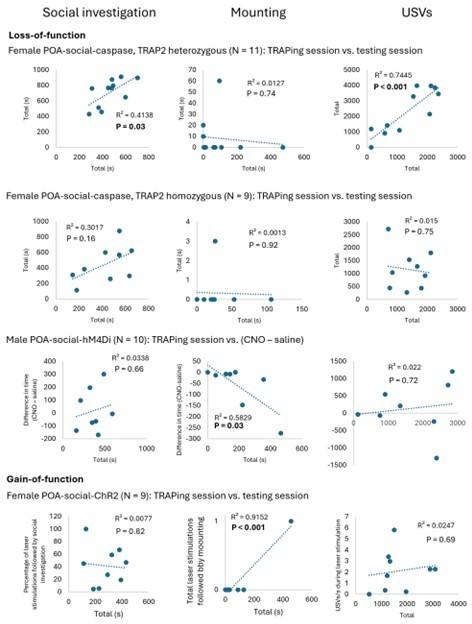
Comparison of effects of ablation of POAsocial neurons in TRAP2 heterozygous vs. homozygous females.
(A) Time spent in resident-initiated investigation is shown pre- vs. post-4-OHT treatment for TRAP2 heterozygous POAsocial-caspase females (TRAP2;Ai14, red symbols, n=11) and TRAP2 homozygous POAsocial-caspase females (orange symbols, n=9). (B) Same as (A), for proportion of trials with resident-initiated mounting. (C) Same as (A), for total USVs. (D) Counts of Fos-positive POA neurons are shown for TRAP2 homozygous POAsocial-caspase females following a same-sex social interaction (orange bar, n=5), control group-housed females with no social interaction (teal open, n=8), control group-housed females following a same-sex social interaction (teal filled, n=12), control single-housed females with no social interaction (maroon open, n=8), and control single-housed females following a same-sex social interaction (maroon filled, n=13). Control female groups are the same as those plotted in Figure 1F. Error bars show standard deviation. (E) The relationship between total time spent in resident-initiated social investigation and numbers of Fos-positive POA neurons is shown for TRAP2 homozygous POAsocial-caspase females. (F) Same as (E), for the relationship between total USVs and Fos-positive POA neurons.
Figure 4
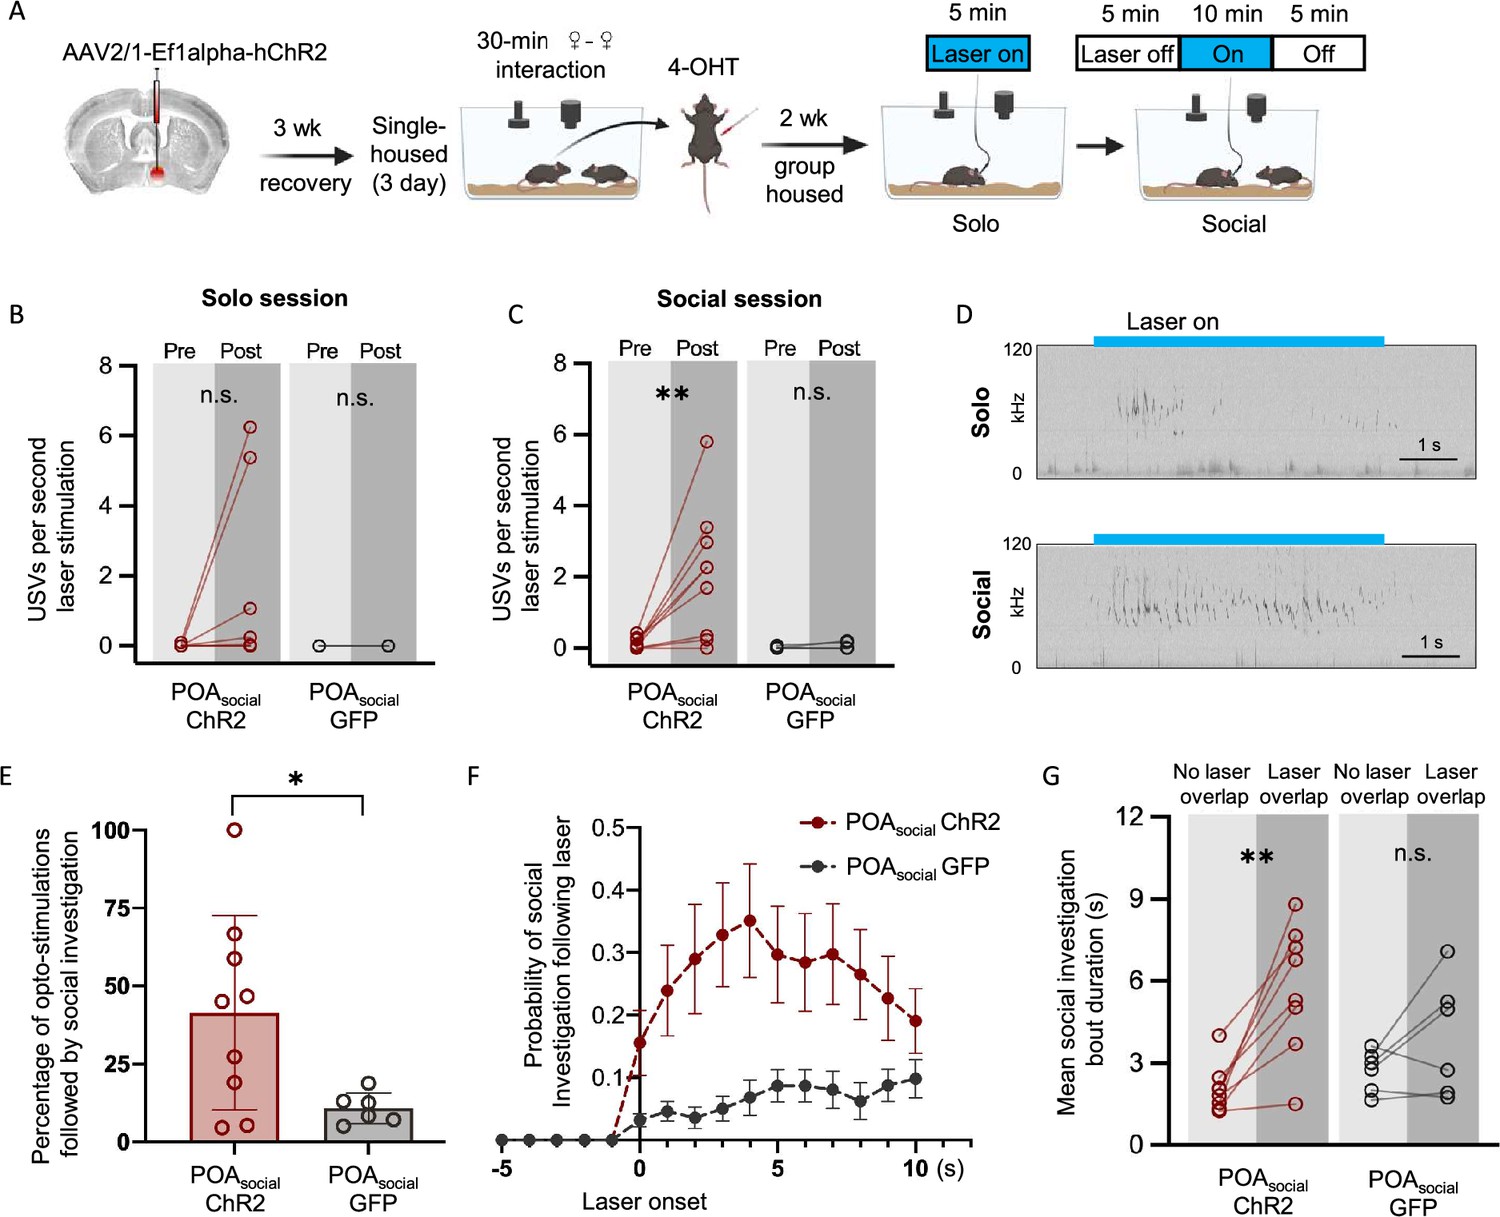
Effects of optogenetic activation of POAsocial neurons on the behaviors of group-housed female mice.
(A) Experimental timeline and viral strategy to optogenetically activate POAsocial neurons in group-housed females. (B) Mean total USVs produced during solo sessions shown for pre-laser periods and during laser stimulation periods for experimental females with ChR2 expressed in POAsocial neurons (red symbols; n=9) and for control females with GFP expressed in POAsocial neurons (black symbols, n=6). (C) Same as (B), for social sessions. (D) Spectrograms are shown from a representative POAsocial-ChR2 female to illustrate USVs that were elicited through optogenetic activation of POAsocial neurons in a solo session (top) and a social session (bottom). Blue bars indicate timing of laser stimulation. (E) Percentage of laser stimulations followed by a bout of social investigation, plotted for POAsocial-ChR2 and POAsocial-GFP females. Error bars show standard deviation. (F) Probability of social investigation aligned with onset of laser stimulation is plotted over time for POAsocial-ChR2 and POAsocial-GFP females. Error bars show standard error. (G) Mean duration of social investigation bouts that overlapped with laser stimulation vs. bouts that did not overlap with laser stimulation is shown for POAsocial-ChR2 and POAsocial-GFP females.
Figure 5
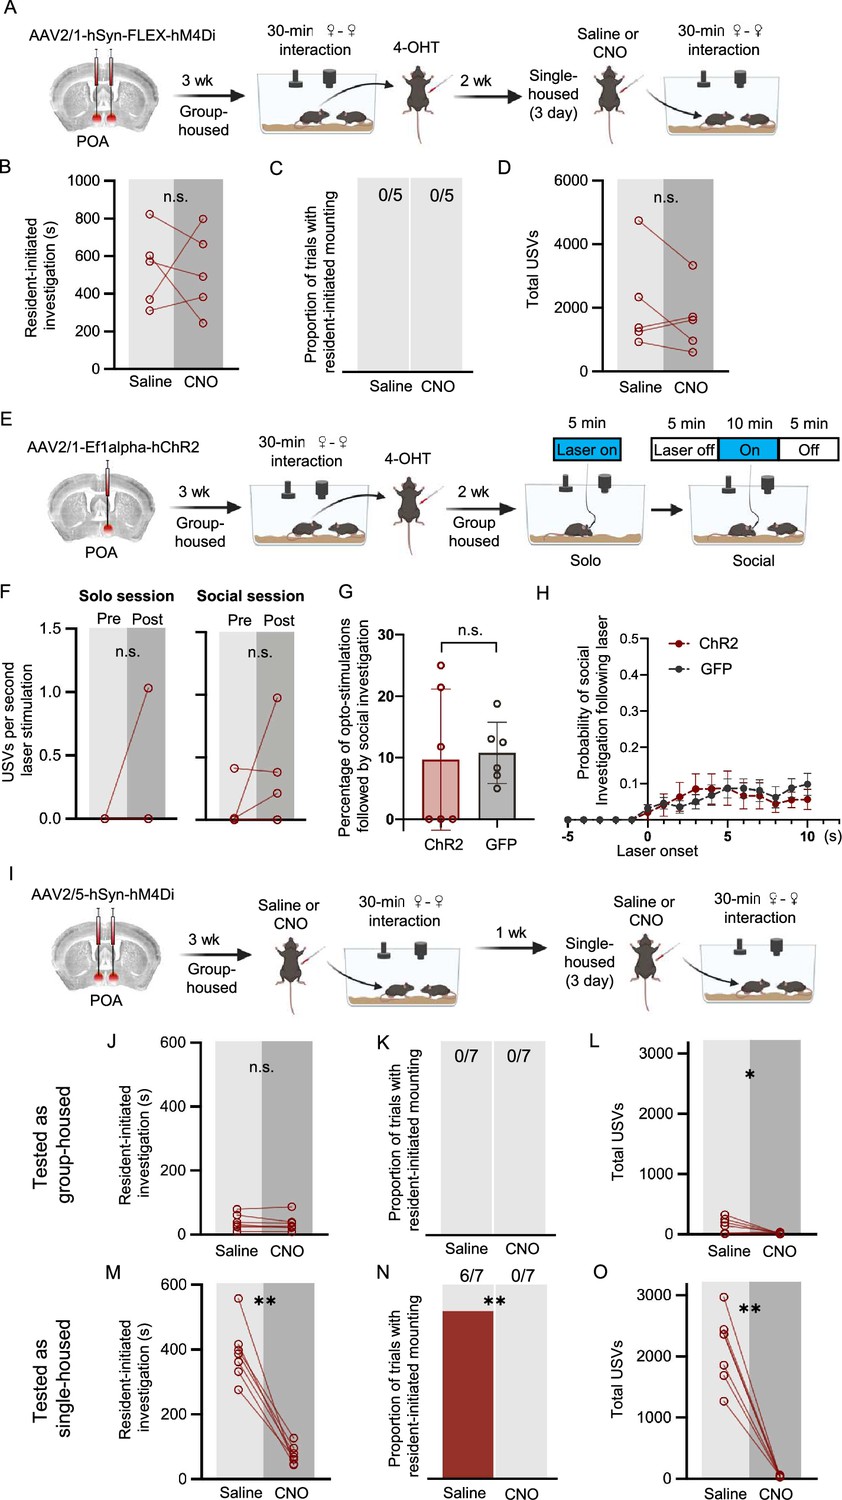
Experiments to test whether POA neurons regulate social behaviors of group-housed females.
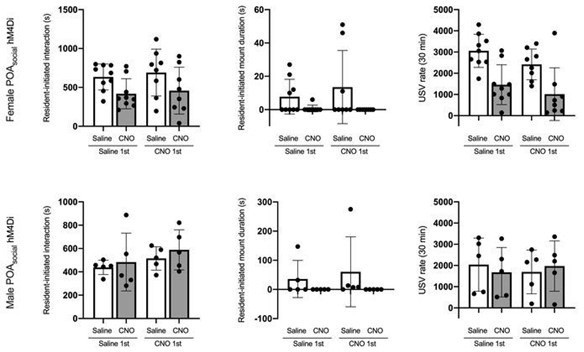
(A) Experimental timeline and viral strategy to chemogenetically inhibit POA neurons that were TRAPed following same-sex social interactions in group-housed females. (B) Total time spent in resident-initiated social investigation is shown on saline and CNO days. (C) Same as (B), for proportion of trials with resident-initiated mounting. (D) Same as (B), for total USVs. (E) Experimental timeline and viral strategy to optogenetically activate POA neurons that were TRAPed following same-sex social interactions in group-housed females. (F) Mean total USVs produced during solo and social sessions shown for pre-laser periods and during laser stimulation periods. (G) Percentage of laser stimulations followed by a bout of social investigation, plotted for GH-TRAPed POA ChR2 females (n=6) and POAsocial-GFP females (n=6; same control group as in Figure 4). Error bars show standard deviation. (H) Probability of social investigation following onset of laser stimulation is plotted over time for GH-TRAPed POA ChR2 and POAsocial-GFP females. Error bars show standard error. (I) Experimental timeline and viral strategy to chemogenetically silence POA neurons in female mice, first while group-housed and a second time following single-housing. (J) Total time spent in resident-initiated social investigation is shown on saline and CNO days for group-housed tests. (K) Same as (J), for proportion of trials with resident-initiated mounting. (L) Same as (J), for total USVs. (M) Total time spent in resident-initiated social investigation is shown on saline and CNO days for single-housed tests. (N) Same as (M), for proportion of trials with resident-initiated mounting. (O) Same as (M), for total USVs.
Figure 6

Characterization of neurotransmitter phenotype and axonal projections of POAsocial neurons.
(A) Representative confocal images of in situ hybridization performed on brain sections containing the POA, showing overlap of expression of Fos (green) and VGAT (magenta). Blue, DAPI. (B) Quantification of proportion of Fos-positive POA neurons that expressed VGAT. (C) Experimental timeline and viral strategy to express GFP in POAsocial neurons. (D) Confocal images showing GFP-labeled axons of POAsocial neurons within the caudolateral PAG. Blue, Neurotrace. (E) Experimental timeline and viral strategy to retrogradely label PAG-projecting POA neurons with tdTomato. (F) Confocal image showing tdTomato labeling in a coronal section containing the POA, and dotted circles in insets indicate examples of double-labeled neurons. Neurotrace, blue. (G) Quantification of proportion of tdTomato-expressing POA neurons that are also Fos-positive. All error bars show standard deviation.
Figure 7 with 1 supplement

Social context-dependent differences in POA Fos expression and effects of chemogenetic inhibition of POAsocial neurons on the social behaviors of single-housed male mice.
(A) Total time spent in resident-initiated social investigation is shown for group-housed male residents (teal) and single-housed male residents (maroon) during interactions with either female visitors (left) or male visitors (right). (B) Same as (A), for proportion of trials with resident-initiated mounting. (C) Same as (A), for total USVs recorded from pairs containing group-housed or single-housed male residents. (D) Total number of Fos-positive POA neurons is shown for group-housed male residents (teal) and single-housed male residents (maroon) following interactions with female visitors (left) or male visitors (right). (E) Experimental timeline and viral strategy to chemogenetically inhibit the activity of POAsocial neurons in single-housed males. (F) Total time spent in resident-initiated social investigation is shown on saline and CNO days for experimental males in which hM4Di is expressed in POAsocial neurons (red symbols, n=10) and control males in which GFP is expressed in POAsocial neurons (black symbols, n=10). (G) Same as (F), for proportion of trials with resident-initiated mounting. (H) Same as (F), for total USVs. All error bars show standard deviation.
Figure 7—figure supplement 1
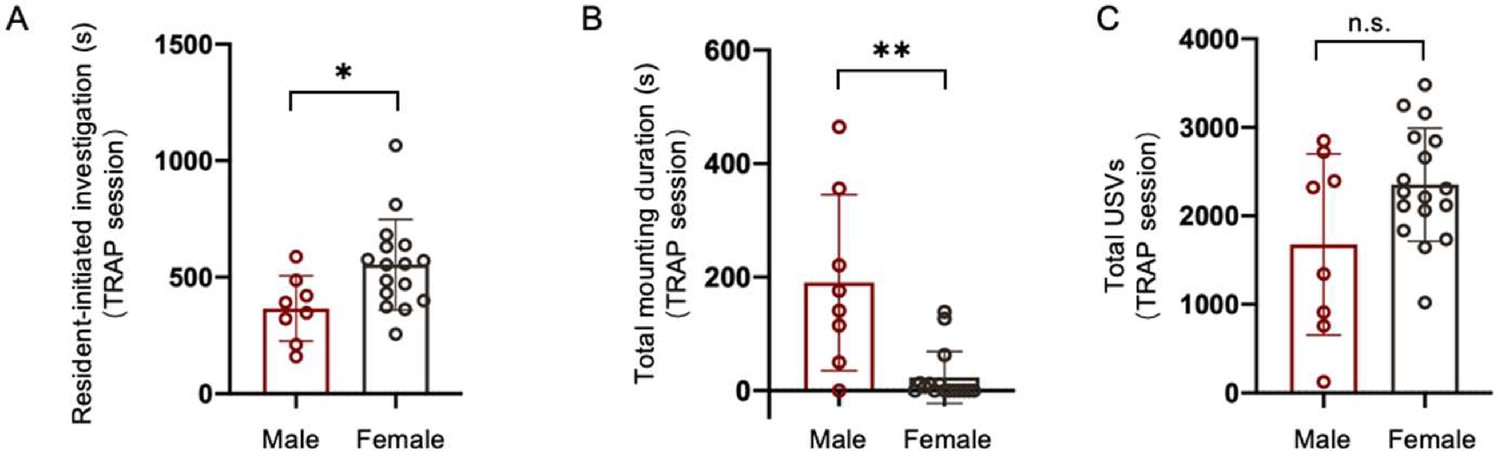
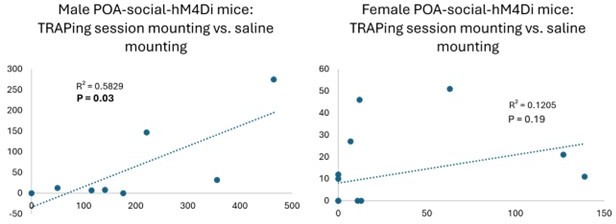
Comparison of social behavior during TRAPing sessions for male vs. female POAsocial-hM4Di mice.
(A) Total time spent in resident-initiated social investigation during 30-min TRAPing session interactions with novel females is shown for male (red, n=9) and female (black, n=16) POAsocial-hM4Di mice. (B) Same as (A), for time spent in resident-initiated mounting. (C) Same as (A), for total USVs. Please note that n=2 POAsocial-hM4Di males and n=1 POAsocial-hM4Di female were excluded because their TRAPing session videos were not saved due to experimenter error. All error bars show standard deviation.
Author response image 1
Author response image 2
Author response image 3
Author response image 4
Author response image 5

Author response image 6
Tables
Key resources table
| Reagent type (species) or resource | Designation | Source or reference | Identifiers | Additional information |
|---|---|---|---|---|
| Transfected construct (Mus musculus) | TRAP2 Fostm2.1(icre/ERT2)Luo/J | Jackson Laboratories | RRID:IMSR_JAX:030323 | |
| Transfected construct (M. musculus) | Ai14 B6.CgGt(ROSA)26Sortm14(CAG-tdTomato)Hze/J | Jackson Laboratories | RRID:IMSR_JAX:007914 | |
| Transfected construct (M. musculus) | C57BL/6 J | Jackson Laboratories | RRID:IMSR_JAX:000664 | |
| Antibody | c-Fos (9F6) Rabbit mAb (rabbit monoclonal) | Cell Signaling Technology | RRID:AB_2247211 CAT#:2250S | 1:1000 |
| Antibody | Alexa Fluor 488 goat-anti-rabbit (goat polyclonal) | Invitrogen | RRID:AB_143165 CAT#:A-11008 | 1:1000 |
| Recombinant DNA reagent | AAV2/1-hSyn-FLEX-hM4Di-mCherry | Addgene | RRID:Addgene_44262 | |
| Recombinant DNA reagent | AAV2/1-Ef1alpha-hChR2(h134R)-EYFP-WPRE-HGHpA | Addgene | RRID:Addgene_20298 | |
| Recombinant DNA reagent | AAVrg-pgk-Cre | Addgene | RRID:Addgene_24593 | |
| Recombinant DNA reagent | pAAV2/5-flex-taCasp3-TEVp | Addgene | RRID:Addgene_45580 | |
| Recombinant DNA reagent | pAAV2/5-hSyn-hM4Di-mCherry | Addgene | RRID:Addgene_50475 | |
| Recombinant DNA reagent | AAV2/1-pCAG-FLEX-EGFP-WPRE | Addgene | RRID:Addgene_51502 | |
| Commercial assay or kit | HCR v3.0 | Molecular Instruments | ||
| Chemical compound, drug | Clozapine N-oxide dihydrochloride | Hello Bio | CAT#:HB6149 | |
| Chemical compound, drug | 4-Hydroxytamoxifen | Hello Bio | CAT#:HB6040 | |
| Software, algorithm | MATLAB | Mathworks | RRID:SCR_001622 | |
| Software, algorithm | Zen | Zeiss | RRID:SCR_013672 | |
| Software, algorithm | Spike2 | CED | RRID:SCR_000903 | http://ced.co.uk |
| Software, algorithm | ImageJ | NIH | RRID:SCR_003070 | https://imagej.net/ij/ |
| Software, algorithm | Behavioral Observation Research Interactive Software (v. 8.13) | Open Behavior | RRID:SCR_021509 | https://github.com/olivierfriard/BORIS |
| Software, algorithm | R Project for Statistical Computing | R Core Team | RRID:SCR_001905 | http://www.r-project.org/ |
| Software, algorithm | R Studio | Posit | RRID:SCR_000432 | https://posit.co/ |
| Other | Neurotrace 435/455 Blue | Thermo Fischer Scientific | CAT#:N21479 | 1:500 |
Additional files
-
MDAR checklist
- https://cdn.elifesciences.org/articles/94924/elife-94924-mdarchecklist1-v1.docx
-
Supplementary file 1
Details of statistical analyses.
- https://cdn.elifesciences.org/articles/94924/elife-94924-supp1-v1.docx
Download links
A two-part list of links to download the article, or parts of the article, in various formats.
Downloads (link to download the article as PDF)
Open citations (links to open the citations from this article in various online reference manager services)
Cite this article (links to download the citations from this article in formats compatible with various reference manager tools)
Short-term social isolation acts on hypothalamic neurons to promote social behavior in a sex- and context-dependent manner
eLife 13:RP94924.
https://doi.org/10.7554/eLife.94924.3


