A ‘double-edged’ role for type-5 metabotropic glutamate receptors in pain disclosed by light-sensitive drugs
- Mediterranean Neurological Institute, IRCCS Neuromed, Italy
- Department of Pharmacology and Neuroscience, Texas Tech University Health Sciences Center, United States
- MCS - Medicinal Chemistry & Synthesis, Institute for Advanced Chemistry of Catalonia, Spain
- Department of Experimental Medicine, Division of Pharmacology, University of Campania “Luigi Vanvitelli”, Italy
- Institute of Functional Genomics IGF, National Centre for Scientific Research CNRS, INSERM, University of Montpellier, France
- Department of Physiology and Pharmacology, Sapienza University of Rome, Italy
- Center of Excellence for Translational Neuroscience and Therapeutics, Texas Tech University Health Sciences Center, United States
- Garrison Institute on Aging, Texas Tech University Health Sciences Center, United States
Figures
Figure 1 with 1 supplement
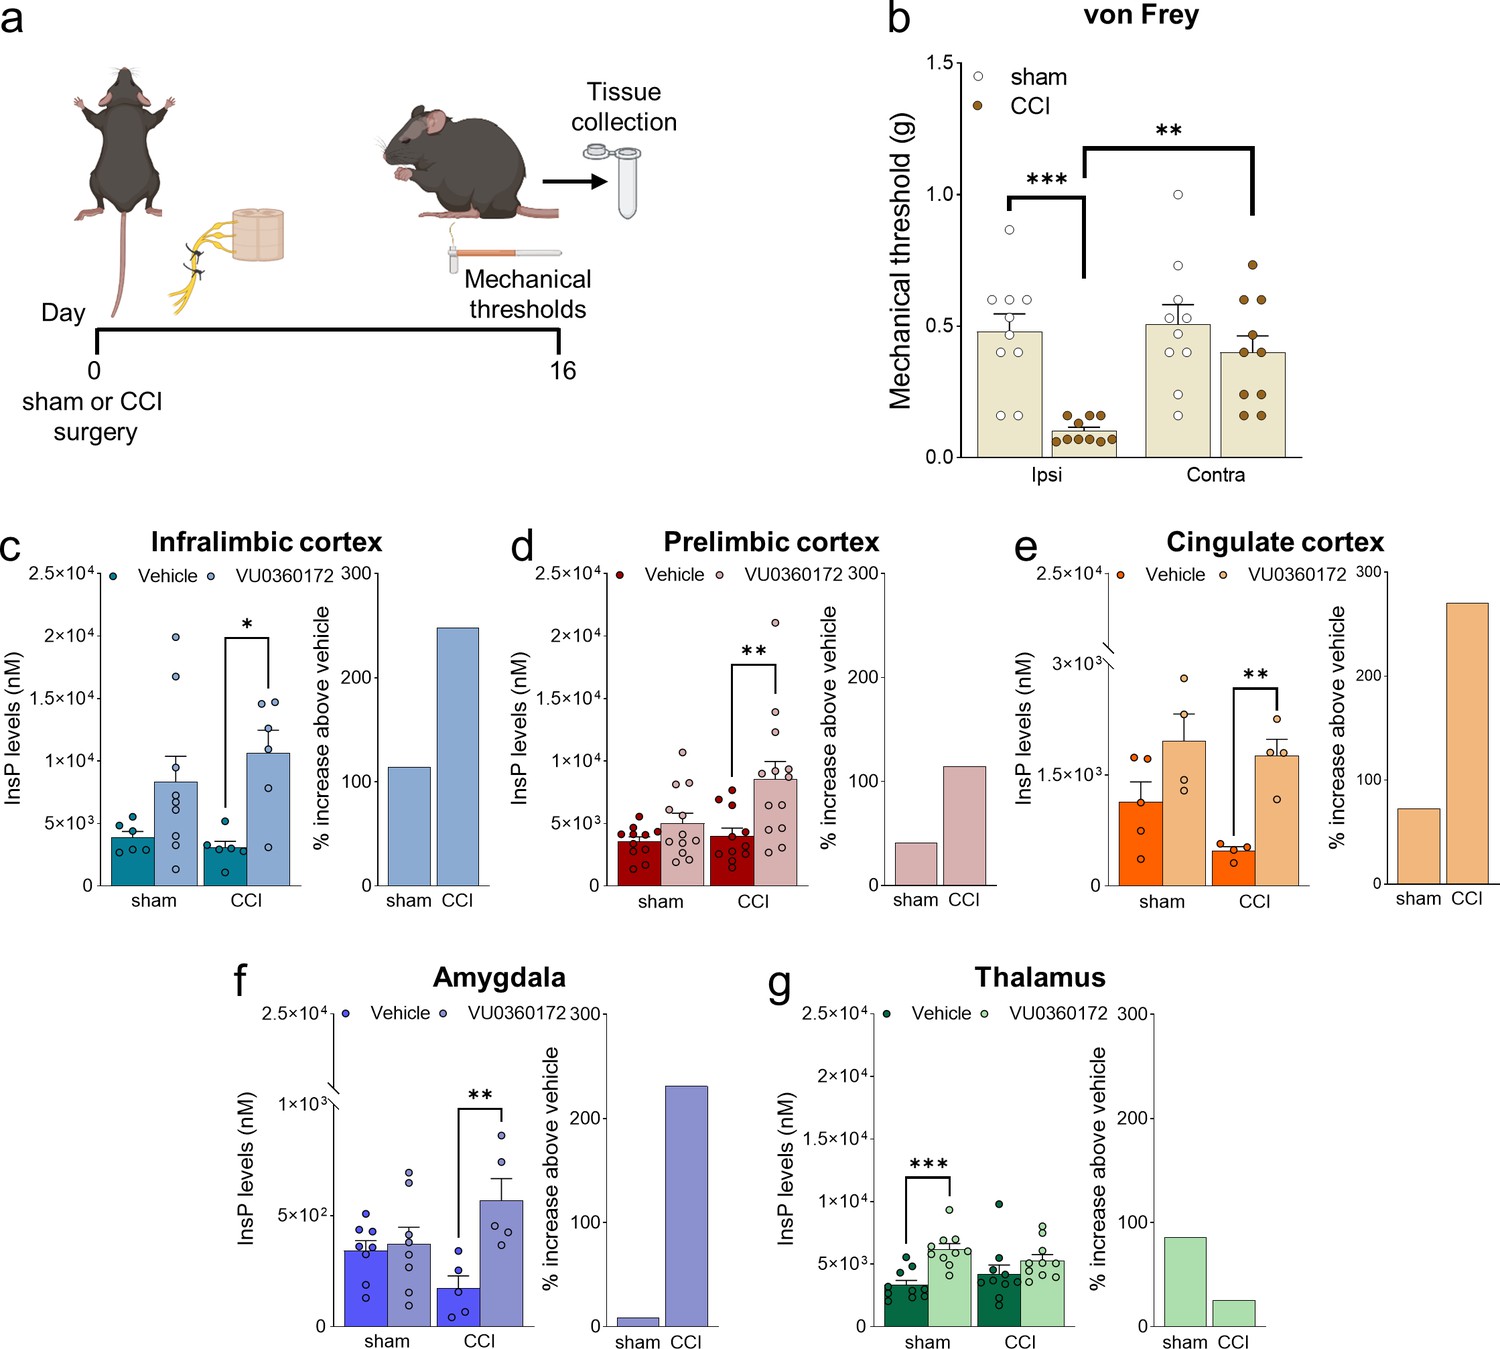
Neuropathic pain model and mGlu5 receptor signaling in different brain regions.
(a) Experimental protocol. (b) Mechanical (hyper-)sensitivity on the left hind paw measured with von Frey filaments was reduced in chronic constriction injury (CCI) mice (n=10) versus sham-operated mice (n=10) 16 days after nerve ligation. Bar histograms show means ± SEM. (c–g) mGlu5 receptor-mediated polyphosphoinositide (PI) hydrolysis in different brain regions of sham and CCI mice. Increased InsP levels were observed in infralimbic (c), prelimbic (p=0.051) (d), and cingulate (e) cortices and amygdala (f), but not thalamus (g), of neuropathic mice (CCI) after stimulation with a positive allosteric modulator (PAM, VU0360172, 30 mg/kg i.p.) compared to vehicle. Enhanced InsP concentration was detected in the thalamus, but not in the prefrontal cortical regions and amygdala, of sham animals treated with VU0360172 compared to vehicle. Bar histograms on the right in c-g show a percent increase above vehicle in sham and CCI mice. Bar histograms show means ± SEM of 10 (b), 6–9 (c), 11-13(d), 4–5 (e), 5–8 (f), 10 (g) mice per group. Two-way ANOVA: (b) sham vs CCI, F (1,36)=16.04; p=0.0003; ipsi vs contra, F (1,36)=7.304; p=0.0104; interaction F (1,36)=5.062, p=0.0307; (c) sham vs CCI, F (1,23)=0.1952; p=0.6627; vehicle vs VU0360172, F (1,23)=12.78, p=0.0016; interaction F (1,23)=0.8758, p=0.3591; (d) sham vs CCI, F (1,43)=4.421; p=0.0414; vehicle vs VU0360172, F (1,43)=10.15, p=0.0027; interaction, F (1,43)=2.685, p=0.1086; (e) sham vs CCI, F (1,13)=2.833; p=11.62; vehicle vs VU0360172, F (1,13)=16.67, p=0.0013; interaction F (1,13)=0.7931, p=0.3893; (f) sham vs CCI, F (1,22)=0.03868, p=0.8459; vehicle vs VU0360172, F (1,22)=9.039, p=0.00065; interaction F (1,22)=6.679, p=0.0169; (g) sham vs CCI, F (1,36)=1.153e-005, pP=0.9973; vehicle vs VU0360172, F (1,36)=14.76, p=0.0005; interaction F (1,36)=3.062, p=0.0887. *p<0.05, **p<0.01; ***p<0.001, Bonferroni’s multiple comparison post hoc test. Source files are available in the Figure 1—source data 1.
-
Figure 1—source data 1
Neuropathic pain model and mGlu5 receptor signaling in different brain regions.
- https://cdn.elifesciences.org/articles/94931/elife-94931-fig1-data1-v1.zip
Figure 1—figure supplement 1
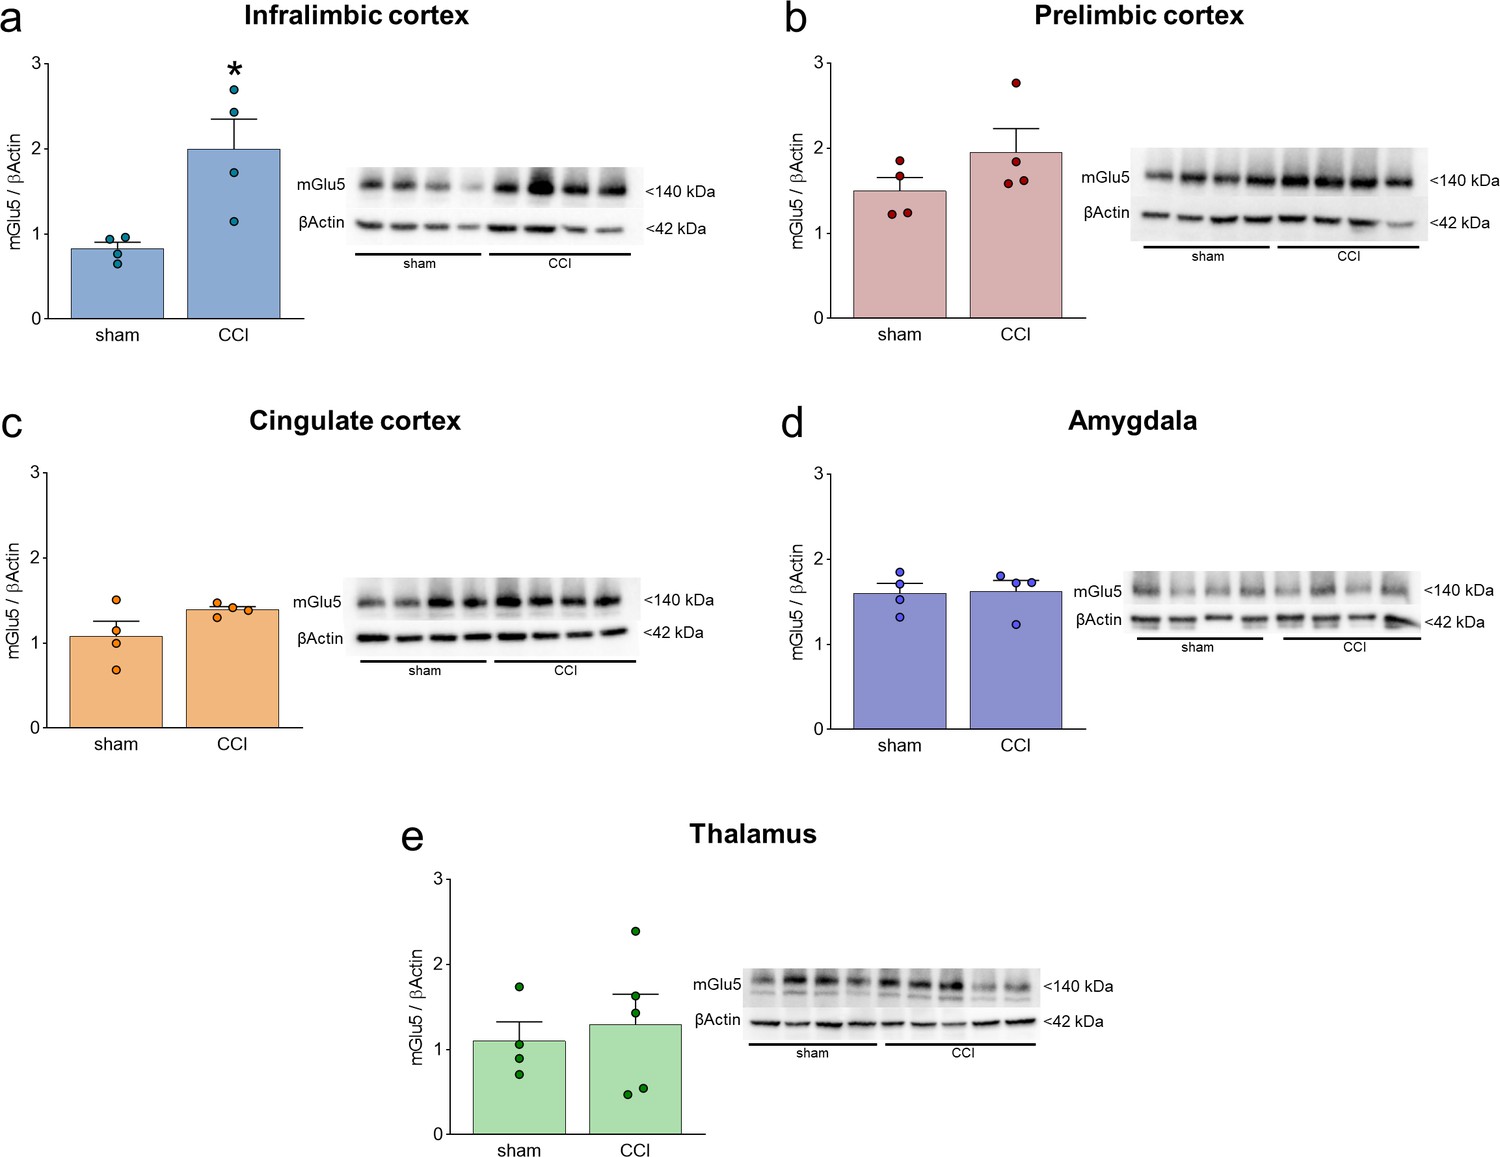
mGlu5 receptor protein levels in different brain regions in sham and chronic constriction injury (CCI) mice.
(a–e) mGlu5 receptor protein levels in the contralateral (to the side of injury) infralimbic cortex (a), prelimbic cortex (b), anterior cingulate cortex (c), amygdala (d), and thalamus (e). Significant changes were found only in the infralimbic cortex where chronic constriction injury (CCI) caused an increase in mGlu5 receptor protein levels compared to sham mice. Bar histograms show mean + SEM of 4–5 mice per group. *p<0.05, unpaired student’s t-test compared to sham. (a) t=3265,, p=0.0171; (b) t=1.425, p=0.02041; (c) t=1.764, p=0.01281; (d) t=0.1172, p=0.9105; (e) t=0.4257, p=0.06831. Source files are available in the Figure 1—figure supplement 1—source data 1.
-
Figure 1—figure supplement 1—source data 1
mGlu5 receptor protein levels in different brain regions in sham and CCI mice.
- https://cdn.elifesciences.org/articles/94931/elife-94931-fig1-figsupp1-data1-v1.zip
Figure 2 with 3 supplements
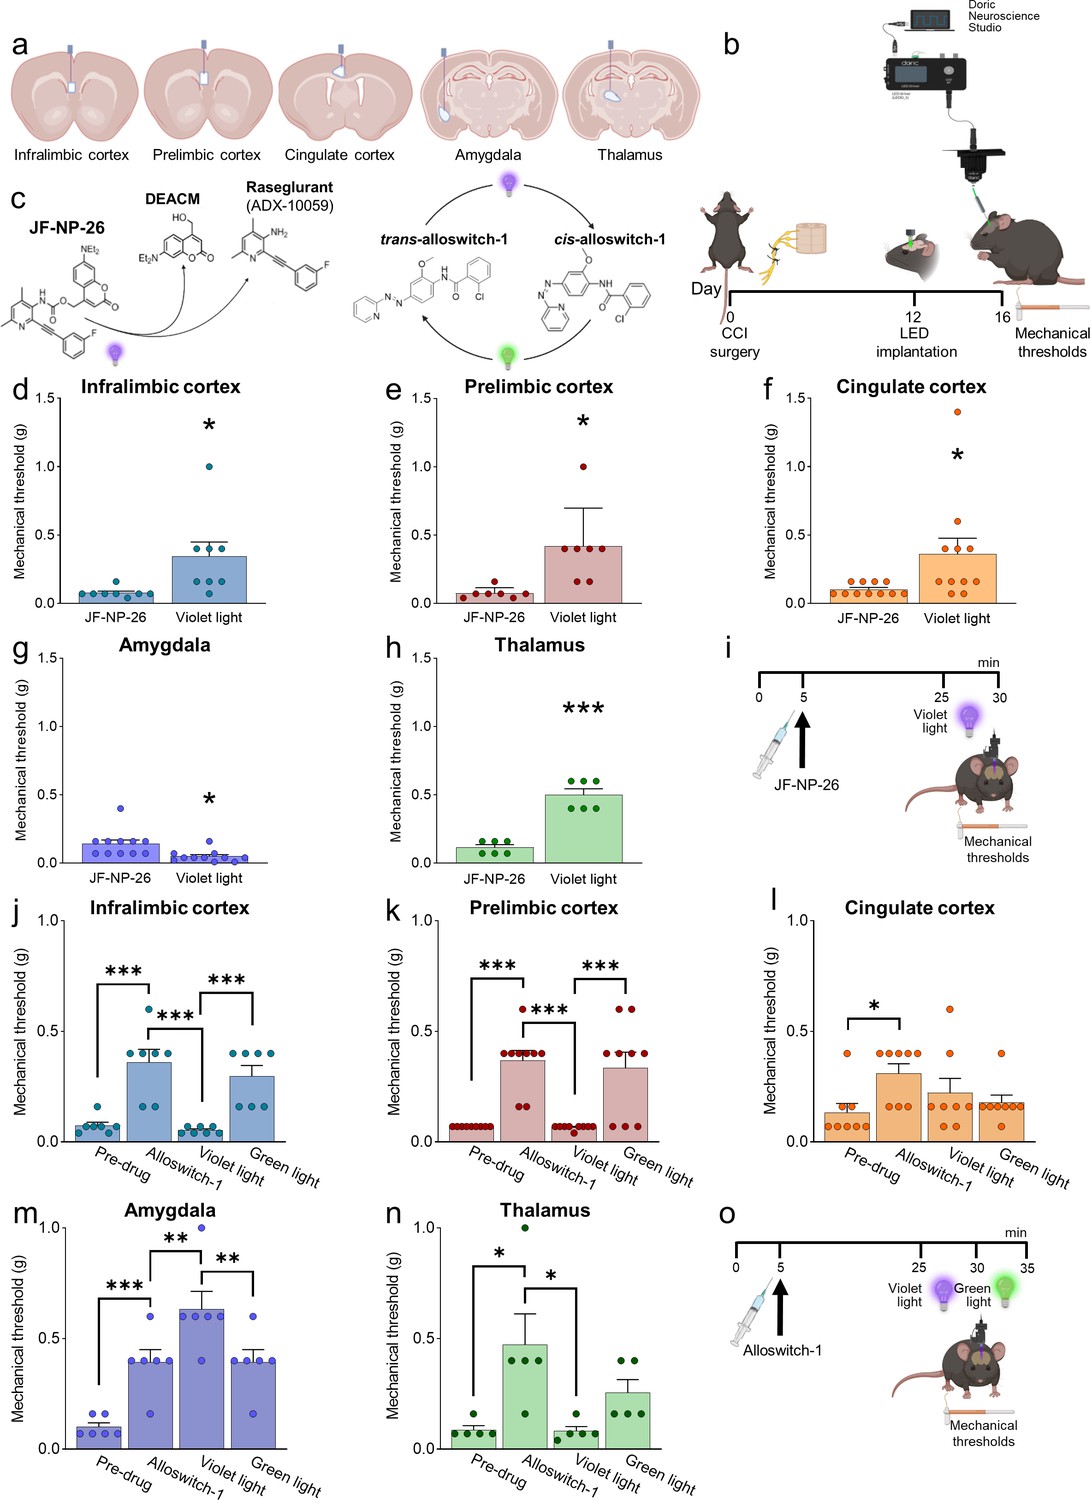
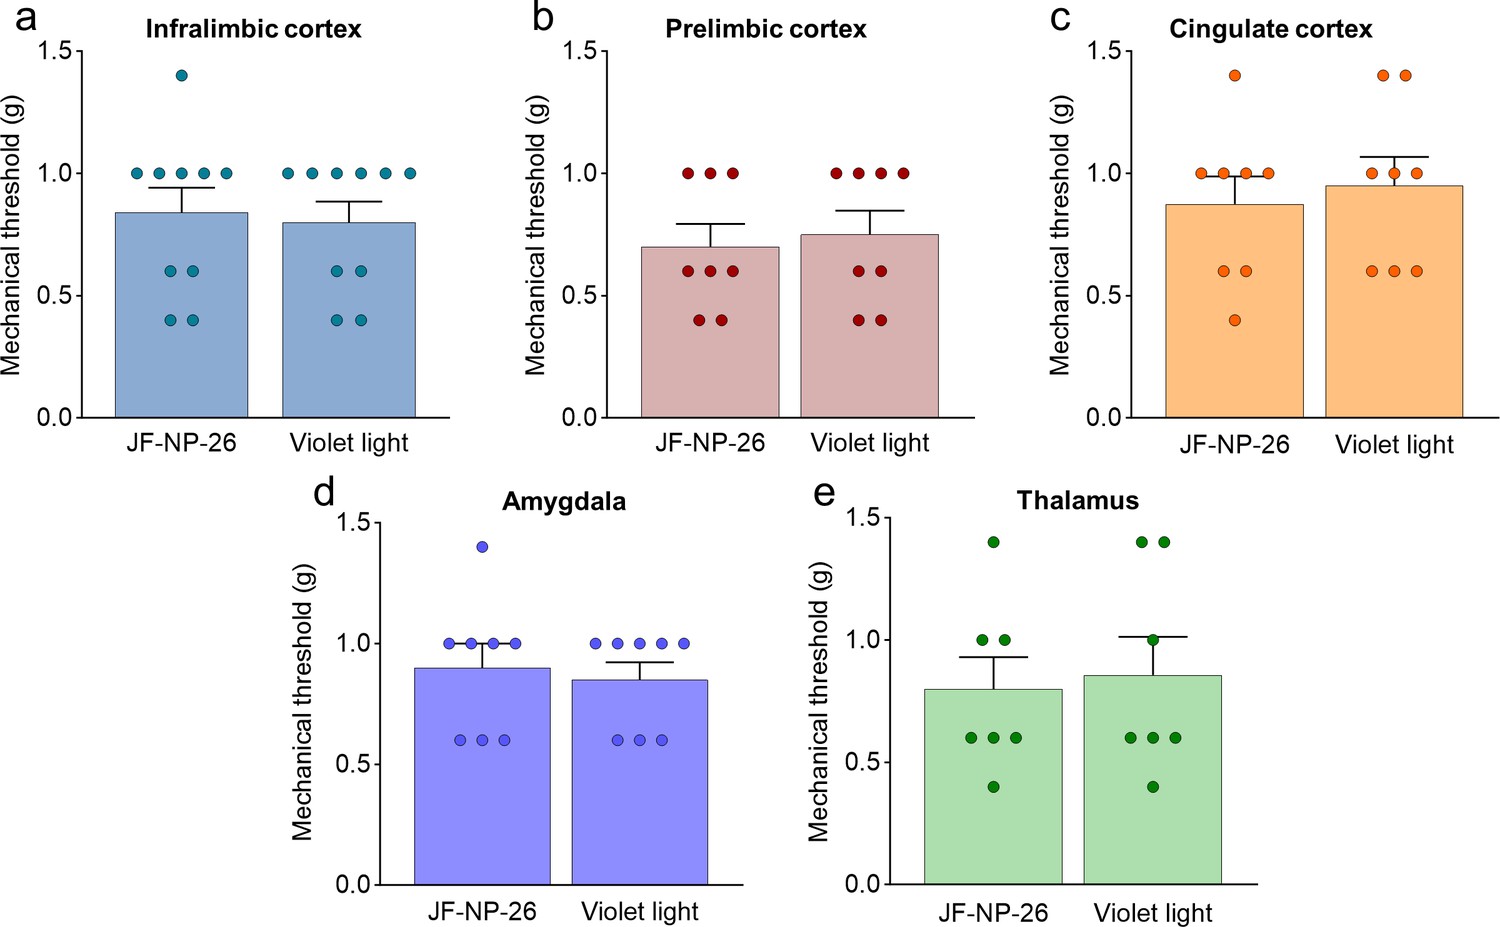
Behavioral effects of light-induced manipulations of mGlu5 receptors in different brain regions in chronic constriction injury (CCI) mice.
Schematic representation of sites of stereotaxic implantation of LED optical fibers in different brain regions. (b) Experimental protocol for optical modulation. (c) Optical activation (blue-violet light, 405 nm) of mGlu5 NAM JF-NP-26 and optical inactivation (blue-violet light, 405 nm) and reactivation (green light, 520 nm) of mGlu5 NAM alloswitch-1. (d-i) Optical activation (blue-violet light, 405 nm) of mGlu5 NAM JF-NP-26 (10 mg/kg, i.p.) in contralateral (to the side of CCI) infralimbic cortex (d), prelimbic cortex (e), anterior cingulate cortex (f), and thalamus (g) caused a significant increase in mechanical thresholds, whereas JF-NP-26 activation in the amygdala (h) caused hyperalgesia, in neuropathic mice 16 days after CCI induction (i). (j–o) Systemic application of mGlu5 NAM alloswitch-1 (10 mg/kg, i.p.) caused antinociception in CCI mice, compared to vehicle. Optical inactivation (blue-violet light, 405 nm) of alloswitch-1 in the contralateral (to the side of CCI) infralimbic cortex (j), prelimbic cortex (k), or thalamus (n) reversed the antinociceptive effects, while light-induced (green light, 520 nm) reactivation of alloswitch-1 in those brain regions reinstated analgesia. No significant behavioral changes were observed with optical manipulations in the anterior cingulate cortex (l). In contrast, optical inactivation of alloswitch-1 in the amygdala with blue-violet light further increased mechanical thresholds (enhancement of antinociception), and this effect was reversed by reactivation of alloswitch-1 with green light (m). Bar histograms show mean ± SEM of 8 (d), 7 (e), 11 (f and g), 6 (h), 7 (j), 9 (k), 8 (l), 6 (m), and 5 (n) mice per group. (d-h) *p<0.05, ***p<0.001, paired student’s t-test compared to JF-NP-26 without light activation. (d) t=2.487, p=0.0418; (e) t=3.243, p=0.0176; (f) t=2.390, p=0.0379; (g) t=3.025, p=0.0128; (h) t=9.062, p=0.0003. (j–n) One-way repeated measures ANOVA; (j) F (3,18)=19.25, p<0.0001; (k) F (3,24)=20.12, p<0.0001; (l) F (3,21)=3.813, p=0.0251; (m) F (3,15)=24.66, p<0.0001; (n) F (3,12)=5.463, p=0.0133. *p<0.05, **p<0.01, ***p<0.001, Bonferroni’s multiple comparisons post hoc tests. Source files are available in the Figure 2—source data 1.
-
Figure 2—source data 1
Behavioral effects of light-induced manipulations of mGlu5 receptors in different brain regions in CCI mice.
- https://cdn.elifesciences.org/articles/94931/elife-94931-fig2-data1-v1.zip
Figure 2—figure supplement 1
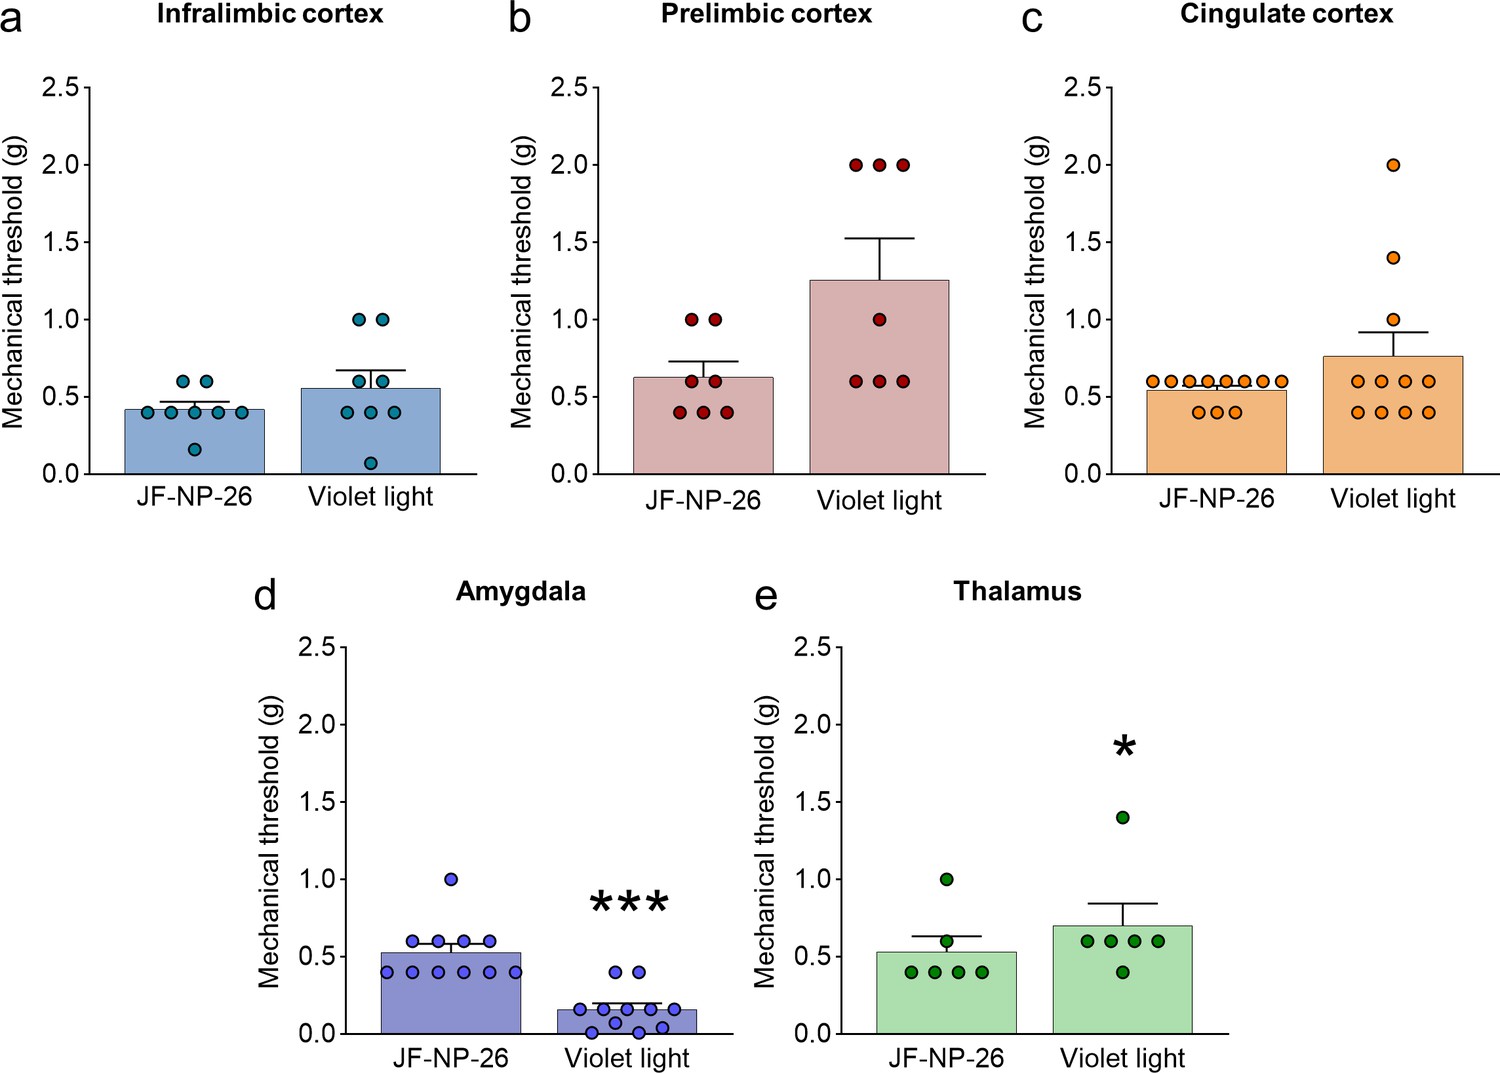
Effects of light-induced blockade of mGlu5 receptors in different brain regions on mechanical pain thresholds in the unlesioned paw of chronic constriction injury (CCI) mice.
Mechanical thresholds were measured in the right paw (contralateral to the injury) of CCI mice before and after light-induced activation of systemic JF-NP-26 (10 mg/kg, i.p.) in the contralateral (to the side of injury) infralimbic cortex (a), prelimbic cortex (b), anterior cingulate cortex (c), amygdala (d), and thalamus (e). Blue-violet light activation of JF-NP-26 in prefrontal cortical regions had no effect on mechanical thresholds on the uninjured paw, but blue-violet light illumination in the thalamus was slightly antinociceptive and in the amygdala caused hypersensitivity. Bar histograms show mean + SEM of 8 (a), 7 (b), 11 (c), 11 (d), and 6 (e) mice per group. *p<0.05, ***p<0.001 unpaired student’s t-test compared to JF-NP-26. (a) t=1.370, p=0.2129; (b) t=2.238, p=0.0666; (c) t=1.491, p=0.1669; (d) t=5.746, p=0.0002; (e) t=2.712, p=0.0422. Source files available in the Figure 2—figure supplement 1—source data 1.
-
Figure 2—figure supplement 1—source data 1
Effects of light-induced blockade of mGlu5 receptors in different brain regions on mechanical pain thresholds in the unlesioned paw of CCI mice.
- https://cdn.elifesciences.org/articles/94931/elife-94931-fig2-figsupp1-data1-v1.zip
Figure 2—figure supplement 2
Effects of light-induced blockade of mGlu5 receptors in different brain regions on mechanical pain thresholds in the left paw of sham mice.
Mechanical thresholds were measured in the left paw of sham mice before and after light-induced activation of systemic JF-NP-26 (10 mg/kg, i.p.) in the contralateral infralimbic cortex (a), prelimbic cortex (b), anterior cingulate cortex (c), amygdala (d), and thalamus (e). Bar histograms show mean + SEM of 10 (a–e) mice per group. (a) t=0.3015, p=0.7665; (b) t=0.3705, p=0.7166; (c) t=0.4590, p=0.6533; (d) t=0.4035, p=0.6927; (e) t=0.2810, p=0.7835. Source files available in the Figure 2—figure supplement 2—source data 1.
-
Figure 2—figure supplement 2—source data 1
Effects of light-induced blockade of mGlu5 receptors in different brain regions on mechanical pain thresholds in the left paw of sham mice.
- https://cdn.elifesciences.org/articles/94931/elife-94931-fig2-figsupp2-data1-v1.zip
Figure 2—figure supplement 3
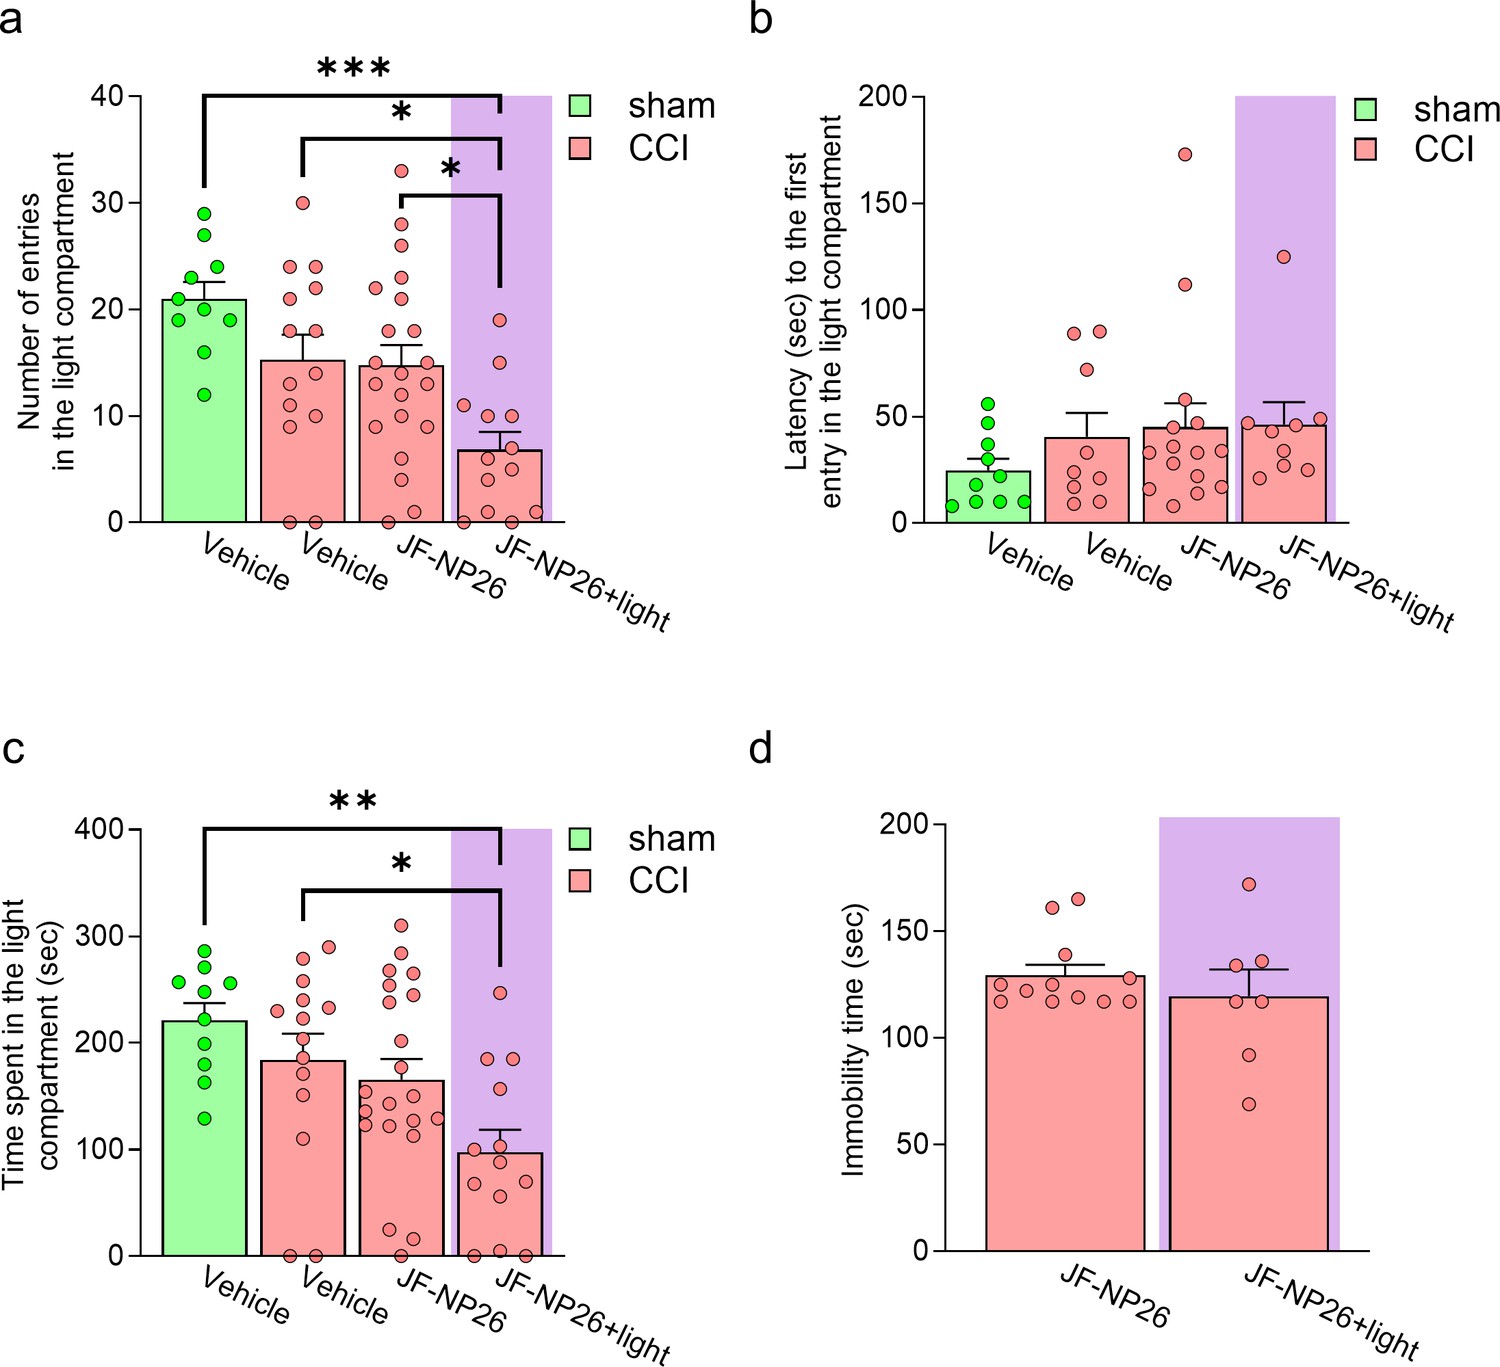
Effects of light-induced blockade of mGlu5 receptors in the right basolateral amygdala (BLA) on anxiety-like (risk-taking) and depressive-like behaviors of sham and chronic constriction injury (CCI) mice.
For the evaluation of risk-taking behavior in the light-dark box test the following groups were used: (i) sham-operated mice treated with vehicle; (ii) CCI mice treated with vehicle; (iii) CCI mice treated with JF-NP-26 without light activation; and (iv) CCI mice treated with JF-NP-26 and light activation in the right BLA. Graphs show (a) the total number of entries in the light compartment; (b) the latency to the first entry in the light compartment, and (c) the total time spent in the light compartment. For the evaluation of depression-like behavior in the tail suspension test the following groups were used: (i) CCI mice treated with JF-NP-26 without light activation; and (ii) CCI mice treated with JF-NP-26 and light activation in the right BLA. Graph shows (d) the duration of immobility. Bar histograms show mean + SEM of 10–21 (a–c), 7–12 (d) mice per group. (a)-(c) One-way ANOVA; (a) F(3,54)=6.702, p<0.001; (b) F(3,39)=0.8679; p=0.4659; (c) F(3,54)=4.773; p<0.05. Bonferroni’s multiple comparisons post hoc test. (d) Unpaired student’s t-test. *p<0.05, **p<0.01, ***p<0.001. (d) t=0.8578; p=0.4030. Source files available in the Figure 2—figure supplement 3—source data 1.
-
Figure 2—figure supplement 3—source data 1
Effects on risk-taking and depressive-like behavior of sham and CCI mice.
- https://cdn.elifesciences.org/articles/94931/elife-94931-fig2-figsupp3-data1-v1.zip
Figure 3 with 1 supplement
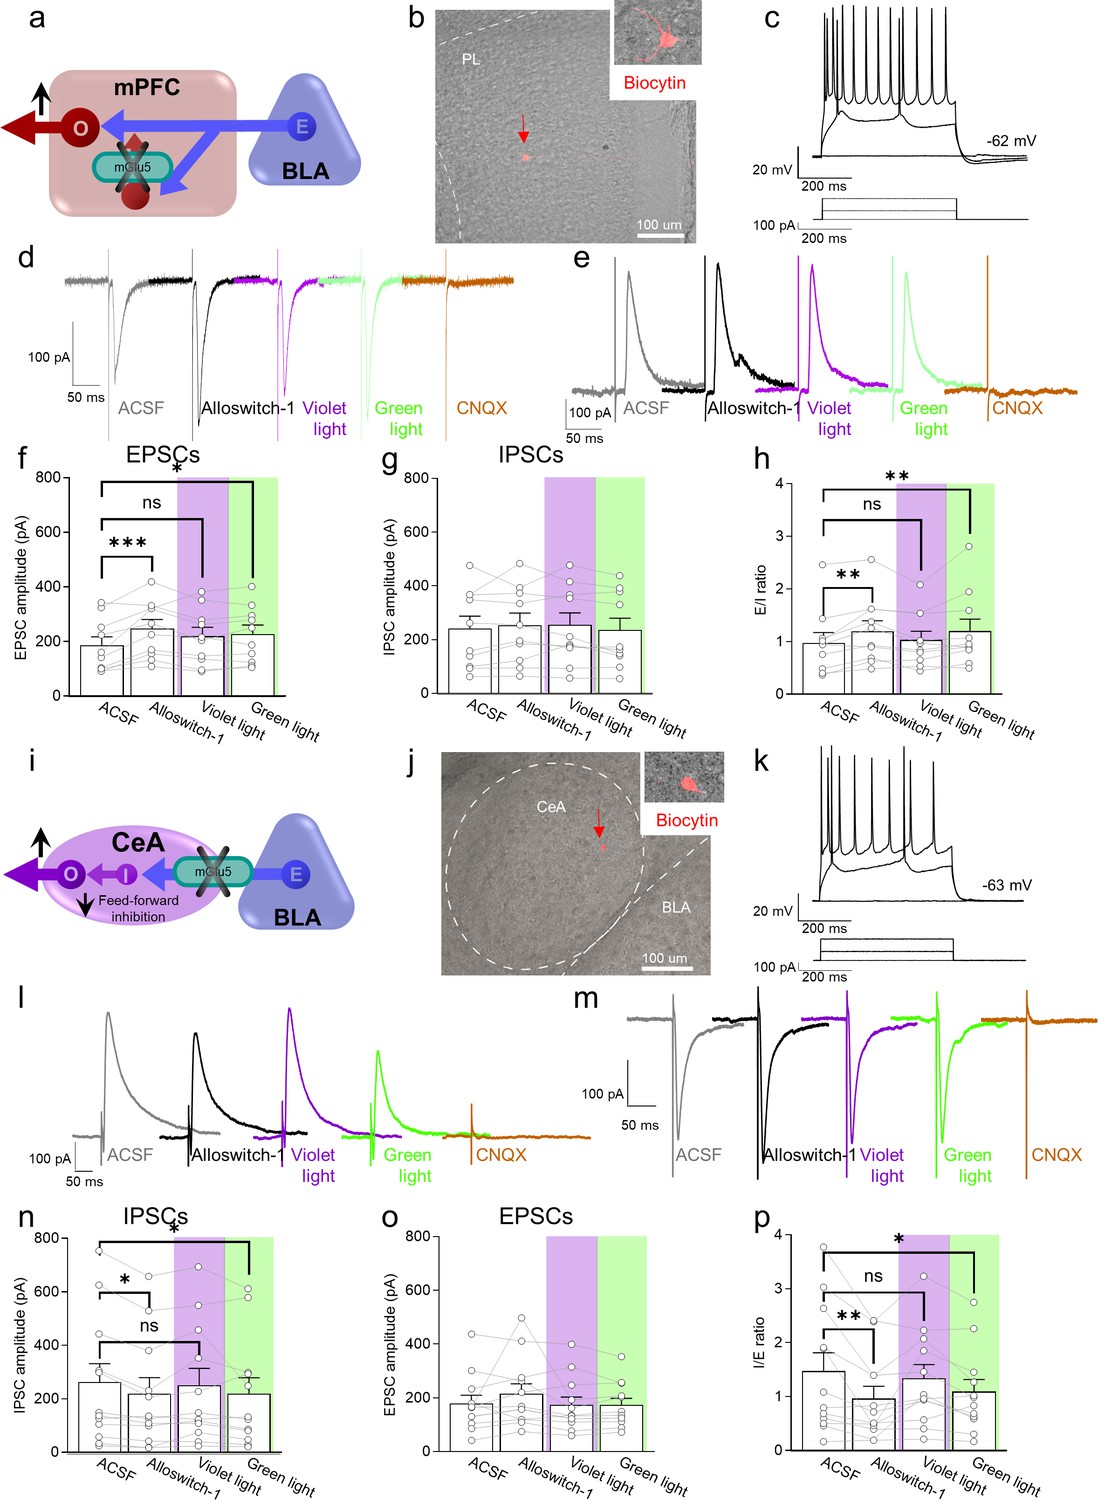
Electrophysiological effects of light-induced manipulations of mGlu5 on prelimbic pyramidal neurons and on amygdala feed-forward inhibition in neuropathic pain.
(a) Prelimbic circuitry to explain mGlu5 receptor action. Basolateral amygdala (BLA) input (E) activates (I) interneuron projects onto excitatory (E) inputs to pyramidal output neurons (O). (b, c) Whole-cell patch-clamp electrophysiological recordings were performed to visually identified layer 5 pyramidal neurons in brain slices obtained from CCI mice 16 days after induction. Traces recorded in an individual neuron show typical regular action potential firing patterns in response to intracellular depolarizing current injections. (d, e) Excitatory postsynaptic currents (Excitatory postsynaptic currents (EPSCs), recorded at –70 mV; d) and inhibitory postsynaptic currents (inhibitory postsynaptic currents (IPSCs), recorded at 0 mV; e) were evoked by focal electrical stimulation of fibers of passage in the infralimbic cortex. EPSCs and IPSCs were blocked by a glutamate receptor antagonist (CNQX, 20 µM) confirming glutamatergic EPSCs and glutamate-driven IPSCs. Synaptic responses were evaluated before (ASCF) and during alloswitch-1 bath application, and under blue-violet and green light illumination. (f) Alloswitch-1 (100 nM by superfusion) enhanced the peak amplitude of EPSCs. (g) EPSCs were not different from baseline with blue-violet light-induced inactivation of alloswitch-1 (5 min, 0.5 Hz, 500 ms) while subsequent reactivation under green light illumination (5 min, 0.5 Hz, 500 ms) significantly increased EPSCs compared to pre-drug values. (g) No significant changes were observed on the IPSCs. (h) Changes in excitatory/inhibitory (E/I) ratio. (i) Amygdala circuitry to explain mGlu5 receptor action. Excitatory (E) input from the basolateral to central nucleus engages inhibitory (I) signaling for feedforward inhibition of output (O) neurons. (j, k) Whole-cell patch-clamp electrophysiological recordings were performed from amygdala neurons (latero-capsular division, CeLC) of brain slices obtained from CCI mice 16 days after induction. (l, m) Glutamate-driven IPSCs (recorded at 0 mV; l) and monosynaptic EPSCs (recorded at –70 mV; IPSCs and EPSCs were blocked by CNQX, 20 µM, confirming glutamate-driven IPSCs (feedforward inhibition) and glutamatergic EPSCs; m) were evoked in CeLC neurons by focal electrical stimulation in the BLA. Synaptic responses were evaluated before (ASCF) and during alloswitch-1 bath application, and under blue-violet and green light illumination. (n) Alloswitch-1 (100 nM) significantly decreased the peak amplitude of the IPSCs; IPSCs were not significantly different from baseline with blue-violet light-induced inactivation of alloswitch-1 (5 min, 0.5 Hz, 500 ms), whereas subsequent drug reactivation under green light illumination (5 min, 0.5 Hz, 500 ms) significantly decreased IPSCs compared to pre-drug values. (o) No significant changes were observed on the EPSCs. (p) Changes in inhibitory/excitatory (I/E) ratio. The data suggest that mGlu5 blockade in the CeA reduced BLA-driven feed-forward inhibition onto the CeLC neurons resulting in behavioral hypersensitivity. Bar histograms show mean ± SEM of n=10 in 7 mice (f, g, h) and n=12 in 8 mice (n, o, p) neurons. One-way ANOVA repeated measures: (f) F(3.27)=6.323, p=0.0022; (g) F (3,27)=0.9374, p=0.4362; (h) F(3,27)=5.499, p=0.0044; (n) F(3,33)=4.079, p=0.0144; (o) F(3,33)=1.779, p=0.1704; (p) F(3,33)=5.581, p=0.0033. Dunnett’s multiple comparisons post hoc test. *p<0.05; **p<0.01 compared to pre-drug. Source files are available in the Figure 3—source data 1.
-
Figure 3—source data 1
Electrophysiological effects of light-induced manipulations of mGlu5 on prelimbic pyramidal neurons and on amygdala feed-forward inhibition in neuropathic pain.
- https://cdn.elifesciences.org/articles/94931/elife-94931-fig3-data1-v1.zip
Figure 3—figure supplement 1
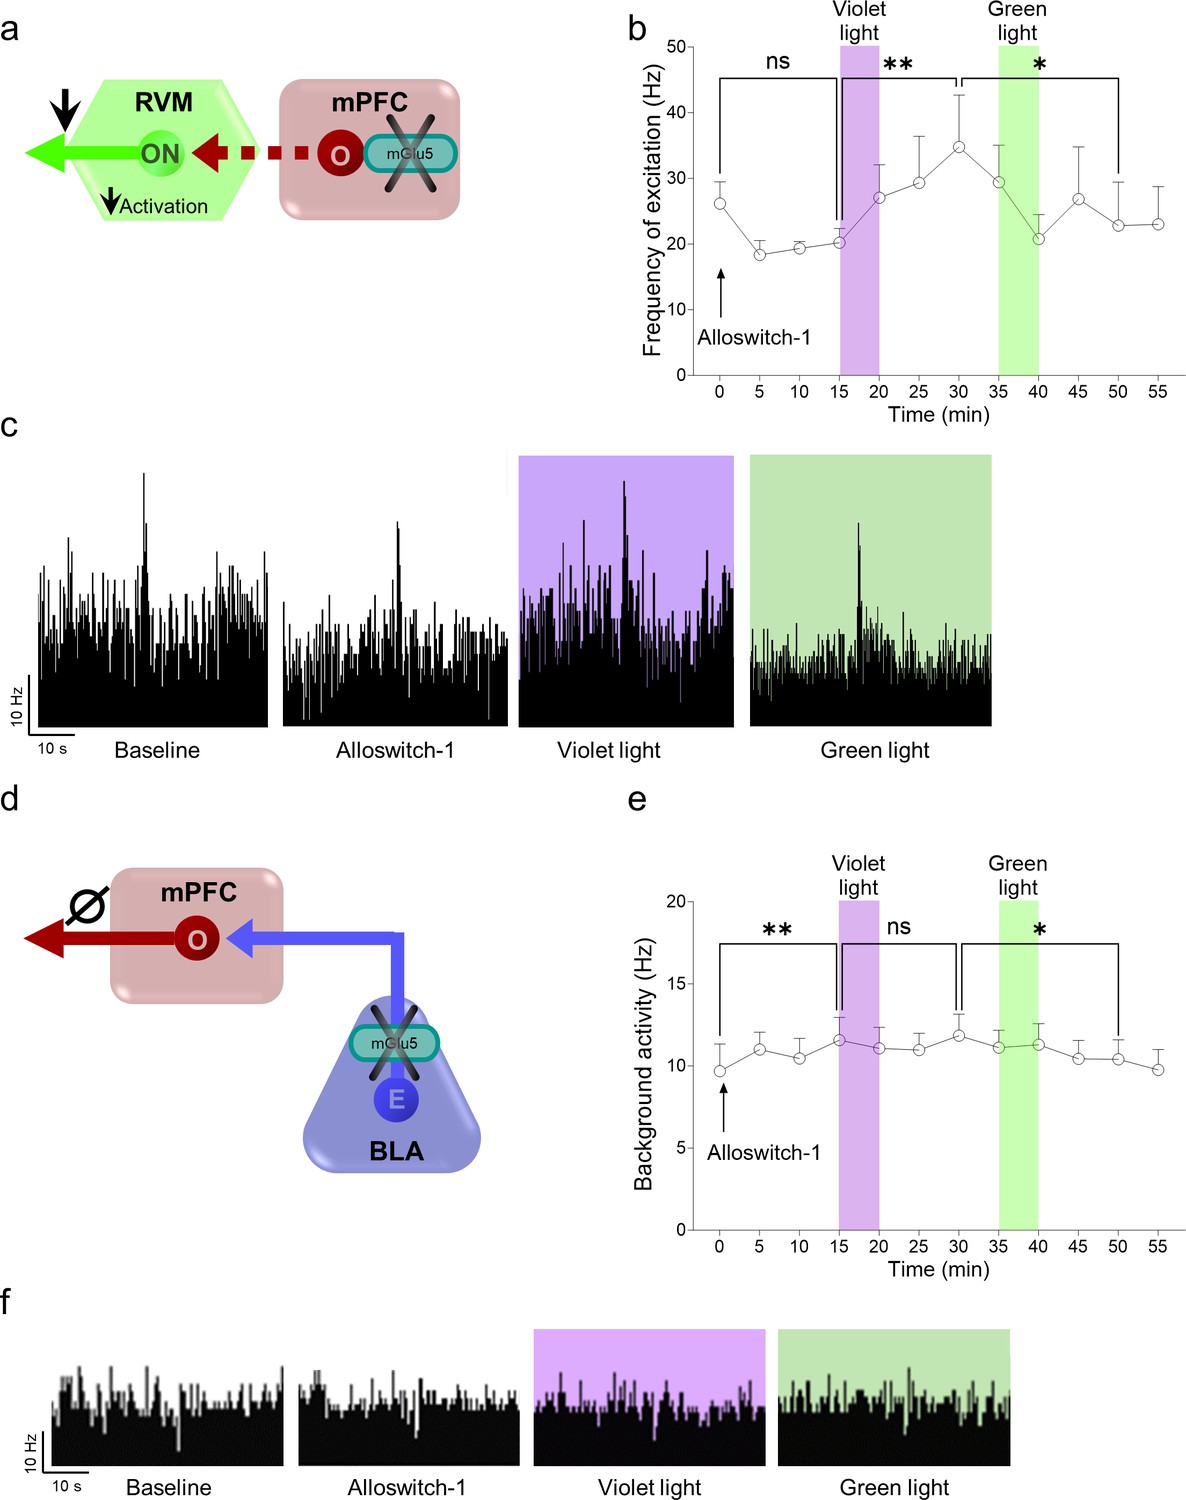
Effects of light-induced blockade of mGlu5 receptors in the prelimbic cortex on descending pain control (rostroventromedial medulla, RVM) and in the basolateral amygdala (BLA)-prelimbic circuitry in chronic constriction injury (CCI) mice.
(a) Single-unit recordings were performed from RVM ON-cells in anesthetized CCI mice 16 days after injury. An LED optic fiber was implanted into the contralateral (to the side of injury) prelimbic cortex for optical inactivation/activation of systemic alloswitch-1 (10 mg/kg, i.p.). (b) A trend of inhibition of RVM ON neuronal frequency of excitation was observed after alloswitch-1 systemic administration. Application of blue-violet light increased neuronal evoked activity while green light illumination restored a burst of excitation in CCI anesthetized mice. (c) shows examples of ratemeter records that illustrate the light-dependent effects of alloswitch-1 on evoked neuronal activity of RVM ON neurons. To investigate the contribution of the BLA-prelimbic circuitry (d) to the facilitatory behavioral effects of mGlu5 inhibition in the amygdala (Figure 2g and m), in vivo single unit recordings were performed from the prelimbic pyramidal neurons of CCI mice 16 days after injury. An LED optic fiber was implanted into the BLA contralateral (to the side of injury) to allow light-dependent deactivation/activation of alloswitch-1 (10 mg/kg, i.p.). Systemic administration of alloswitch-1 (10 mg/kg, i.p.) significantly increased background activity (e) of prelimbic neurons in neuropathic mice. Blue-violet light had no significant effects, while a decrease of activity was observed after green light illumination, which did not mimic the alloswitch-1 effects, arguing against a modulatory role of mGlu5 in the BLA to mPFC projection (Ø, no overall effect). (f) Examples of ratemeter records that illustrate the light-dependent effects of alloswitch-1 on spontaneous activity of prelimbic neurons. Each point represents the mean ± SEM of 4 (b) and 8 (e) neurons. One-way ANOVA repeated measures: (b) F(11,44)=2.291, p=0.0257; (e) F(11,77)=2.724, p=0.005. Bonferroni’s multiple comparisons post hoc test. *p<0.05, **p<0.01. Source files available in the Figure 3—figure supplement 1—source data 1.
-
Figure 3—figure supplement 1—source data 1
Effects of light-induced blockade of mGlu5 receptors in prelimbic cortex on descending pain control (RVM) and on BLA-prelimbic circuitry in CCI mice.
- https://cdn.elifesciences.org/articles/94931/elife-94931-fig3-figsupp1-data1-v1.zip
Figure 4
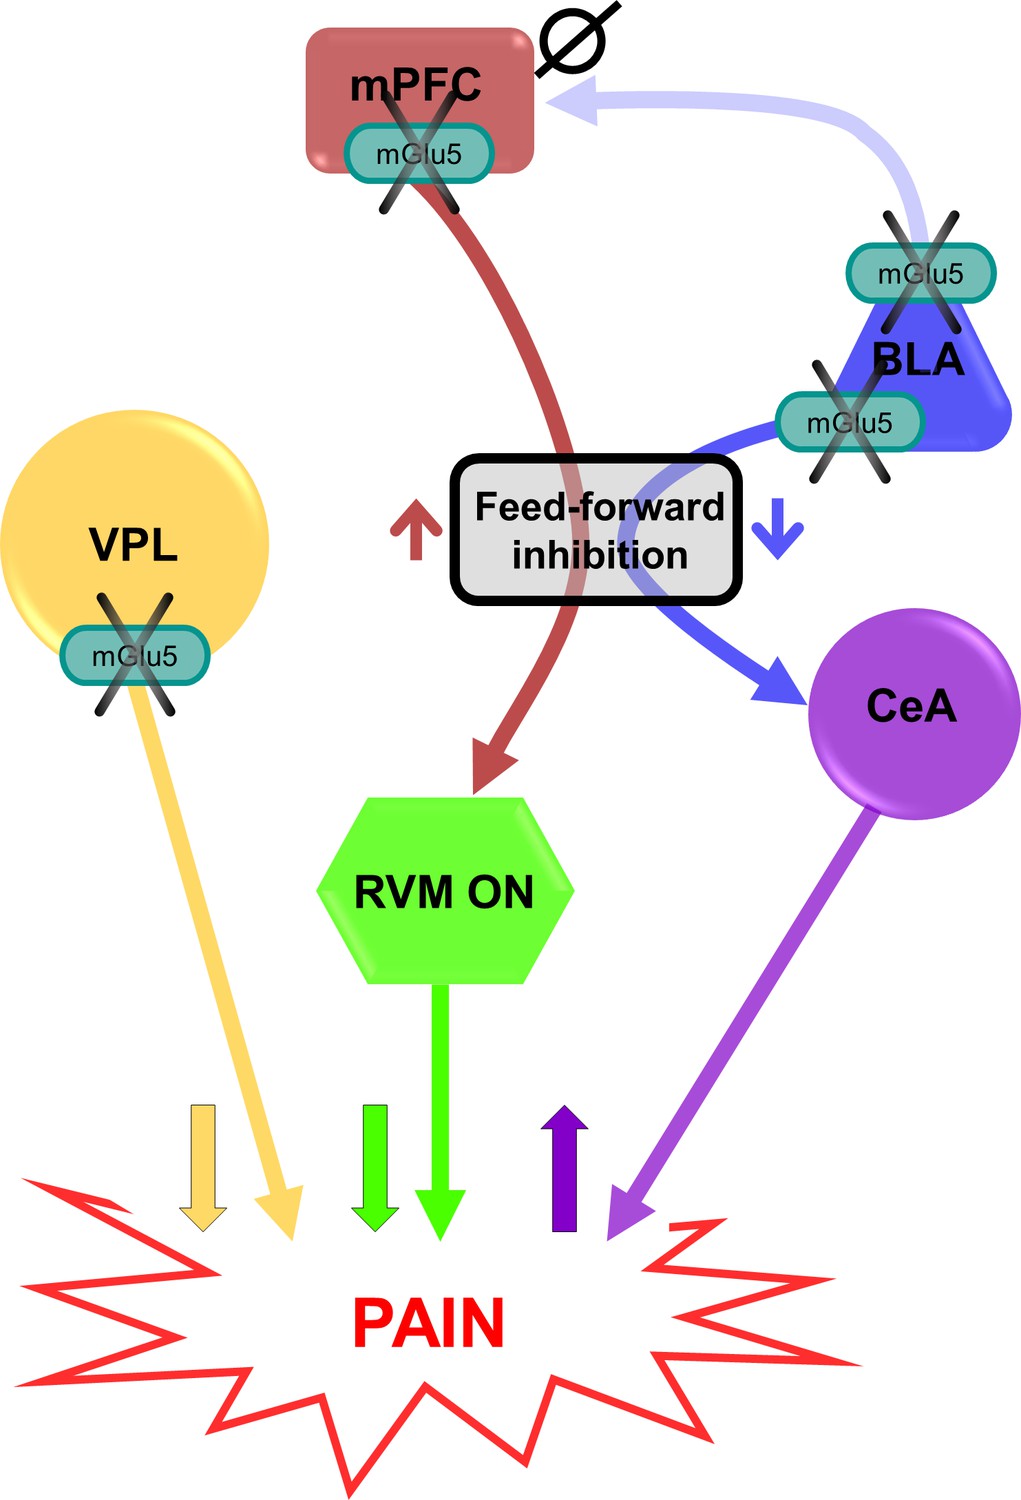
Putative circuitry of brain region-specific functions of mGlu5 receptors in pain modulation.
Hypothesized neural circuitry based on in vivo and ex vivo electrophysiology and behavioral data. mGlu5 receptor blockade decreases feedforward inhibition from BLA to CeA to increase amygdala output (Figure 3i–p) and facilitate pain behaviors (Figure 2g and m, and Figure 2—figure supplement 3), but has no effect on mPFC activity (Figure 3—figure supplement 1d-f). mGlu5 receptor blockade in the mPFC increases pyramidal cell output (Figure 3a–h) to decrease the activity of pronociceptive RVM ON-cells via feedforward inhibition, resulting in decreased pain behavior (Figure 2e and k). mGlu5 receptor blockade in the VPL resulted in antinociceptive effects (Figure 2h and n). mPFC = medial prefrontal cortex; VPL = ventral posterolateral nucleus of the thalamus; BLA = basolateral amygdala; CeA = central nucleus of amygdala; RVM = rostral ventromedial medulla; ↑ facilitation; ↓ inhibition; Ø no effect.
Additional files
-
MDAR checklist
- https://cdn.elifesciences.org/articles/94931/elife-94931-mdarchecklist1-v1.pdf
-
Supplementary file 1
Effect size of optical modulation in prelimbic cortex on RVM activity, according to Cohen’s d calculation from t-tests.
- https://cdn.elifesciences.org/articles/94931/elife-94931-supp1-v1.docx
Download links
A two-part list of links to download the article, or parts of the article, in various formats.
Downloads (link to download the article as PDF)
Open citations (links to open the citations from this article in various online reference manager services)
Cite this article (links to download the citations from this article in formats compatible with various reference manager tools)
A ‘double-edged’ role for type-5 metabotropic glutamate receptors in pain disclosed by light-sensitive drugs
eLife 13:e94931.
https://doi.org/10.7554/eLife.94931


