Visuo-motor updating in individuals with heightened autistic traits
- Institute for Experimental Psychology, Heinrich Heine University Düsseldorf, Germany
Figures
Figure 1
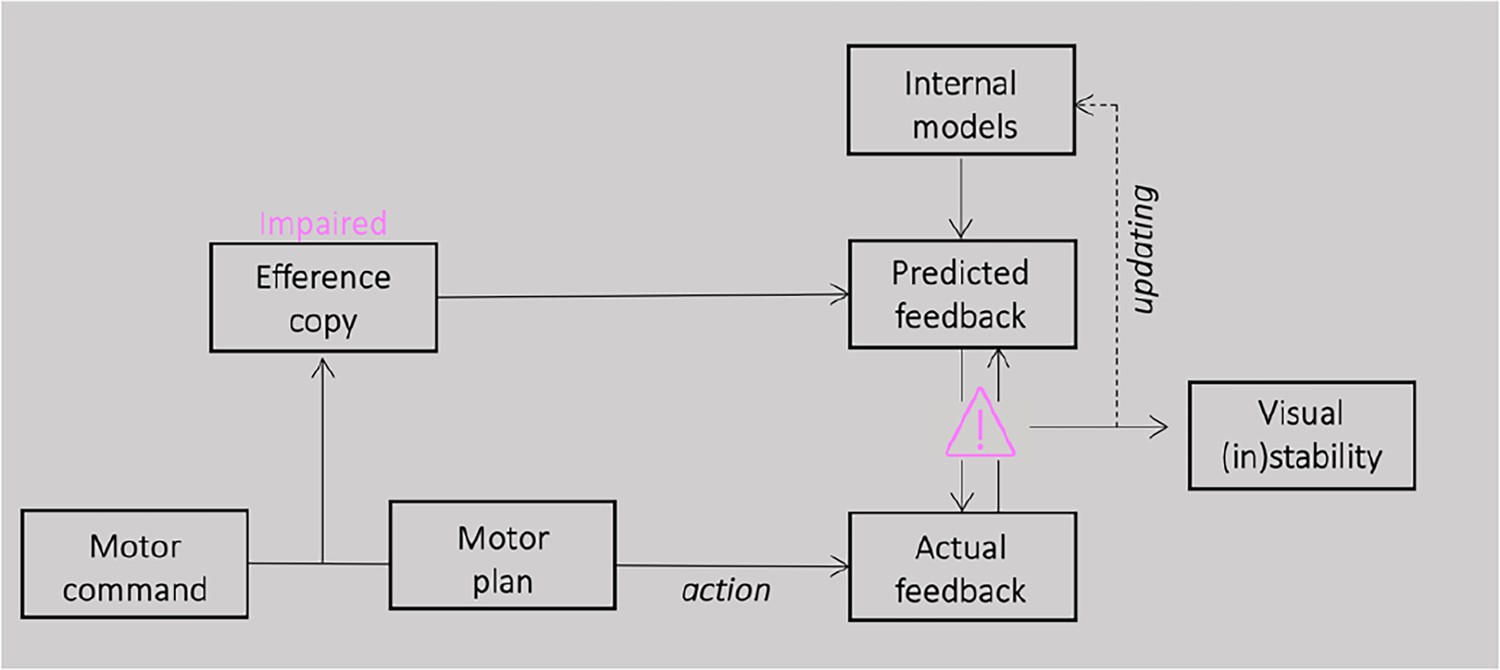
Schematic illustration of the proposed model.
For saccade generation, a motor command is sent to the motor plan which produces the desired eye movement. A correct plan of the movement depends on a comparison between the position of the eye before and after a saccade and therefore on the accuracy of the efference copy signal. If the efference copy is impaired, pre-saccadic prediction will be never completely confirmed by the post-saccadic feedback. This constant lack of successful match between prediction and sensory evidence could influence the accumulation of sensory predictions over time, leading to a less stable perception.
Figure 2
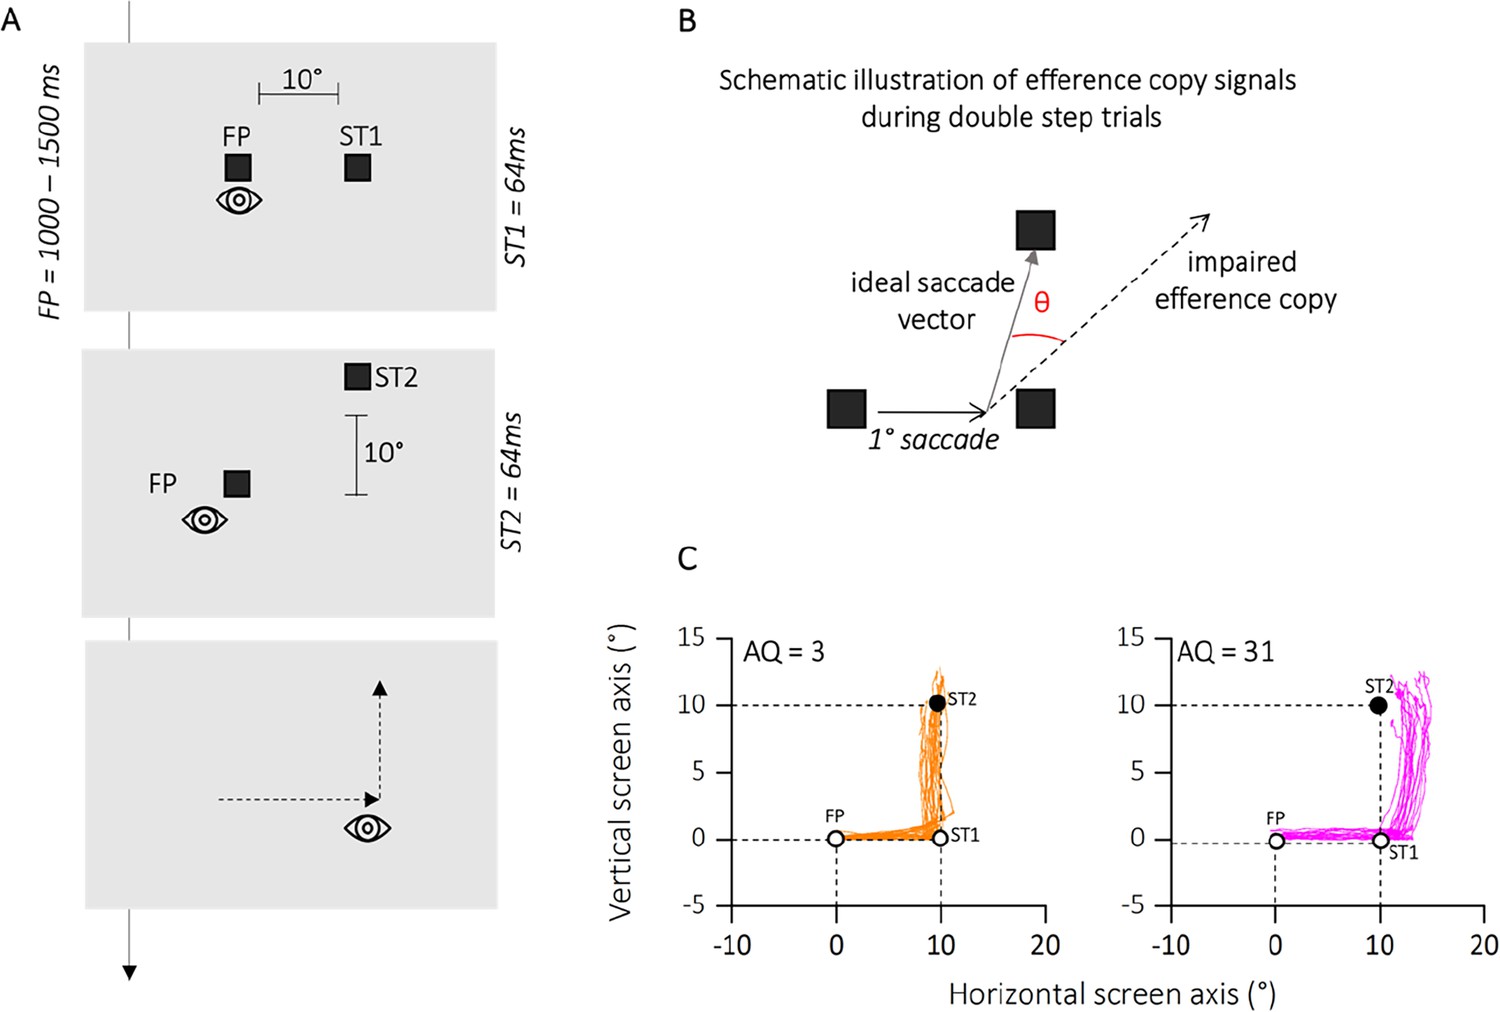
Methods experiment 1.
(A) Time course of presentations and spatial arrangement of stimuli during double-step task. Participants made double-step saccades from a fixation point (FP) to the first saccadic target (ST1), and from there to a second saccade target (ST2). Both FP and saccade targets were separated by 10°. Participants were instructed to initiate the saccade only after all stimuli had disappeared, so to avoid any visual references. (B) Hypothetical pattern of first and second saccades on a particular trial and illustration of the variables angle shift and horizontal endpoint shift of second saccades. We determined how far the second saccade deviated from the optimal vector that would have directed the gaze onto the target. We calculated the angle between the second saccade vector and the optimal vector connecting the starting position of the second saccade and the second saccade target. These angles were computed separately for upward and downward saccades, but since they resulted in very similar values, we collapsed the data into upward angles only. (C) Eye position traces for two representative participants. The eye position between the initiation of the first saccade from FP toward ST1 (empty circles) and the termination of the second saccade toward ST2 (filled circle) are depicted for each trial in which successive saccades to ST1 and ST2 were produced. Plots are separated for low autistic traits (autistic quotient [AQ] = 3, in orange) and high autistic traits (AQ = 31, in magenta) example participants.
Figure 3
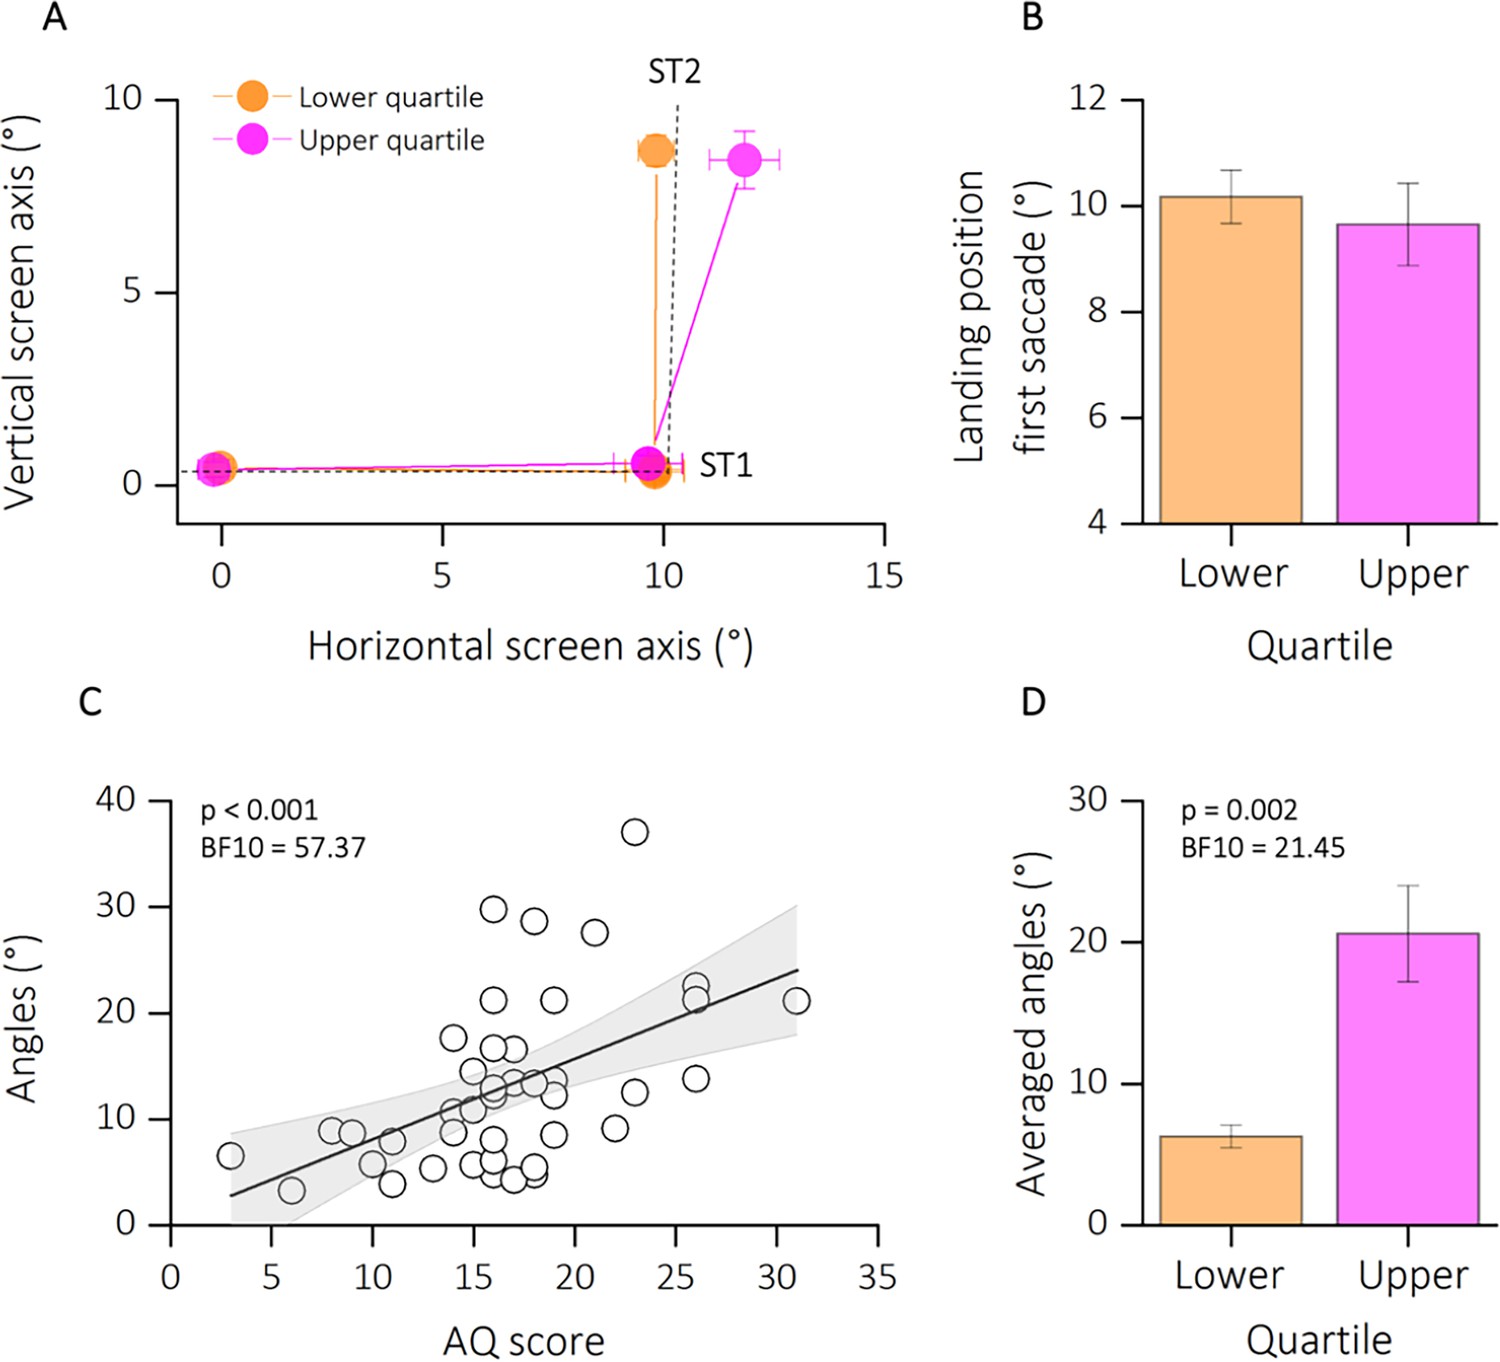
Results experiment 1.
(A) Average saccade vectors from FP (0, 0) to ST1 (10, 0) and from ST1 to ST2 (10, 10). Data are shows for a subsample of participants, falling in the lower (orange) and upper (magenta) quartiles of the autistic quotient (AQ) distribution. Data from upward and downward second saccades are collapsed. Dashed lines indicate the required saccade path from FP to ST1 and from ST1 to ST2. (B) Average first saccade landing position for lower and upper quartiles of the AQ distribution. Error bars are standard error of the mean (SEM). (C) Linear regression between angles (distance the actual second saccade vector and the optimal vector that would have led to the physical target position ST2 from the second saccades’ starting position) and the autistic score of participants. Text insets report p-values and associated Bayes Factors of Pearson’s Rho. Thick black line shows the linear fit through the data. The shaded area represents the standard error for each observation mean as predicted by the regression line. (D) Average angles (°) for lower (AQ <13, orange) and upper (AQ >19, magenta) quartiles of the AQ distribution. Error bars are SEM. Text insets report p-values and associated Bayes Factors of paired sample t-test.
Figure 4
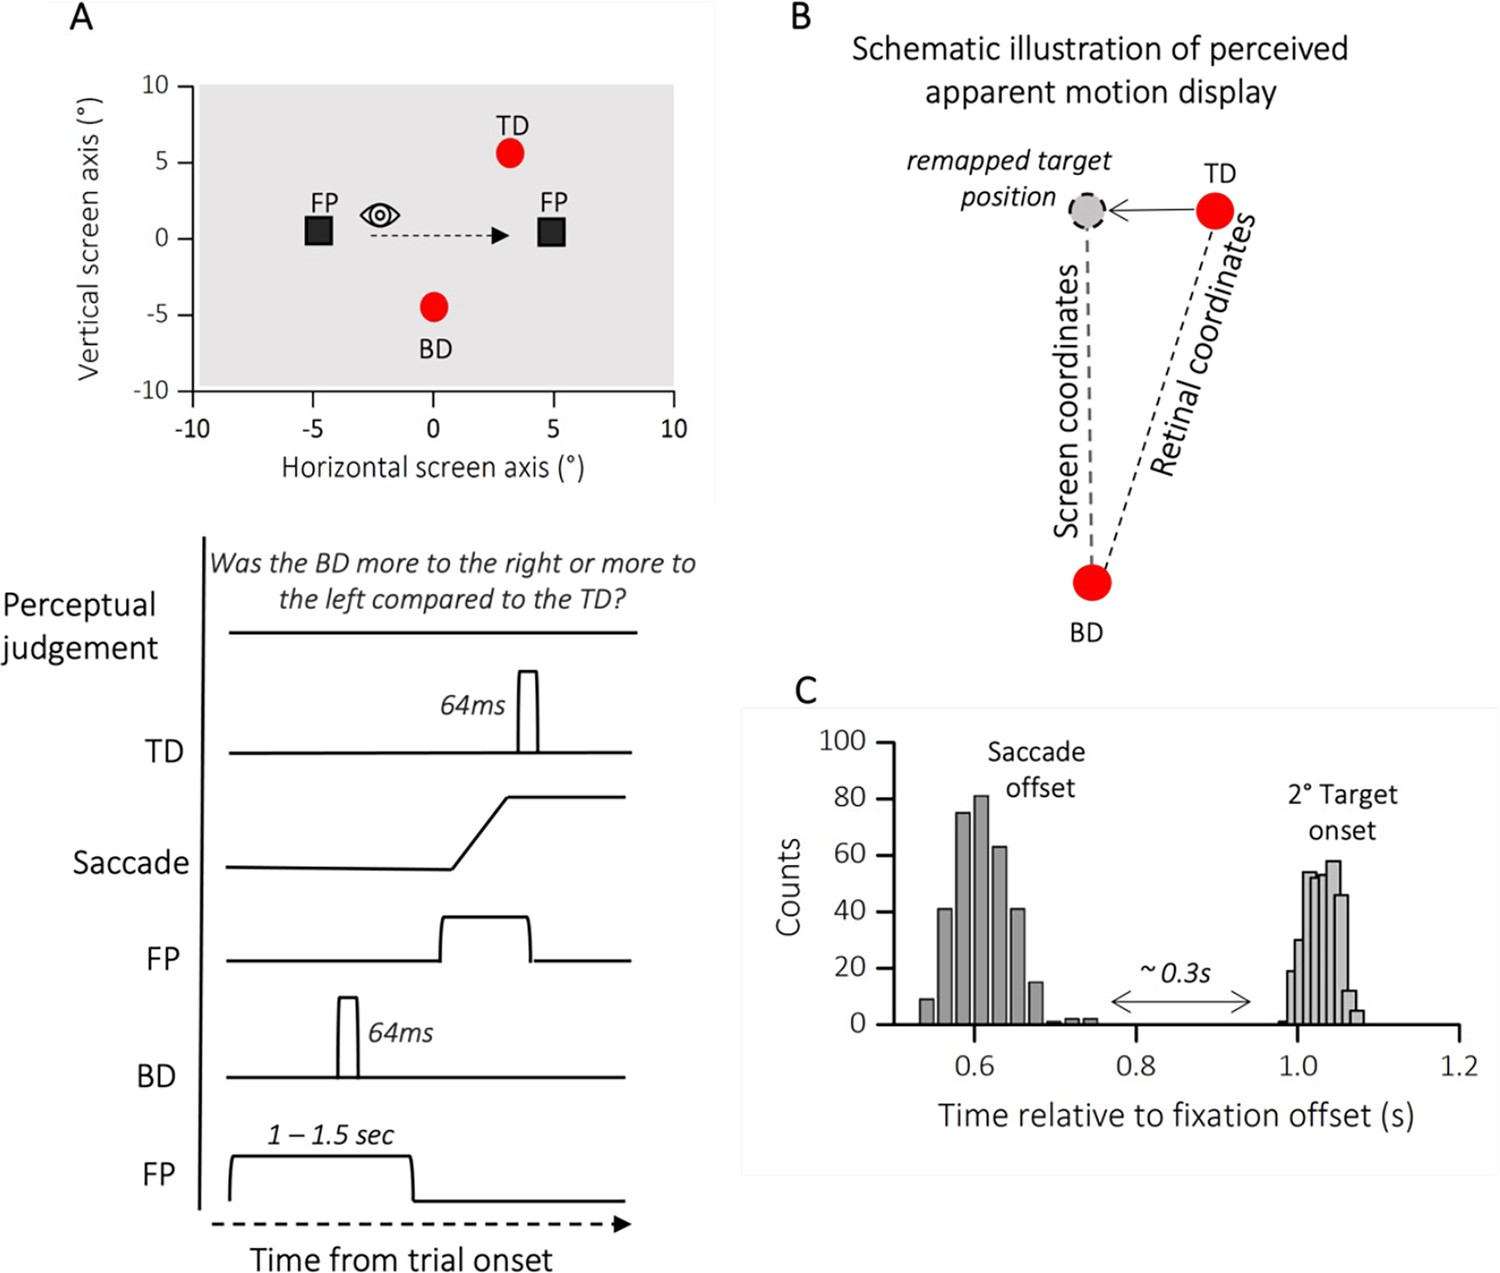
Methods experiment 2.
(A) Spatial arrangement of stimuli and time course of presentations during trans-saccadic localization task. Participants made a saccade from a fixation point (FP, left) to a second fixation point (FP, right). At a random time before the first FP disappearance, a red circle (Bottom Dot, BD) was presented for 64 ms, at saccade completion a second red dot (Top Dot, TD) was delivered for another 64 ms. Participants were instructed to initiate the saccade only after the first FP had disappeared. At saccade completion participants were asked to report whether the first dot delivered (in the figure BD) was more to the right or more to the left compared to the second one (in the figure TD). (B) Schematic illustration of perceived apparent motion display. On the retina, the first probe falls to the right side of the fovea while the second falls to the left side. To compensate for these effects of the saccade, the visual system corrects the expected location of the second dot in the opposite direction to the saccade (remapped target position, gray dot). If this correction is accurate, the displacement is perceived in its spatiotopic (vertical dashed line: from remapped target position to BD) rather than retinotopic arrangement (oblique dashed line: from TD to BD) and space constancy is maintained. (C) Average frequency distribution of saccade offsets and second target onset. We analyzed only the trials in which the second target was delivered after saccade completion (on average around 0.3 s), so that the visual system could dissociate the retinal from the screen coordinates.
Figure 5
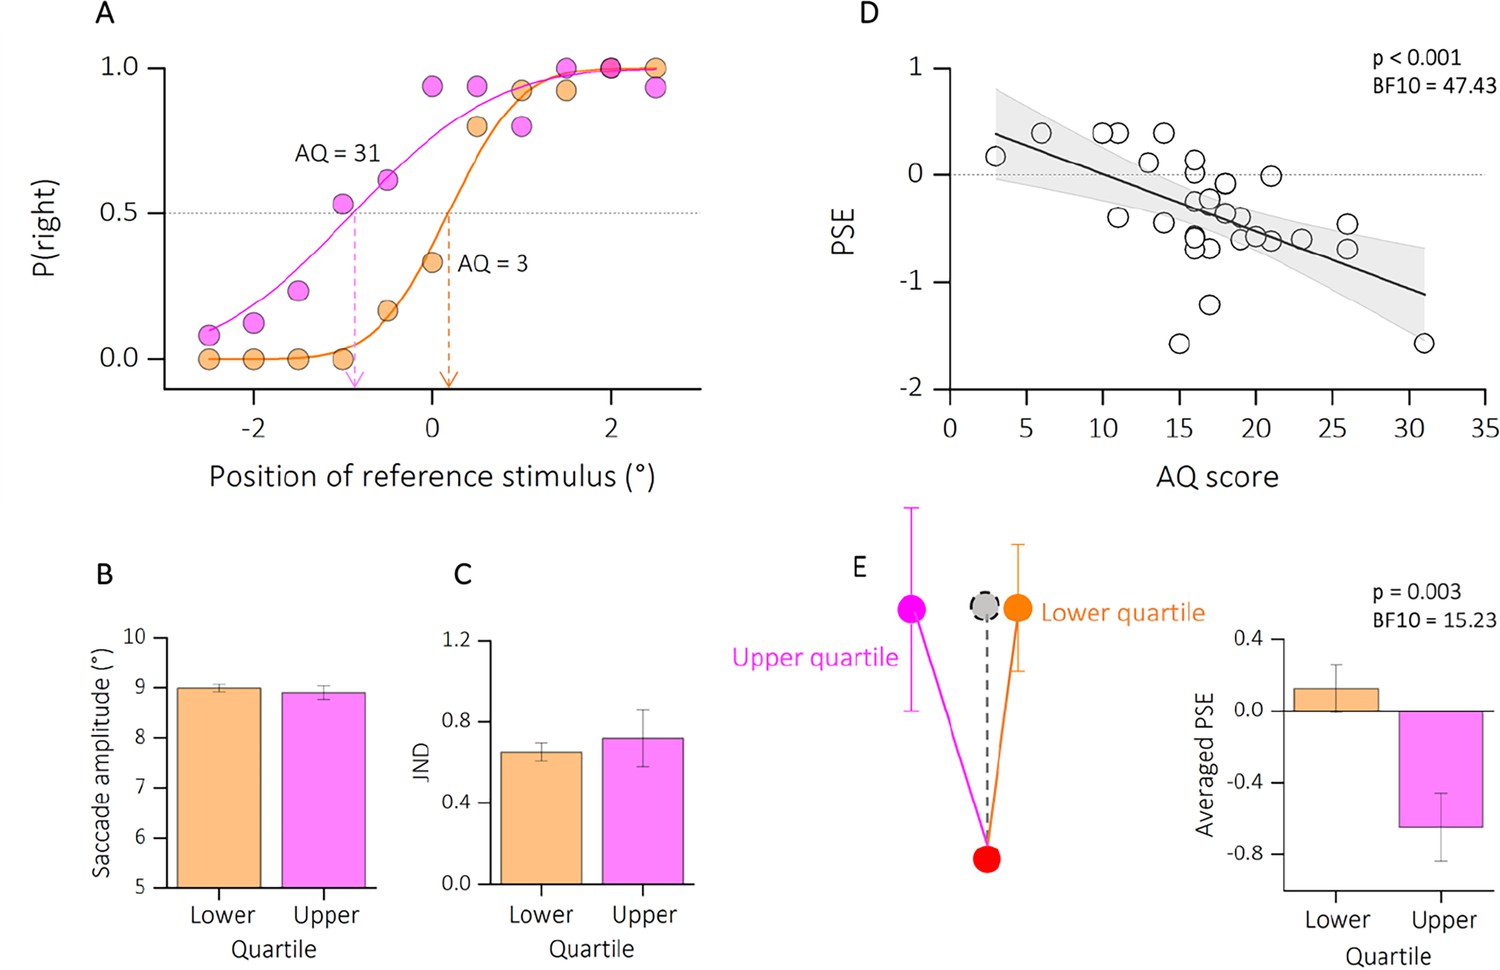
Results experiment 2.
(A) Psychometric functions for two example participants at the very extremes of the autistic quotient distribution (AQ = 3, in orange; AQ = 31, in magenta).The functions plot the proportion of reporting ‘right’, as function of the position of the second dot relative to the first one (shown in the abscissa). The vertical-colored lines show the estimates of the PSE, given by the median of the fitted cumulative Gaussian functions. (B) Average saccade amplitude (°) for lower (AQ <14, in orange) and upper (AQ >20, in magenta) quartiles of the autism distribution. Saccade amplitude did not vary with autistic traits. (C) Precision thresholds (Just Noticeble Difference, JND) for lower and upper quartiles of the AQ distribution, same convention as in B. Here, the precision in reporting the dot displacement was similar between subsamples. (D) Linear regression between PSE and the autistic score of participants. Text insets report p-values and associated Bayes Factors of Pearson’s Rho. Thick black line shows the linear fit through the data. The shaded area represents the standard error for each observation mean as predicted by the regression line. (E) Schematic illustration of perceived dots displacement for upper and lower quartiles of the AQ. A localization compensating fully for the saccadic eye movement would lead to a perfect vertical localization (gray dot, dashed line). However, deviations from the vertical indicate and under- or over-compensation of the saccade vector. We found a large under compensation of the saccade vector for the participants with higher autistic traits, compared to participants with lower autistic traits. See also bar plot, average PSE, on the right. Text insets report p-values and associated Bayes Factors of two sample t-test.
Figure 6

Linear regression between PSEs of the trans-saccadic localization task and the angles of deviation from the double-step saccade task.
Text insets report p-values and associated Bayes Factors of Pearson’s Rho. Thick black line shows the linear fit through the data. The shaded area represents the standard error for each observation mean as predicted by the regression line.
Tables
Key resources table
| Reagent type (species) or resource | Designation | Source or reference | Identifiers | Additional information |
|---|---|---|---|---|
| Software, algorithm | MATLAB code to process data | This paper and Mathworks https://mathworks.com | RRID:SCR_001622 |
Additional files
Download links
A two-part list of links to download the article, or parts of the article, in various formats.
Downloads (link to download the article as PDF)
Open citations (links to open the citations from this article in various online reference manager services)
Cite this article (links to download the citations from this article in formats compatible with various reference manager tools)
Visuo-motor updating in individuals with heightened autistic traits
eLife 13:RP94946.
https://doi.org/10.7554/eLife.94946.3


