The genetic architecture of the load linked to dominant and recessive self-incompatibility alleles in Arabidopsis halleri and Arabidopsis lyrata
- Univ. Lille, CNRS, UMR 8198 – Evo-Eco-Paleo, France
Figures
Figure 1 with 1 supplement
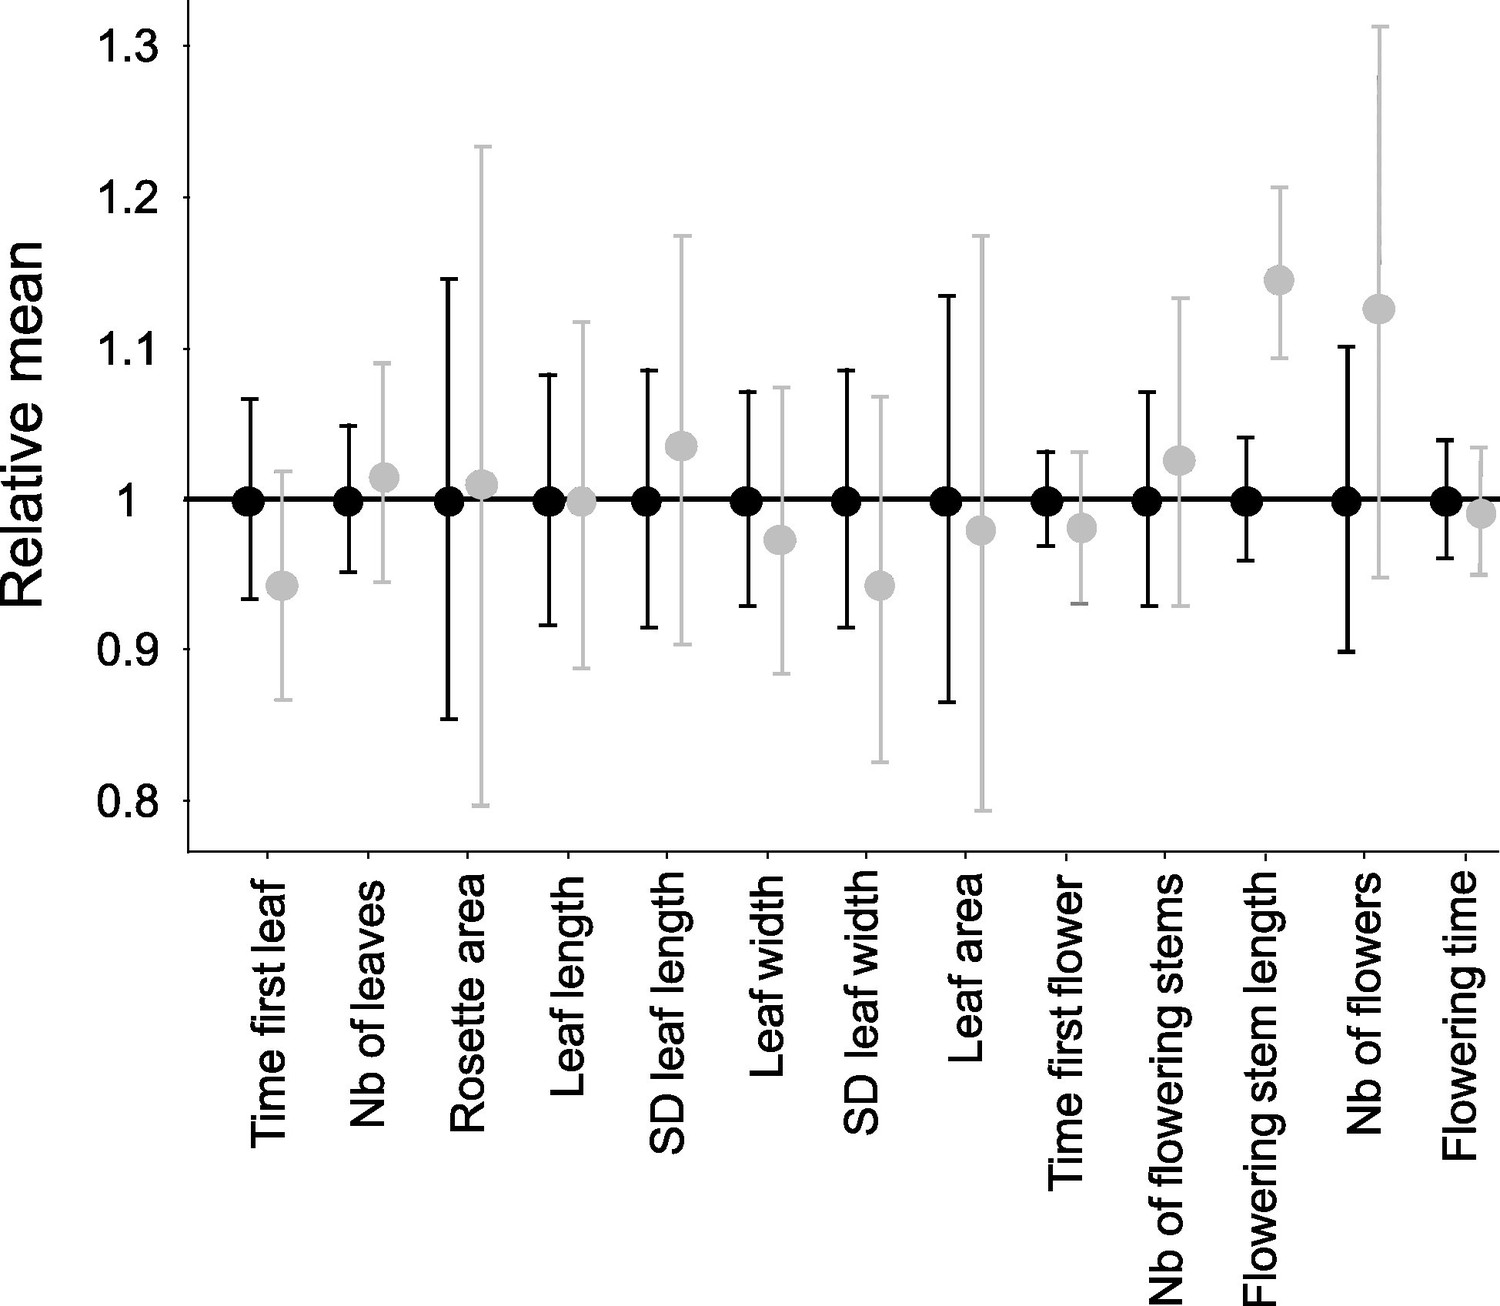
Effect of homozygosity at the S-locus on 13 phenotypic traits compared to heterozygotes.
For each trait, the phenotypic values in homozygotes (in grey; n=72) were normalised relative to the mean phenotypic values in heterozygotes (in black; n=86). The point represent the mean and the barres represent the standard deviations. The differences of distributions were tested by 10,000 random permutations.
Figure 1—figure supplement 1
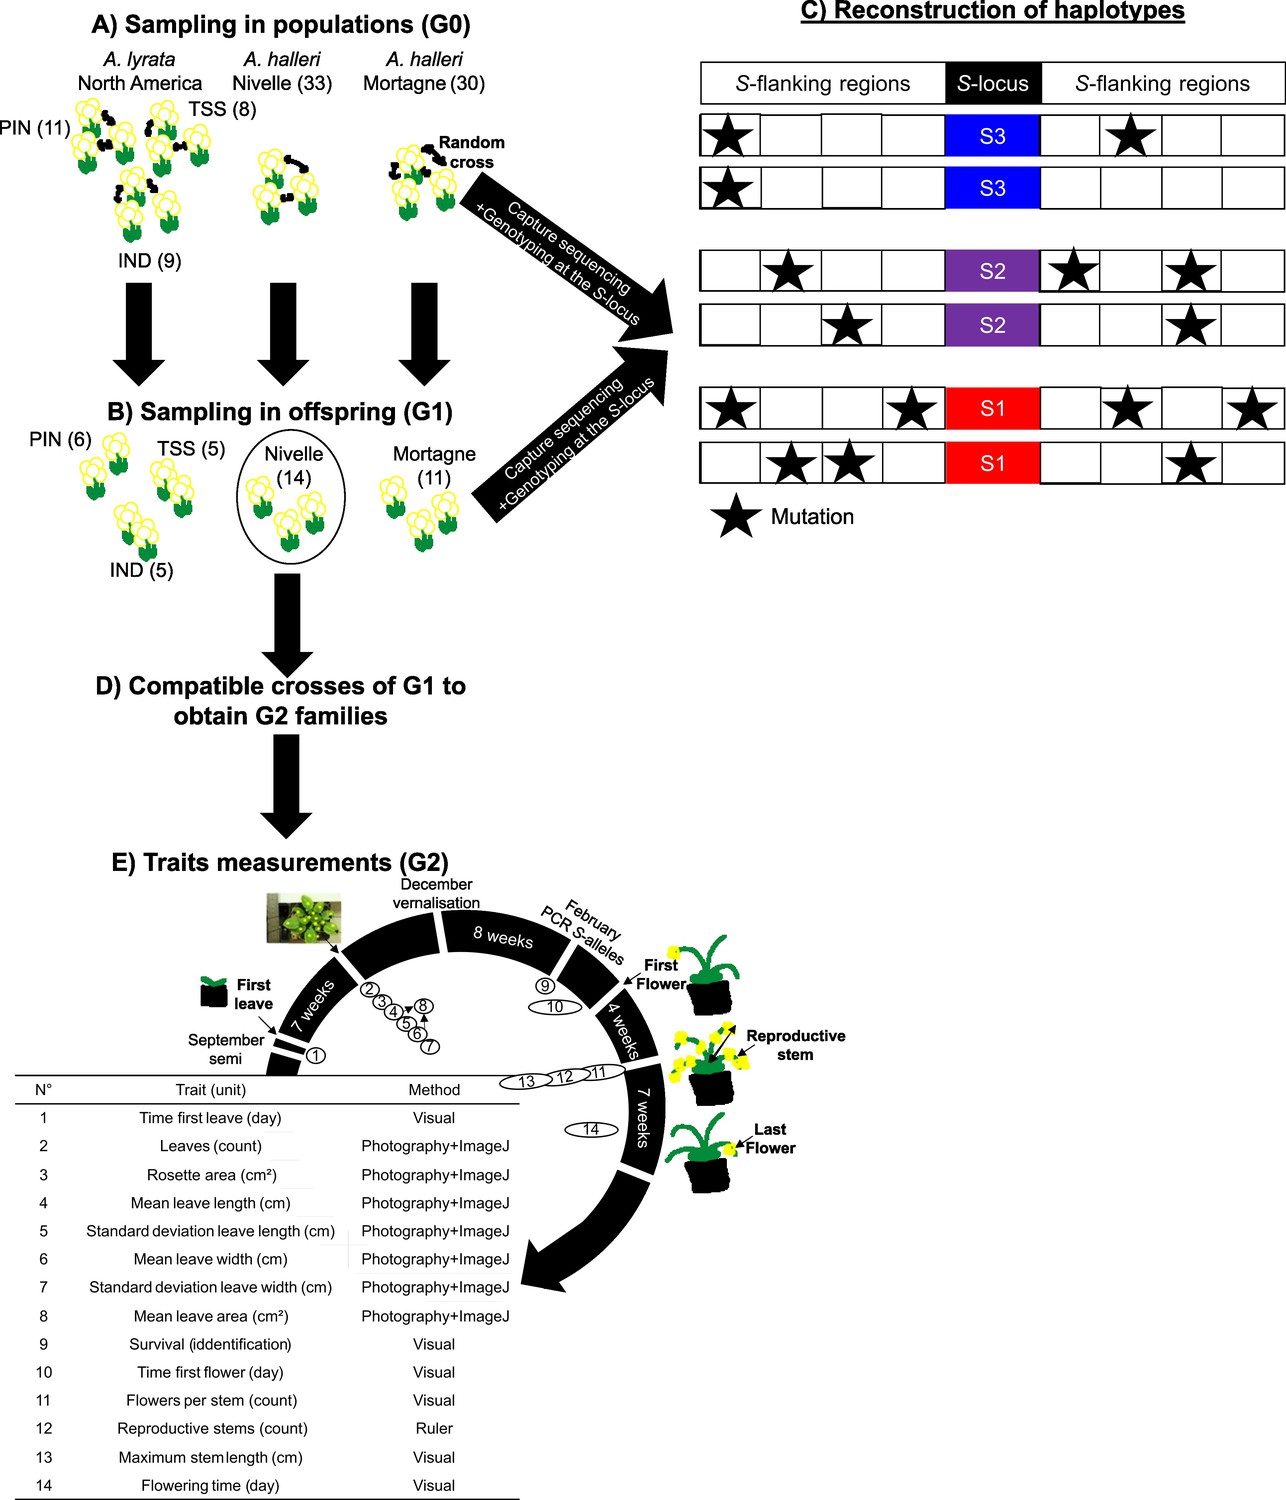
Experimental protocol.
(A) We randomly crossed A. lyrata individuals from the PIN, TSS, and IND populations in North America (left) and A. halleri from the Nivelle (middle) and Mortagne (right) populations. Individuals were sequenced by a capture protocol. Numbers between parentheses represent the number of individuals per dataset. (B) One offspring from each cross was sequenced along with its two parents for trio haplotyping. Offspring from the Nivelle population (black circle) were conserved for the study of the impact of homozygosity at the S-locus on fitness (G1 population). (C) Individuals sequenced in (A) and (B) were used to reconstruct haplotypes linked to each copy of S-allele, assuming no recombination between the S-locus and its flanking regions between parents and offspring. (D) We used the dominance hierarchy between S-alleles expressed in pollen to cross G1 individuals from the Nivelle population and obtained six G2 families constituted of heterozygous and homozygous individuals for the alleles Ah01, Ah03, and Ah04. (E) Description of the traits measured, and the methods used to estimate the impact of homozygosity at the S-locus in homozygotes. Traits 1–8 are related to biomass and traits 10–14 are related to reproductive success.
Figure 2 with 8 supplements
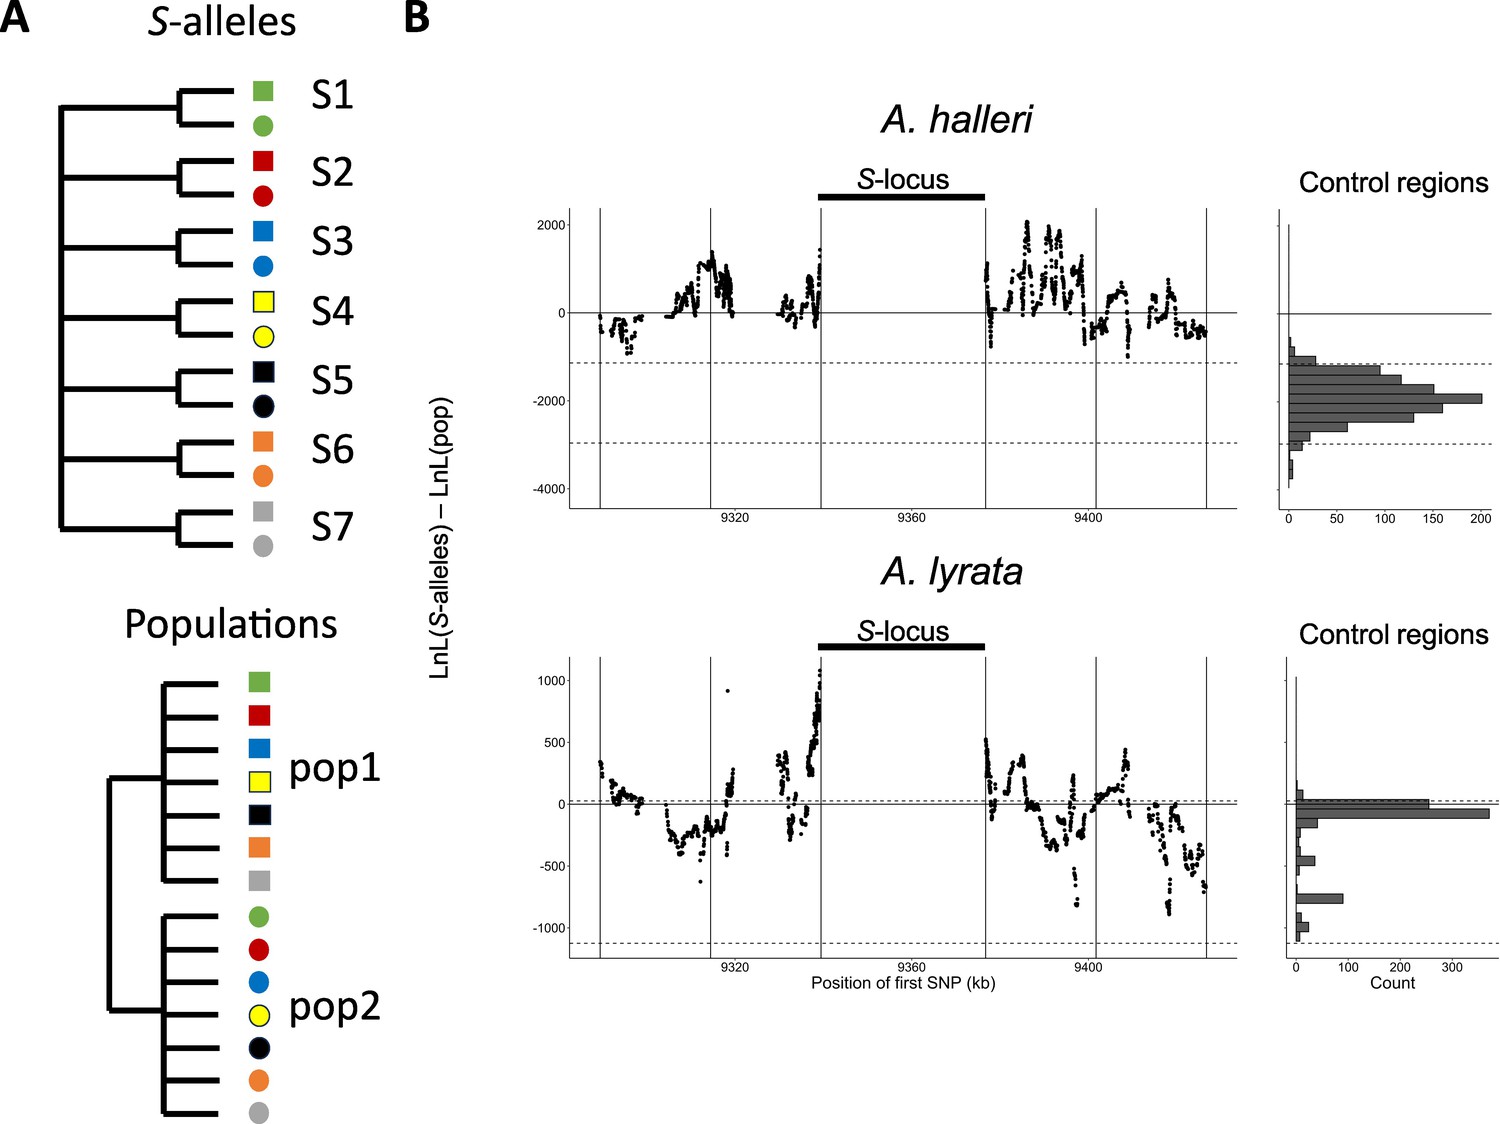
Linkage to the S-locus locally distorts the phylogenetic relationships.
(A) The two topologies of interest cluster haplotypes either by the S-allele to which they are linked (top) or by the populations where they came (bottom). Different S-alleles are represented by symbols of different colours, different populations of origin are represented by symbols of different shapes. (B) Difference in log likelihood of the two topologies of interest. Dots correspond to the difference in log likelihood for overlapping series of 50 SNPs around the S-locus for A. halleri (top panel) and A. lyrata (bottom panel). Positive values correspond to chromosomal positions where the topology by S-alleles explains the phylogeny of haplotypes better than the topology by populations. The right panels show the difference in log likelihood in the control regions. 2.5 and 97.5 percentiles of the distribution in the control regions are indicated by dashed lines.
Figure 2—figure supplement 1
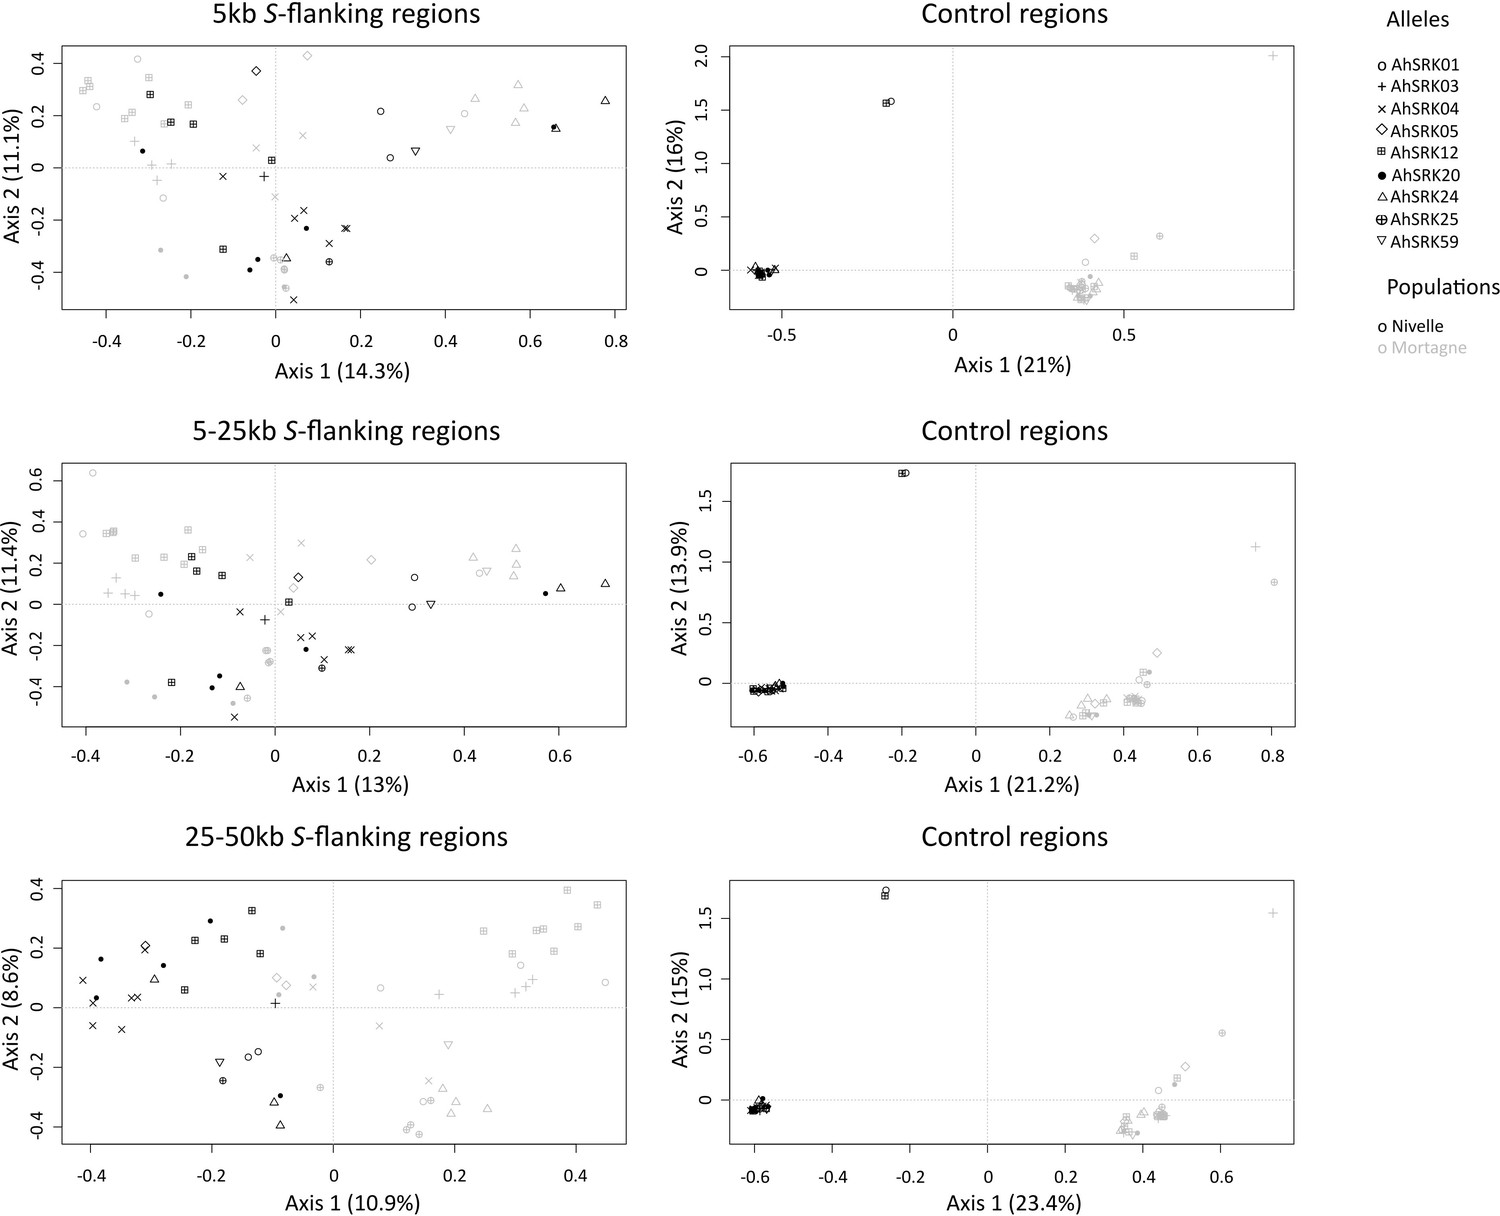
Analysis of major components obtained for haplotypes of A. halleri of the Nivelle (black dots) and Mortagne (grey dots) populations based on SNPs in the first 5 kb, between 5 and 25 kb, and between 25 kb and 50 kb away from the S-locus.
The S-allele to which the SNPs are linked are represented by different symbols. The right panels show the analysis on control regions, each time matching the number of SNPs with that of the corresponding linked regions (left panels).
Figure 2—figure supplement 2
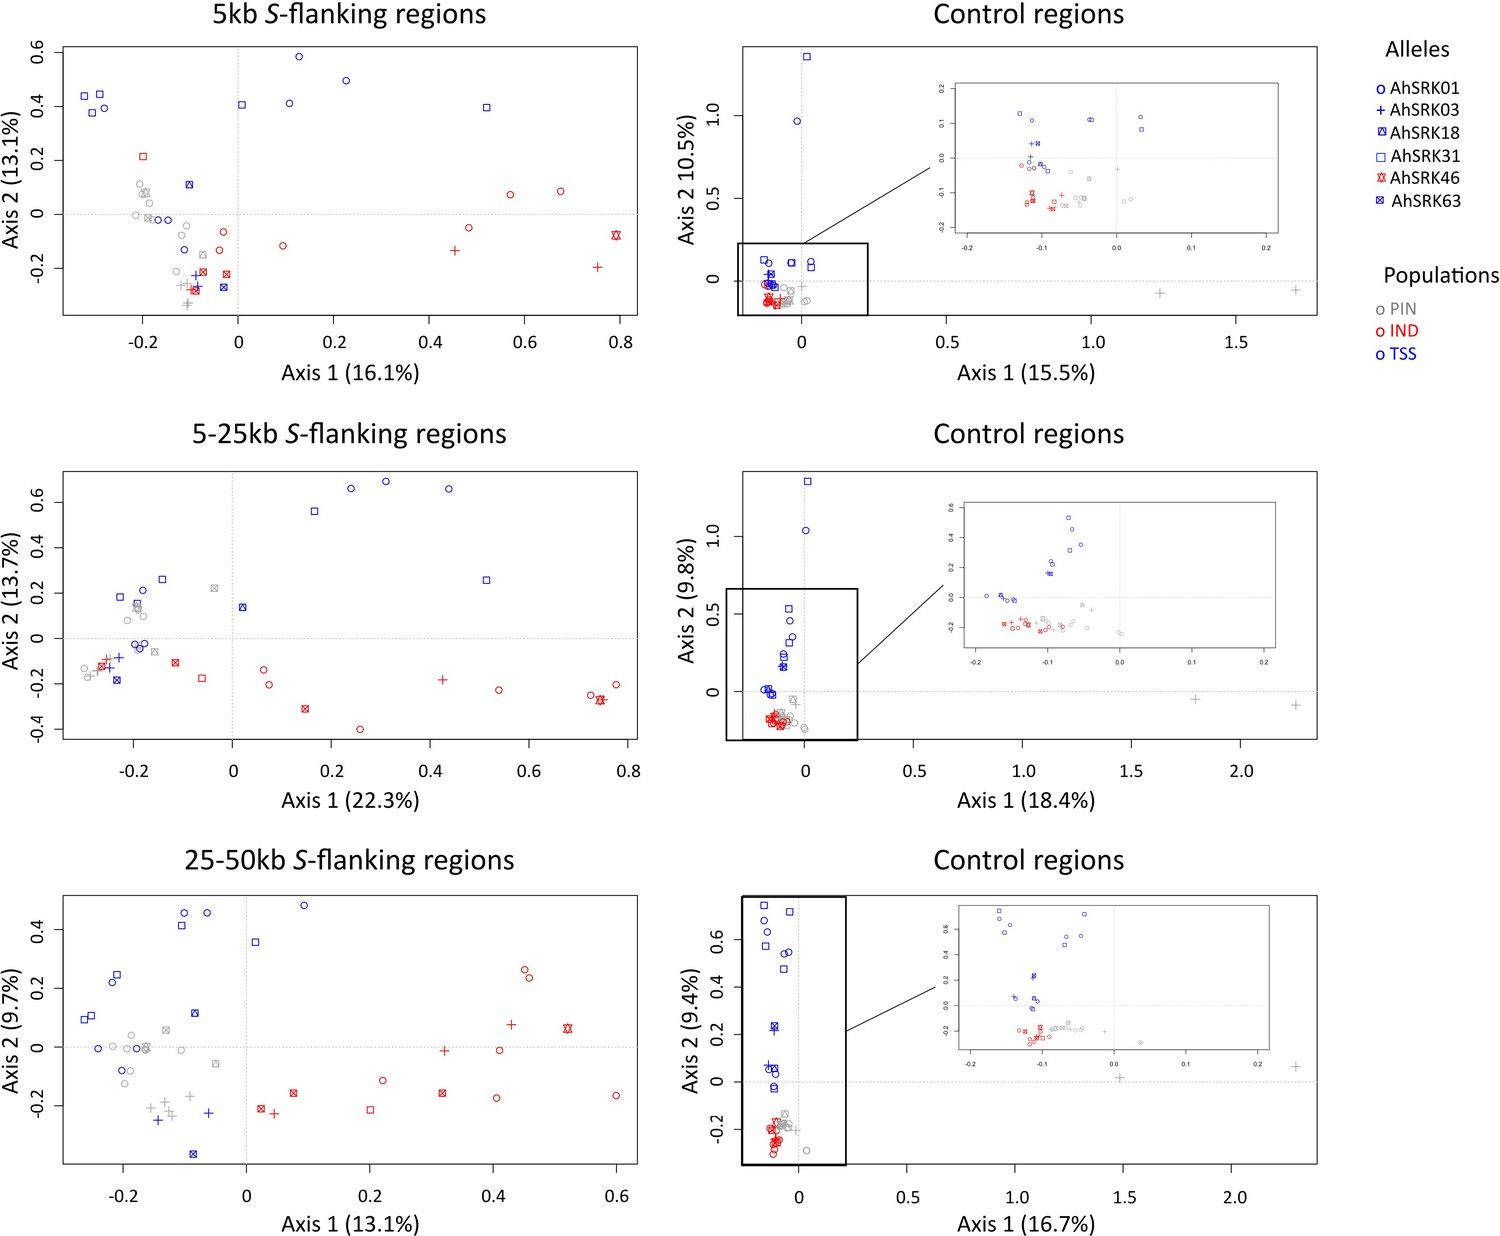
Analysis of major components (AMC) obtained for haplotypes of A. lyrata (of the PIN: grey dots, IND: red dots; and TSS: blue dots) populations based on the SNPs in the first 5 kb, between 5 and 25 kb, and between 25 kb and 50 kb away from the S-locus.
The S-allele to which the SNPs are linked are represented by different symbols. The right panels show the analysis on control regions, each time matching the number of SNPs with that of the corresponding linked regions (left panels).
Figure 2—figure supplement 3
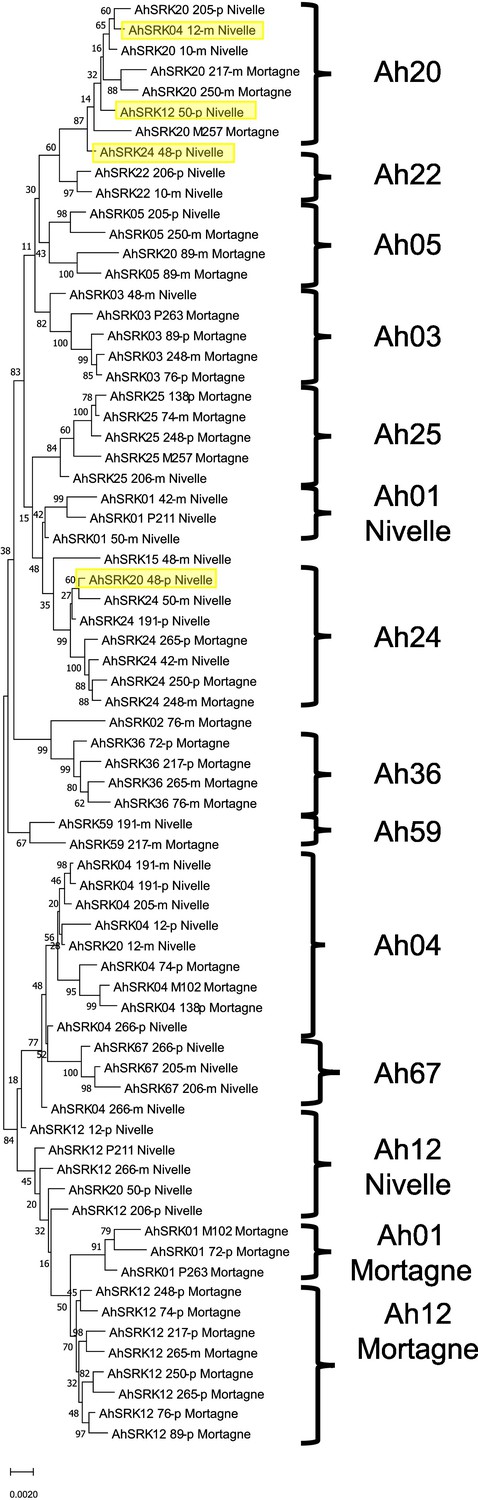
Phylogenetic tree obtained by maximum likelihood for haplotypes of A. halleri (populations Nivelle and Mortagne) across the first 25 kb flanking the S-locus.
The Tamura-Nei model was used and the percentage of trees in which the associated haplotypes clustered together is shown next to the branches. The tree is drawn to scale, with branch lengths measured in the number of substitutions per site. The black braces indicate haplotypes clustering by populations. The overall pattern shows a structure by S-alleles, with exceptions highlighted in yellow.
Figure 2—figure supplement 4
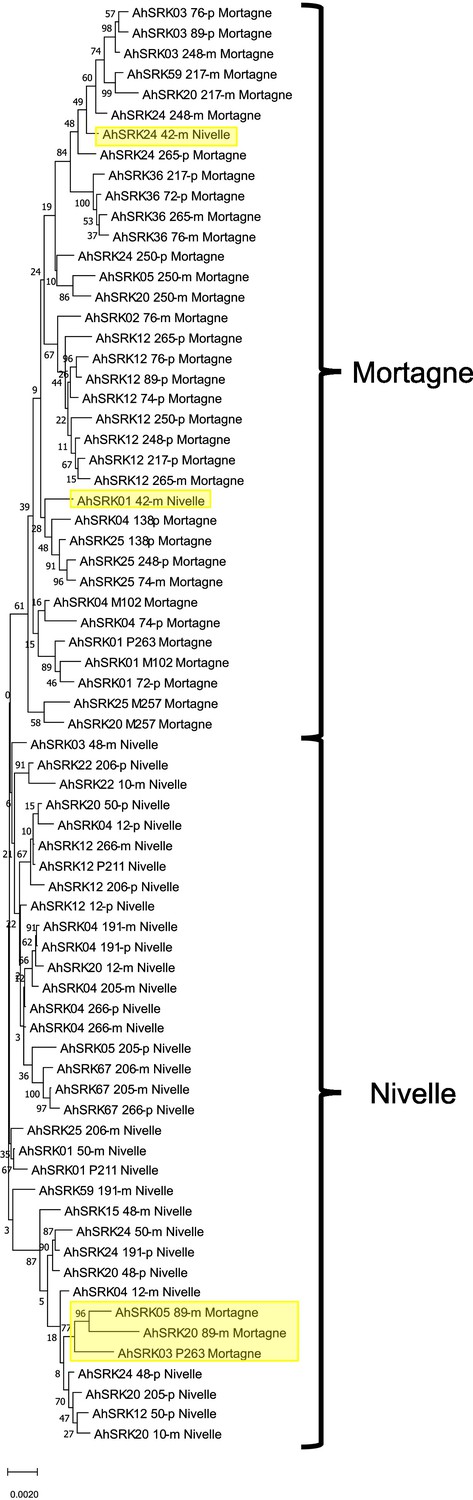
Phylogenetic tree obtained by maximum likelihood for haplotypes of A. halleri (populations Nivelle and Mortagne) based on the nucleotide positions between 25 kb and 50 kb away from the S-locus.
The Tamura-Nei model was used and the percentage of trees in which the associated haplotypes clustered together is shown next to the branches. The tree is drawn to scale, with branch lengths measured in the number of substitutions per site. The black braces indicate haplotypes clustering by populations. The overall pattern shows a structure by S-alleles, with exceptions highlighted in yellow.
Figure 2—figure supplement 5
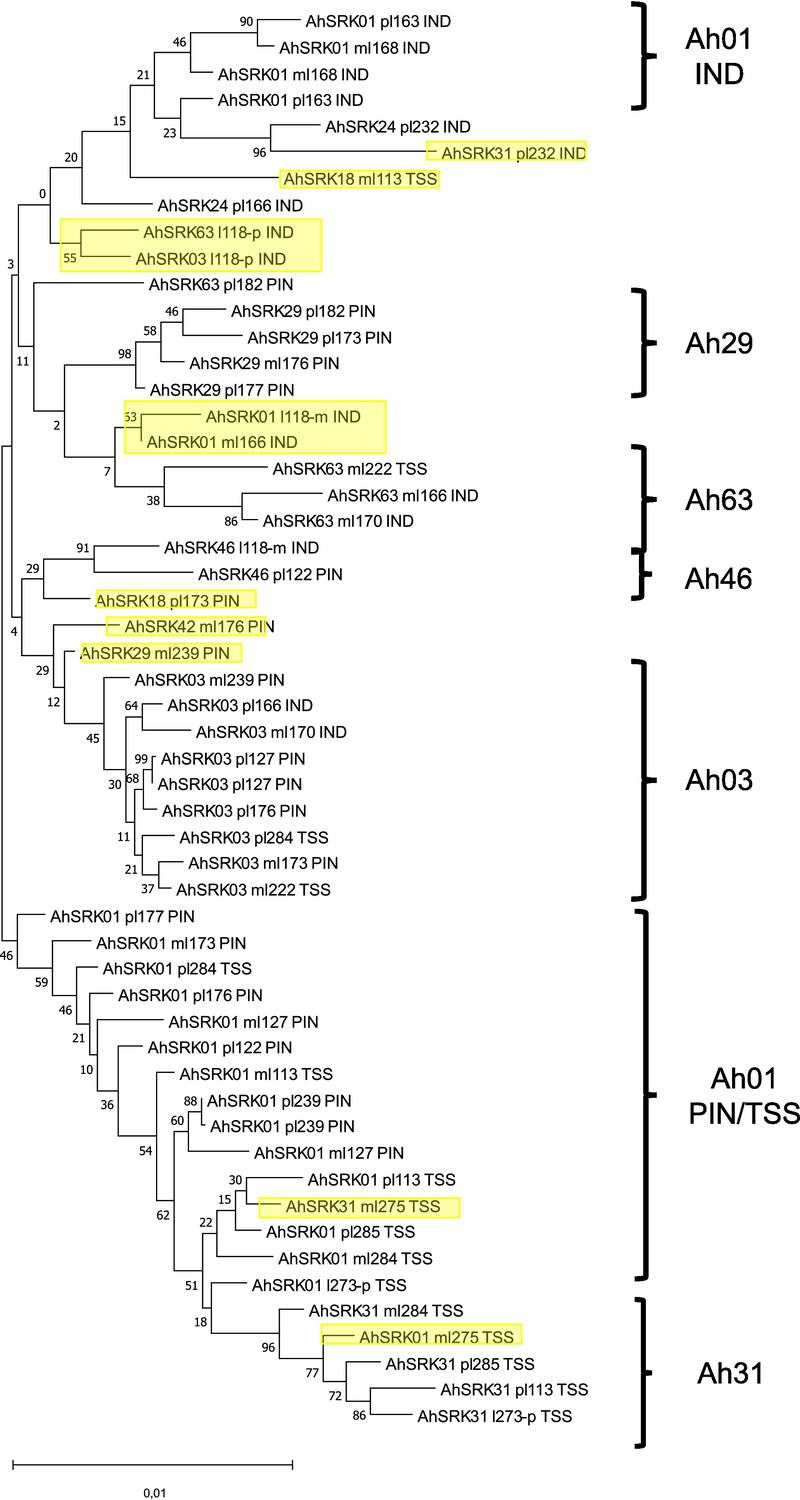
Phylogenetic tree obtained by maximum likelihood for haplotypes of A. lyrata (populations PIN, IND, TSS) across the first 5 kb flanking the S-locus.
The Tamura-Nei model was used and the percentage of trees in which the associated haplotypes clustered together is shown next to the branches. The tree is drawn to scale, with branch lengths measured in the number of substitutions per site. The black braces indicate haplotypes clustering by populations. The overall pattern shows a structure by S-alleles, with exceptions highlighted in yellow.
Figure 2—figure supplement 6
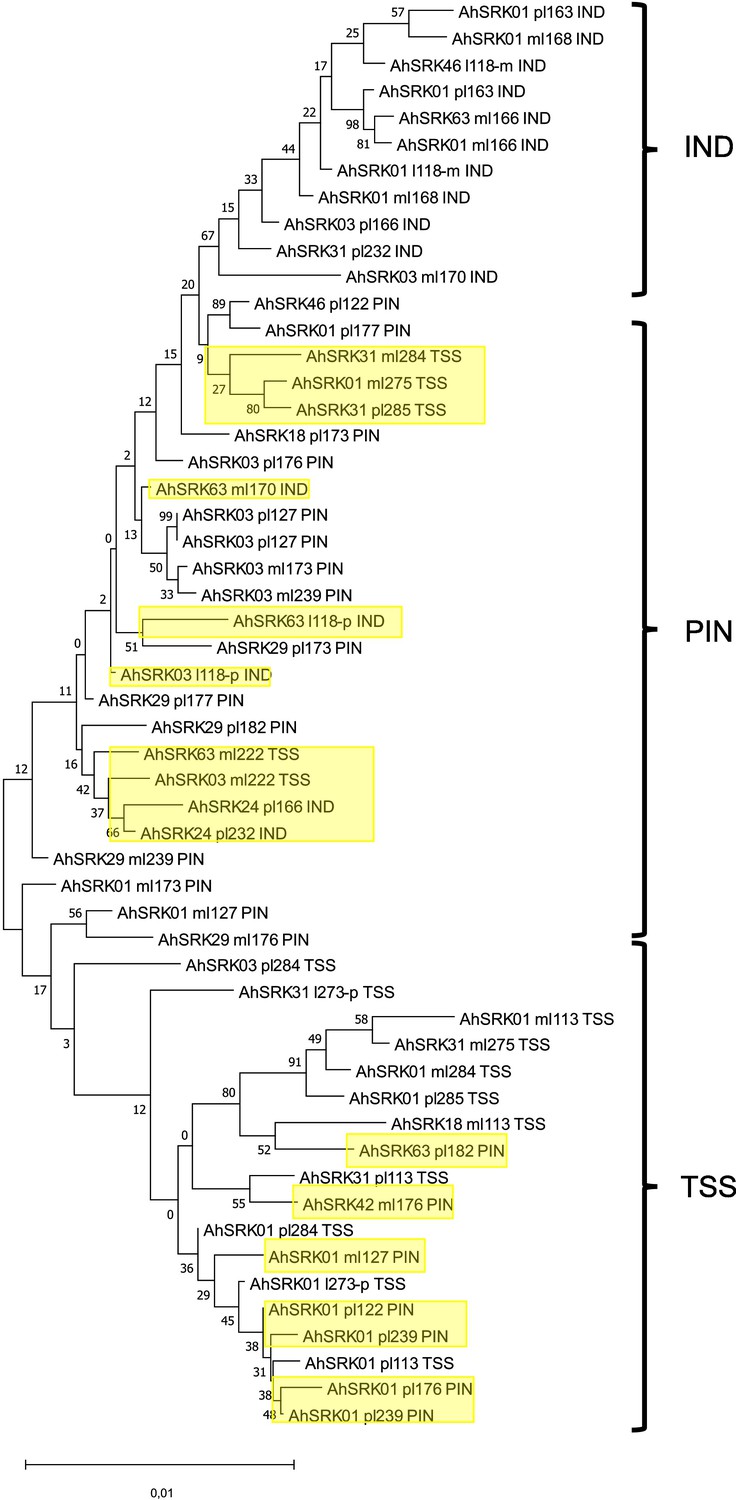
Phylogenetic tree obtained by maximum likelihood for haplotypes of A. lyrata (populations PIN, IND, TSS) based on the nucleotide positions between 5 kb and 10 kb away from the S-locus.
The Tamura-Nei model was used and the percentage of trees in which the associated haplotypes clustered together is shown next to the branches. The tree is drawn to scale, with branch lengths measured in the number of substitutions per site. The black braces indicate haplotypes clustering by populations. The overall pattern shows a structure by S-alleles, with exceptions highlighted in yellow.
Figure 2—figure supplement 7
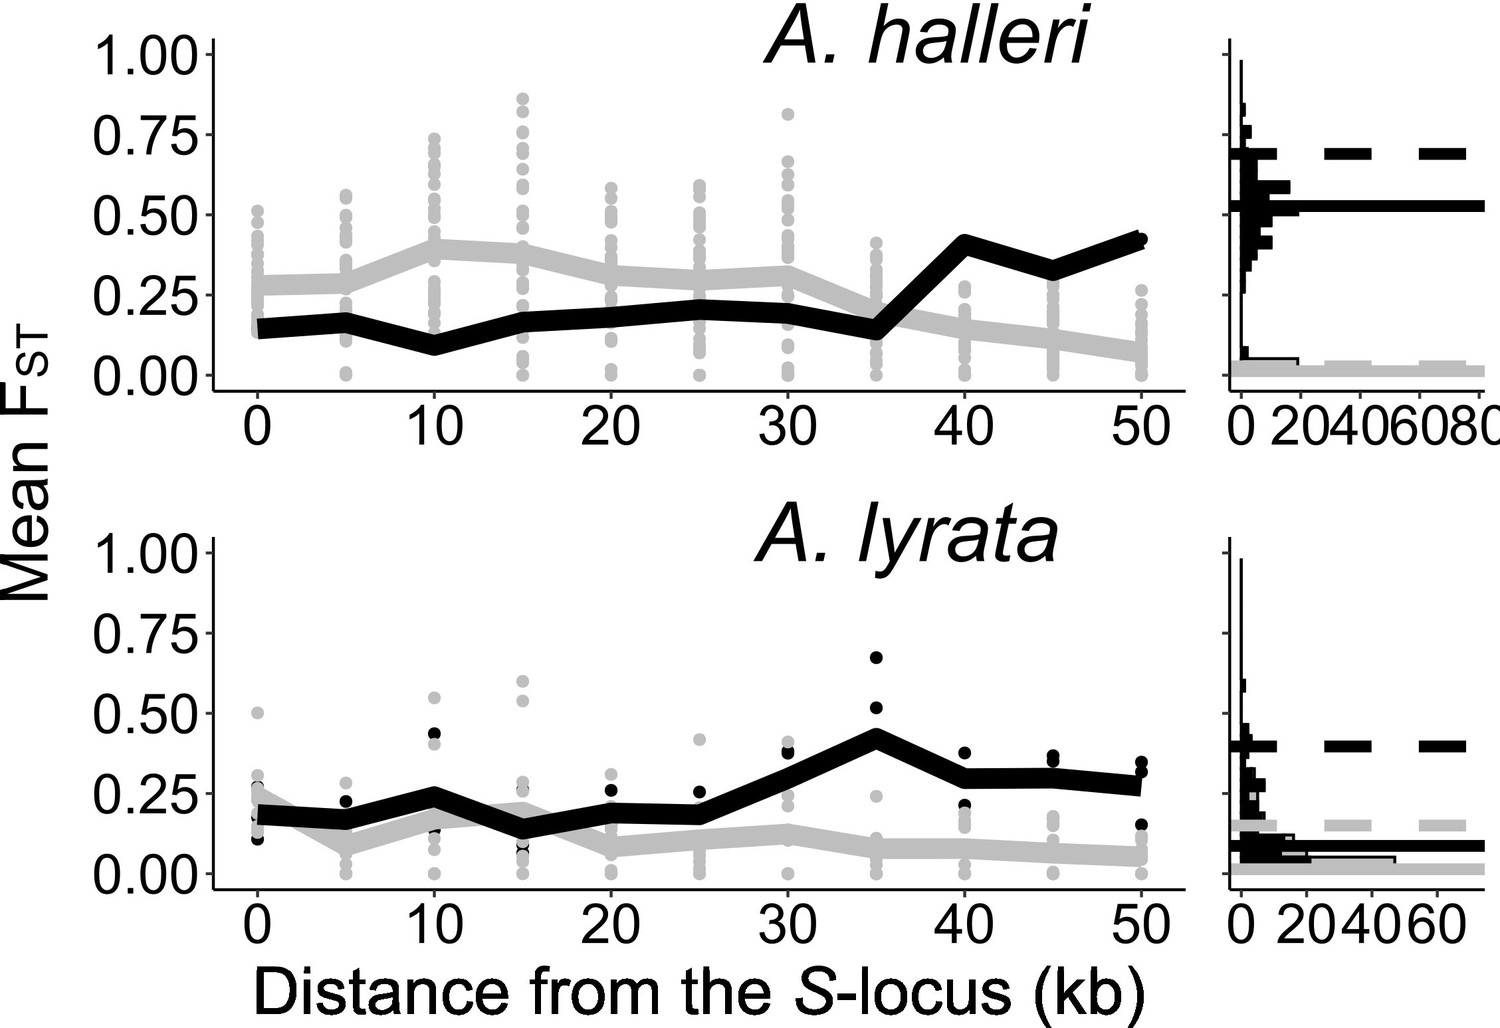
The genetic structure of SNPs in the S-locus flanking regions in A. halleri and A. lyrata.
Left: mean FST (lines) and FST by pair (point) analysed among S-alleles (grey) or among populations (black) in 5 kb windows in the S-locus flanking regions. Right: distribution (count) of FST in the control regions analysed among S-alleles (grey bars) or among populations (black bars). The 95% percentiles of the distributions are represented by dotted lines and the medians by solid lines.
Figure 2—figure supplement 8
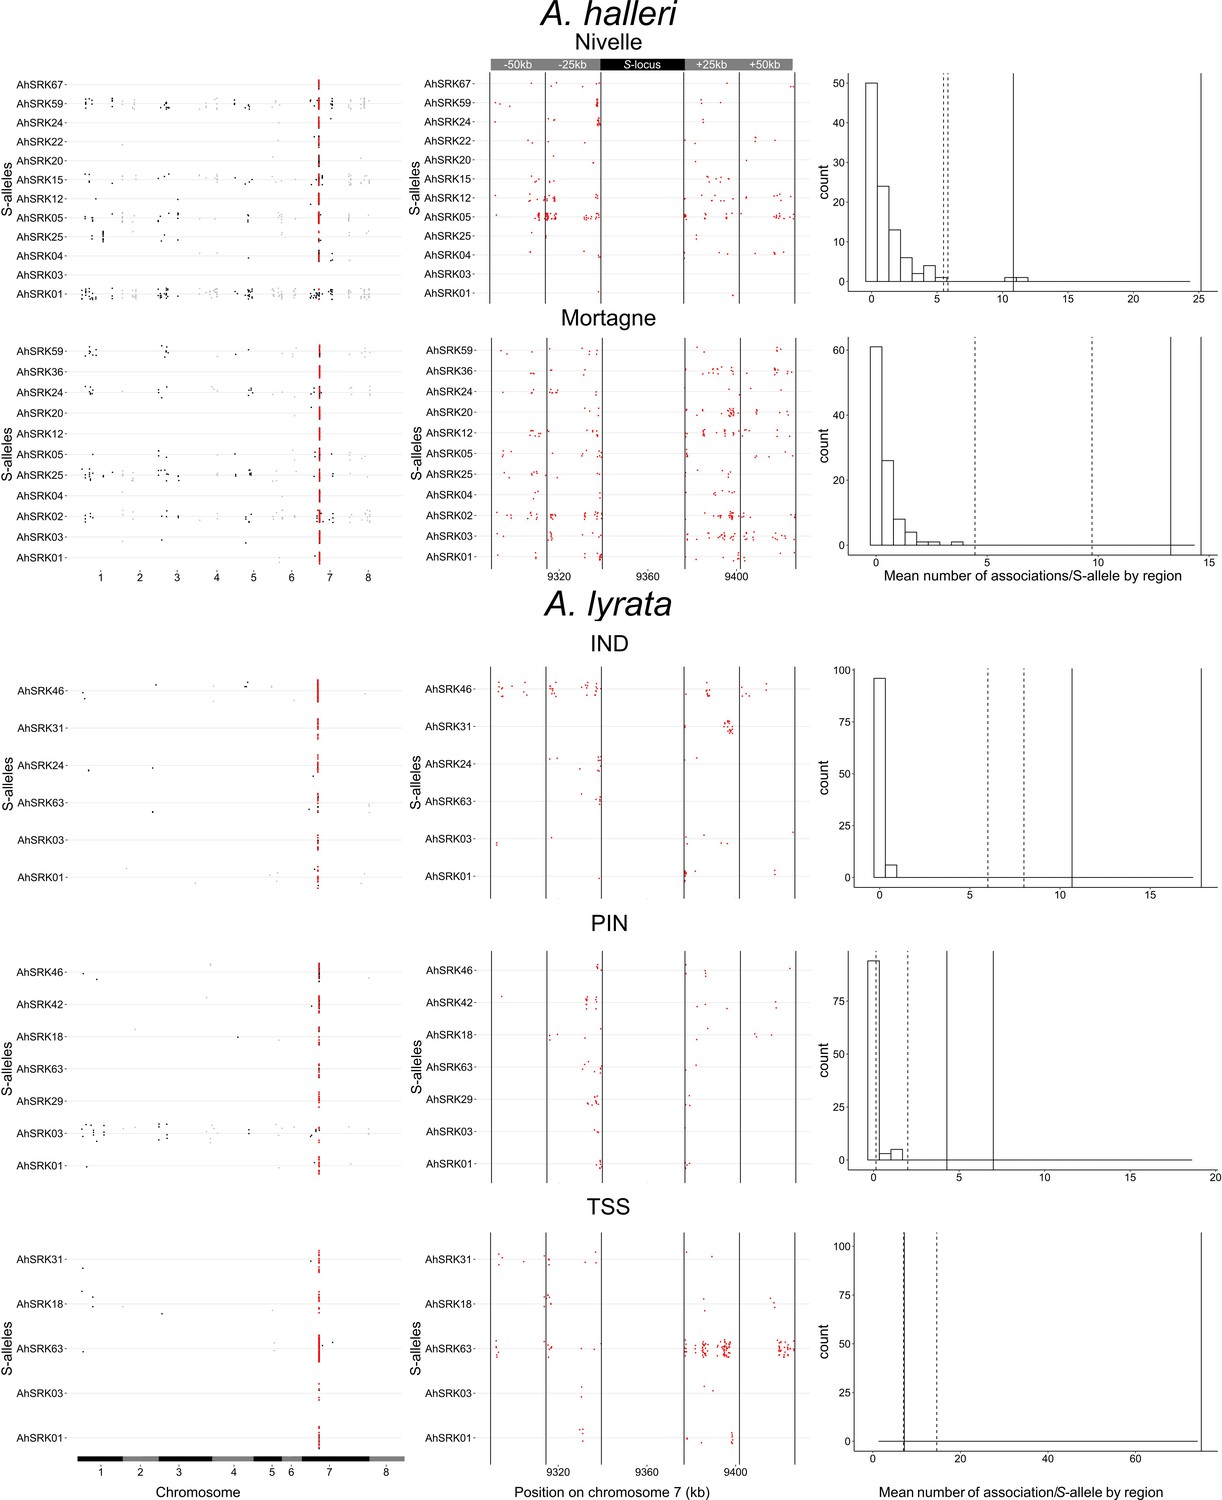
Patterns of genetic associations between S-alleles and SNPs across the genome.
Each dot corresponds to an SNP showing statistically significant association (top 0.1%) with a given S-allele. The left panel confirms that SNPs physically linked to the S-locus (in red) are considerably more likely to show statistical associations with S-alleles. The chromosomes are signified by alternance of black and grey. The middle panel shows a zoom on the 50 kb regions flanking the S-locus and shows that the statistical association extends over long distances, at least for some S-alleles. Each region of 25 kb is delimited by vertical lines. The right panel shows that the observed number of associated SNPs in the linked regions far exceeds that in regions of identical size from control regions. The histogram shows the distribution across control regions of the mean number of significantly associated SNPs per S-allele. The vertical lines correspond to the mean number of significantly associated SNPs in the first 25 kb (solid lines) and the 25–50 kb interval (dashed lines) away from S-locus.
Figure 3
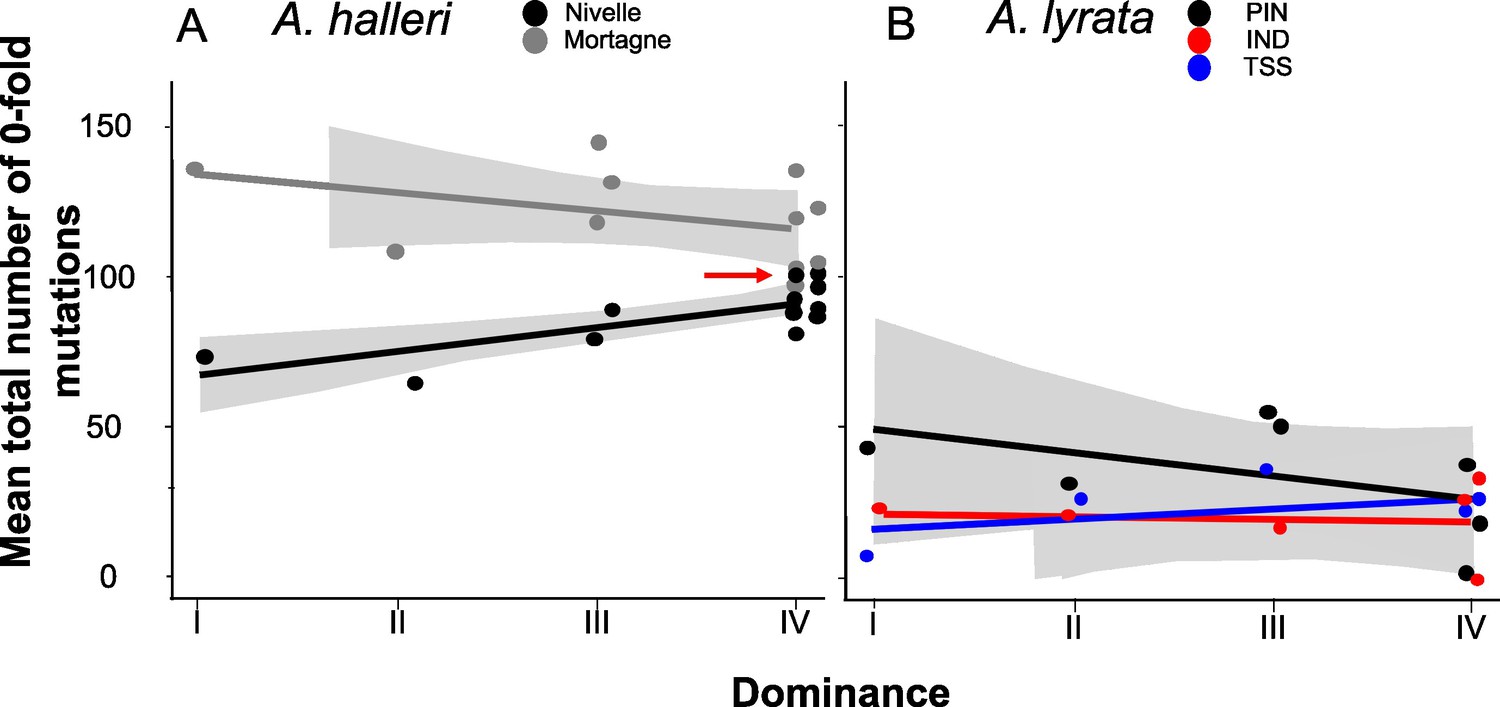
No overall effect of S-allele dominance on the total number of zerofold degenerate mutations (S0f) in the linked genomic regions within 25 kb.
Each dot represents the mean number of mutations observed among haplotypes linked to one S-allele in one population. The correlations evaluated by a generalised linear model (GLM) are represented by lines, with confidence intervals represented in grey. The dominance was considered a continuous variable. (A) A. halleri. Black dots correspond to the Nivelle population, grey dots to the Mortagne population. The red arrow points to the copy of Ah15, corresponding to the S-allele whose sheltered load was phenotypically characterised by Llaurens et al., 2009bLlaurens et al., 2009b in Nivelle. (B) A. lyrata. Red dots correspond to the IND population, black dots to the PIN population, and blue dots to the TSS population.
Figure 4
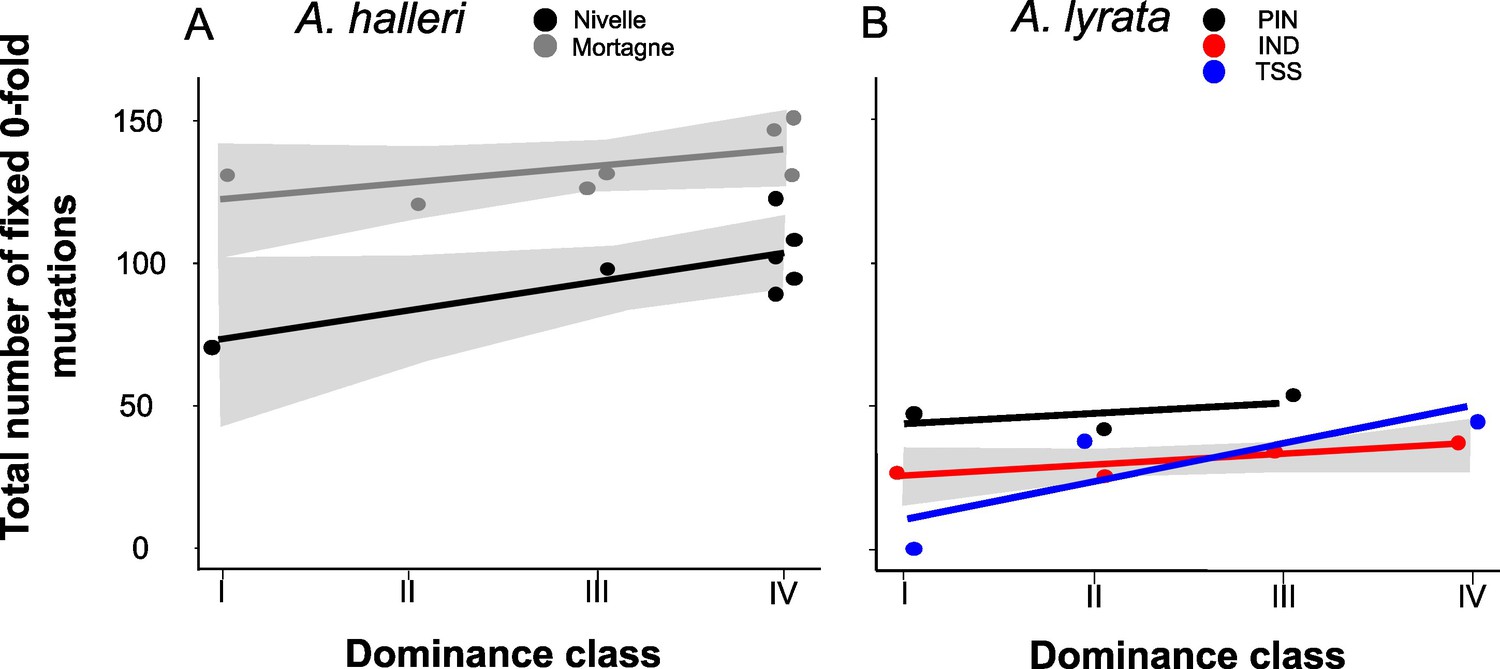
The number of zerofold degenerate mutations fixed in the 25 kb regions flanking the S-locus increases with dominance of the S-allele associated.
Each dot represents the value obtained for haplotypes linked to one S-allele in one population. The correlations evaluated by a generalised linear model (GLM) are represented by lines, with confidence intervals represented in grey. The dominance was considered as a continuous variable. (A) A. halleri. Black dots correspond to the Nivelle population, grey dots to the Mortagne population. (B) A. lyrata. Red dots correspond to the IND population, black dots to the PIN population, and blue dots to the TSS population.
Figure 5
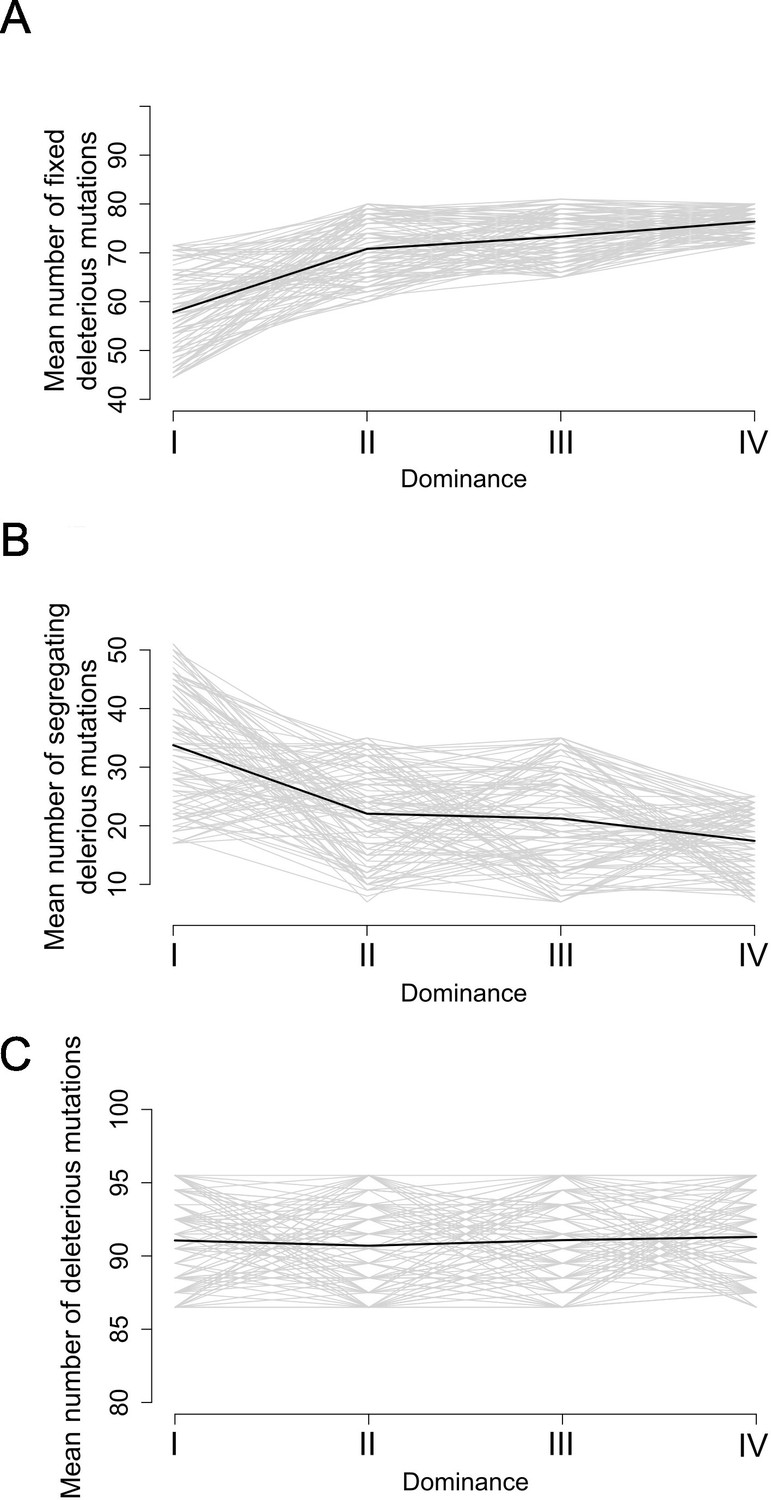
Stochastic simulations confirm the contrasted architecture of the load of deleterious mutations linked to dominant vs. recessive S-alleles.
Number of fixed (A), segregating (B), and total (C) deleterious mutations linked to S-alleles at four different levels of dominance (I<II < III<IV). The means (bold lines) were estimated per S-allele dominance classes over 100 replicate simulations after discarding an initial burn-in of 100,000 generations. h = 0. s = 0.01.
Tables
Table 1
Proportion of S-locus homozygous offspring having reached the reproductive stage for three different S-alleles.
The test is performed relative to the expected proportion of homozygous genotypes in the offspring (25% when both parents are heterozygous; 50% when one of the parents is homozygous and the other heterozygous).
| S-allele | Level of dominance | Number of seedlings having reached the reproductive stage | Observed proportion of homozygotes | Ratio of the observed to expected proportion of homozygous genotypes (p-value*) | Number of heterozygotes with the S-allele (p-values*) |
|---|---|---|---|---|---|
| Ah01 | I | 35 | 0.29 | 1.14 (0.76) | 19 (0.40; 0.90) |
| Ah03 | II | 27 | 0.074 | 0.3 (0.02) | 17 (1; 0.69) |
| Ah04 | III | 96 | 0.479 | 0.96 (0.39) | 50 |
-
Values departing from Mendelian expectations are figured in bold. For Ah04, the maternal parent was Ah04/Ah04, so all heterozygous offspring carried the S-allele.
-
*
p-Values were obtained after 10,000 random permutations, respectively.
Additional files
-
Supplementary file 1
Protocol used.
(a) Crosses performed to obtain homozygotes for three S-alleles. (b) Trait variation in S-locus homozygous individuals. (c) Trait variation in homozygous at the S-locus for the S-alleles Ah01 and Ah04 between families. (d) Effect of dominance on variation of phenotypic traits in S-locus homozygous individuals. (e) Number of phased haplotypes linked to S-alleles in each sample. (f) Effect of dominance on the accumulation of genetic load in S-flanking regions. (g) S-locus genotypes of individuals sequenced using the capture protocol. (h) S-locus genotypes of the offspring selected for haplotype phasing and the crosses for the study of phenotypic traits. (i) Effect of phytopathogen, phytophagous attacks and oxidative stress on the phenotypic traits. (j) Difference on the phenotypic traits variation between the two families for each allele tested.
- https://cdn.elifesciences.org/articles/94972/elife-94972-supp1-v1.docx
-
MDAR checklist
- https://cdn.elifesciences.org/articles/94972/elife-94972-mdarchecklist1-v1.docx
Download links
A two-part list of links to download the article, or parts of the article, in various formats.
Downloads (link to download the article as PDF)
Open citations (links to open the citations from this article in various online reference manager services)
Cite this article (links to download the citations from this article in formats compatible with various reference manager tools)
The genetic architecture of the load linked to dominant and recessive self-incompatibility alleles in Arabidopsis halleri and Arabidopsis lyrata
eLife 13:RP94972.
https://doi.org/10.7554/eLife.94972.3


