Detection of TurboID fusion proteins by fluorescent streptavidin outcompetes antibody signals and visualises targets not accessible to antibodies
- Biocenter, University of Würzburg, Germany
- Department of Parasitology, Faculty of Science, Charles University in Prague, Czech Republic
Figures
Figure 1 with 2 supplements
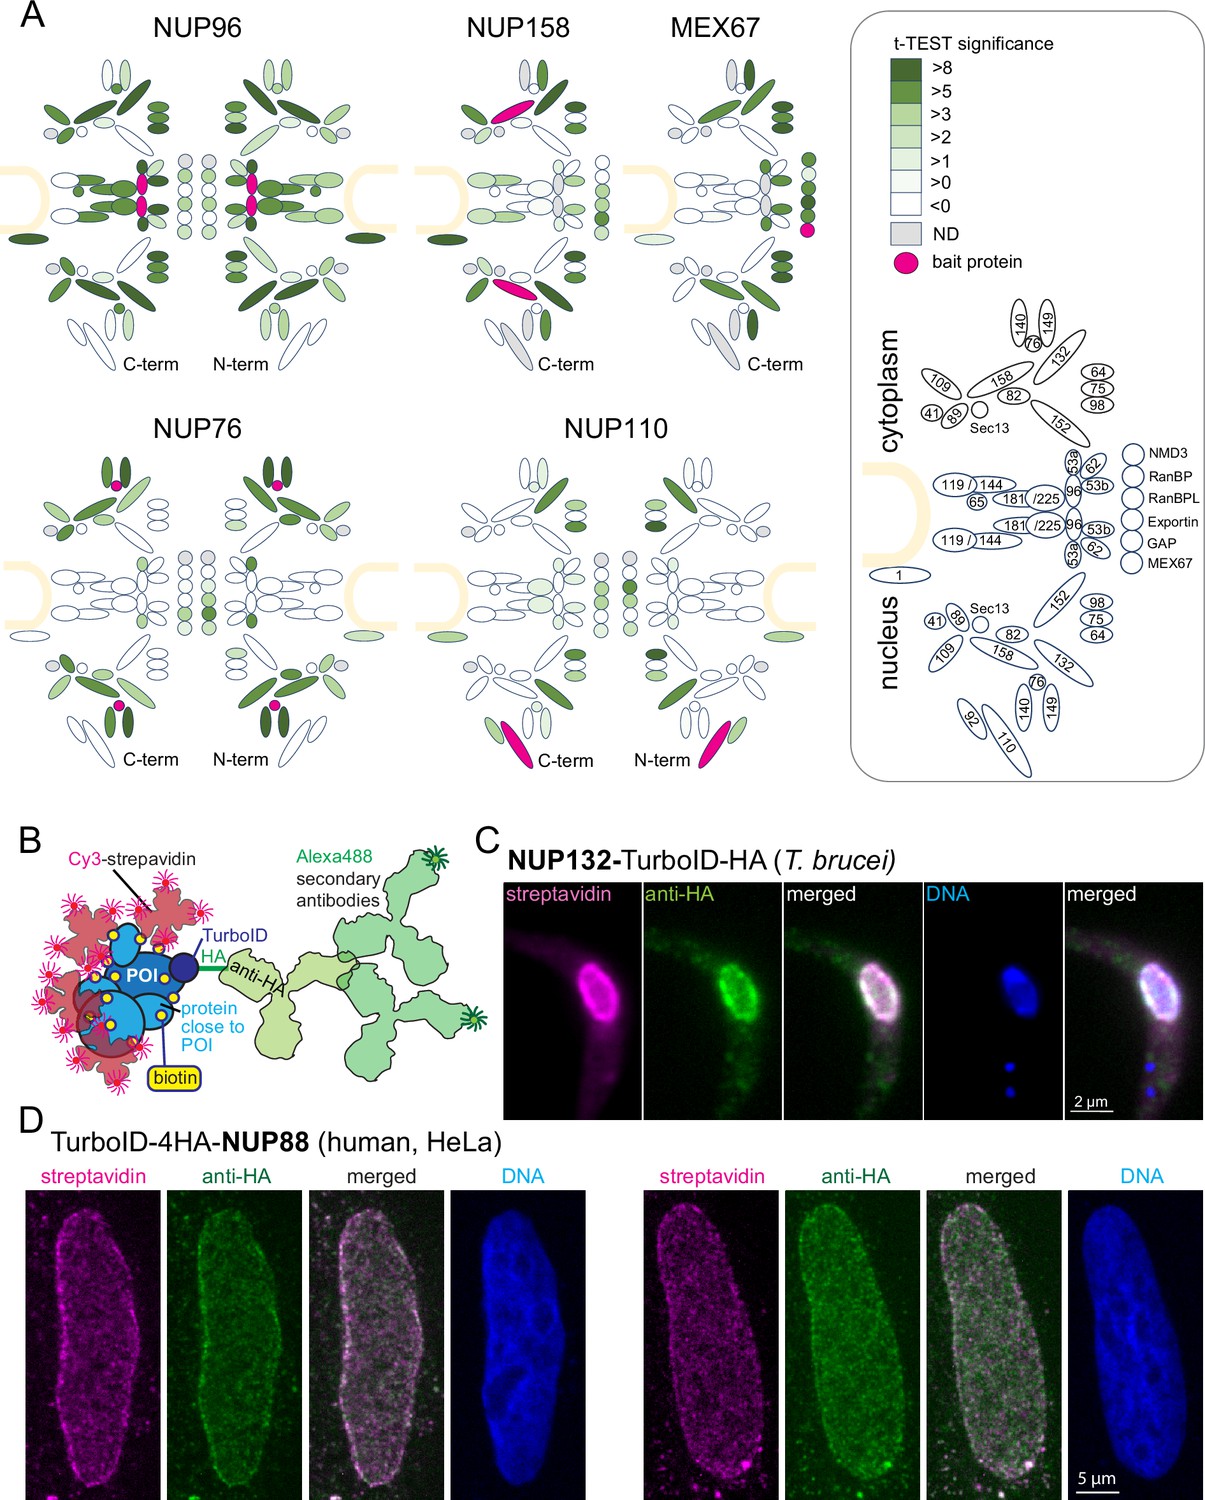
The TurboID biotinylation labeling radius is sufficiently small to allow streptavidin-based imaging of target proteins by light microscopy.
(A) Schematic representation of the trypanosome NPC Obado et al., 2016 including selected transport factors and their enrichment observed in TurboID experiments followed by streptavidin affinity capture and liquid chromatography coupled to tandem mass spectrometry (LC-MS/MS) analysis. Proteins quantified are filled in shades of green representative of the corresponding t-test difference increments. The respective bait protein is drawn in pink and undetected proteins are in grey. NUP96, NUP76, and NUP110 experiments were analysed with TurboID-HA fusions at both respective termini (as indicated). The nuclear envelope is drawn in sand and nucleoporins and transport factors are numbered in the legend (right) according to Obado et al., 2016 (NMD3, Tb927.7.970; RanBP1, Tb927.11.3380; RanBPL, Tb927.10.8650; exportin 1, Tb927.11.14340; GAP, Tb927.10.7680),(B) Schematics illustrating the imaging concept for a protein of interest (POI) by either Cy3-streptavidin or anti-HA coupled with secondary Alexa488-labelled antibodies. (C–D) Nuclear pore proteins of Trypanosoma brucei (C) and HeLa cells (D) were expressed fused to the streptavidin-HA tandem tag and detected with streptavidin-cy3 (pink) and anti-HA (green). Representative single-plane images of a Z-stack is shown, as raw data.
Figure 1—figure supplement 1
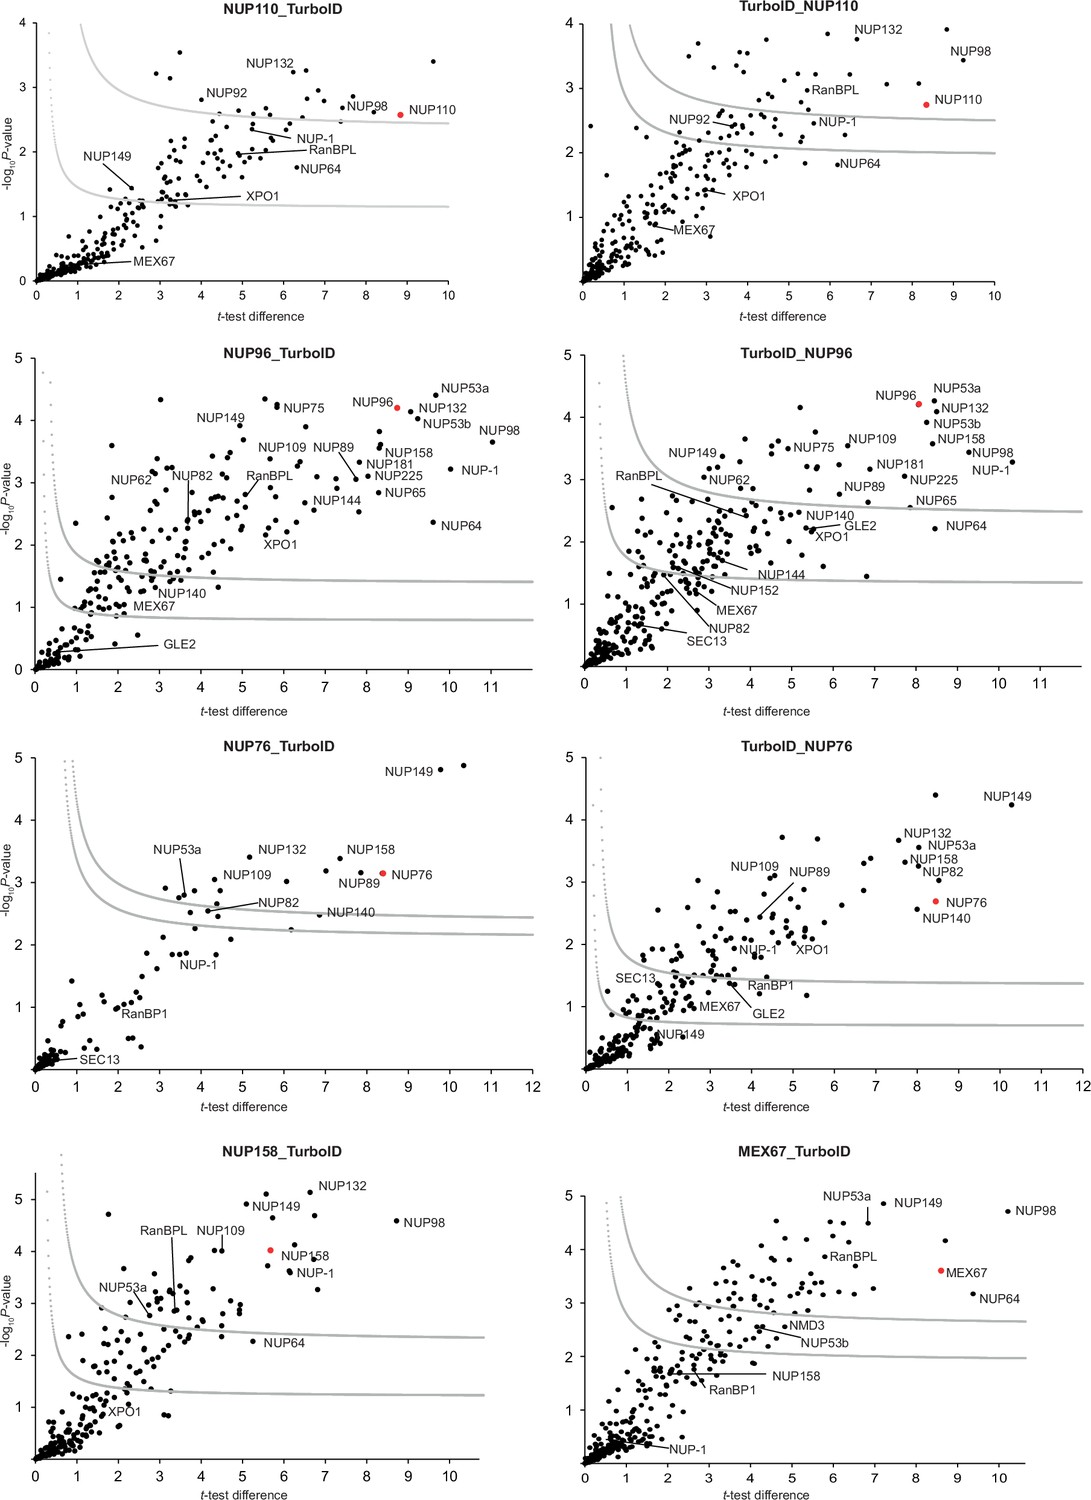
Statistical analysis of NUP TurboID experiments.
Statistical analysis of NUP TurboID experiments. Hawaii plot (multiple volcano plots) of label-free quantification (LFQ) results of the BioID experiments for NUP110, NUP96 and NUP76 with fused TurboID-HA tag either at the N- or C-terminus, and C-terminally tagged NUP158 and MEX67. All samples were prepared at least in duplicate. To generate the volcano plots, the −log10P-value was plotted versus the t-test difference (difference between means), comparing each respective bait experiment to the wt control. Potential interactors were classified according to their position in the plot, applying cutoff curves for ‘significant class A’ (SigA; grey, upper curve; FDR = 0.01, s0=0.1) and ‘significant class B’ (SigB; grey, lower curve; FDR = 0.05, s0=0.1), respectively. Bait proteins are indicated by a red dot, known NUPs and transport factors (as shown in Figure 1A) are labelled and LFQ data is given in Supplementary file 2.
Figure 1—figure supplement 2
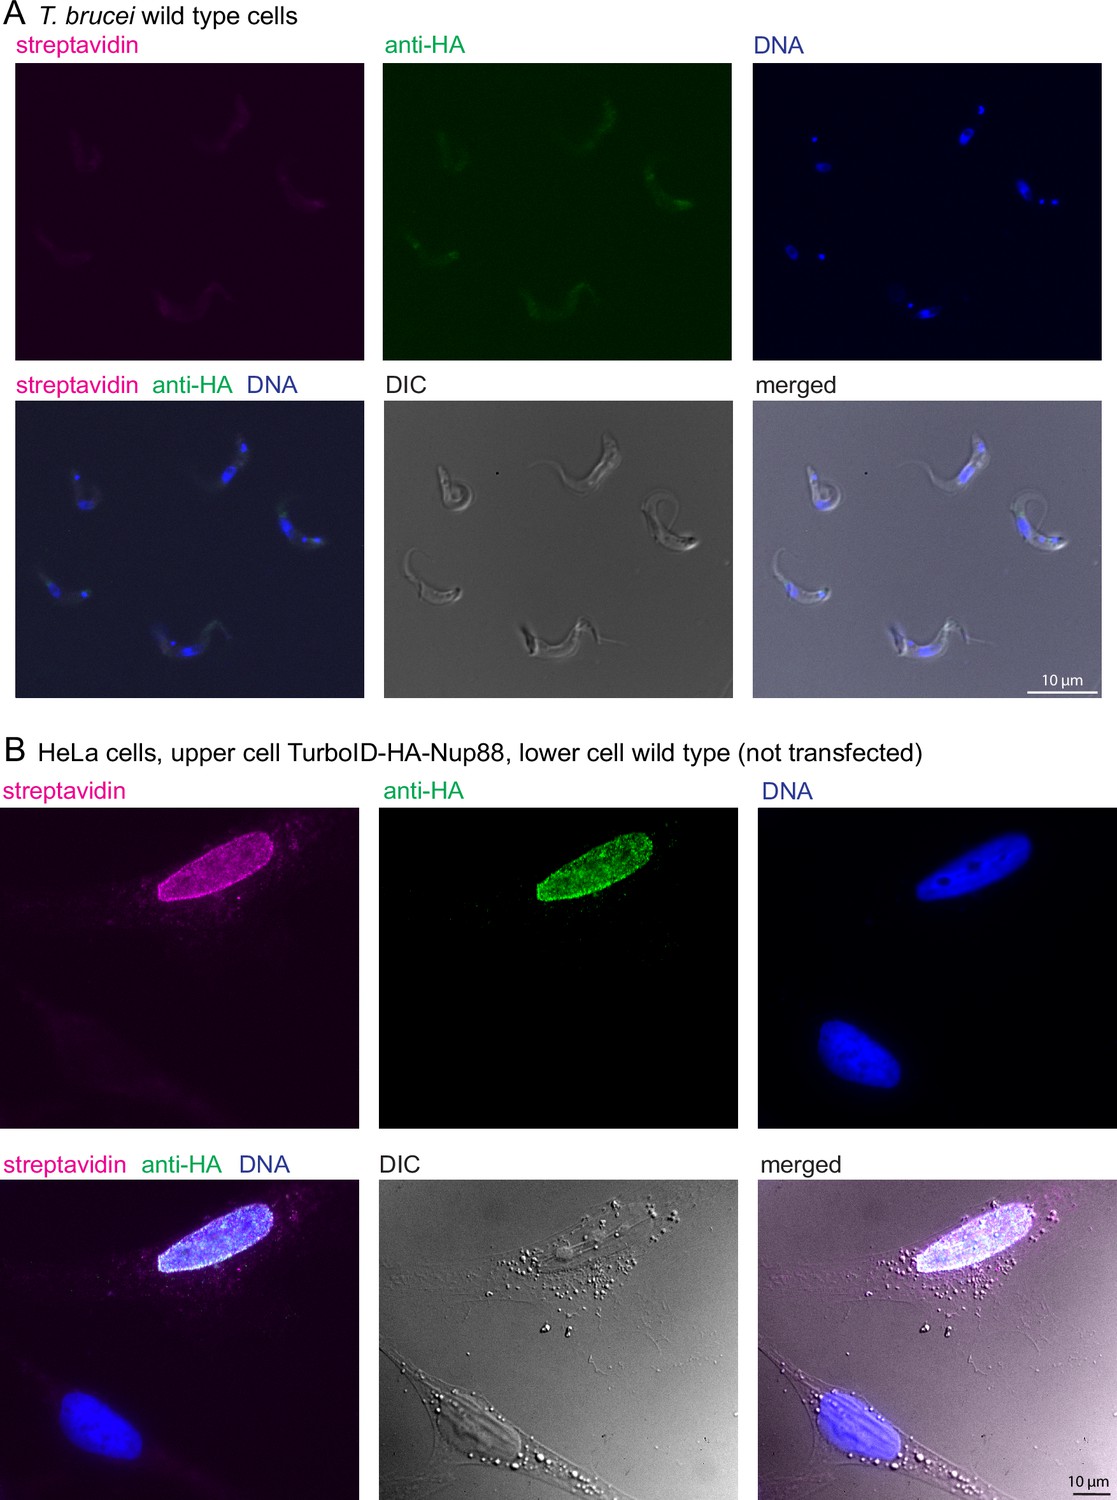
Streptavidin and anti-HA signal of wild type cells.
(A)T. brucei wild-type cells were labelled with streptavidin and anti-HA. A single plane image is shown. (B) Streptavidin imaging of HeLa cells: the upper cell is transfected with TurboID-HA-NUP88, the lower one is not.
Figure 2 with 2 supplements
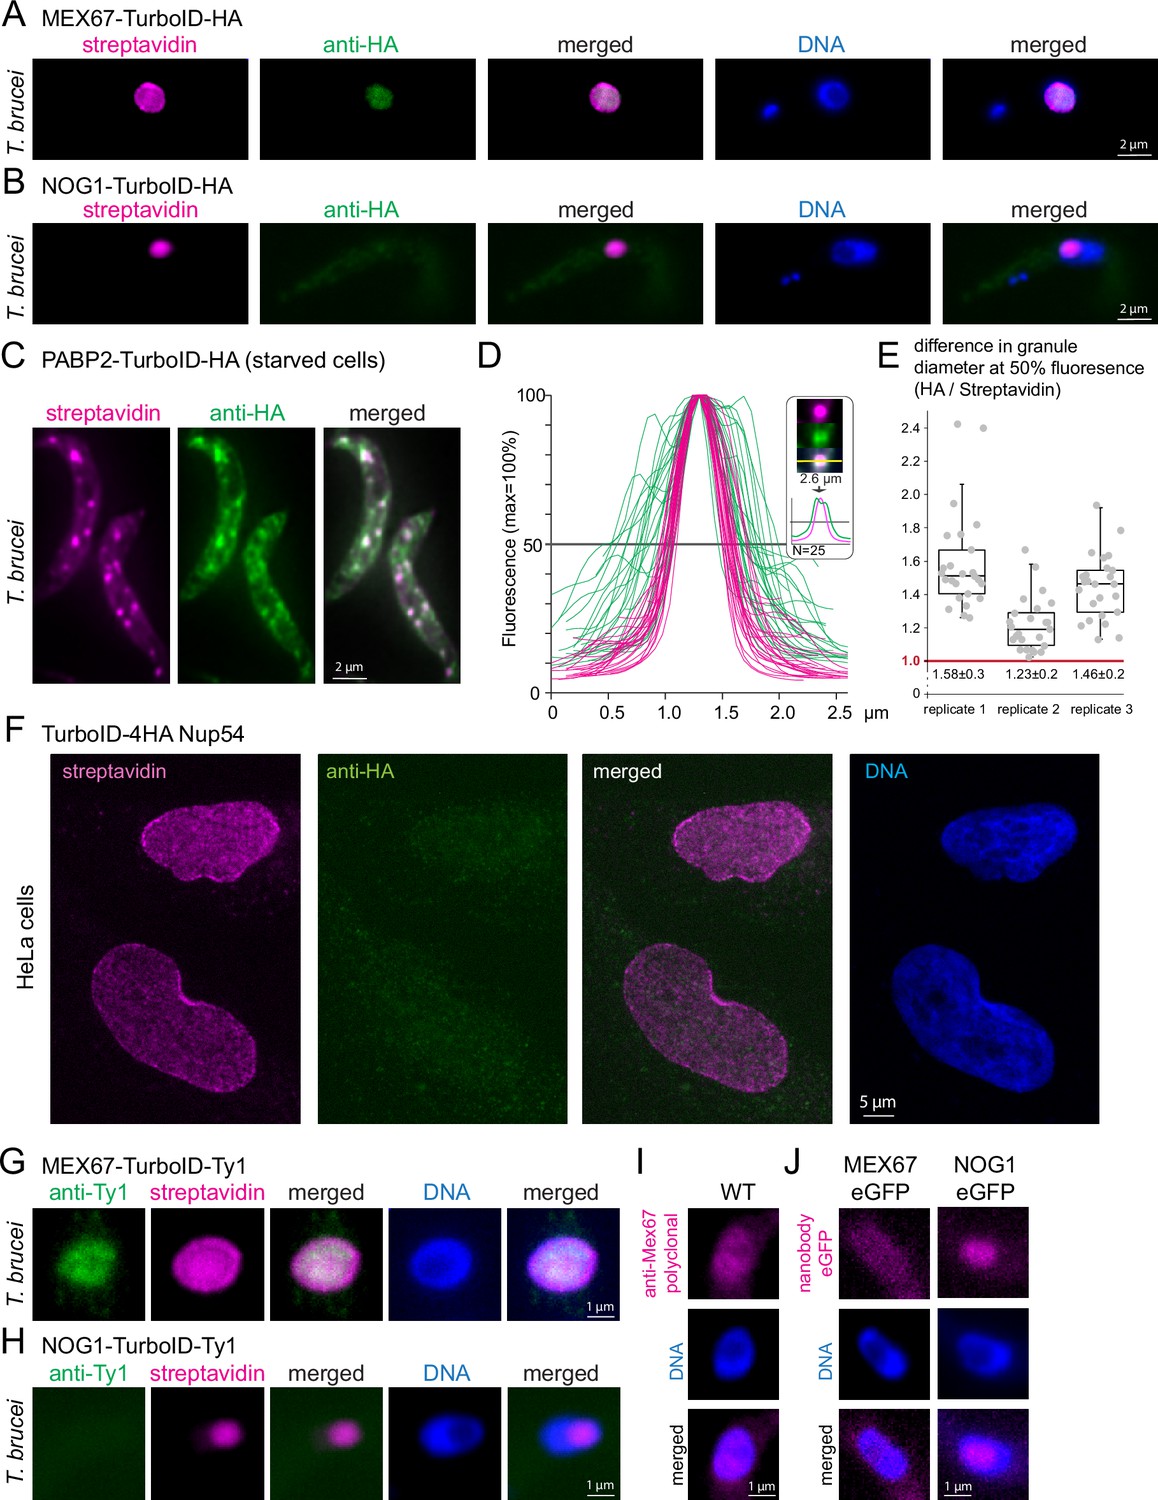
Streptavidin can detect targets within phase-separated regions, while most antibodies fail.
(A–B)T. brucei MEX67 (A) and T. brucei nucleolar protein NOG1 (B) were expressed fused to a C-terminal TurboID-HA tandem tag and cells probed with streptavidin-cy3 (pink) and by anti-HA immunofluorescence (green). Representative single plane images of an unprocessed Z-stack series are shown. (C–E) Cells expressing the stress granule marker protein PABP2 fused to TurboID-HA were starved (2 hr PBS) and starvation stress granules detected by streptavidin (pink, Cy3) and anti-HA (green, Alexa488). The starvation experiment was performed in biological triplicates. One representative image of starved cells is shown as Z-stack projection (72 slices a 140 nm, sum slices) in C. For each replicate, intensity profiles across one of the larger granules of the cell were measured for 25 cells in both fluorescence channels. The profiles for replicate 1 are shown in D. For each granule, the granule diameter was calculated from the profiles at 50% fluorescence and the difference in diameter between the HA- and streptavidin stain is presented in E for each replicate, as quotient of granule diameters. Note that despite differences between the three replicates, likely arisen from starvation conditions being not 100% reproducible, the HA stain consistently delivered a larger granule diameter than the streptavidin stain, consistent with preferentially peripheral staining of the granule by anti-HA. For replicate 2, the fluorophores were switched, with essentially the same result (Figure 2—figure supplement 1). (F) Human NUP54 fused to TurboID-4HA was expressed in HeLa cells and cells were probed with both anti-HA (green, Alexa488) and streptavidin (Cy3, shown in pink). Streptavidin, but not anti-HA detects NUP54 at the nuclear pores. A single plane image of a Z-stack is shown as raw data. (G and H) T. brucei MEX67 (G) and NOG1 (H) were expressed as TurboID-Ty1 fusion proteins and detected with streptavidin (Cy3, shown in pink) and anti-Ty1 (BB2, green). Representative single plane images of unprocessed Z-stack images are shown. (I) Trypanosome wild-type (WT) cells were probed for MEX67 with polyclonal antiserum (kind gift of Mark Carrington, University of Cambridge; secondary antibody Alexa 488, shown in pink). One representative single plane image of an unprocessed Z-stack image is shown.(J) T. brucei MEX67 (left) and NOG1 (right) were expressed as eGFP fusion proteins and detected with Cy5 labelled eGFP nanobodies. Representative single plane images of unprocessed Z-stack images are shown.
Figure 2—figure supplement 1
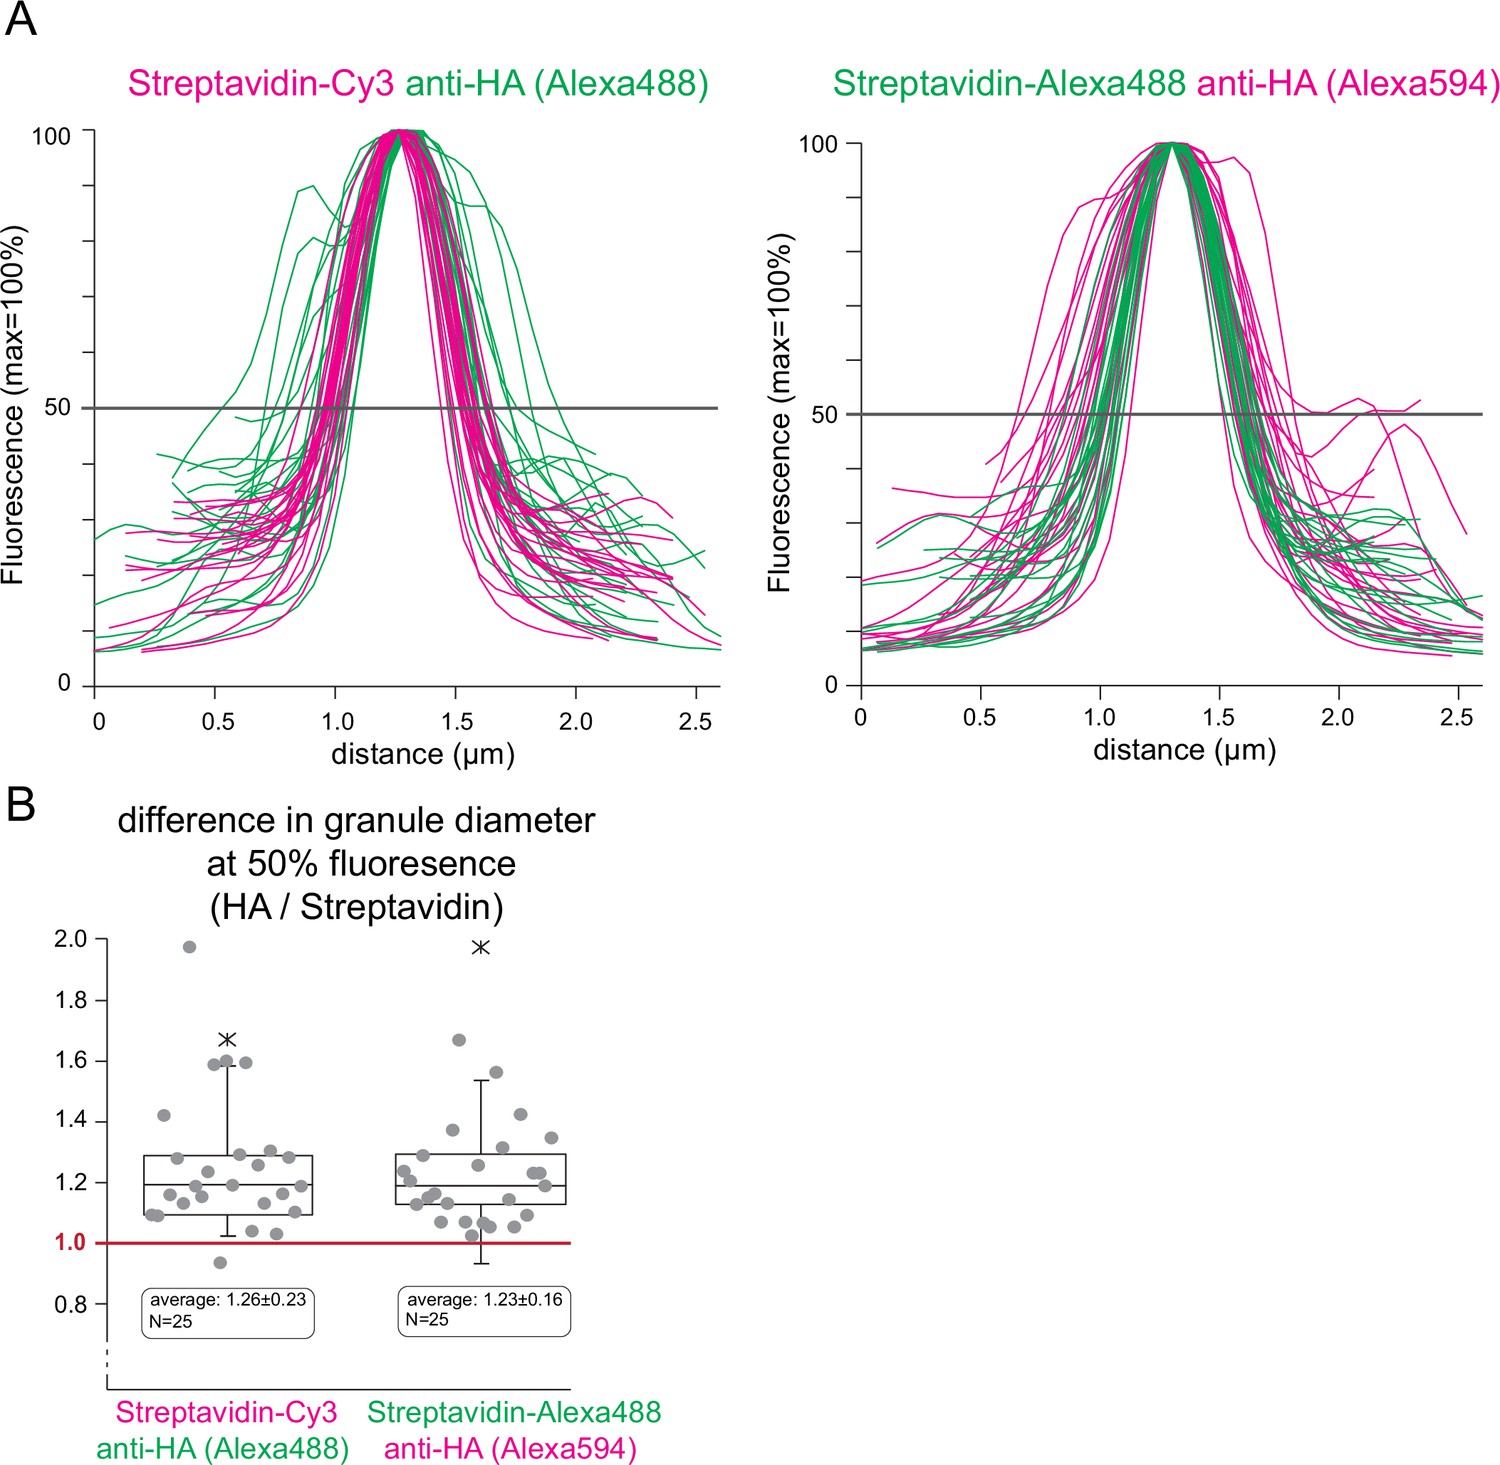
The larger diameter of stress granules of anti-HA stained granules in comparison with streptavidin stained granules is not caused by the different fluorophores.
Cells expressing the stress granule marker protein PABP2 fused to TurboID-HA were starved for 2 hr in PBS. Starvation stress granules were detected by either streptavidin-Cy3 and anti-HA plus Alexa488 secondary antibody or by streptavidin-Alex488 and anti-HA plus Alexa594 secondary antibody. (A) Intensity profiles across one of the larger granules of the cell were measured for 25 cells in both fluorescence channels. (B) For each granule, the granule diameter was calculated from the profiles at 50% fluorescence and the difference in diameter between the HA-stain and the streptavidin stain is presented as the quotient of the granule diameters. There is no significant difference between the two labelling methods (unpaired, two-tailed t-test=0.52). The data were also used as one replicate in Figure 2E.
Figure 2—figure supplement 2
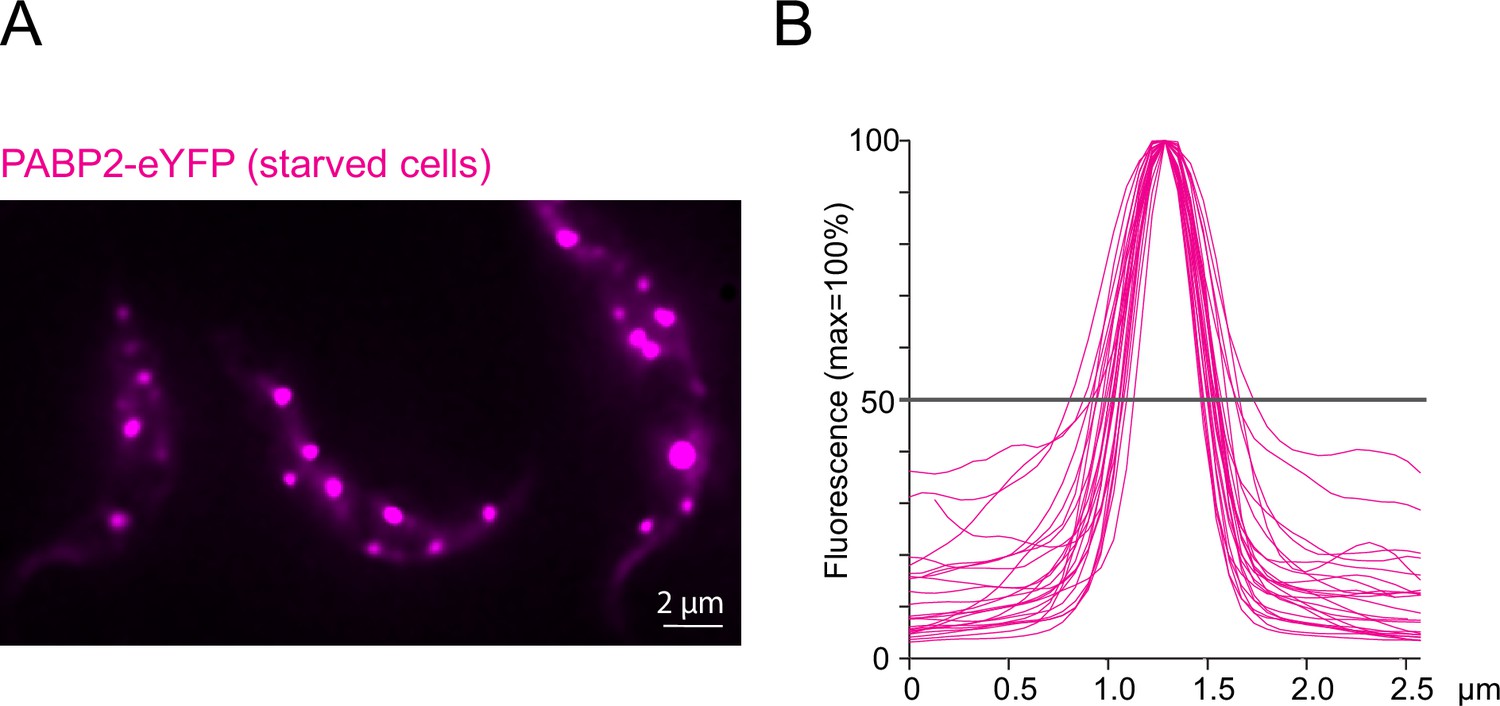
PABP2-eYFP is not at the periphery of stress granules.
PABP2 was expressed as a C-terminal fusion to eYFP from the endogenous locus. (A) Fluorescence microscopy image of starved trypanosome cells (2 hr PBS) expressing PABP2-eYFP. The eYFP granules appear dot-like with a clearly defined shape, similar to the granules labelled with streptavidin in PABP2-TurboID-HA expressing cells. (B) The fluorescence intensity profile is shown for 25 granules. The profiles are similar to the profiles of the streptavidin labelled granules from PABP2-TurboID-HA cells but differ from the profiles obtained with anti-HA (compare Figure 2). The shape of the profiles is consistent with an even distribution of PABP2 throughout the (spherical) stress granules, rather than a peripheral localisation.
Figure 3 with 1 supplement
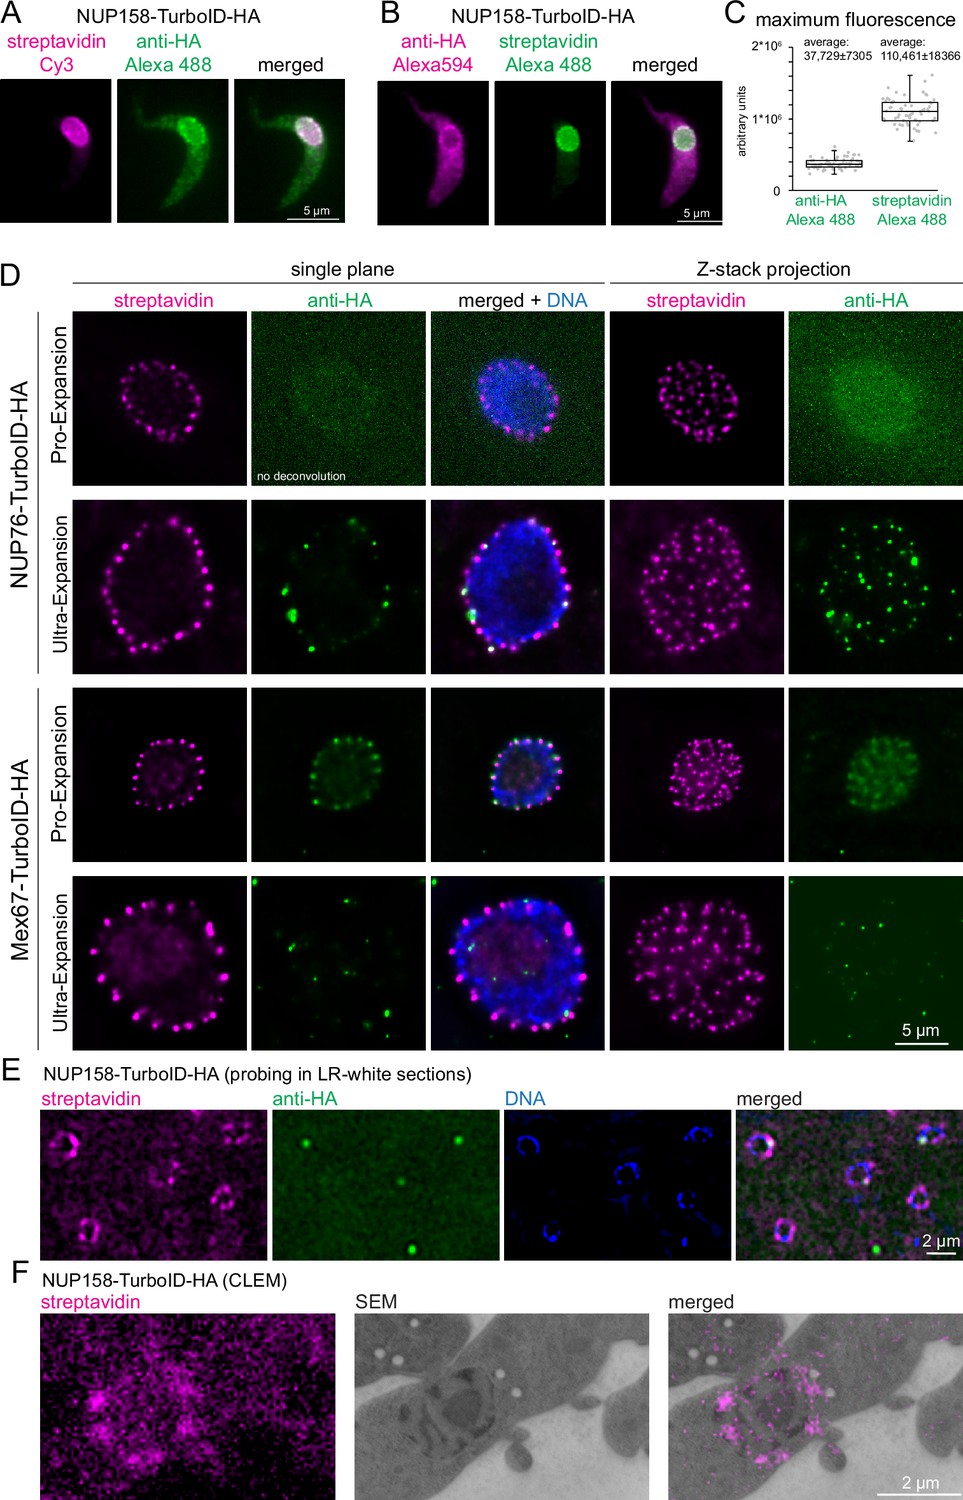
Streptavidin imaging yields higher signal intensities than immunofluorescence.
(A–C) Enhanced signal in standard light microscopy. Trypanosome cells expressing NUP158-TurboID-HA were labelled with combinations of either streptavidin-Cy3 and anti-HA/Alexa488 secondary (A) or with streptavidin-Alexa488 and anti-HA//Alexa 594 secondary (B) Z-stack images were recorded (48 slices a 140 nm). Representative, unprocessed single plane images are shown (A and B) The maximum Alexa488 fluorescence was quantified from Z-stack projections (sum slices) from 60 cells probed with anti-HA or streptavidin; the data are presented as a dot blot (waist is median; box is IQR; whiskers are ±1.5 IQR) (C) (D) Improved signal in expansion microscopy. Trypanosome cells expressing NUP76-TurboID-HA or MEX67-TurboID-HA were imaged using Pro-expansion or Ultra-expansion microscopy. Single plane and Z-stack projections (sum slices) of the streptavidin and anti-HA signal are shown for one representative nucleus. All images were deconvolved in proExM, except for NUP76 anti-HA. (E–F) Improved signal in correlative electron and light microscopy (CLEM). Trypanosome cells expressing NUP158-TurboID-HA were embedded in LR-White resin. Slices were probed with streptavidin and anti-HA and imaged by light microscopy (E) followed by electron microscopy (CLEM) (F).
Figure 3—figure supplement 1
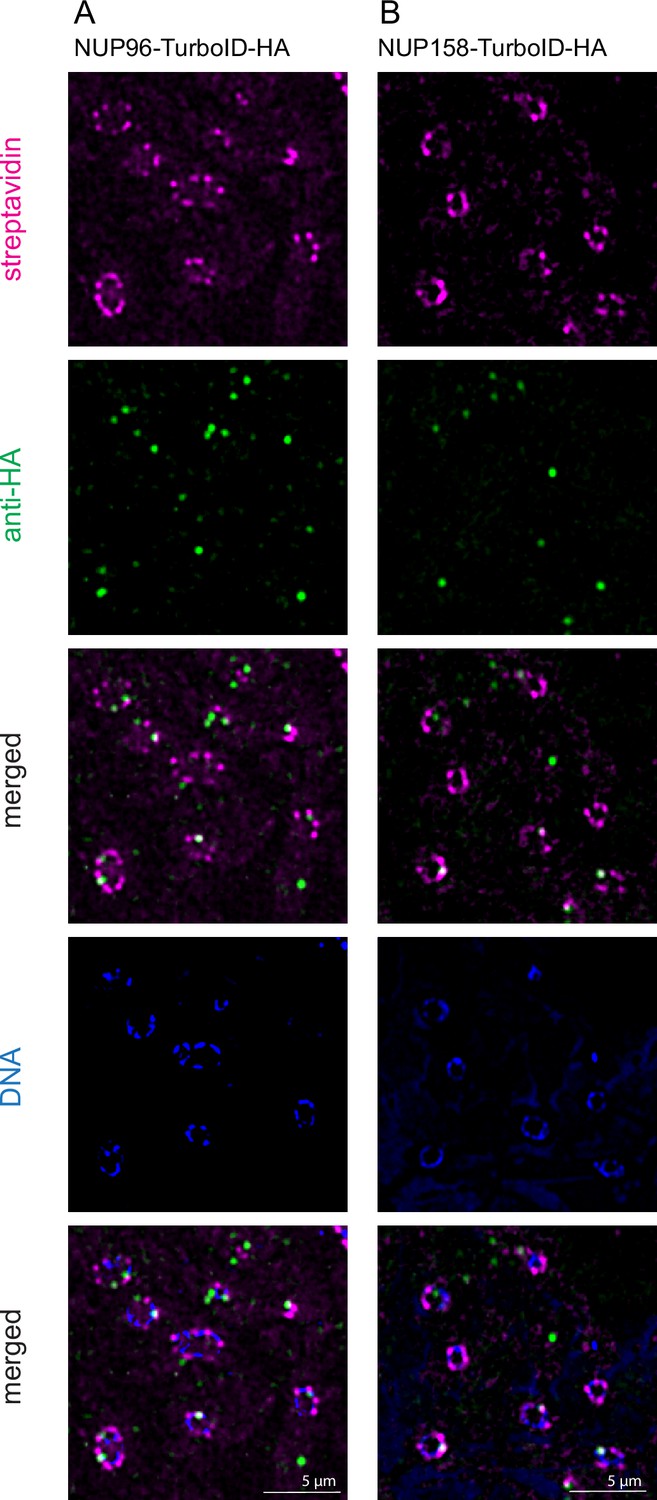
Streptavidin and anti-HA signal on LR-white embedded sections.
Trypanosome cells expressing NUP96-TurboID HA (A) or NUP158-TurboID-HA (B) were high-pressure frozen and embedded in LR-white. The resin with the embedded cells was cut into 100 nm thick slices and the proteins were detected by streptavidin and anti-HA on the surface of these slices. Streptavidin labels significantly more nuclear pores than anti-HA.
Figure 4 with 1 supplement
Visualisation of protein interactions with TurboID.
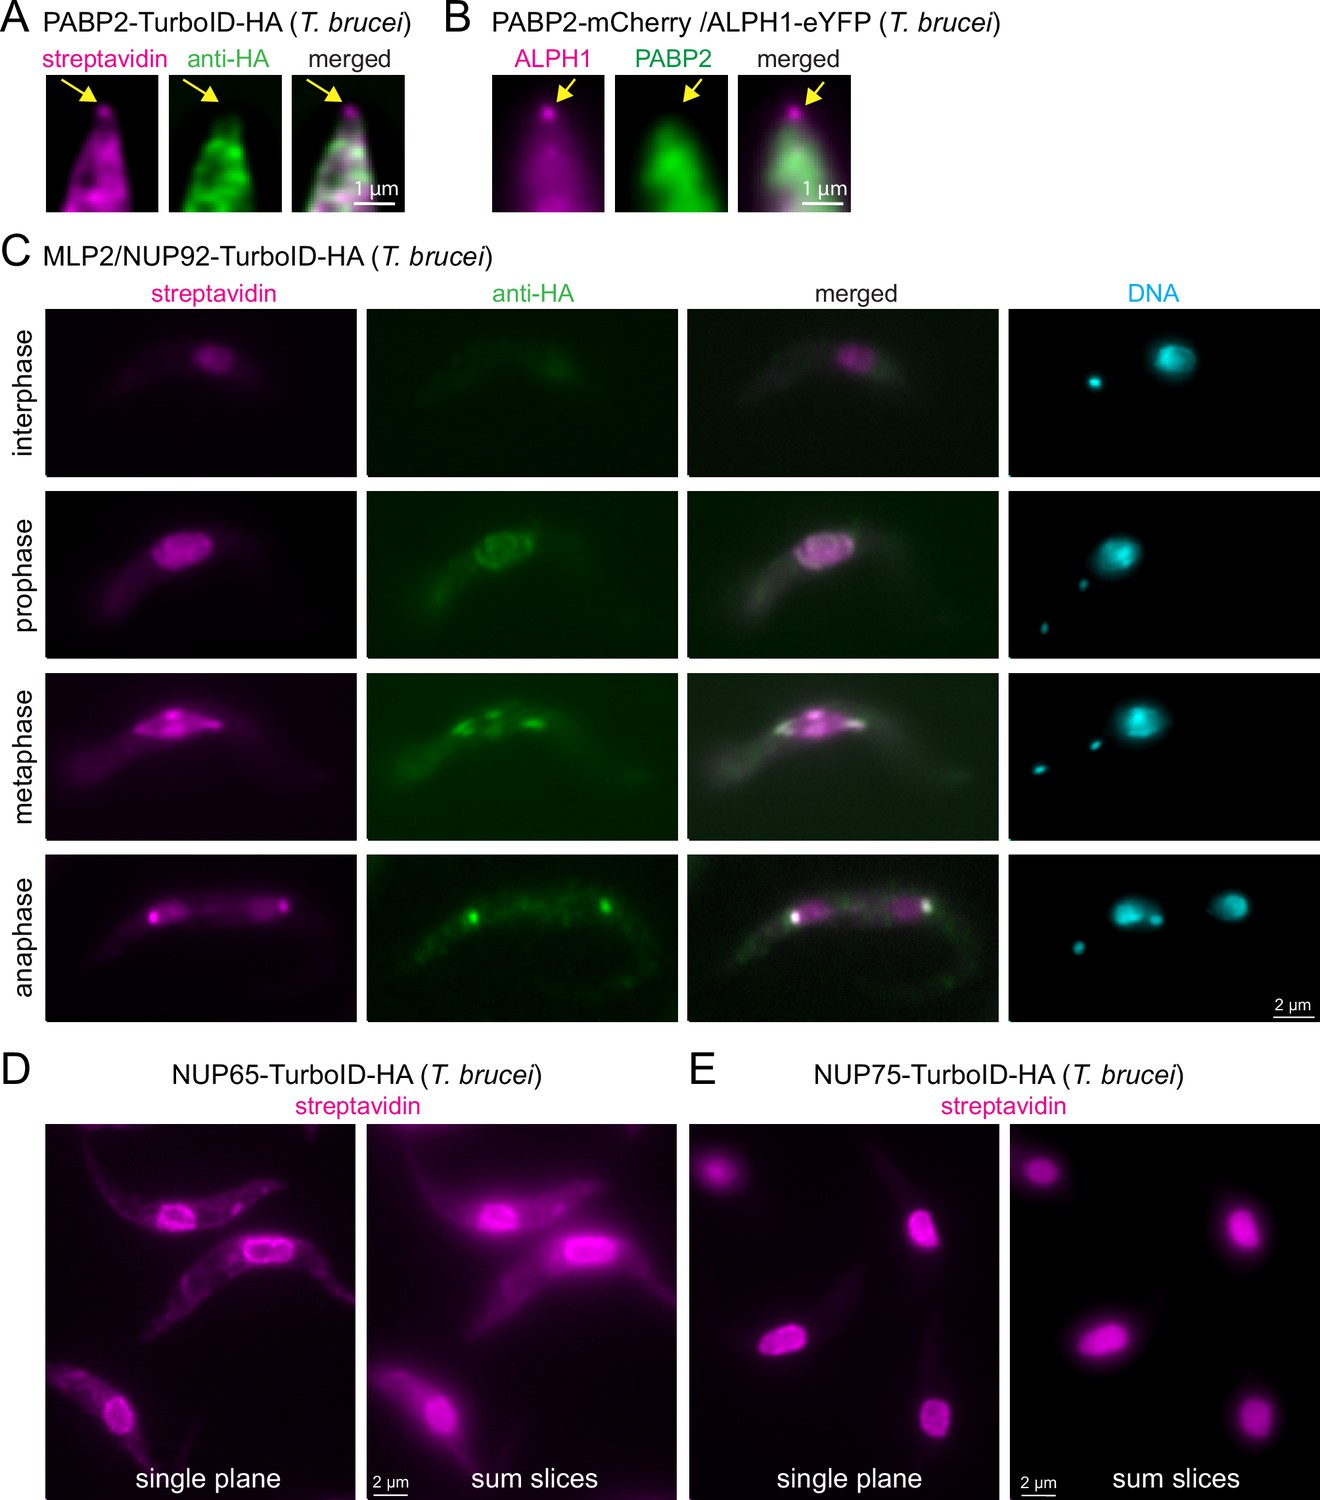
(A) Trypanosome cells expressing PABP2-TurboID-HA were probed with streptavidin and anti-HA. A representative image of the posterior part of a cell is shown (single plane of a Z-stack processed by computational clearing). The position of posterior pole granule is indicated by arrows. (B) Trypanosome cells were transformed to co-express PABP2-mChFP and ALPH1-eYFP. A representative image of the posterior part of a cell is shown (single plane of a Z-stack processed by deconvolution). The position of posterior pole granule is indicated by arrows. (C) Trypanosome cells expressing TurboID-HA-MLP2 were probed with streptavidin and anti-HA. One representative image of an interphase, prophase, metaphase and an anaphase cell are shown. All images are unprocessed single plane images, with the exception of the DAPI image that is a Z-stack projection (max intensity of 48 slices a 140 nm). (D and E) Trypanosome cells expressing NUP65 (D) or NUP75 (E) fused to a C-terminal TurboID-HA tag were probed with streptavidin. Single plane and Z-stack projection (sum slices of 48 slices a 140 m) of unprocessed images are shown.
Figure 4—figure supplement 1
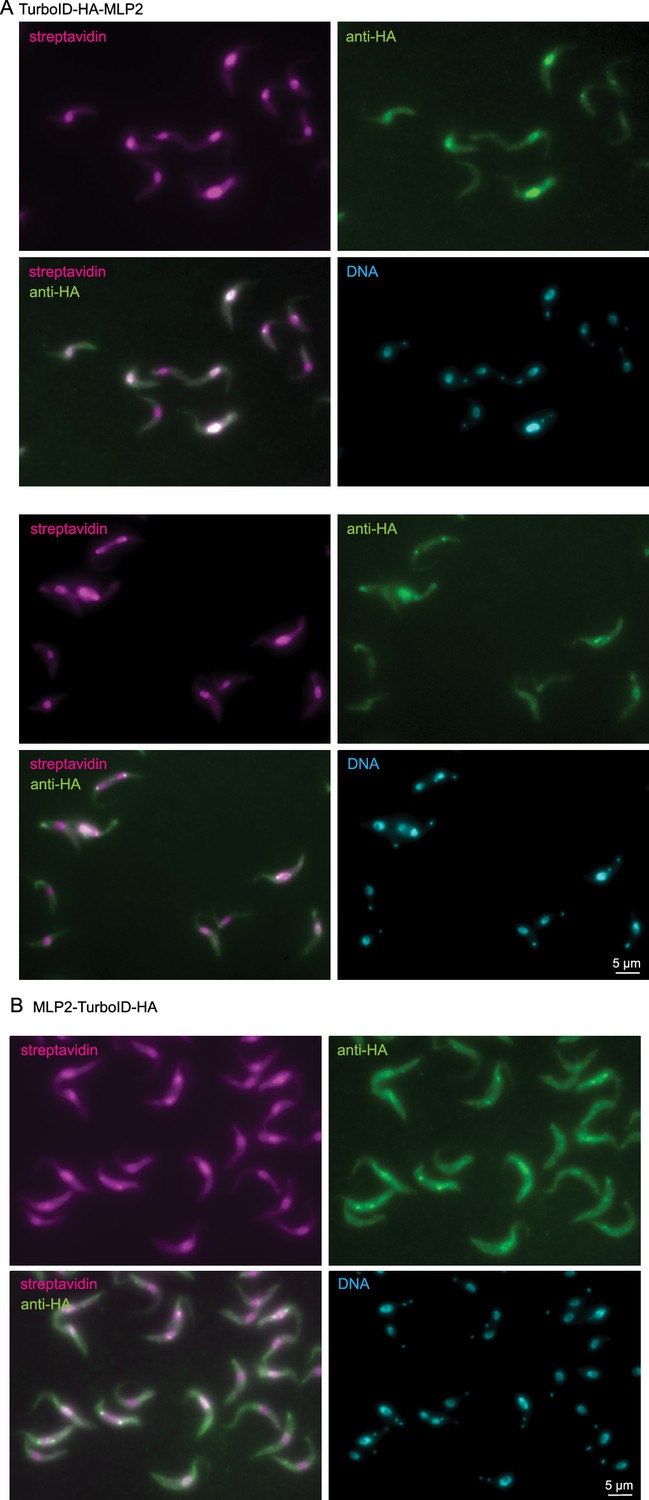
MLP2 does largely not localise to nuclear pores, but to the nucleus and to the spindle pole.
T. brucei MLP2 was expressed fused to either an N-terminal TurboID-HA tag (A) or a C-terminal TurboID-HA tag (B) from the endogenous locus. The cells were labelled with cy3-streptavidin (pink) and anti-HA (green). Unprocessed images are shown as Z-stack projections (sum slices, 28 stacks).
Figure 5 with 2 supplements
A refined map of the T. brucei nuclear pore complex.
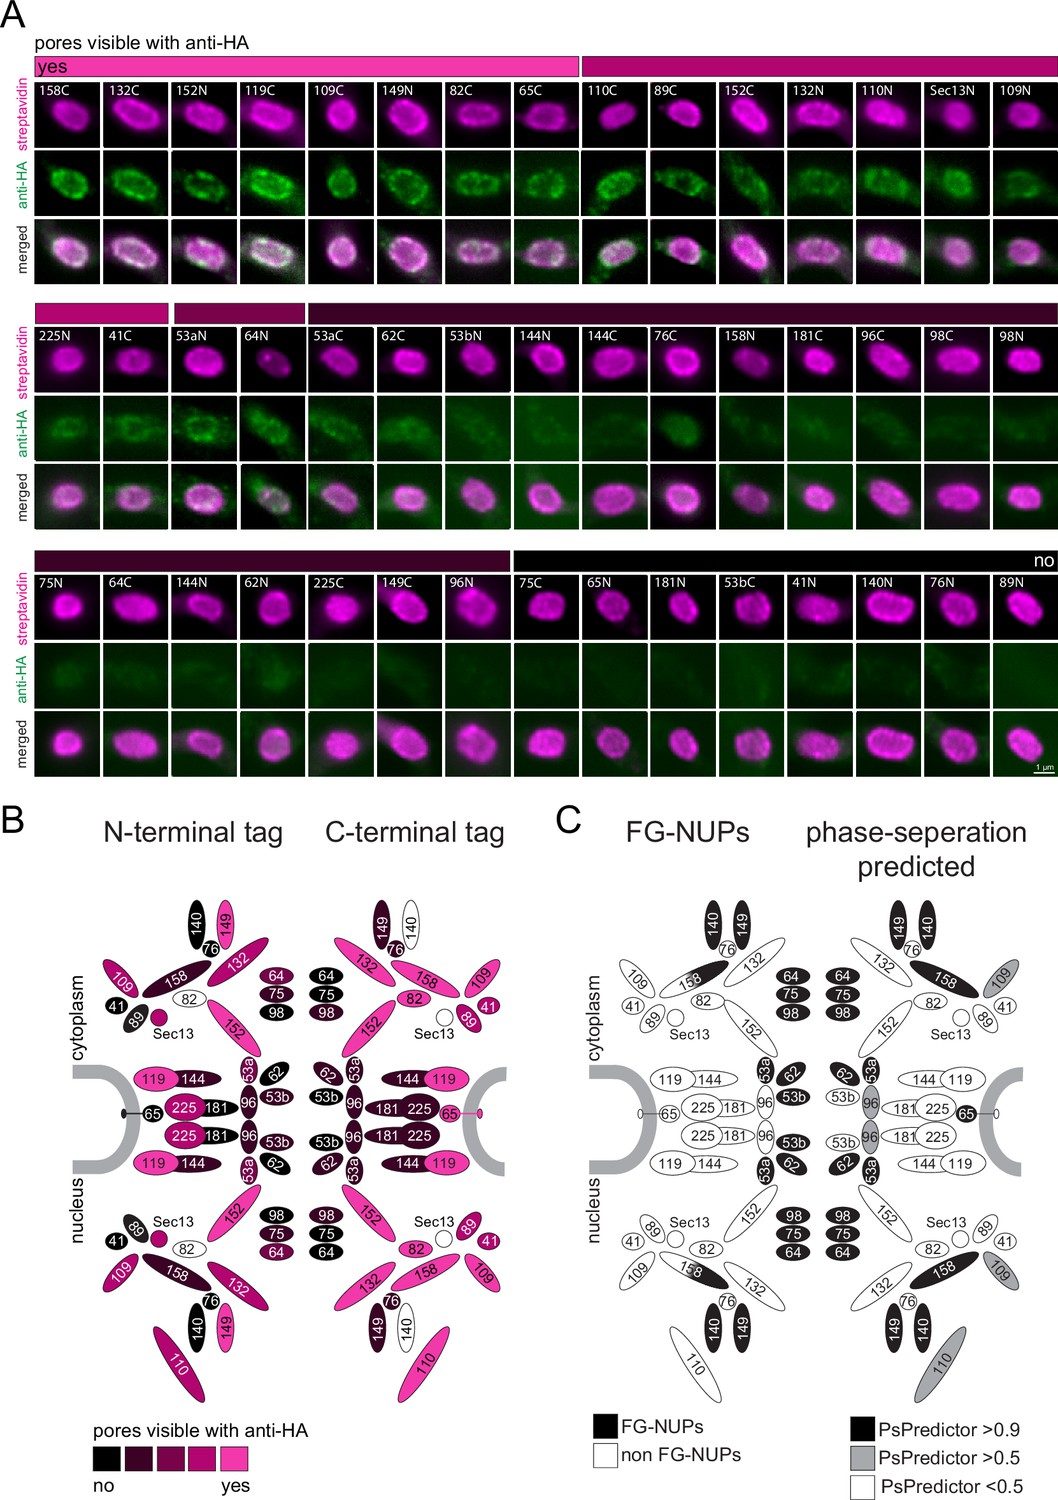
Each known T. brucei nuclear pore protein was expressed fused to TurboID-HA, each both at the N- and C-terminus. Cells were labelled with anti-HA and with streptavidin. (A) For each NUP, a representative image of the nucleus is shown as unprocessed, single plane of a Z-stack. We evaluated the extent of anti-HA stain in colour increments (shown as a bar above images). (B) The HA-signal at the nuclear pores was mapped onto a schematic representation of the trypanosome NPC (modified from Obado et al., 2016) using the same colour increments. (C) Scheme of the T. brucei nuclear pore, with known FG NUPs (Obado et al., 2016) shown in black on the left side and prediction of phase separation (Chu et al., 2022) mapped on the right.
Figure 5—figure supplement 1
Western blots.
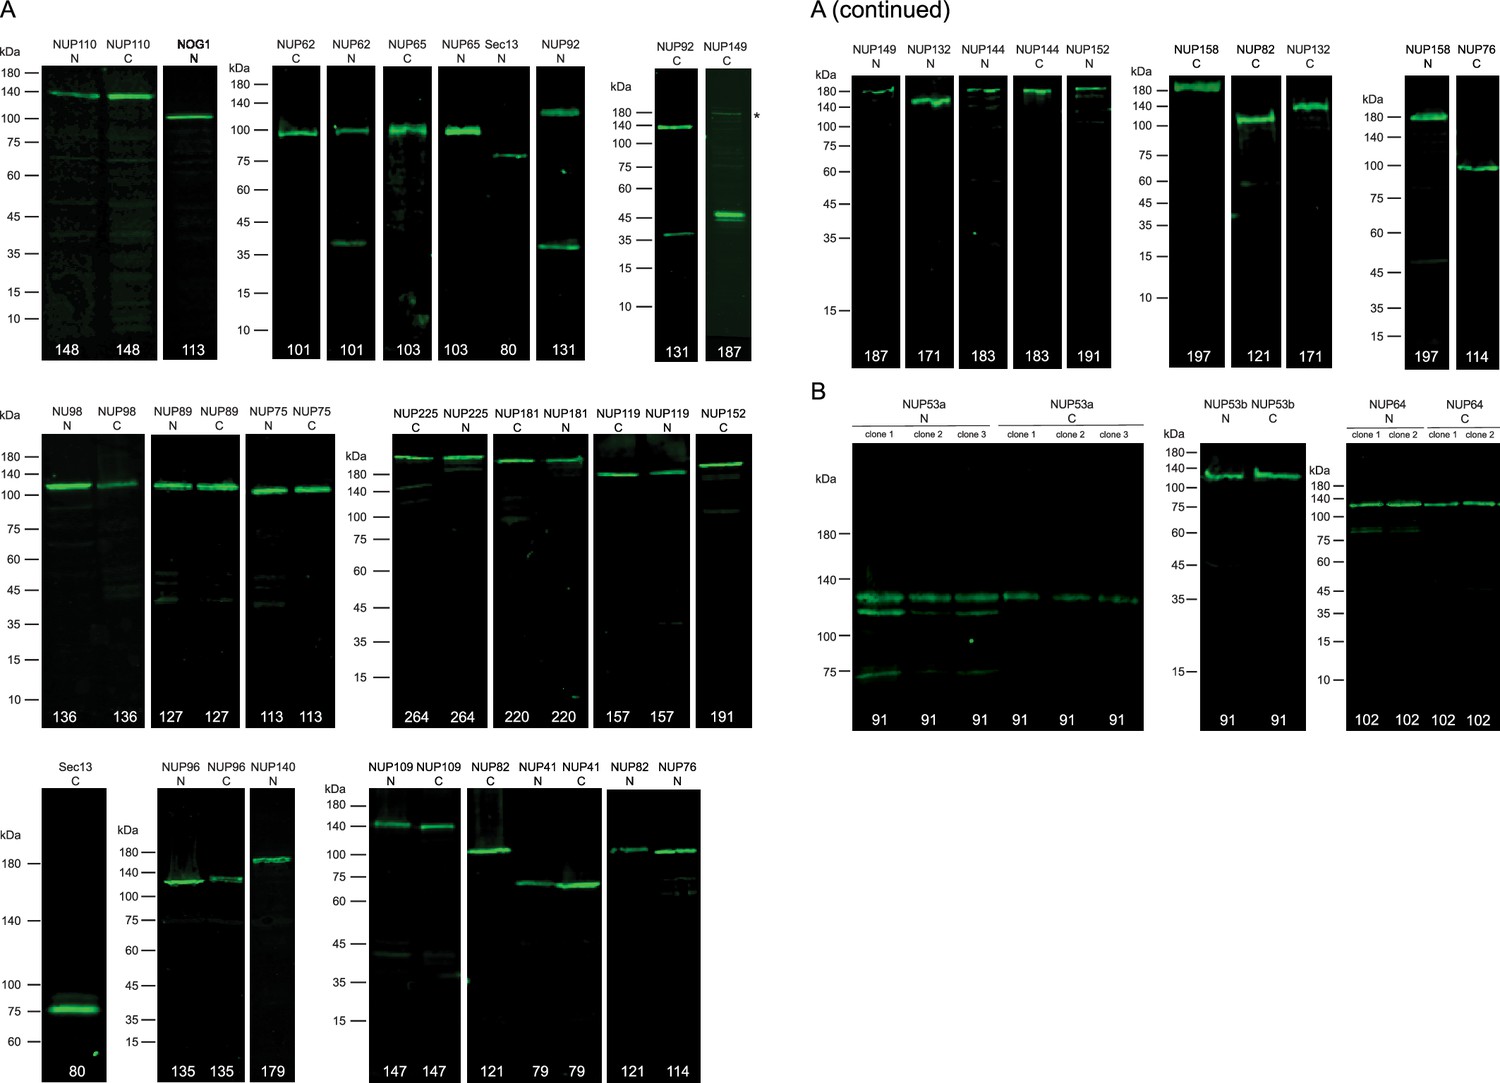
Protein extracts of all cell lines expressing TurboID-HA fusion proteins (fused to either the N or C-terminus, as indicated) were loaded on SDS PAGE, gels blotted and the membranes probed with anti-HA. The expected molecular weight of the fusion protein is indicated in white numbers. (A) For most proteins, one single band at roughly the expected MW was detected; occasionally, there was a second smaller band, likely due to degradation. For C-terminally tagged NUP149 the smaller band was more prominent than the band at the correct MW (asterisk). (B) For the small FG-NUPs NUP53a, NUP53b and NUP64 we observed a larger MW than expected. However, this was repeatedly observed for independent transfections, for independent clonal cell lines and there was no difference between N- and C-terminally tagged version of the NUPs. We, therefore, assume that special features of these NUPs affect the migration behaviour on the SDS page.
-
Figure 5—figure supplement 1—source data 1
Uncropped and labelled gels for Figure 5—figure supplement 1.
- https://cdn.elifesciences.org/articles/95028/elife-95028-fig5-figsupp1-data1-v1.pdf
-
Figure 5—figure supplement 1—source data 2
Raw unedited gels for Figure 5—figure supplement 1.
- https://cdn.elifesciences.org/articles/95028/elife-95028-fig5-figsupp1-data2-v1.zip
Figure 5—figure supplement 2
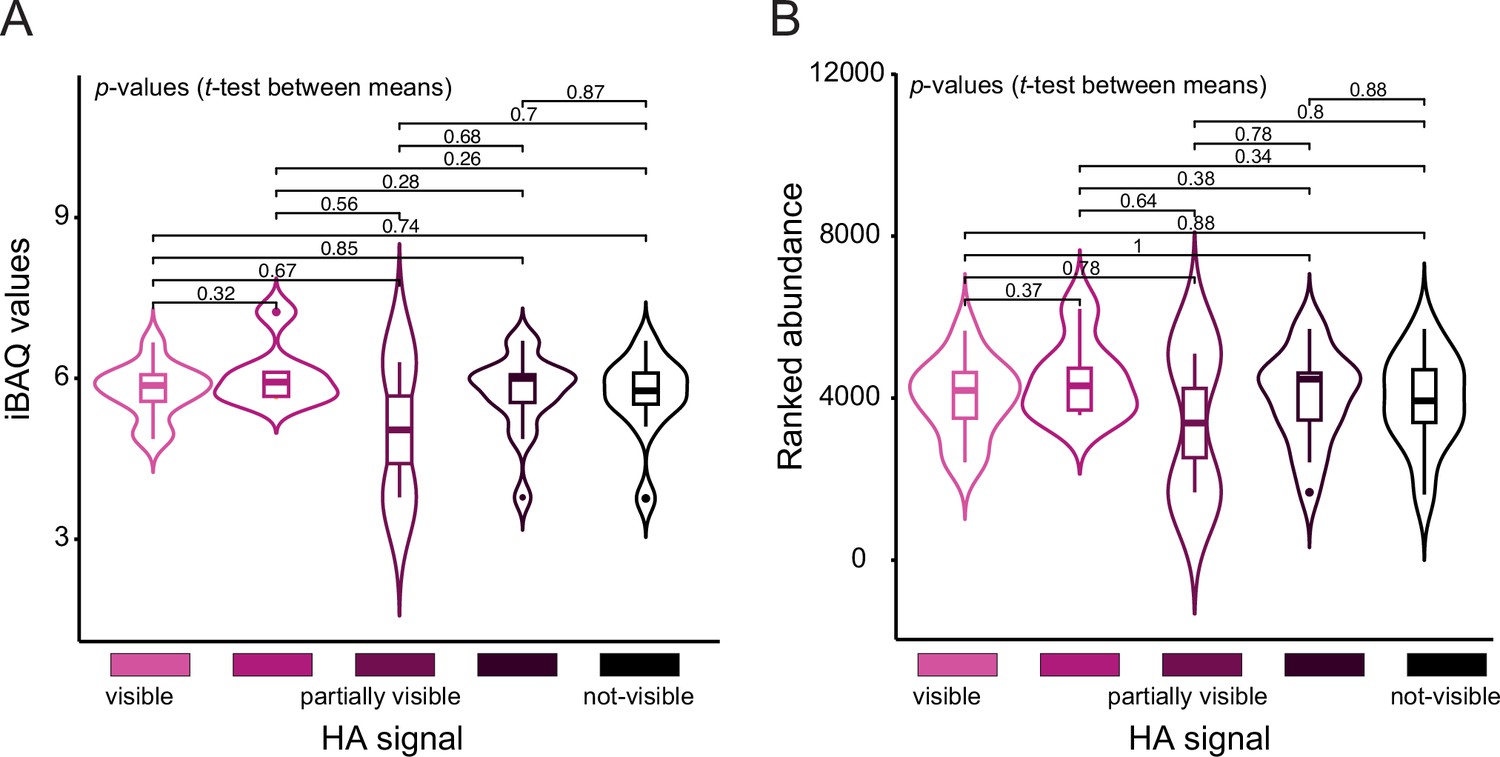
The strength of the immunofluorescence signal of HA-tagged nucleoporins does not correlate to estimated protein abundances.
Estimation of protein abundances is available as intensity-based quantification (iBAQ) and ranked-order relative protein abundance values for the proteome of the T. brucei 927 strain (Tinti and Ferguson, 2022). Immunofluorescence signal of HA-tagged nucleoporins was categorised based on signal intensity as shown in Figure 5. We compared the means of protein abundances in iBAQ (A) and ranked-order relative abundance (B) between these categories using a t-test. A box plot was merged with a violin plot to show the distribution of the data points using the ggpubr package in R. The p-values of comparisons between all categories are indicated.
Additional files
-
MDAR checklist
- https://cdn.elifesciences.org/articles/95028/elife-95028-mdarchecklist1-v1.docx
-
Supplementary file 1
List of all plasmids used in this work.
- https://cdn.elifesciences.org/articles/95028/elife-95028-supp1-v1.docx
-
Supplementary file 2
NUP TurboID proteomics data and statistical analysis.
- https://cdn.elifesciences.org/articles/95028/elife-95028-supp2-v1.xlsx
Download links
A two-part list of links to download the article, or parts of the article, in various formats.
Downloads (link to download the article as PDF)
Open citations (links to open the citations from this article in various online reference manager services)
Cite this article (links to download the citations from this article in formats compatible with various reference manager tools)
Detection of TurboID fusion proteins by fluorescent streptavidin outcompetes antibody signals and visualises targets not accessible to antibodies
eLife 13:RP95028.
https://doi.org/10.7554/eLife.95028.3


