Evaluation of Gremlin-1 as a therapeutic target in metabolic dysfunction-associated steatohepatitis
- National Institute for Health Research, Biomedical Research Centre at University Hospitals Birmingham NHS Foundation Trust and the University of Birmingham, United Kingdom
- Centre for Liver & Gastrointestinal Research, Institute of Immunology and Immunotherapy, University of Birmingham, United Kingdom
- Department of Hepatology & Gastroenterology, Charité – Universitätsmedizin Berlin, Campus Virchow-Klinikum and Campus Charité Mitte, Germany
- Berlin Institute of Health at Charité – Universitätsmedizin Berlin, BIH Biomedical Innovation Academy, BIH Charité Digital Clinician Scientist Program, Germany
- Global Drug Discovery, Novo Nordisk A/S, Denmark
- Global Translation, Novo Nordisk A/S, Denmark
- Global Research Technologies, Novo Nordisk A/S, Denmark
- Department of Pathology, Copenhagen University Hospital Hvidovre, and Centre for RNA Medicine, Aalborg University Copenhagen, Denmark
- Gastro Unit, Copenhagen University Hospital Hvidovre, Denmark
- Roger Williams Institute of Liver Studies, Faculty of Life Sciences and Medicine, King’s College London and King’s College Hospital, United Kingdom
Figures
Figure 1 with 3 supplements
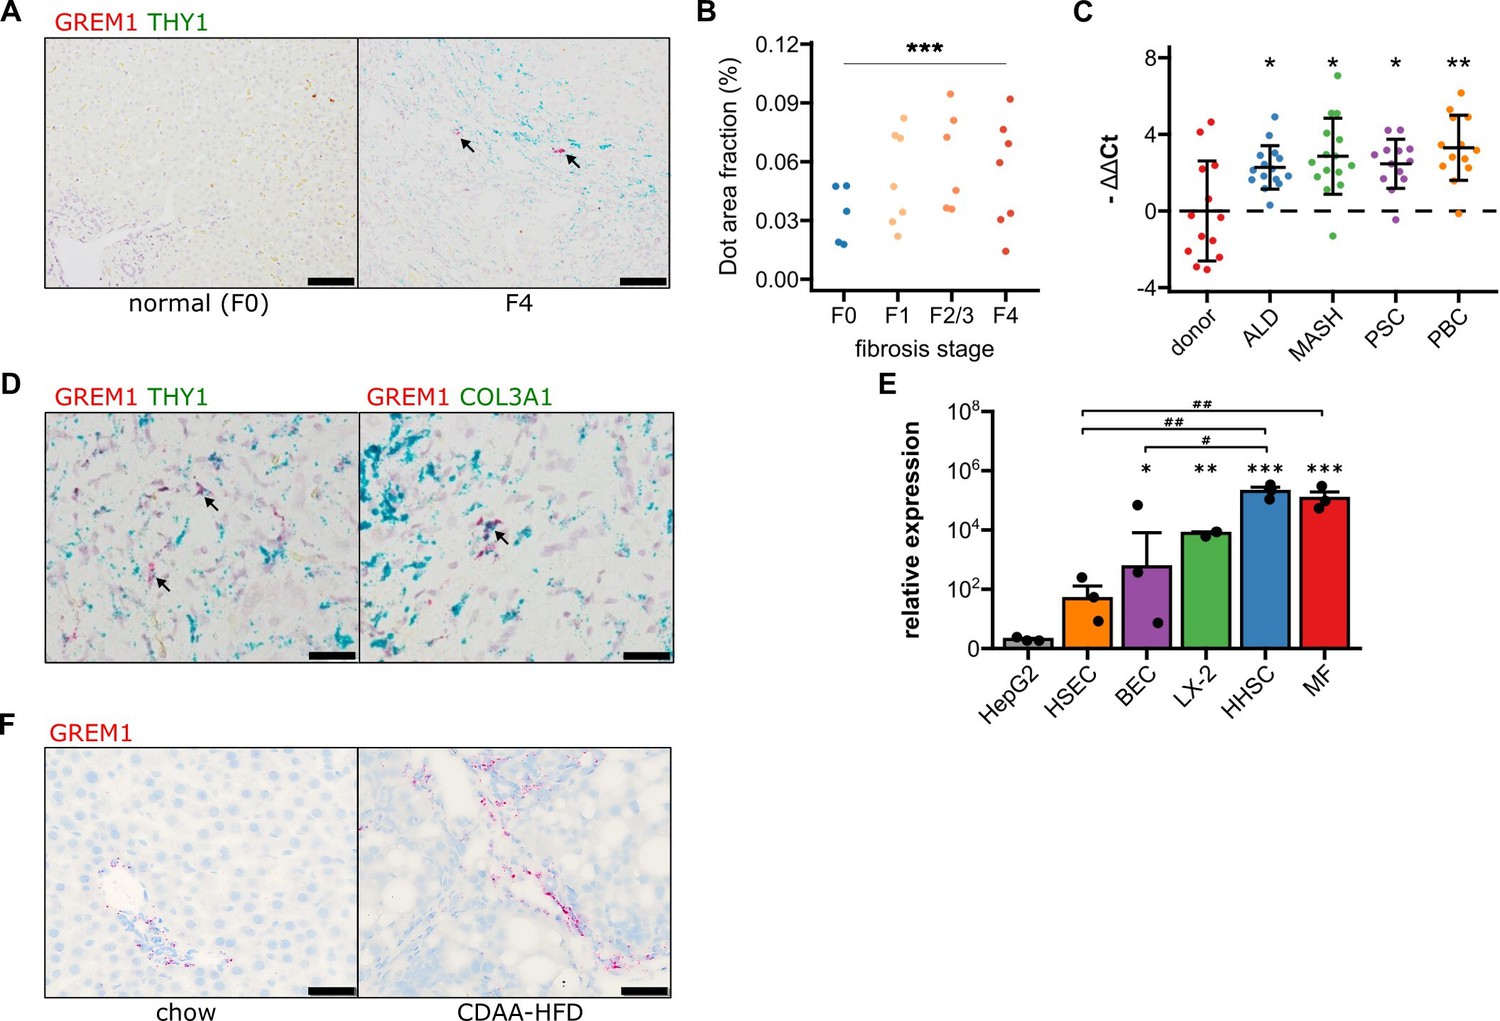
Validation of GREM1 expression in human and rat metabolic dysfunction-associated steatohepatitis (MASH) liver fibrosis.
(A) Representative RNAscope in situ hybridisation (ISH) images for co-staining of GREM1 (red) and THY1 (green) in normal human liver and MASH fibrosis. Scale bar represents 100 μM. (B) Quantification of ISH staining areas across different stages of liver fibrosis. Significance was assessed by two-sided Jonckheere-Terpstra test (***p=1.3 × 10–09). (C) Quantification of human GREM1 qPCR across chronic liver diseases of different aetiology. Data are given as mean -ΔΔCt ± SD, relative to donor liver and normalised to the expression of SRSF4, HPRT1, and ERCC3. Significance was assessed by multiple two-sided Welch’s t-test against donor control, followed by Bonferroni-Holm adjustment (*p<0.05, **p=0.004). (D) Representative histological images of RNAscope in situ hybridisation (ISH) for co-staining of GREM1 (red) and THY1 or COL3A1 (green) in MASH fibrosis. Representative double positive cells are indicated by arrows. Scale bar represents 50 μM. (E) Quantification of qPCR for GREM1 mRNA in major primary human non-parenchymal cell types. HSEC – human sinusoidal endothelial cells, BEC – biliary epithelial cells, HHSC – human hepatic stellate cells, MF – myofibroblasts. (F) Representative RNAscope ISH images for GREM1 (red) in rats fed a standard chow or choline-deficient, L-amino acid defined high-fat diet (CDAA-HFD) for 12 weeks. Scale bar represents 50 μM.
-
Figure 1—source data 1
Excel spreadsheet containing data displayed in panels A, C, and E.
- https://cdn.elifesciences.org/articles/95185/elife-95185-fig1-data1-v1.xlsx
Figure 1—figure supplement 1
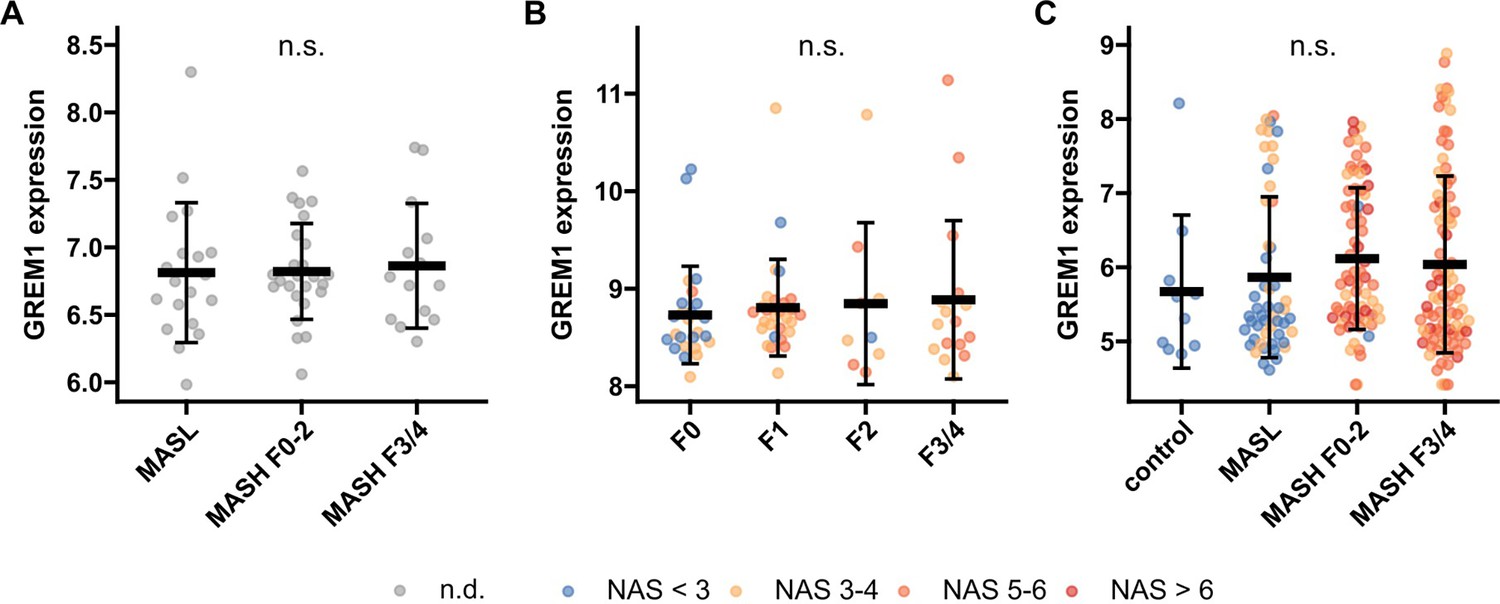
GREM1 gene expression in public bulk RNA-sequencing data from human metabolic dysfunction-associated steatotic liver disease (MASLD) liver.
(A) E-MTAB-9815 (n=58). (B) GSE130970 (n=78). (C) GSE135251 (n=216). All data are given as individual data points and mean ± SD of variance stabilised expression as obtained from the vst function in DESeq2. n.s. – not significant, statistical significance was tested using the likelihood ratio test and Benjamini-Hochberg correction in DESeq2.
-
Figure 1—figure supplement 1—source data 1
Excel spreadsheet containing data displayed in Figure 1—figure supplement 1, panels A–C.
- https://cdn.elifesciences.org/articles/95185/elife-95185-fig1-figsupp1-data1-v1.xlsx
Figure 1—figure supplement 2
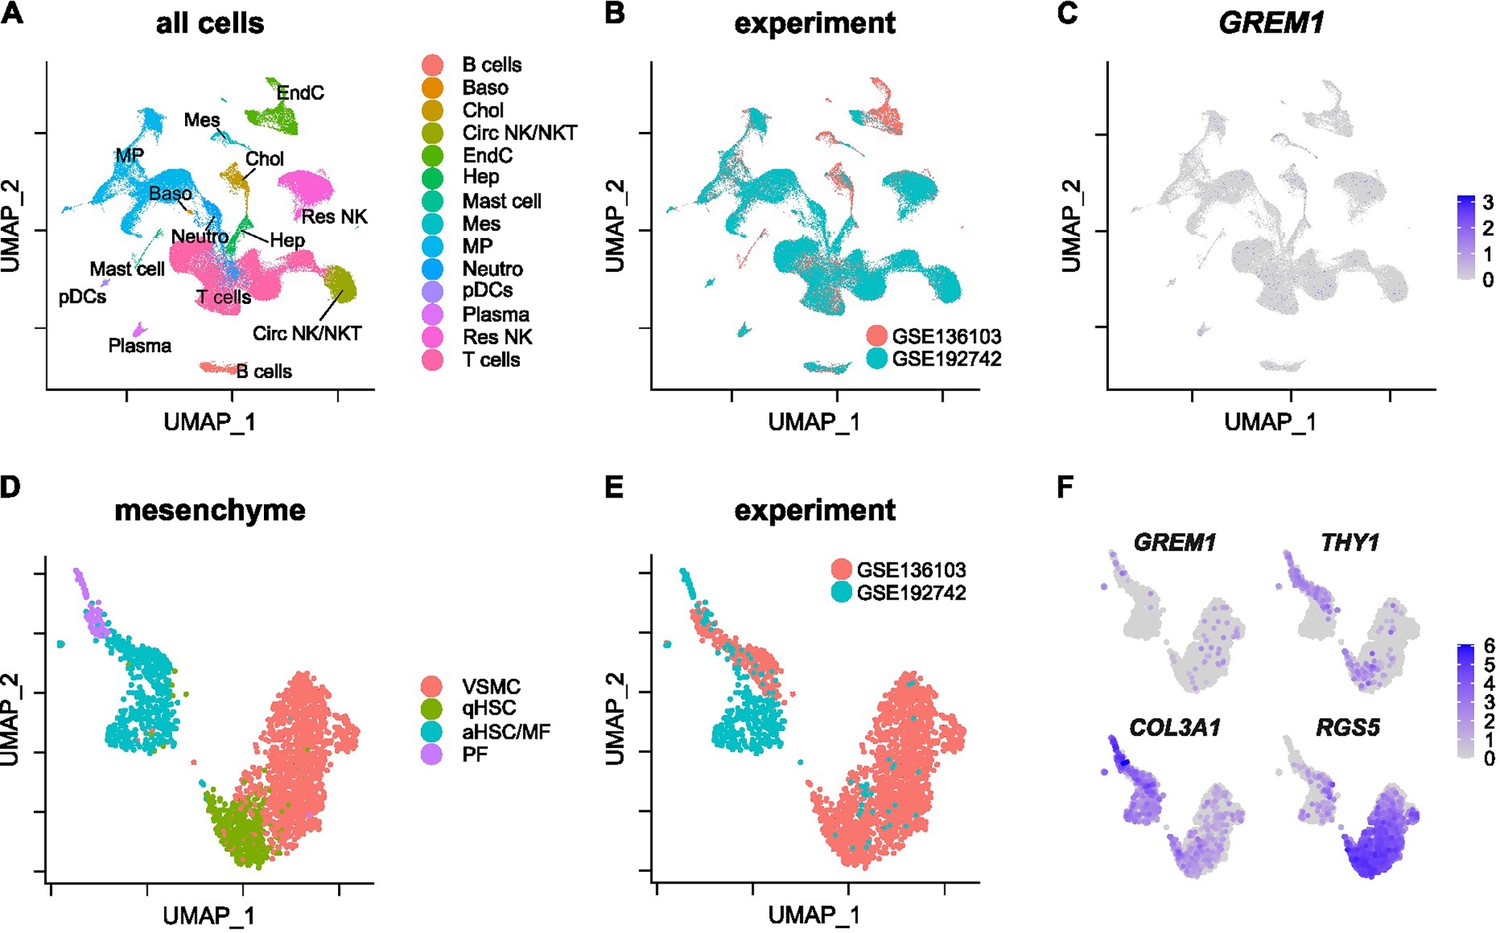
GREM1 expression in publicly available human single-cell RNA-sequencing (scRNA-sequencing) data.
(A) UMAP representation of all cells in GSE136103 and GSE192742 scRNA-sequencing datasets. Cells are coloured by cell type identity. (B) UMAP representation of all cells in GSE136103 and GSE192742 scRNA-sequencing datasets. Cells are coloured by experiment. (C) Log2-normalised GREM1 gene expression in all cells. (D) UMAP representation of mesenchymal cells in GSE136103 and GSE192742 scRNA-sequencing datasets. Cells are coloured by cell cluster identity. (E) UMAP representation of mesenchymal cells in GSE136103 and GSE192742 scRNA-sequencing datasets. Cells are coloured by experiment. (F) Log2-normalised gene expression of GREM1, THY1, COL3A1, and RGS5 in mesenchymal cells.
-
Figure 1—figure supplement 2—source data 1
Excel spreadsheet containing data displayed in Figure 1—figure supplement 2.
- https://cdn.elifesciences.org/articles/95185/elife-95185-fig1-figsupp2-data1-v1.xlsx
Figure 1—figure supplement 3
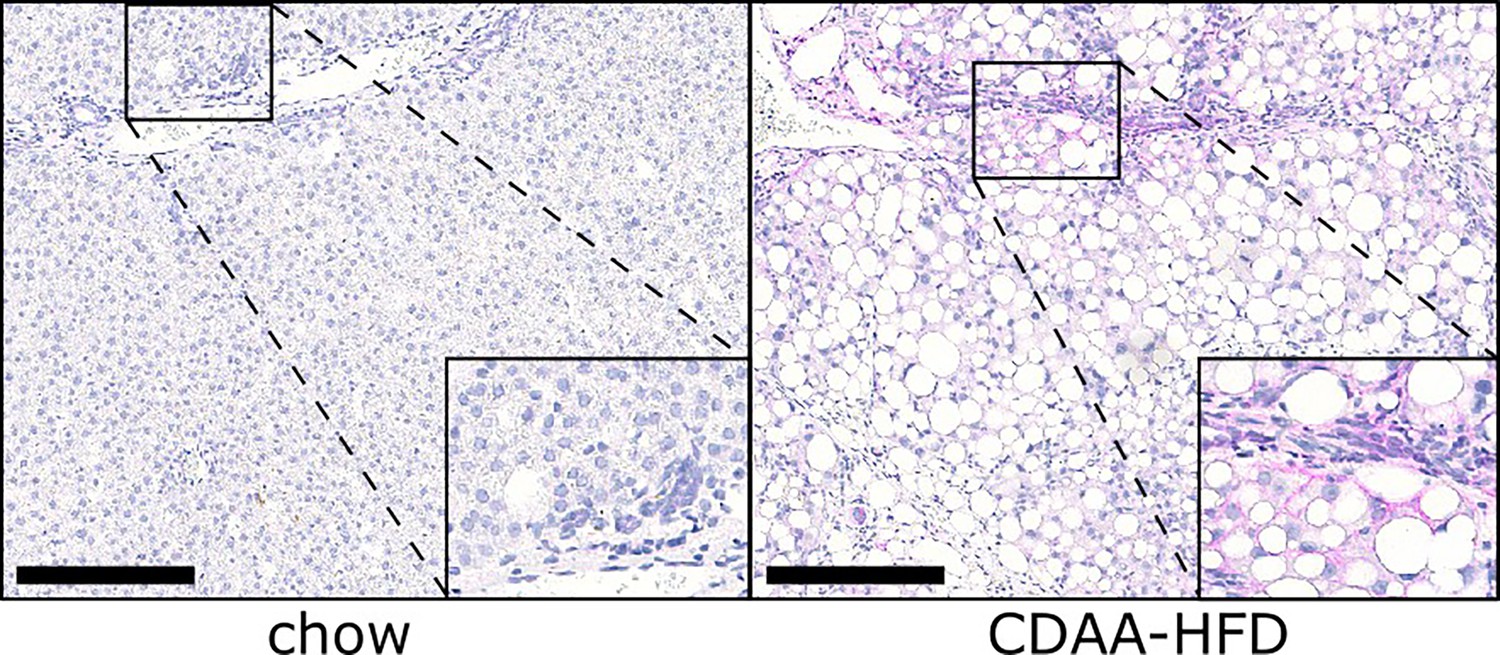
Representative immunohistochemistry images for GREM1 (red) in rats fed a standard chow or choline-deficient, L-amino acid defined high-fat diet (CDAA-HFD) for 12 weeks.
Inserts show zoomed-in periportal/fibrotic areas. The scale bar represents 250 µm.
Figure 2
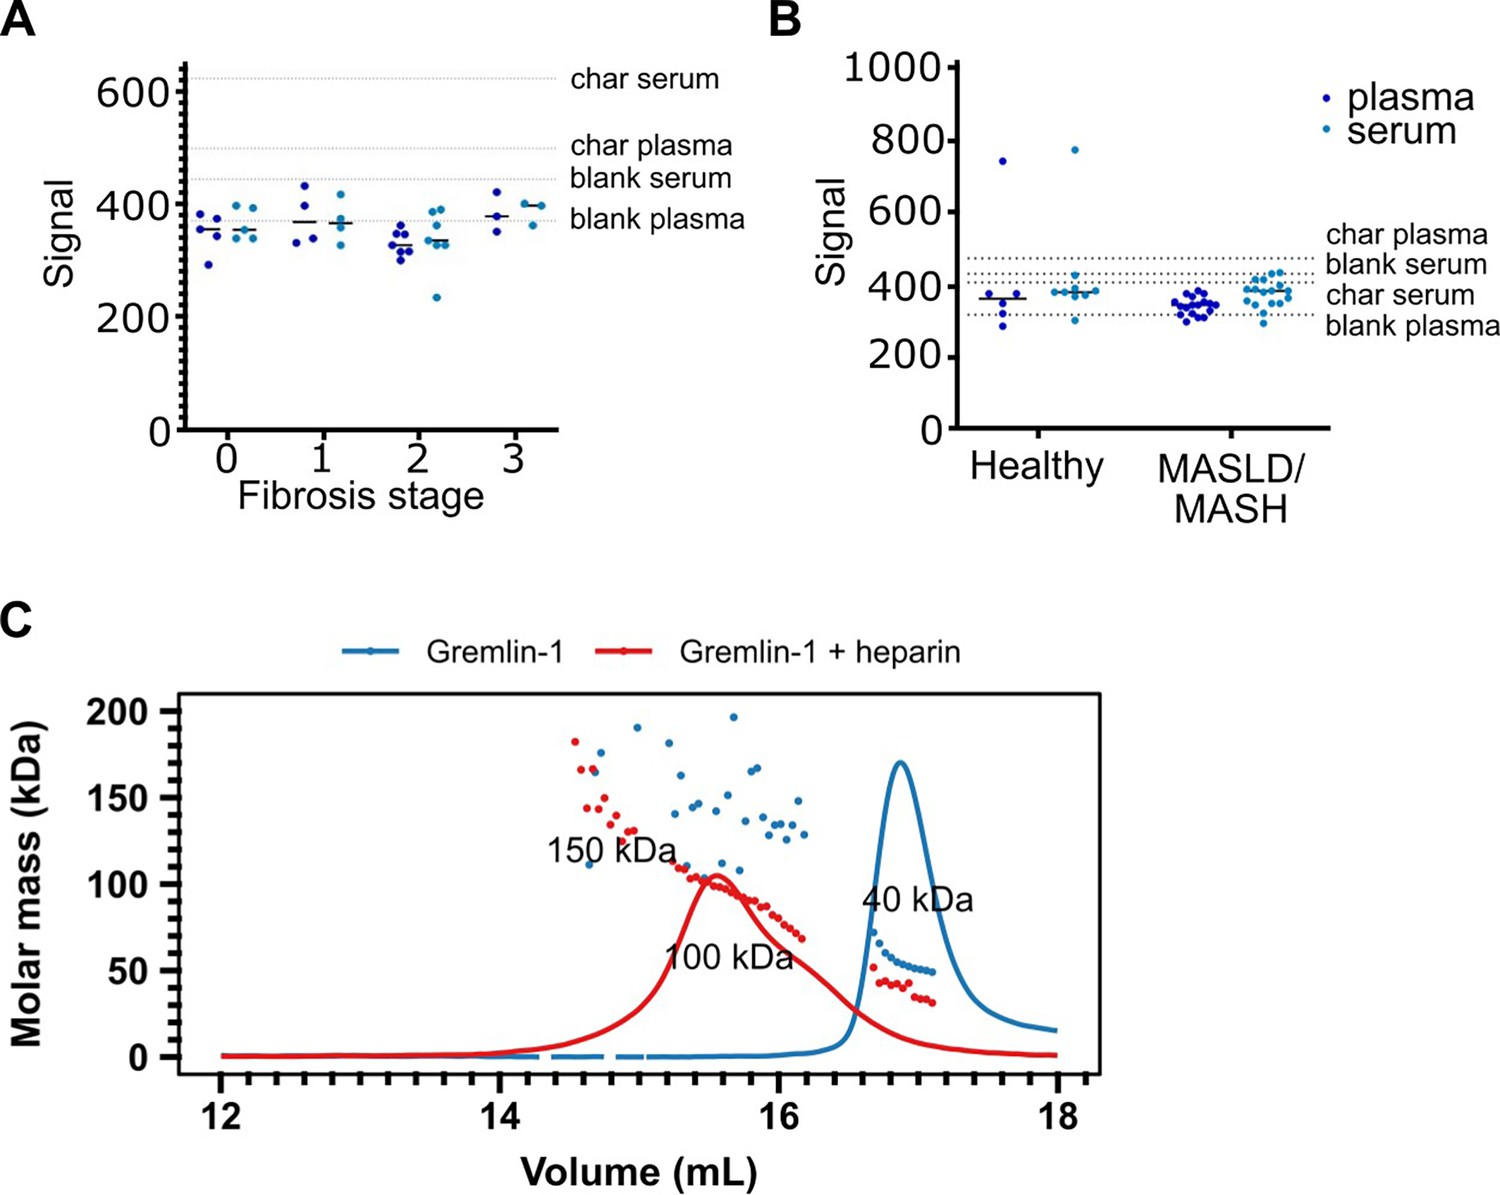
Circulating Gremlin-1 and evidence for heparin binding.
(A) Signal for Gremlin-1 protein in the luminescent oxygen channelling immunoassay (LOCI) in serum or plasma of metabolic dysfunction-associated steatohepatitis (MASH) patients at different stages of fibrosis. Char serum/plasma – charcoal stripped serum/plasma. (B) Signal for Gremlin-1 protein in the LOCI in serum or plasma of healthy controls and metabolic dysfunction-associated steatotic liver disease (MASLD)/MASH. Data in A and B are given as single data points and median of luminescence signal. Dotted horizontal lines correspond to signal measured in control matrices, as given in text annotations. (C) Size exclusion chromatography for Gremlin-1 and heparin. Either Gremlin-1 or Gremlin-1+heparan sulphate were run on a size exclusion chromatography column. The graph shows UV signal (continuous line) and estimated molar mass (points) on the y-axis depending on the eluting volume given on the x-axis. Text annotations give the estimated molar mass corresponding to each peak.
-
Figure 2—source data 1
Excel spreadsheet containing data displayed in panel C.
- https://cdn.elifesciences.org/articles/95185/elife-95185-fig2-data1-v1.xlsx
Figure 3 with 1 supplement
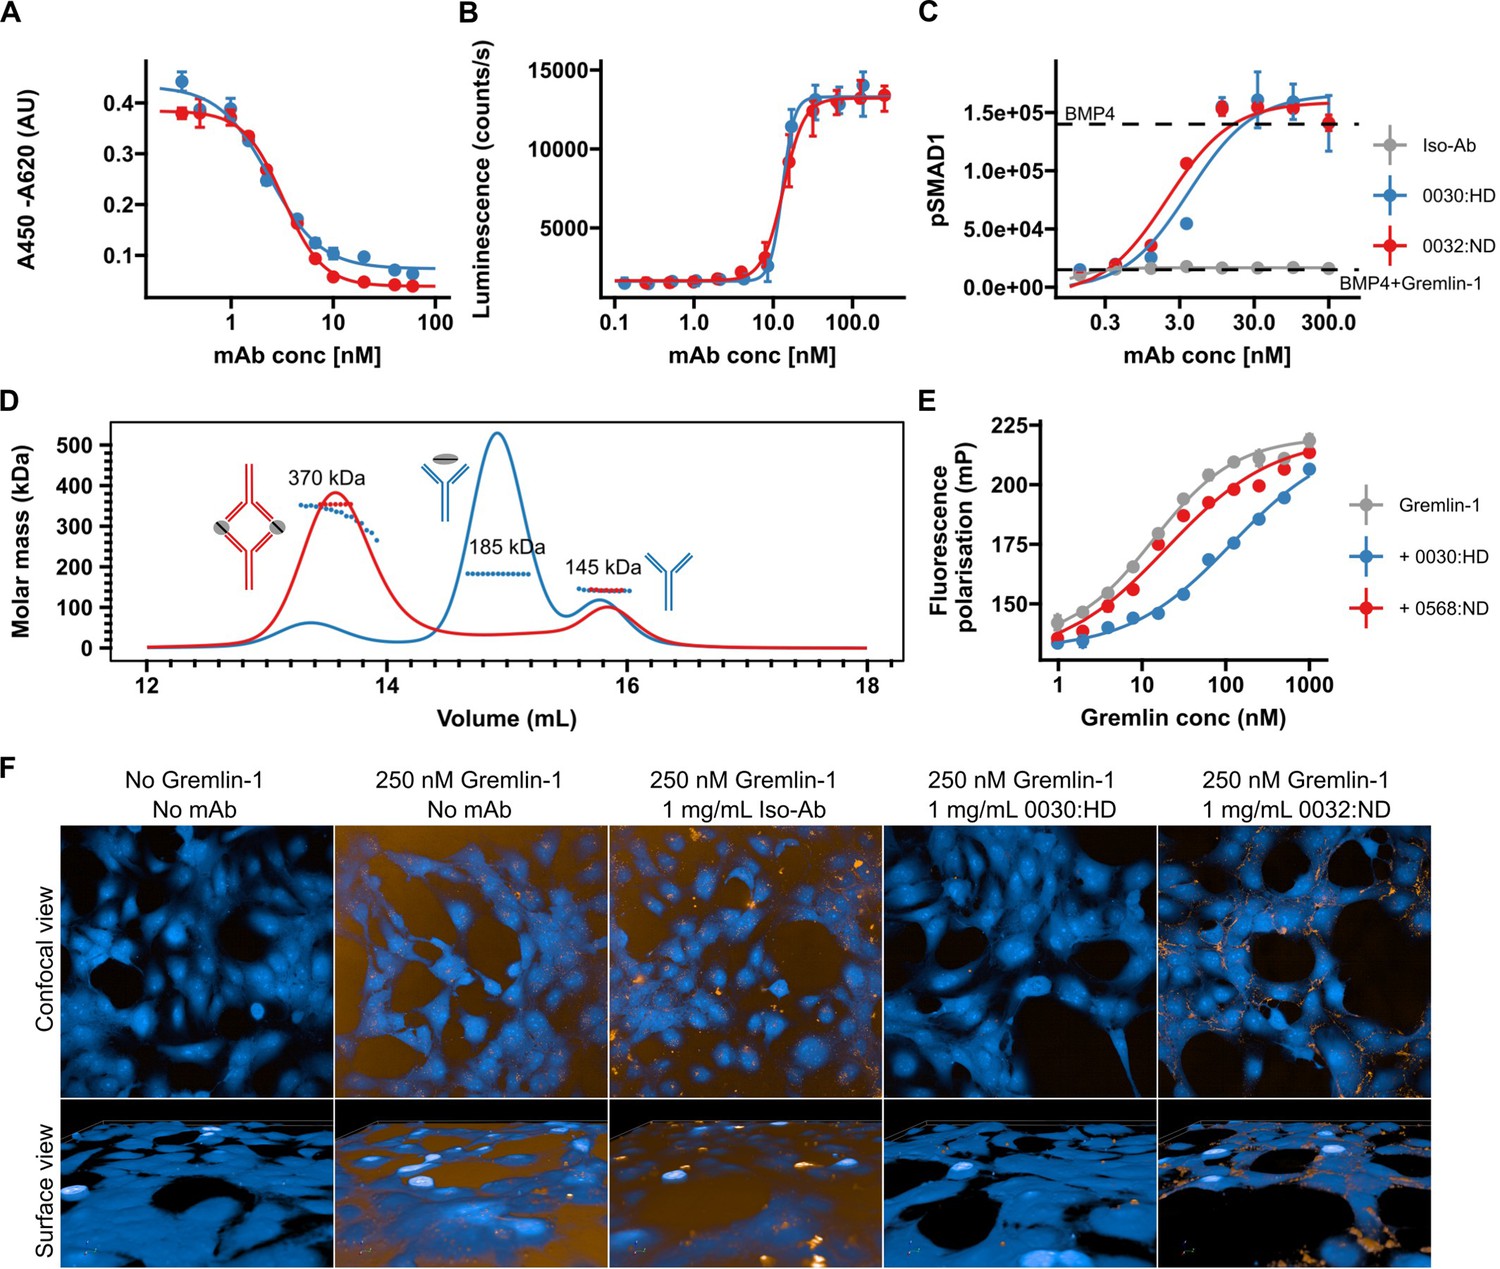
Validation of human recombinant anti-Gremlin-1 antibodies.
(A) Gremlin-1/BMP4 inhibition enzyme linked immunosorbent assay (ELISA), measuring aG1-Ab ability to inhibit Gremlin-1 binding to BMP4. Higher absorbance indicates more Gremlin-1 binding to BMP4. IC50=2.7–3.1×10⁻⁹ M. Dots and error bars represent mean ± SD and lines show fitted four-parameter log-logistic curve. (B) C2C12 BMP-responsive element Luc reporter gene assay. Luminescence is plotted over response to serial dilutions of anti-Gremlin-1 antibodies with higher luminescence indicating increased BMP4 activity. Dots and error bars represent mean ± SD and lines show fitted four-parameter log-logistic curve. EC50=1.27–1.36 × 10⁻⁸ M. (C) SMAD1 phosphorylation on LX-2 cells treated with either BMP4, BMP4 and Gremlin-1 or BMP4, Gremlin-1 and serial dilutions of therapeutic antibody. Dots and error bars represent mean ± SD and lines show fitted four-parameter log-logistic curve. KD [’0032]=2.04 nM, KD [’0030]=3.96 nM. (D) Size exclusion chromatography for Gremlin-1 in combination with heparin-displacing (’0030) or non-heparin-displacing (’0032) anti-Gremlin-1 antibody. The graph shows UV signal (continuous line) and estimated molar mass (points) on the y-axis depending on the eluting volume on the x-axis. Text annotations give the estimated molar mass corresponding to each peak. (E) Fluorescence polarisation heparin-binding assay. Serial dilutions of Gremlin-1 were incubated with fixed amounts of fluorescein-heparan sulfate and 1.5-fold molar excess anti-Gremlin-1 antibody. Increased fluorescence indicates reduced mobility of heparin molecules. Dots and error bars represent mean ± SD and lines show fitted four-parameter log-logistic curve. KD [Grem1]=13.54 nM, KD [’0032]=19.56 nM and KD [’0030]=118.65 nM. (F) Gremlin-1 cell association assay. The upper panel shows a confocal view and the lower panel a three-dimensional cell surface view for Atto-532-labelled Gremlin-1 (yellow) on LX-2 cells (labelled with CellMask Blue). Representative images for different combinations of 250 nM Gremlin-1 and isotype or anti-Gremlin-1 antibodies are given. BMP, bone morphogenetic protein.
-
Figure 3—source data 1
Excel spreadsheet containing data displayed in panels A–E.
- https://cdn.elifesciences.org/articles/95185/elife-95185-fig3-data1-v1.xlsx
Figure 3—figure supplement 1
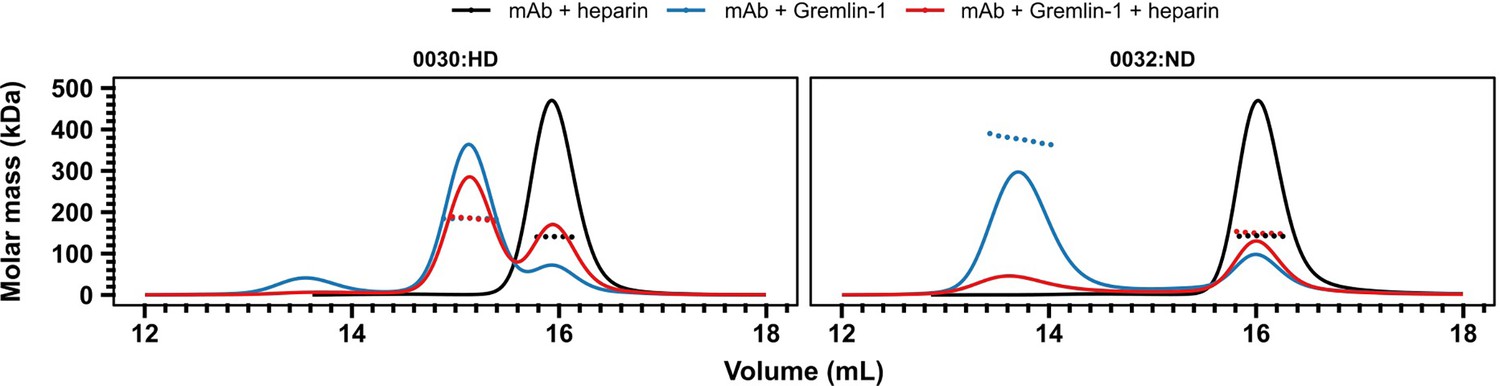
Size exclusion chromatography for Gremlin-1-anti-Gremlin-1-heparin complexes.
Different combinations of heparin-displacing (’0030, left) or non-displacing (’0032, right) therapeutic anti-Gremlin-1 antibodies with heparin alone, Gremlin-1 alone, or Gremlin-1 and heparin were run on a size exclusion chromatography column. The graph shows UV signal (continuous line) and estimated molar mass (points) on the y-axis, depending on the eluting volume on the x-axis. The low recovery of 0032/Gremlin-1/heparin complexes was accompanied by visual precipitation in the sample vial, indicating the formation of macroscopic insoluble complexes.
-
Figure 3—figure supplement 1—source data 1
Excel spreadsheet containing data displayed in Figure 3—figure supplement 1.
- https://cdn.elifesciences.org/articles/95185/elife-95185-fig3-figsupp1-data1-v1.xlsx
Figure 4 with 1 supplement
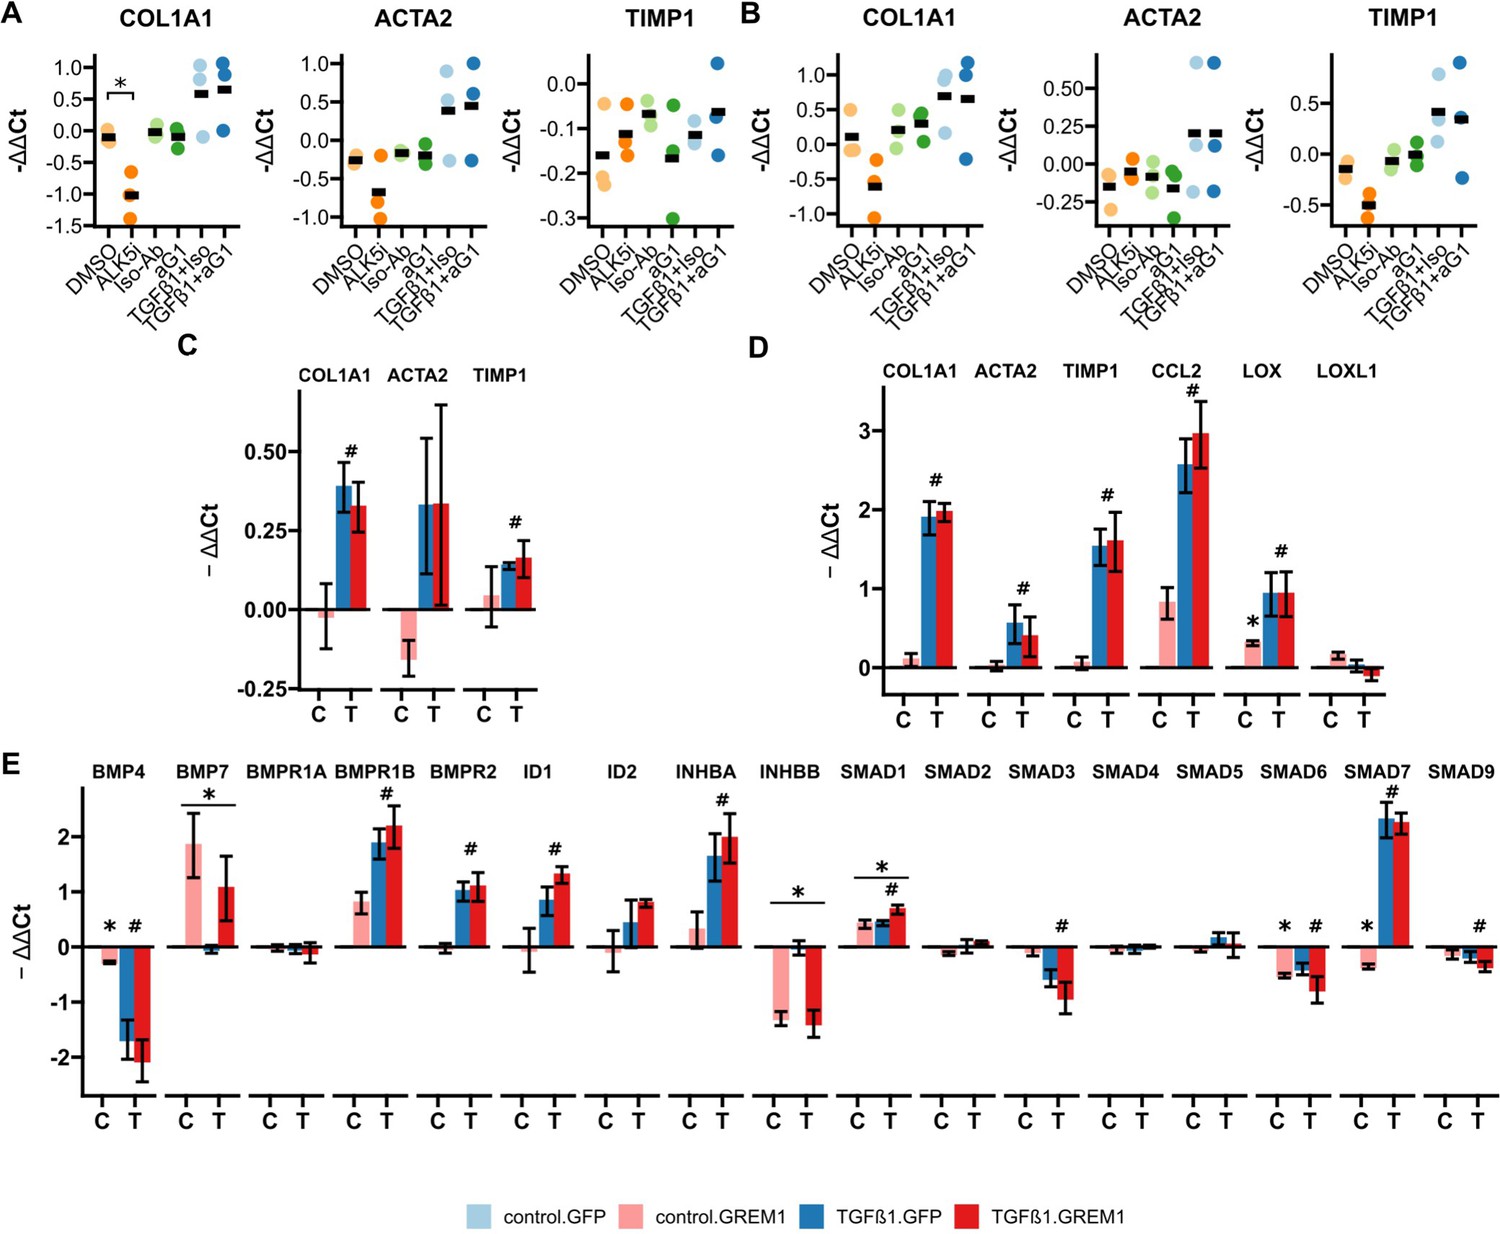
RTqPCR results for anti-Gremlin-1 and lenti-GREM1-treated fibrogenic cells.
(A) Fibrogenic marker genes in primary human hepatic stellate cells treated with anti-Gremlin-1 (aG1) or isotype control antibodies (iso-Ab). (B) Fibrogenic marker genes in primary human hepatic myofibroblasts treated with anti-Gremlin-1 or isotype control antibodies. (C) Fibrogenic gene expression in lentivirally transduced human hepatic stellate cells (HHSC). (D) Fibrogenic gene expression in lentivirally transduced LX-2. (E) Bone morphogenetic protein (BMP) signalling-related gene expression in lentivirally transduced LX-2. (A–B) Data are presented as individual data points and mean for -ΔΔCt relative to untreated control and normalised to the expression of SRSF4. *p<0.05 in one-way ANOVA and post hoc paired t-tests for pre-defined comparisons with Bonferroni-Holm adjustment. (C–E) Data are given as mean ± SEM of -ΔΔCt relative to GFP and vehicle control and normalised to the expression of SRSF4. *p<0.05 in GREM1 vs GFP-control, #p<0.05 in TGFβ1 vs vehicle control in repeated measures two-way ANOVA and post hoc paired t-test for pre-selected comparisons and Bonferroni-Holm adjustment.
-
Figure 4—source data 1
Excel spreadsheet containing data displayed in panels A–E.
- https://cdn.elifesciences.org/articles/95185/elife-95185-fig4-data1-v1.xlsx
Figure 4—figure supplement 1
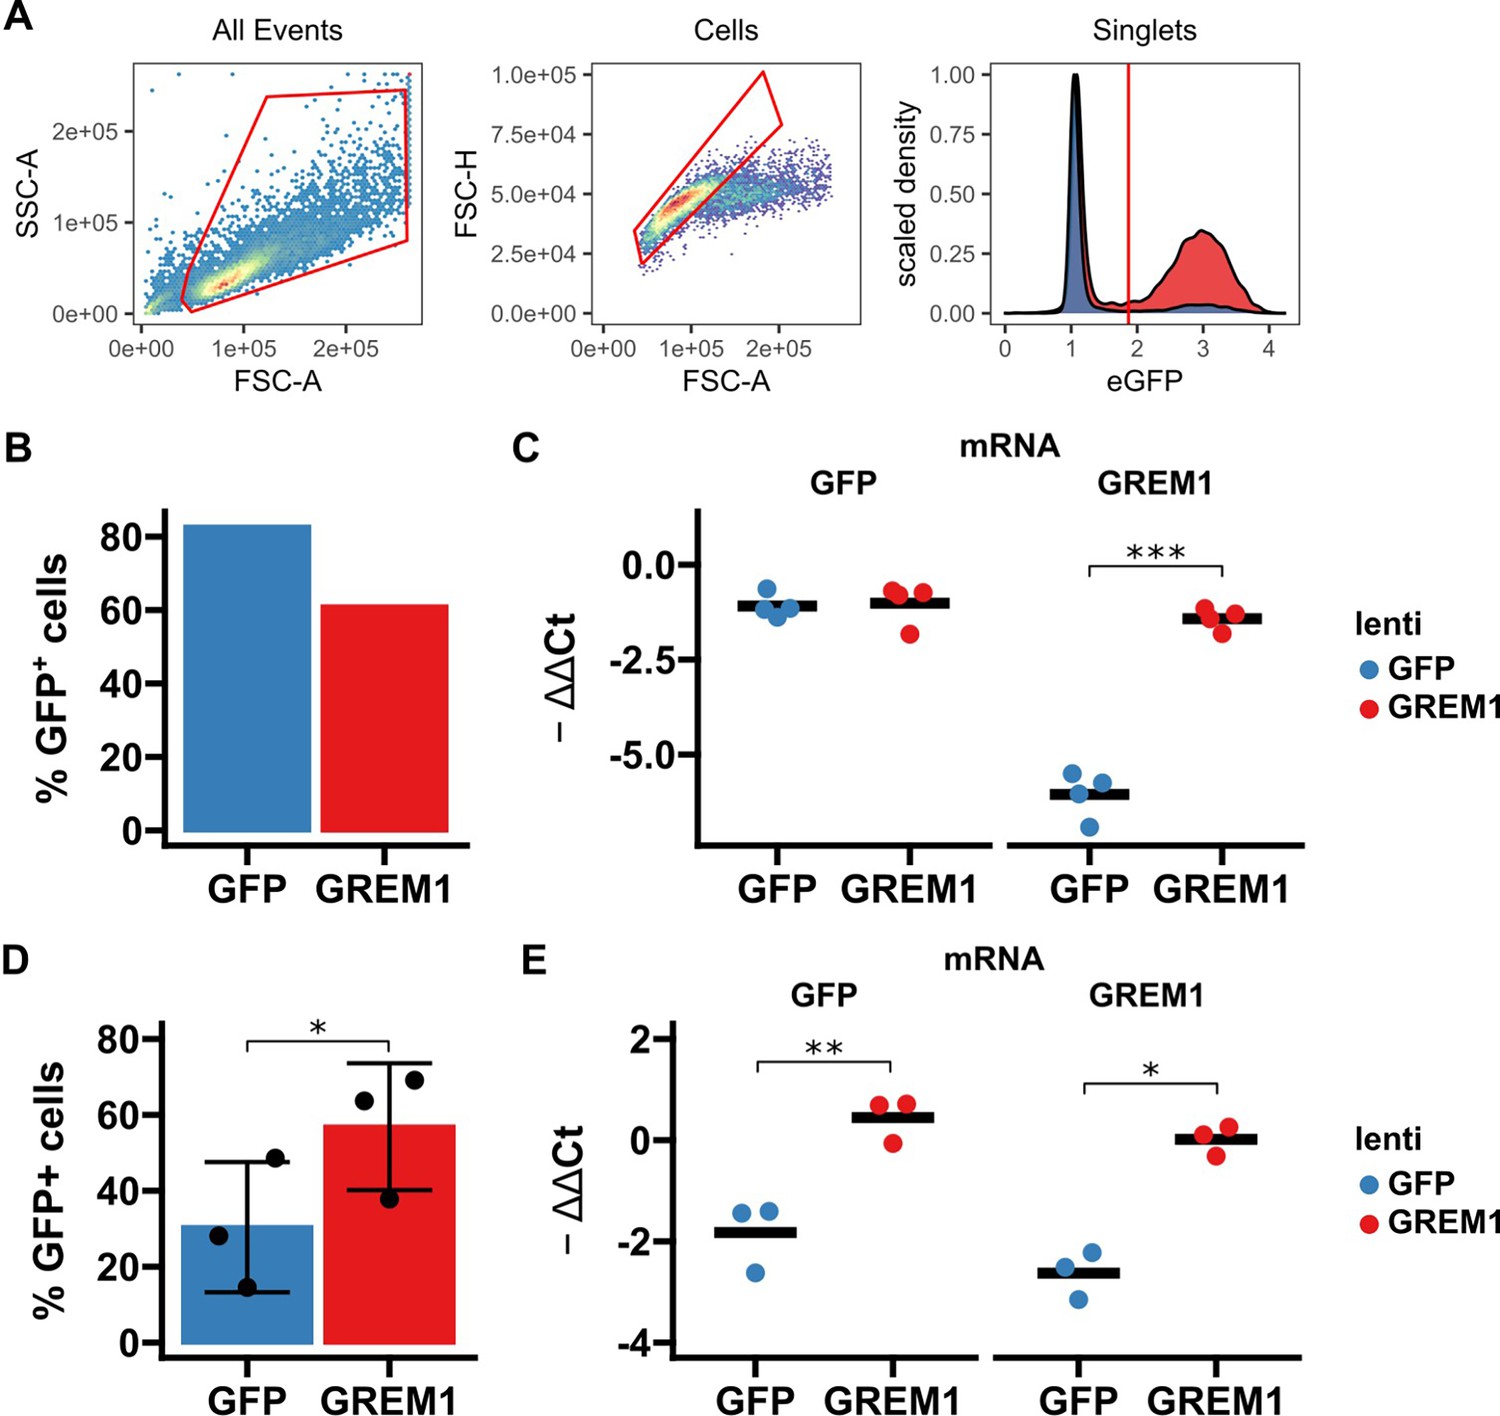
Validation of GREM1 overexpression in LX-2 and human hepatic stellate cells (HHSC) by flow cytometry and RTqPCR.
(A) Gating strategy for flow sorting of lentivirally transduced cells. First, cells were selected (left panel) before gating on singlets (middle panel). Cells were then gated based on the 99% percentile of non-transduced cells to identify cells positive for GFP (right panel). Red polygons show gates and the red vertical line in the right panel shows the cut-off for GFP positivity. (B) Bar diagram showing percentage of GFP-positive cells in GREM1 or GFP-control lentivirally transduced LX-2, n=1. (C) SybrGreen RTqPCR results for GFP and GREM1 mRNA in lentivirally transduced LX-2, n=4. (D) Bar diagram showing percentage of GFP-positive cells in GREM1 or GFP-control lentivirally transduced HHSC, n=3. (E) SybrGreen RTqPCR results for GFP and GREM1 mRNA in lentivirally transduced HHSC, n=3. Data in B and D are given as individual data points and mean ± SD; data in C and E are given as individual data points and mean. *p<0.05, **p<0.01, and ***p<0.001 in paired two-sided t-test.
-
Figure 4—figure supplement 1—source data 1
Excel spreadsheet containing data displayed in Figure 4—figure supplement 1B–E.
- https://cdn.elifesciences.org/articles/95185/elife-95185-fig4-figsupp1-data1-v1.xlsx
Figure 5 with 3 supplements
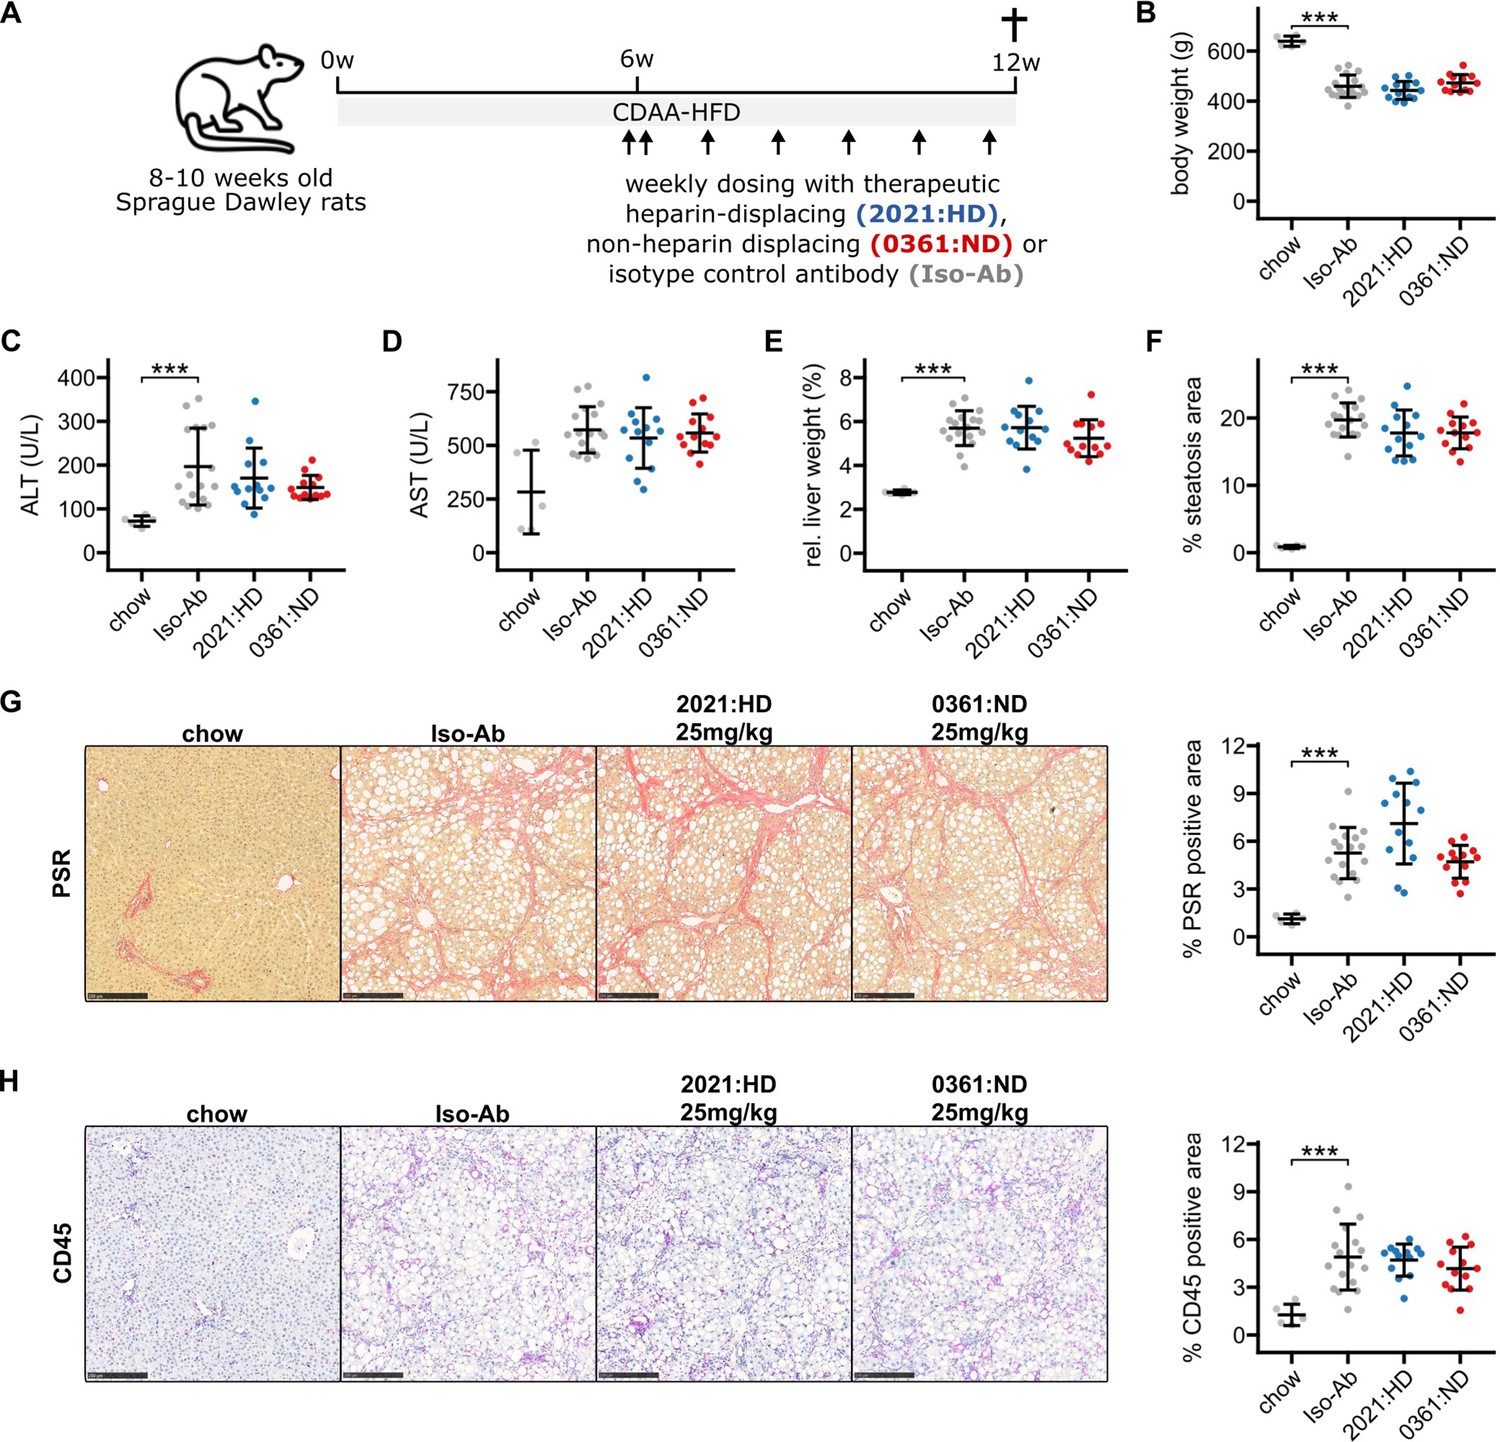
Results for anti-Gremlin-1 antibody treatment on choline-deficient, L-amino acid defined high-fat diet (CDAA-HFD) induced metabolic dysfunction-associated steatohepatitis (MASH) and fibrosis in rats.
(A) Schematic showing the study design for the animal experiment. 8- to 12-week-old Sprague-Dawley rats were fed a CDAA-HFD or standard chow for 12 weeks and treated with weekly subcutaneous injections of heparin-displacing, non-heparin-displacing, or isotype control antibodies for the last 6 weeks. (B) Quantification of body weight in grams at the end of the study. (C) Quantification of plasma alanine aminotransferase (ALT) in U/L. (D) Quantification of plasma aspartate aminotransferase (AST) in U/L. (E) Quantification of relative liver weight percent of total body weight. (F) Quantification of histological liver steatosis area in percent. Data are given as mean ± SD for n=5 (chow), n=17 (Iso-Ab), and n=13 (2021 and 0361) animals per group. (G) Left panel shows representative histological images for picrosirius red (PSR) staining for different treatment conditions. Scale bars represent 250 µm. Right panel shows quantification of PSR staining in percent of total area. (H) Left panel shows representative histological images for CD45 immunohistochemistry (IHC) for different treatment conditions. Scale bars represent 250 µm. Right panel shows quantification of CD45 IHC in percent of total area. Data are given as mean ± SD for n=5 (chow), n=17 (Iso-Ab), and n=13 (2021 and 0361) animals per group. Significance was determined by multiple two-sided paired Welch’s t-tests against Iso-Ab, followed by Bonferroni-Holm adjustment (***p<0.001). Scale bars represent 250 μM.
-
Figure 5—source data 1
Excel spreadsheet containing data displayed in panels B–H.
- https://cdn.elifesciences.org/articles/95185/elife-95185-fig5-data1-v1.xlsx
Figure 5—figure supplement 1
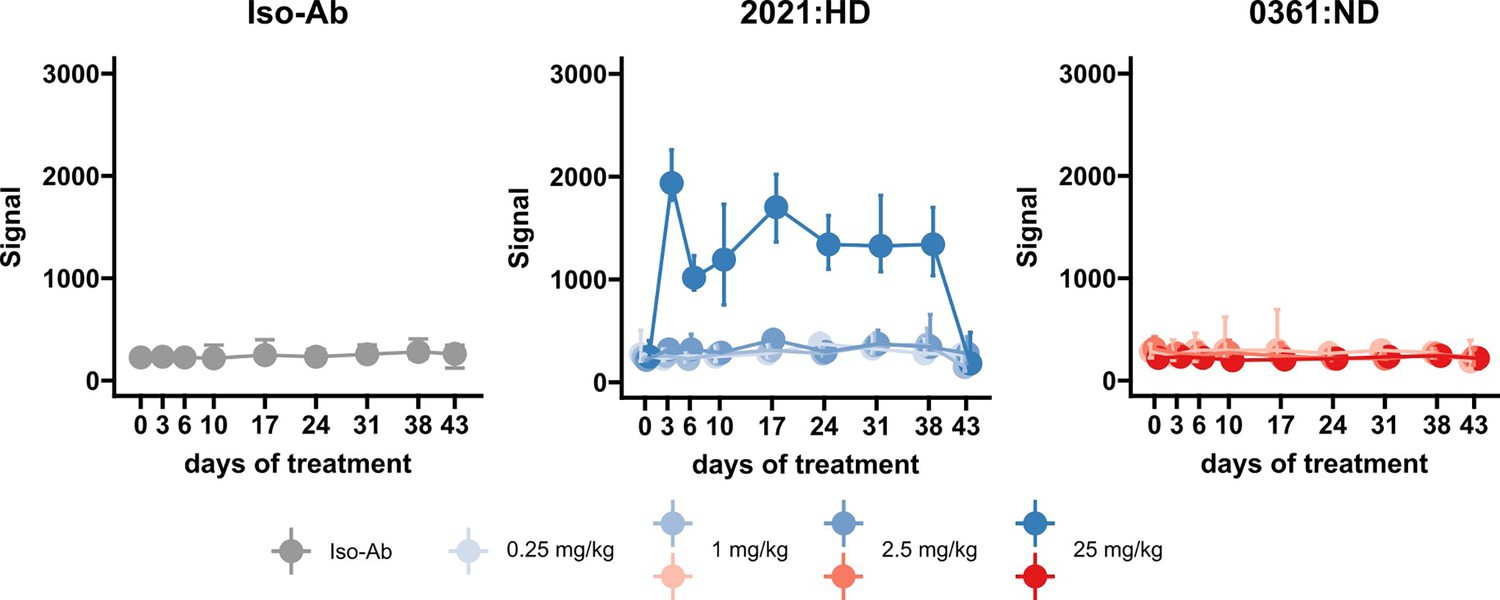
Target engagement studies in the rat choline-deficient, L-amino acid defined high-fat diet (CDAA-HFD) model.
Peripheral blood samples were taken before first antibody injection and at different timepoints during treatment, as indicated on the x-axes. Plots show signal intensity for Gremlin-1 protein in plasma by AlphaLISA. All data are given as median and IQR.
-
Figure 5—figure supplement 1—source data 1
Excel spreadsheet containing data displayed in Figure 5—figure supplement 1.
- https://cdn.elifesciences.org/articles/95185/elife-95185-fig5-figsupp1-data1-v1.xlsx
Figure 5—figure supplement 2
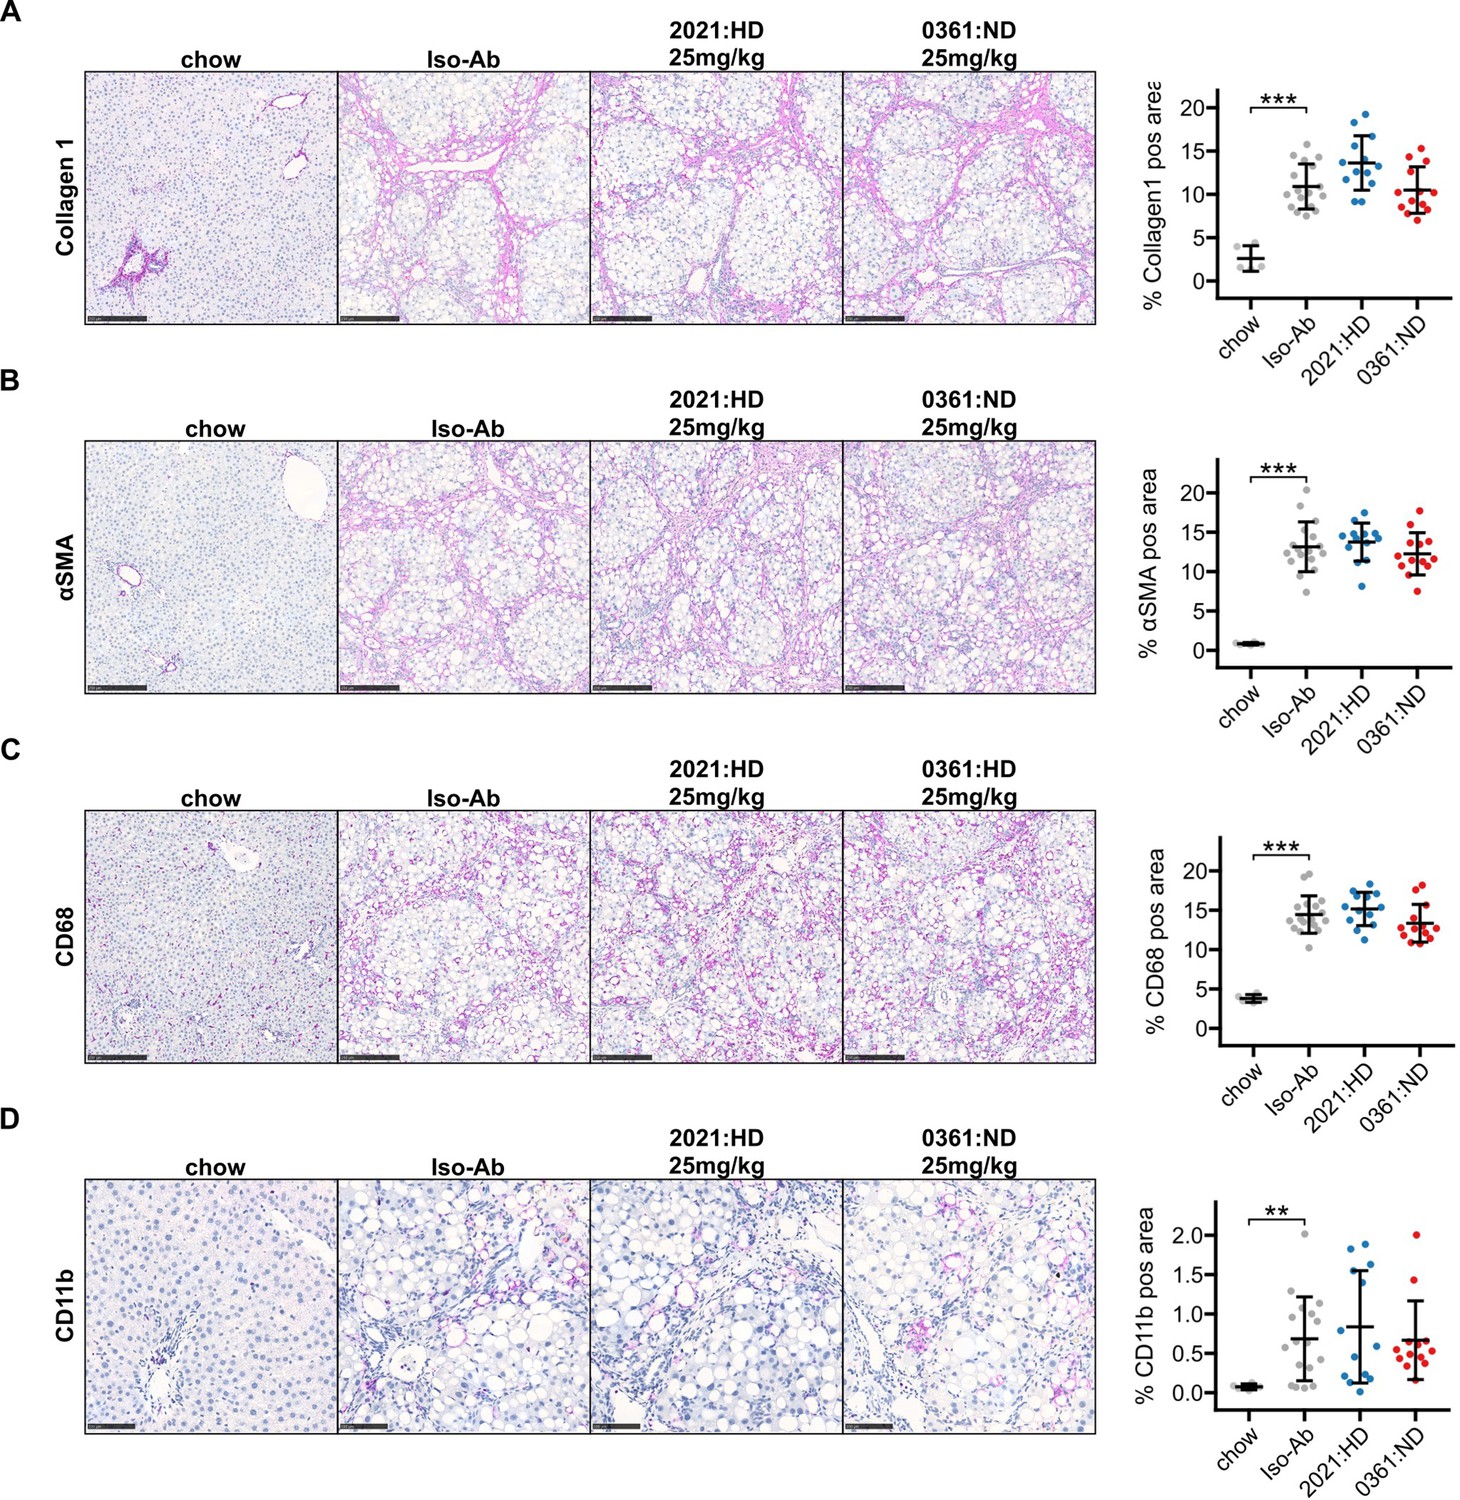
Additional immunohistochemistry (IHC) data from rat choline-deficient, L-amino acid defined high-fat diet (CDAA-HFD) study.
(A) Left panel shows representative histological images for Collagen 1 IHC for different treatment conditions. Scale bars represent 250 µm. Right panel shows quantification of Collagen 1 staining in percent of total area. (B) Left panel shows representative histological images for alpha smooth muscle actin (α-SMA) IHC for different treatment conditions. Scale bars represent 250 µm. Right panel shows quantification of α-SMA staining in percent of total area. (C) Left panel shows representative histological images for CD68 IHC for different treatment conditions. Scale bars represent 250 µm. Right panel shows quantification of CD68 staining in percent of total area. (D) Left panel shows representative histological images for CD11b IHC for different treatment conditions. Scale bars represent 100 µm. Right panel shows quantification of CD11b staining in percent of total area. Data are given as mean ± SD for n=5 (chow), n=17 (Iso-Ab), and n=13 (2021 and 0361) animals per group. Significance was determined by multiple two-sided paired Welch’s t-tests against Iso-Ab, followed by Bonferroni-Holm adjustment (**p<0.01, ***p<0.001). Scale bars represent 250 μM.
-
Figure 5—figure supplement 2—source data 1
Excel spreadsheet containing data displayed in Figure 5—figure supplement 2, panels A–D.
- https://cdn.elifesciences.org/articles/95185/elife-95185-fig5-figsupp2-data1-v1.xlsx
Figure 5—figure supplement 3
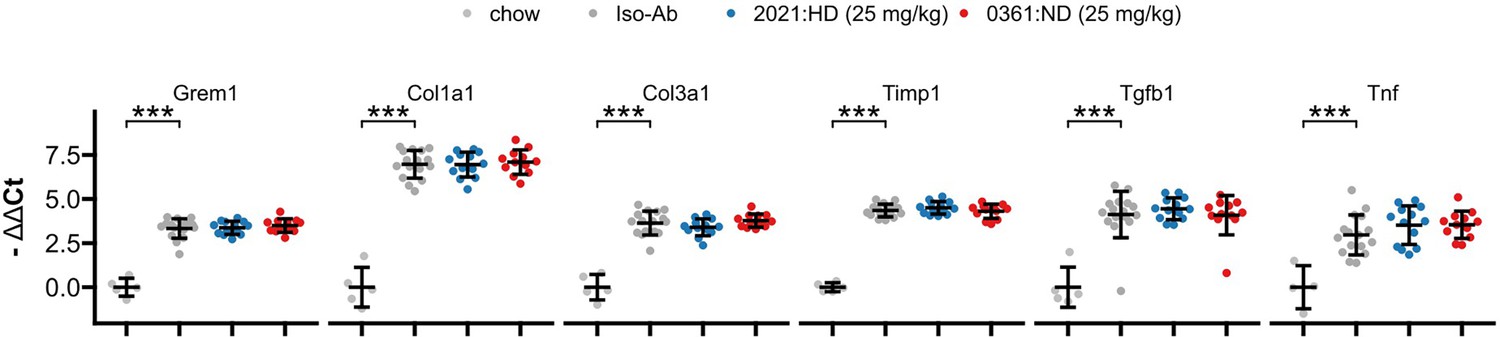
RTqPCR results for anti-Gremlin-1 antibody treatment on choline-deficient, L-amino acid defined high-fat diet (CDAA-HFD) induced metabolic dysfunction-associated steatohepatitis (MASH) and fibrosis in rats.
Data are given as single data points and mean ± SEM for -ΔΔCt relative to chow control and normalised to B2m expression. ***p<0.001 in one-way ANOVA and post hoc Dunnett test compared to Iso-Ab-treated animals.
-
Figure 5—figure supplement 3—source data 1
Excel spreadsheet containing data displayed in Figure 5—figure supplement 3.
- https://cdn.elifesciences.org/articles/95185/elife-95185-fig5-figsupp3-data1-v1.xlsx
Figure 6 with 2 supplements
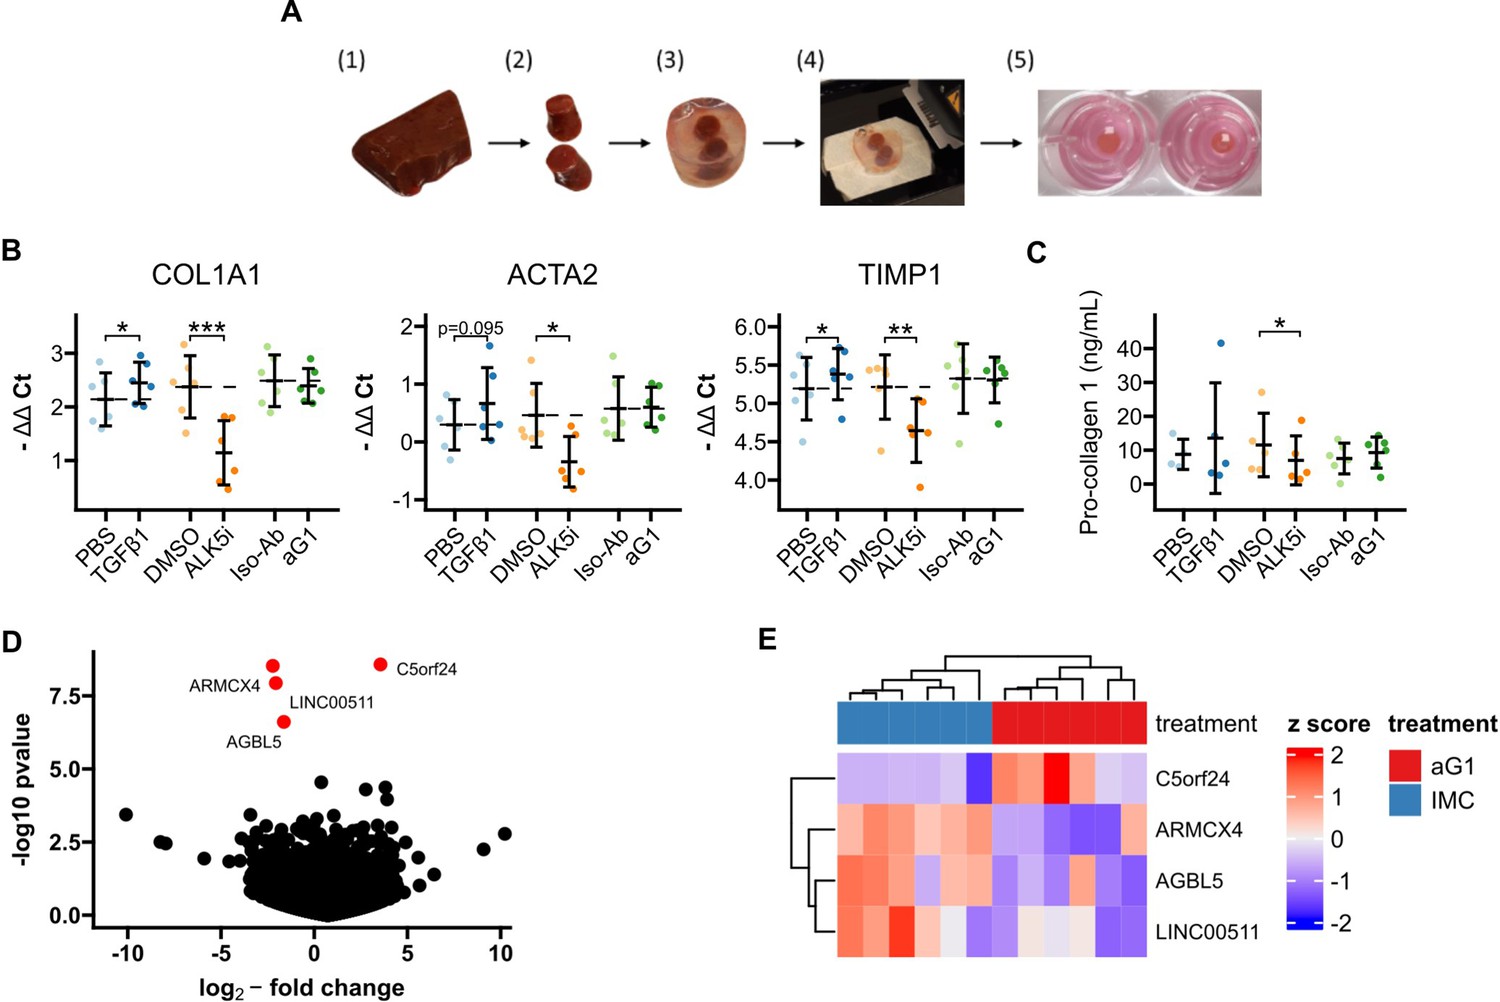
Precision-cut liver slices (PCLS).
(A) Schematic for generation of human cirrhotic PCLS. (1) Human cirrhotic liver tissue was obtained from explants and (2) 8 mm biopsy cores were taken. (3) Tissue samples were then embedded in low-melt agarose before (4) being cut into 250 µm thin slices on a vibratome. (5) Finally, slices were incubated in 8 µm 12-well inserts for 24 hr under constant agitation. (B) RTqPCR results for fibrogenic marker genes in cirrhotic PCLS. Data are given as individual data points and mean ± SD for -ΔΔCt relative to untreated control and normalised to the geometric mean of SRSF4, HPRT1, CTCF, and ERCC expression. *p<0.05, **p<0.01, ***p<0.001 in one-way ANOVA and post hoc paired t-tests for pre-defined comparisons with Bonferroni-Holm adjustment. (C) Pro-collagen 1 protein levels in PCLS culture supernatants. Data are given as individual data points and mean ± SD. *p<0.05 in one-way ANOVA and post hoc paired t-tests for pre-defined comparisons with Bonferroni-Holm adjustment. (D) Volcano plot of differential gene expression analysis of 3’ QuantSeq mRNA-sequencing showing log2-fold changes and the negative decadic logarithm of unadjusted p-values for all expressed genes in aG1 vs Iso-Ab-treated PCLS. Significantly regulated genes (i.e. adj. p-value<0.05) are labelled and marked in red. (E) Heatmap showing centred and scaled gene expression for significantly regulated genes. The anti-Gremlin-1 antibody (aG1) used for experiments in panels B and C was the 0030:HD antibody.
-
Figure 6—source data 1
Excel spreadsheet containing data displayed in panels B–E.
- https://cdn.elifesciences.org/articles/95185/elife-95185-fig6-data1-v1.xlsx
Figure 6—figure supplement 1
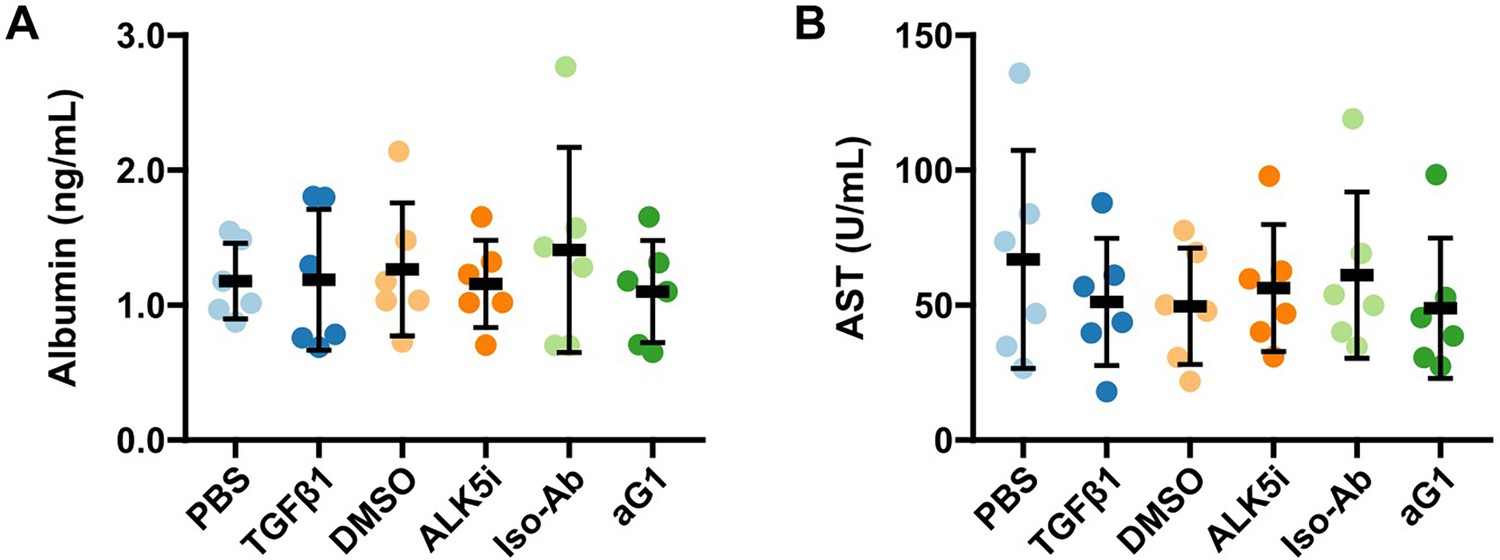
Aspartate aminotransferase (AST) and albumin levels in precision-cut liver slices (PCLS) supernatants.
(A) Albumin levels in supernatants of treated PCLS. (B) AST enzymatic activity in supernatants of treated PCLS. The anti-Gremlin-1 antibody (aG1) used for experiments was the 0030:HD antibody. Data are given as individual data points (coloured points) and mean ± SD for n=6 per treatment condition.
-
Figure 6—figure supplement 1—source data 1
Excel spreadsheet containing data displayed in Figure 6—figure supplement 1A–B.
- https://cdn.elifesciences.org/articles/95185/elife-95185-fig6-figsupp1-data1-v1.xlsx
Figure 6—figure supplement 2
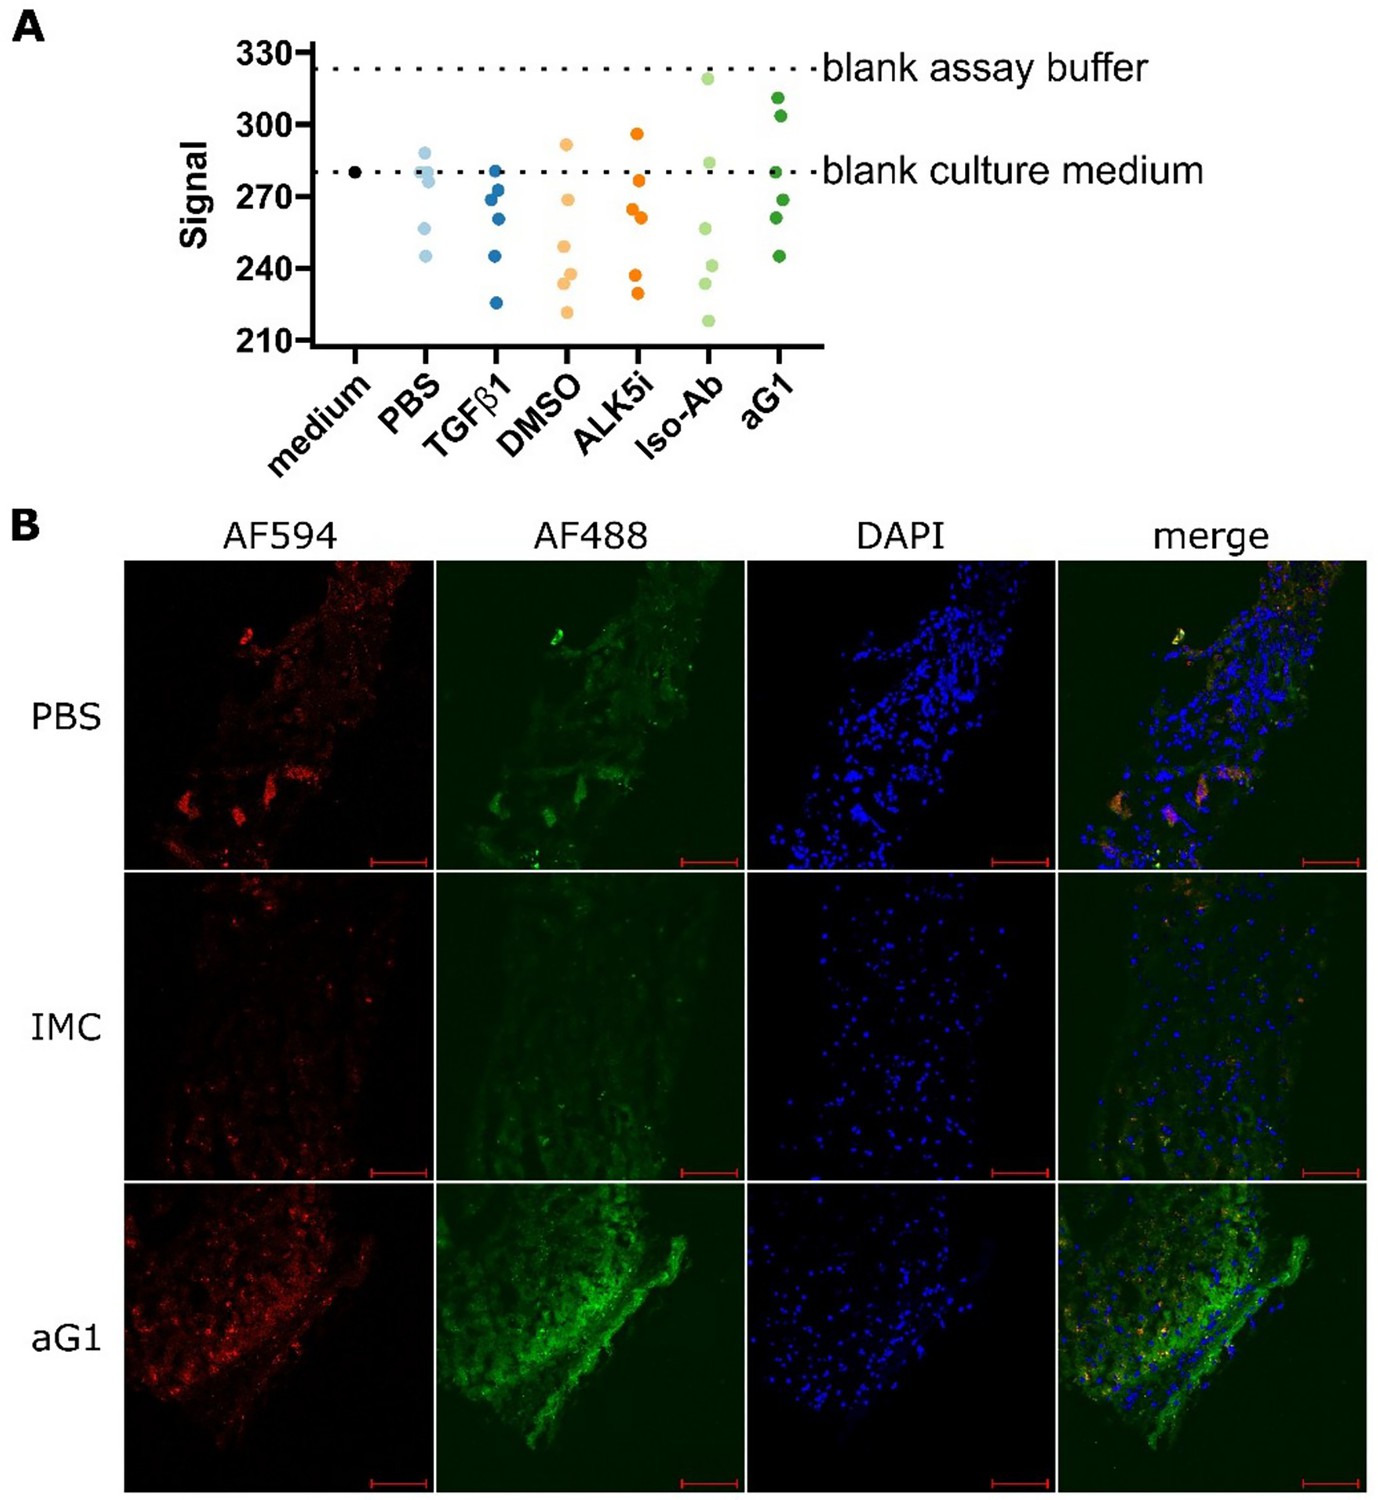
Target engagement studies in precision-cut liver slices (PCLS).
(A) Results of AlphaLISA for Gremlin-1 protein in supernatants of treated cirrhotic PCLS. Data are given as individual data points for fluorescent signal intensity and dotted lines indicate the signal intensities obtained using blank culture medium or blank assay buffer. (B) One set of cirrhotic PCLS was treated with either phosphate buffered saline (PBS) or AF488-conjugated non-heparin-displacing isotype control or anti-Gremlin-1 antibody for 24 hr. Unfixed frozen sections were imaged after autofluorescence quenching and staining with DAPI. Red autofluorescence was detected using the AF594 channel. Scale bar represents 100 µm. (C) The anti-Gremlin-1 antibody (aG1) used for experiments in panel A was the 0030:HD antibody, the aG1 used for panel B was the 0032:ND antibody.
-
Figure 6—figure supplement 2—source data 1
Excel spreadsheet containing data displayed in Figure 5—figure supplement 2A.
- https://cdn.elifesciences.org/articles/95185/elife-95185-fig6-figsupp2-data1-v1.xlsx
Tables
Table 1
Clinical baseline characteristics of the Fatty Liver Disease in Nordic Countries (FLINC) cohort (Figure 2A and B).
| Control (N=6) | MASLD (n=19) | p | |
|---|---|---|---|
| Age, years | 45.5 (27.3–63.0) | 56.0 (45.5–60.0) | 0.36* |
| Sex (female), N (%) | 3 (50) | 0 (47.4) | 1† |
| Diabetes, N (%) | 10 (52.6) | ||
| Hypertension, N (%) | 10 (52.6) | ||
| Dyslipidaemia, N (%) | 10 (52.6) | ||
| BMI | 23.1 (22.5–24.7) | 30.6 (28.3–33.4) | 0.0001* |
| NAS | 5 (4-6) | ||
| Fibrosis stage, N (%) | |||
| 0 | 5 (26.3) | ||
| 1 | 4 (21.1) | ||
| 2 | 7 (36.8) | ||
| 3 | 3 (15.8) | ||
-
Continuous data: median with p25–p75.
-
*
Mann-Whitney U test.
-
†
Fisher’s test.
Additional files
-
Supplementary file 1
Supplementary tables.
(a) Rat choline-deficient, L-amino acid defined high-fat diet (CDAA-HFD) study: clinical chemistry and histological results for all antibody concentrations. (b) Rat CDAA-HFD study: qPCR results for all antibody concentrations. (c) Table of TaqMan assay IDs. (d) Custom-made primer sequences.
- https://cdn.elifesciences.org/articles/95185/elife-95185-supp1-v1.docx
-
MDAR checklist
- https://cdn.elifesciences.org/articles/95185/elife-95185-mdarchecklist1-v1.docx
Download links
A two-part list of links to download the article, or parts of the article, in various formats.
Downloads (link to download the article as PDF)
Open citations (links to open the citations from this article in various online reference manager services)
Cite this article (links to download the citations from this article in formats compatible with various reference manager tools)
Evaluation of Gremlin-1 as a therapeutic target in metabolic dysfunction-associated steatohepatitis
eLife 13:RP95185.
https://doi.org/10.7554/eLife.95185.2


