Senescent cells inhibit mouse myoblast differentiation via the SASP-lipid 15d-PGJ2 mediated modification and control of HRas
- Metabolic Regulation of Cell Fate (RCF), Institute for Stem Cell Science and Regenerative Medicine (InStem), Bangalore Life Science Cluster, India
- Manipal Academy of Higher Education (MAHE), India
- University of North Carolina at Chapel Hill, United States
- Department of Biological Sciences, Indian Institute of Science Education and Research Kolkata (IISER-K), India
- Division of Biology and Biomedical Sciences, Washington University in St Louis, United States
- National Centre for Biological Sciences (NCBS), India
Figures
Figure 1 with 1 supplement
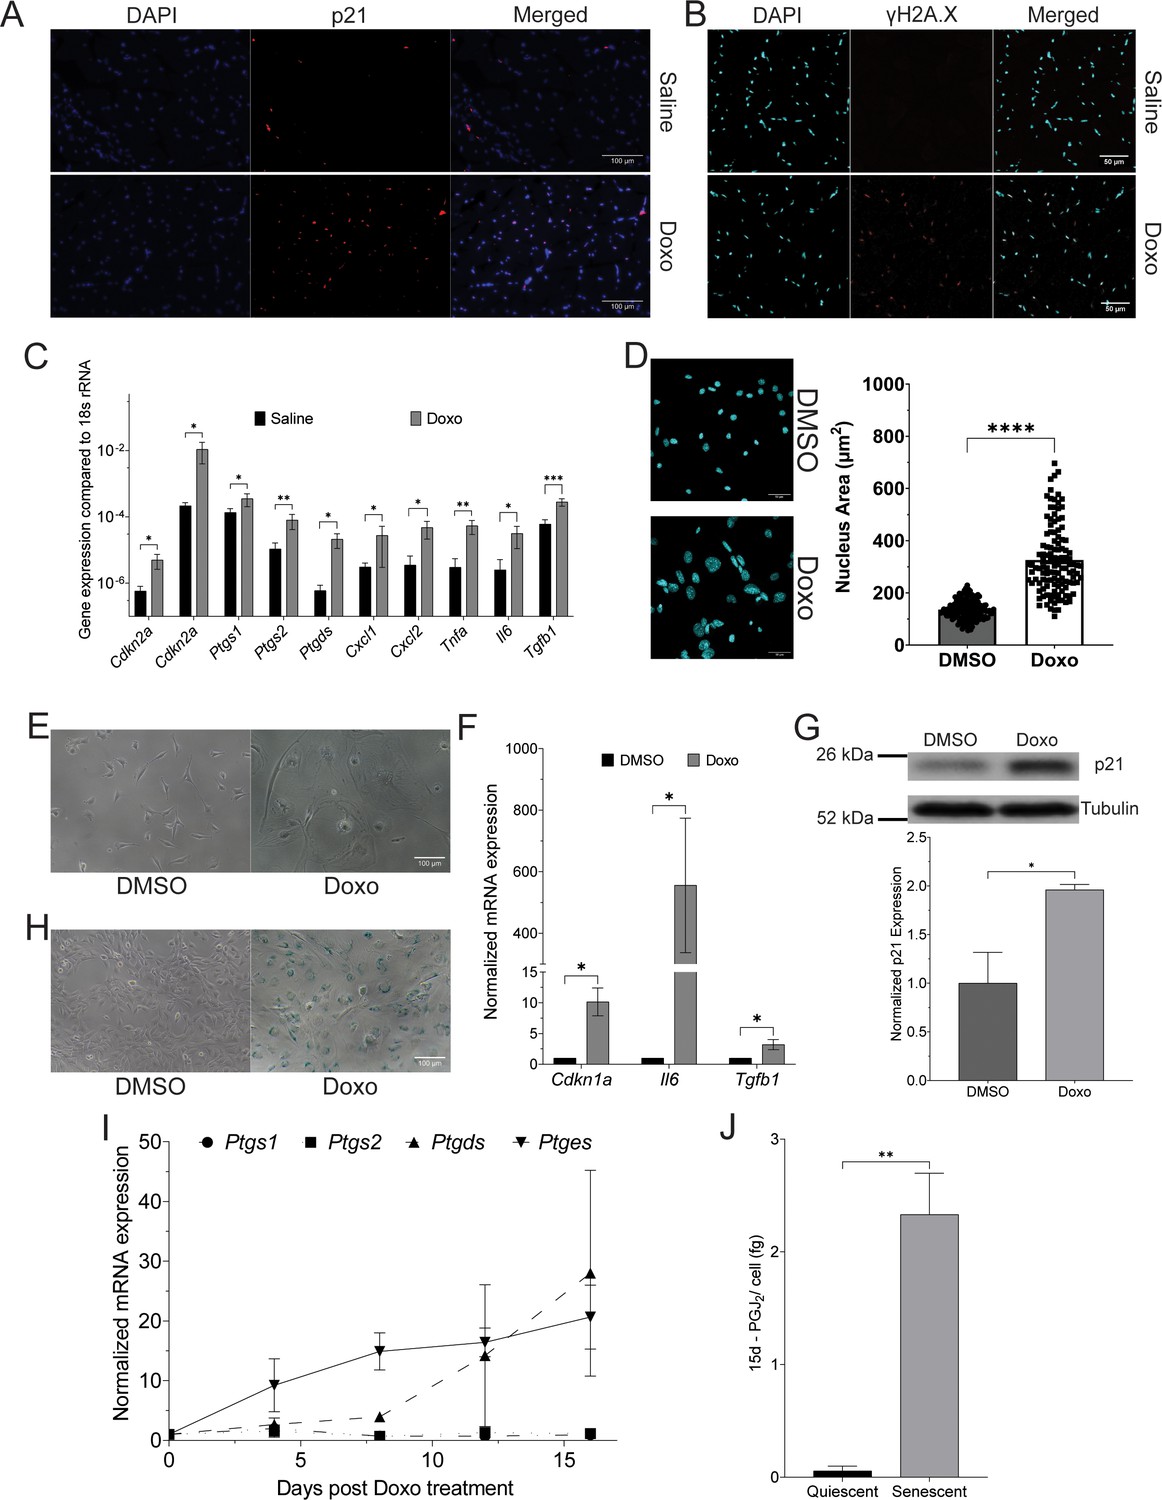
Treatment with Doxorubicin (Doxo) induces senescence in vitro and in vivo and leads to the release of prostaglandin 15d-PGJ2 by senescent cells.
(A) Expression and localization of tumor suppressor protein p21, measured by immunofluorescence, in hindlimb skeletal muscles of mice after 11 days of treatment with Doxo (5 mg/kg) or Saline (N = 3). (B) Representative confocal micrograph of expression of γH2A.X in the gastrocnemius muscle of mice treated with Doxo (5 mg/kg) or Saline (N = 3). (C) Expression of mRNAs of senescence markers (Cdkn2a and Cdkn1a), senescence-associated secreted phenotype (SASP) factors (Cxcl1, Cxcl2, Tnfa, Il6, and Tgfb1), and enzymes involved in the biosynthesis of prostaglandin PGD2/15d-PGJ2 (Ptgs1, Ptgs2, and Ptgds), measured by quantitative polymerase chain reaction (qPCR), in hindlimb skeletal muscles of mice after 11 days of treatment with Doxo (5 mg/kg) or Saline (N = 4). (D) A representative confocal micrograph and a scatter plot of the nuclear area of C2C12 myoblasts, measured by immunofluorescence, after 16 days of treatment with Doxo (150 nM) or Dimethyl Sulphoxide (DMSO) (N = 3). (E) A representative widefield micrograph of cell morphology in C2C12 myoblasts after 16 days of treatment with Doxo (150 nM) or DMSO (N = 3). (F) Expression of mRNA of cell cycle inhibitor Cdkn1a and SASP factors (Il6 and Tgfb1), measured by qPCR, in C2C12 myoblasts after 16 days of treatment with Doxo (150 nM) or DMSO (N = 3). (G) Expression of cell cycle inhibitor p21, measured by immunoblot, in C2C12 myoblasts after 16 days of treatment with Doxo (150 nM) or DMSO (N = 3). (H) Activity of senescence-associated β-galactosidase (SA β-gal), measured by X-gal staining at pH ~6, in C2C12 myoblasts after 16 days of treatment with Doxo (150 nM) or DMSO (N = 3). (I) Expression of mRNAs of prostaglandin biosynthetic enzymes, measured by qPCR, in C2C12 myoblasts after treatment with Doxo (150 nM) or DMSO (N = 4). (Statistical significance was tested using Dunnett’s multiple comparisons test (Figure 1—source data 3).) (J) Concentration of 15d-PGJ2 released from quiescent or senescent C2C12 cells (N = 3). (The Standard Deviation between replicates was plotted as error bars. Statistical significance was tested by the two-tailed Student’s t-test ns = p > 0.05, *p < 0.05, **p < 0.01, ***p < 0.001, ****p < 0.0001.)
-
Figure 1—source data 1
Uncropped and labelled gels for Figure 1.
- https://cdn.elifesciences.org/articles/95229/elife-95229-fig1-data1-v1.zip
-
Figure 1—source data 2
Raw unedited gels for Figure 1.
- https://cdn.elifesciences.org/articles/95229/elife-95229-fig1-data2-v1.zip
-
Figure 1—source data 3
Dunnett’s multiple comparison test for the time-dependent expression of prostaglandin biosynthesis enzymes.
C2C12 myoblasts treated with DMSO or Doxorubicin (Doxo) (150nM) from Day 0 to 16.
- https://cdn.elifesciences.org/articles/95229/elife-95229-fig1-data3-v1.xlsx
-
Figure 1—source data 4
15d-PGJ2 concentration in the conditioned medium using mass spectrometry.
Concentration of 15d-PGJ2 (picograms (pg) and femtograms (fg)/cell) measured in the conditioned medium of quiescent and senescent C2C12 mouse myoblasts.
- https://cdn.elifesciences.org/articles/95229/elife-95229-fig1-data4-v1.xlsx
Figure 1—figure supplement 1
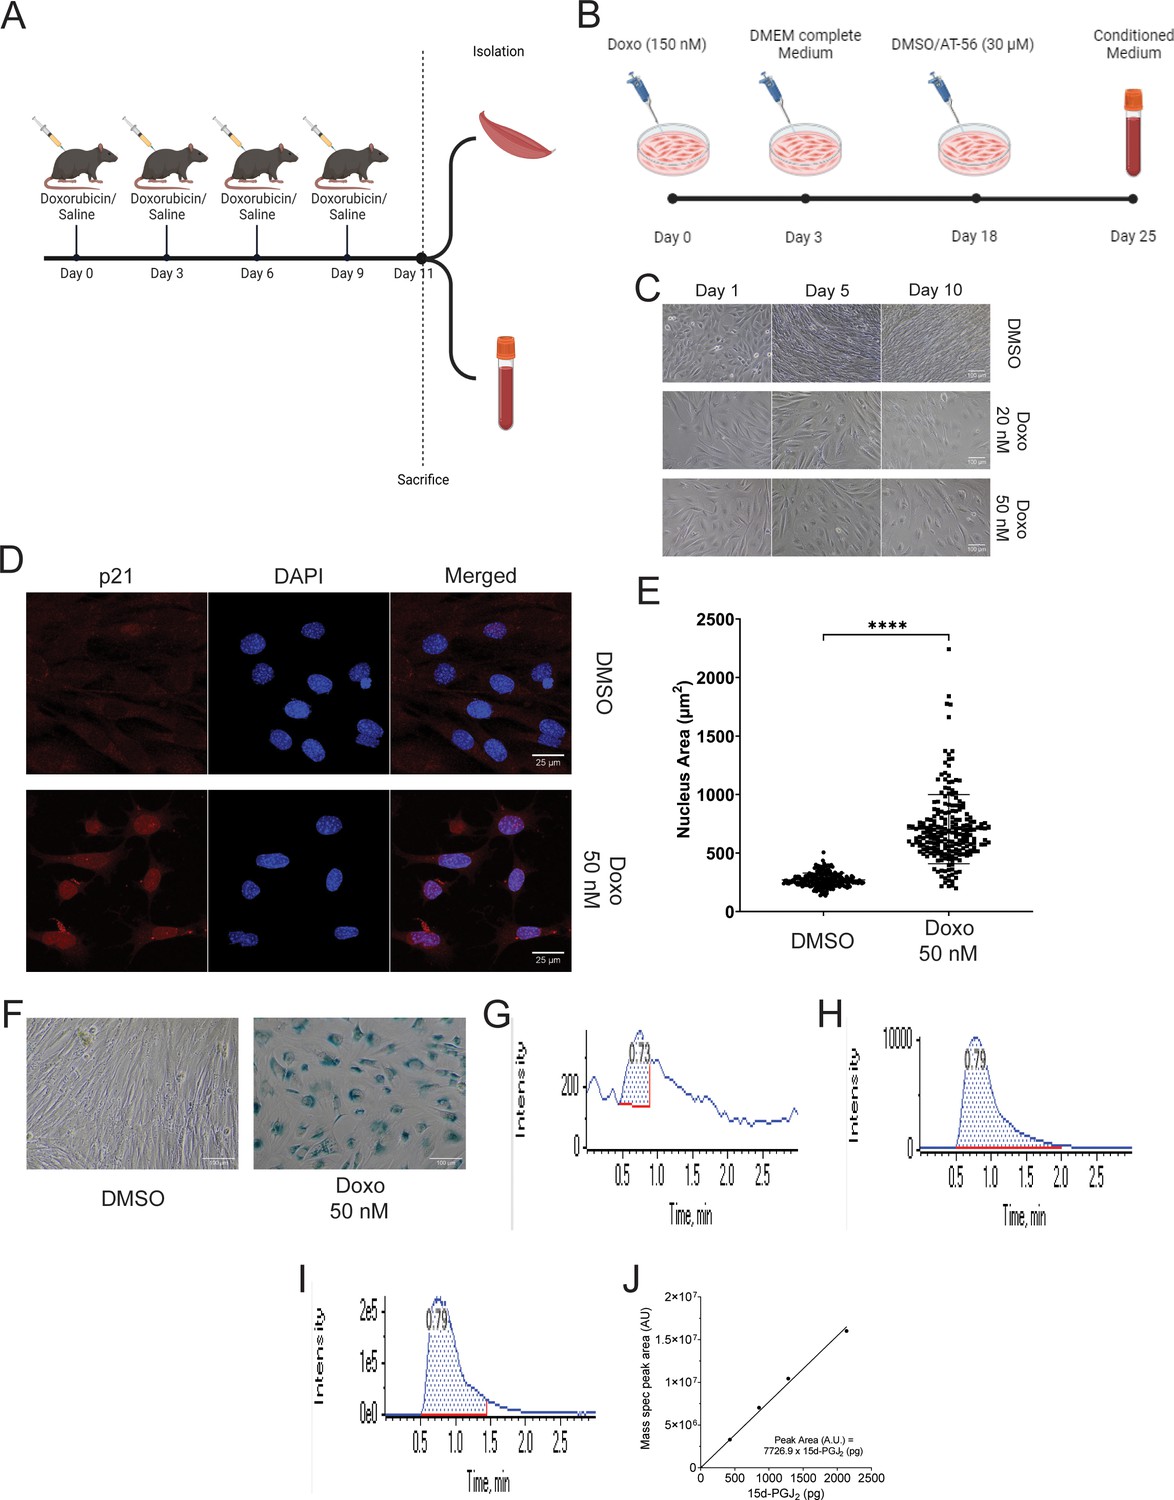
Treatment with Doxorubicin (Doxo) induces senescence in vivo and in vitro and induces release of eicosanoid prostaglandin 15d-PGJ2.
(A) Schematic representation of the experimental flow for treatment of B6J mice with Doxo (5 mg/kg) or Saline. (B) Schematic representation of the experimental flow for treatment of senescent C2C12 cells with prostaglandin D synthase (PTGDS) inhibitor AT-56 (30 µM) or DMSO. (C) Morphology of MCF7 human breast adenocarcinoma cells after treatment with Doxo. (D) Expression and nuclear localization of cell cycle inhibitor p21 in MCF7 cells after 10 days of treatment with Doxo. (E) Nuclear area in MCF7 cells after 10 days of treatment with Doxo. (F) Expression of senescence-associated β-galactosidase activity (SA β-gal), measured by X-Gal staining in MCF7 cells after 10 days of treatment with Doxo. (G) Representative peak of quantification of m/z 315.100 ➔ m/z 271 transitions from blank samples. (H) Representative peak of quantification of m/z 315.100 ➔ m/z 271 transitions from conditioned medium of C2C12 myoblasts treated with DMSO. (I) Representative peak of quantification of m/z 315.100 ➔ m/z 271 transitions from conditioned medium of C2C12 myoblasts treated with Doxo (150 Nm). (J) Standard curve of m/z 315.100 ➔ m/z 271 fragment peak areas vs concentrations of 15d-PGJ2. (The Standard Deviation between replicates was plotted as error bars. Statistical significance was tested by the two-tailed Student’s t-test ****p < 0.0001.)
Figure 2 with 1 supplement
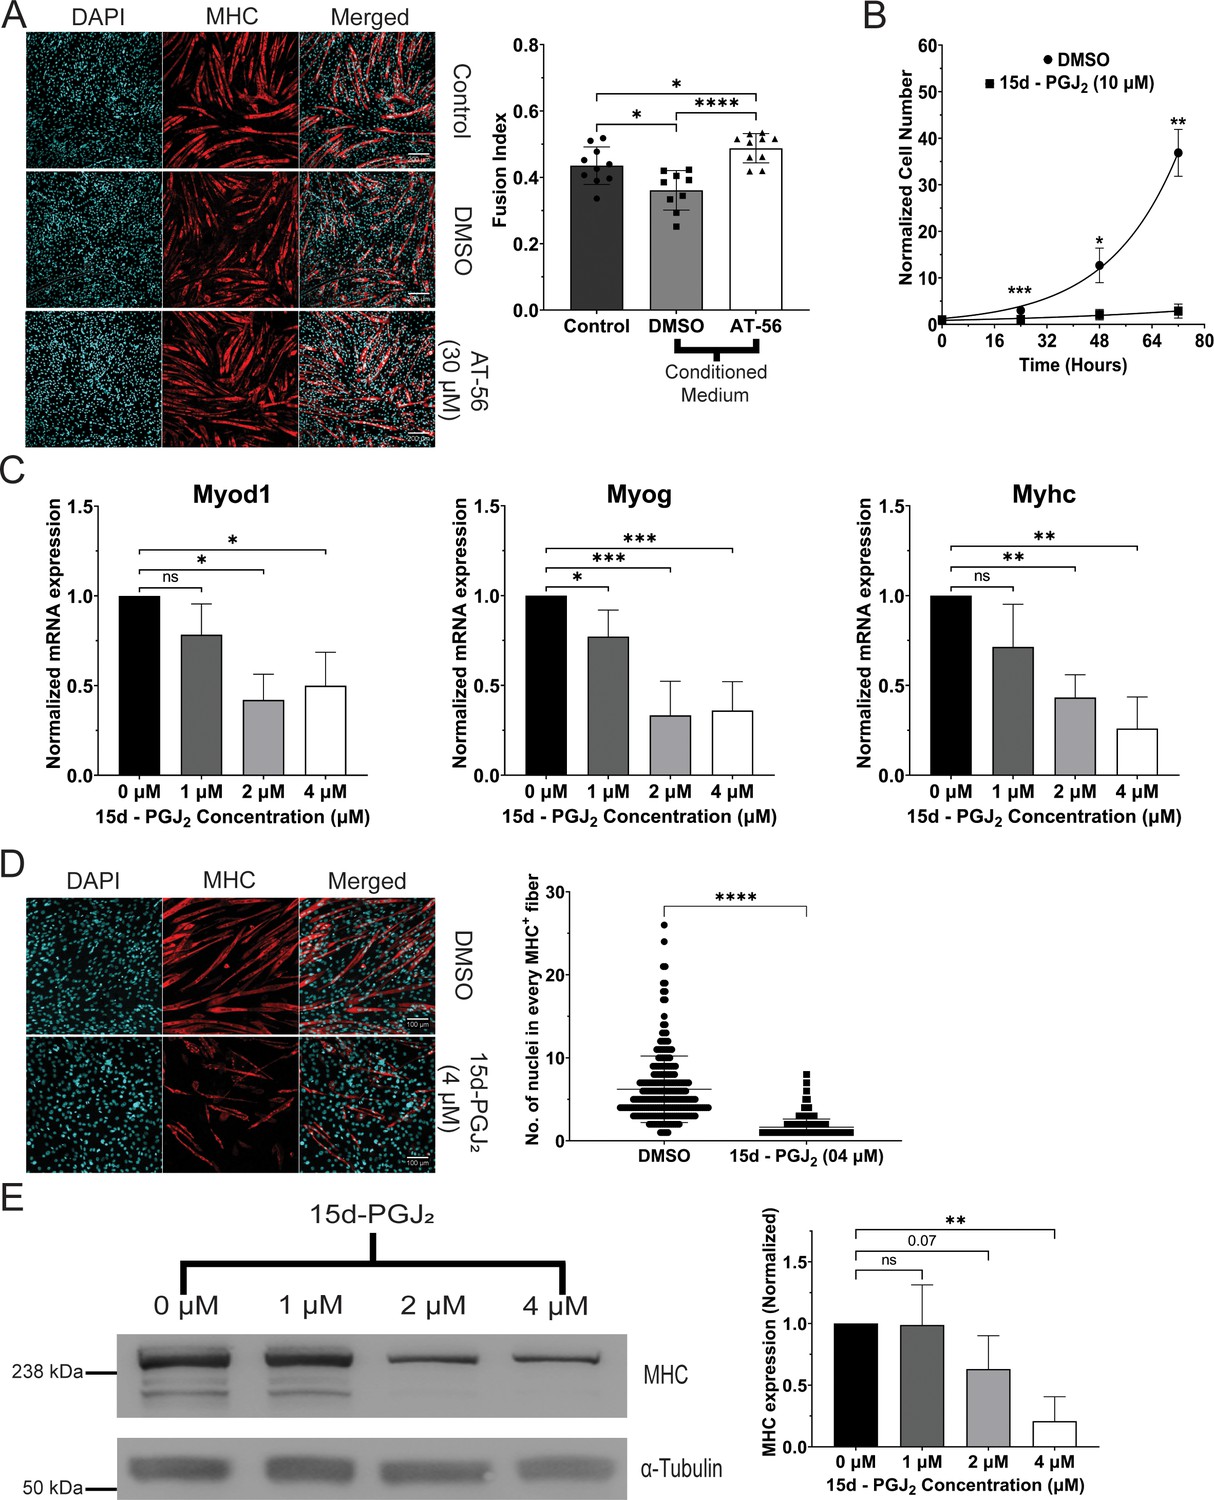
15d-PGJ2 inhibits differentiation of myoblasts.
(A) Expression of Myosin Heavy Chain (MHC) protein and the fusion of myoblasts in myotubes, measured by immunofluorescence, after treatment with conditioned medium of senescent cells treated with prostaglandin D synthase (PTGDS) inhibitor AT-56 (30 µM) or DMSO. (B) Normalized number of C2C12 myoblasts treated with 15d-PGJ2 (10 µM) or DMSO (N = 3). (C) Expression of mRNAs of markers of differentiation (Myod1, Myog, and Myhc), measured by qPCR, in C2C12 myoblasts treated with 15d-PGJ2 (1, 2, or 4 µM) or DMSO (N = 3). (D) Expression of MHC protein and the fusion of myoblasts in syncytial myotubes, measured by immunofluorescence, after treatment with 15d-PGJ2 (4 µM) or DMSO (N = 3). (E) Expression of MHC protein, measured by immunoblotting, in primary human skeletal myoblasts after treatment with 15d-PGJ2 (1, 2, or 4 µM) or DMSO for 5 days (N = 3). (The Standard Deviation between replicates was plotted as error bars. Statistical significance was tested by the two-tailed Student’s t-test ns = p > 0.05, *p < 0.05, **p < 0.01, ***p < 0.001, ****p < 0.0001.)
-
Figure 2—source data 1
Uncropped and labelled gels for Figure 2.
- https://cdn.elifesciences.org/articles/95229/elife-95229-fig2-data1-v1.zip
-
Figure 2—source data 2
Raw unedited gels for Figure 2.
- https://cdn.elifesciences.org/articles/95229/elife-95229-fig2-data2-v1.zip
Figure 2—figure supplement 1
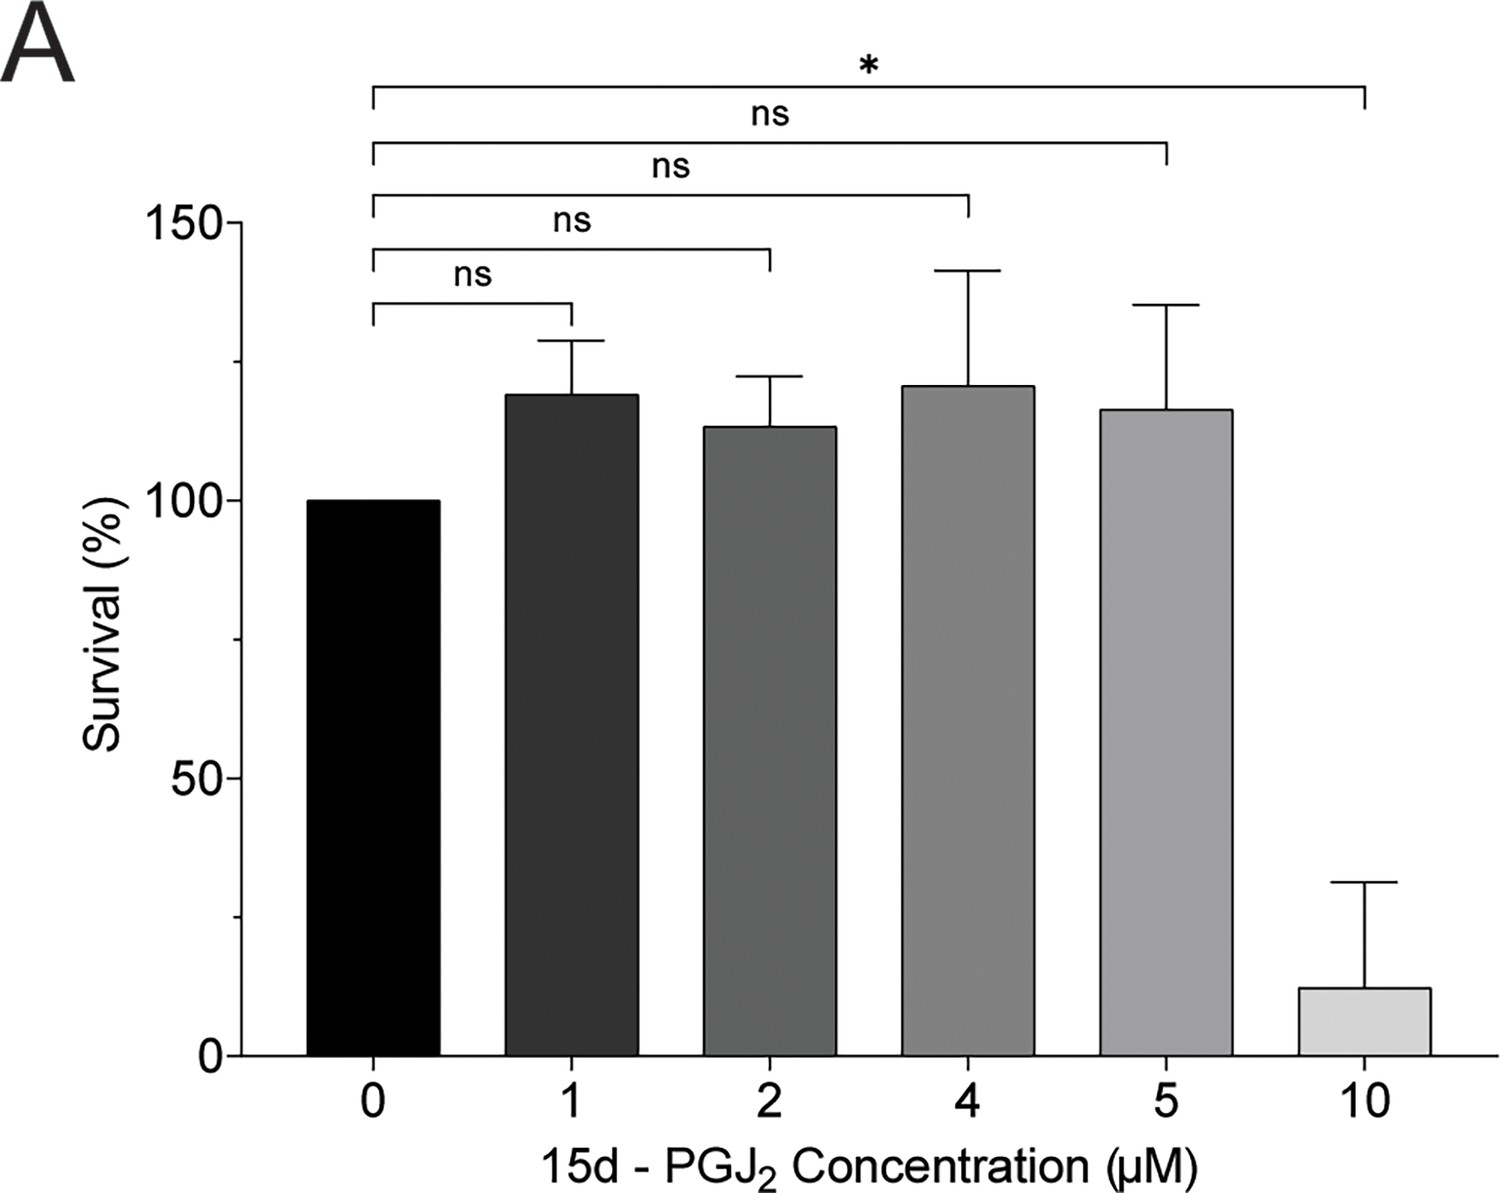
Viability of C2C12 myoblasts after treatment with 15d-PGJ2 (10 µM) in differentiating medium.
(A) Viability of C2C12 cells, measured by MTT (3-(4,5-dimethylthiazol-2-yl)-2,5-diphenyltetrazolium bromide) assay, after 24 hr of treatment with 15-PGJ2 (0, 1, 2, 4, 5, and 10 µM). (The Standard Deviation between replicates was plotted as error bars. Statistical significance was tested by the two-tailed Student’s t-test ns = p > 0.05, *p < 0.05.)
Figure 3 with 1 supplement
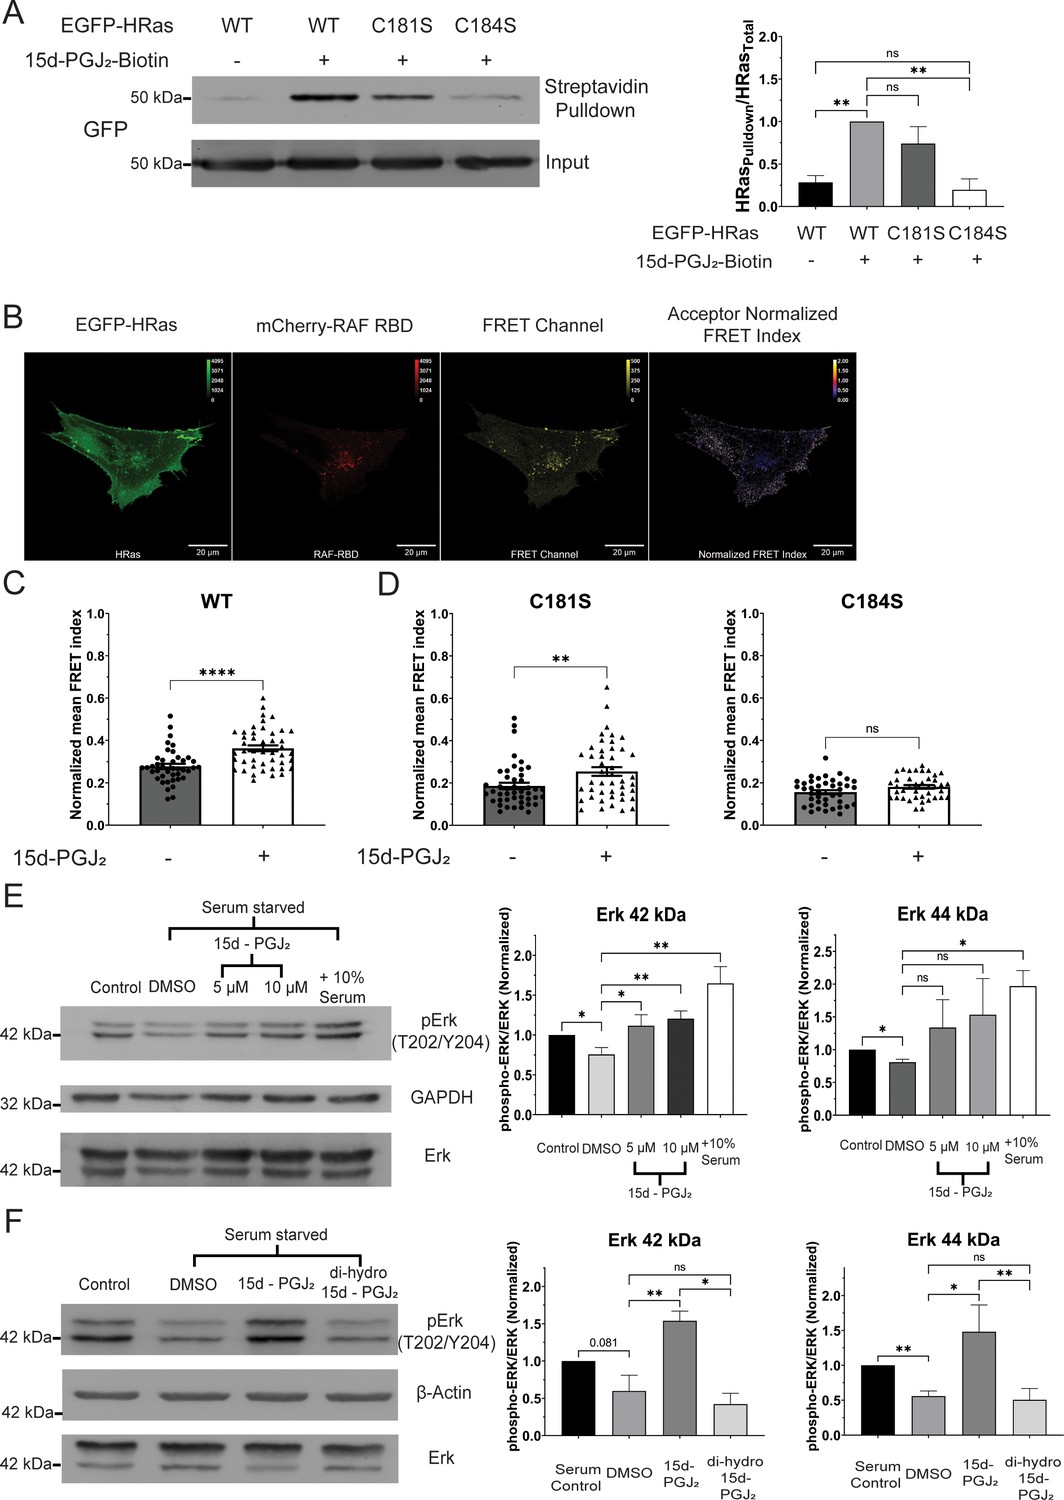
15d-PGJ2 covalently modifies HRas at cysteine 184 and activates the HRas–MAP kinase (MAPK) pathway via the electrophilic cyclopentenone ring.
(A) Streptavidin-immunoprecipitation of EGFP-HRas, measured by immunoblotting, in C2C12 cells after 3 hr of treatment with 15d-PGJ2-Biotin (5 µM) (N = 3). (B) Representative confocal micrograph of fluorescence resonance energy transfer (FRET) between EGFP-tagged HRas (EGFP-HRas) and mCherry-tagged Ras-binding domain (RBD) of RAF kinase (mCherry-RAF-RBD). (C) Activation of the EGFP-tagged wild-type HRas (HRas WT), measured by FRET, before and after 1 hr of treatment with 15d-PGJ2 (10 µM) after starvation for 24 hr. (D) Activation of the EGFP-tagged C-terminal cysteine mutants of HRas (HRas C181S and HRas C184S), measured by FRET, before and after 1 hr of treatment with 15d-PGJ2 (10 µM) after starvation for 24 hr. (E) Phosphorylation of Erk (42 kDa and 44 kDa), measured by immunoblotting, in C2C12 cells after 1 hr of treatment with 15d-PGJ2 (5 and 10 µM) or DMSO after starvation for 24 hr (N = 3). (F) Phosphorylation of Erk (42 and 44 kDa), measured by immunoblotting, in C2C12 cells after 1 hr of treatment with 15d-PGJ2 (10 µM)/ 9,10-dihydro-15d-PGJ2 (10 µM) or DMSO after starvation for 24 hr (N = 3). (The Standard Deviation between replicates was plotted as error bars. Statistical significance was tested by the two-tailed Student’s t-test ns = p > 0.05, *p < 0.05, **p < 0.01, ****p < 0.0001.)
-
Figure 3—source data 1
Uncropped and labelled gels for Figure 3.
- https://cdn.elifesciences.org/articles/95229/elife-95229-fig3-data1-v1.zip
-
Figure 3—source data 2
Raw unedited gels for Figure 3.
- https://cdn.elifesciences.org/articles/95229/elife-95229-fig3-data2-v1.zip
Figure 3—figure supplement 1
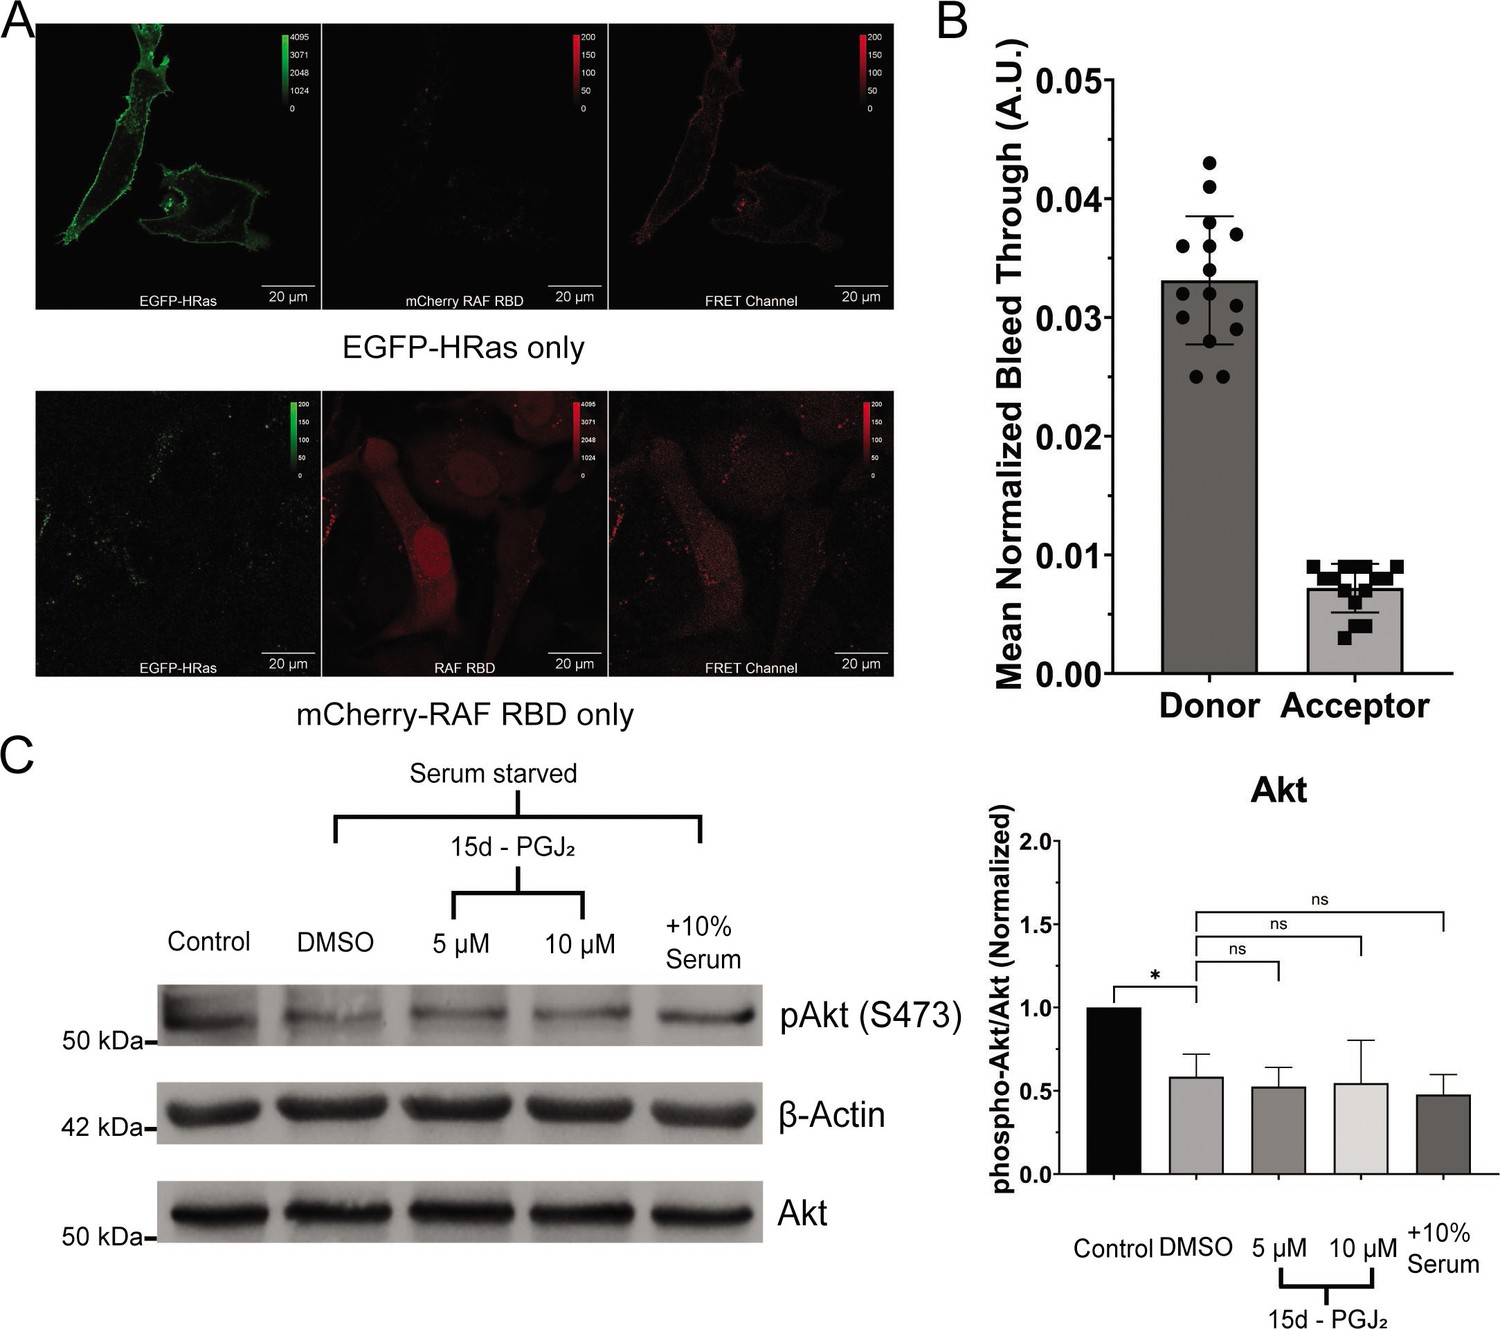
Activation of HRas after treatment with 15d-PGJ2.
(A) Representative confocal micrograph of C2C12 cells expressing only EGFP-tagged HRas or mCherry-tagged RAF-RBD alone for spectral overlap (bleed-through) calculations. (B) Mean bleed-through of EGFP-tagged HRas (Donor) and mCherry-tagged RAF-RBD (Acceptor) in the fluorescence resonance energy transfer (FRET) channel. (C) Phosphorylation of Akt (measured by immunoblotting) in C2C12 cells treated with 15d-PGJ2 (5 and 10 µM) or DMSO for 1 hr after starving the cells in 0.2% serum medium for 24 hr. The densitometric ratio of phosphorylated Akt (Ser473) to total Akt was normalized to non-starved C2C12 cells. (The Standard Deviation between replicates was plotted as error bars. Statistical significance tested by two-tailed heteroscedastic Student’s t-test, N = 3; statistical significance was tested by the two-tailed Student’s t-test ns = p > 0.05, *p < 0.05.)
-
Figure 3—figure supplement 1—source data 1
Uncropped and labelled gels for Figure 3—figure supplement 1.
- https://cdn.elifesciences.org/articles/95229/elife-95229-fig3-figsupp1-data1-v1.zip
-
Figure 3—figure supplement 1—source data 2
Raw unedited gels for Figure 3—figure supplement 1.
- https://cdn.elifesciences.org/articles/95229/elife-95229-fig3-figsupp1-data2-v1.zip
Figure 4 with 1 supplement
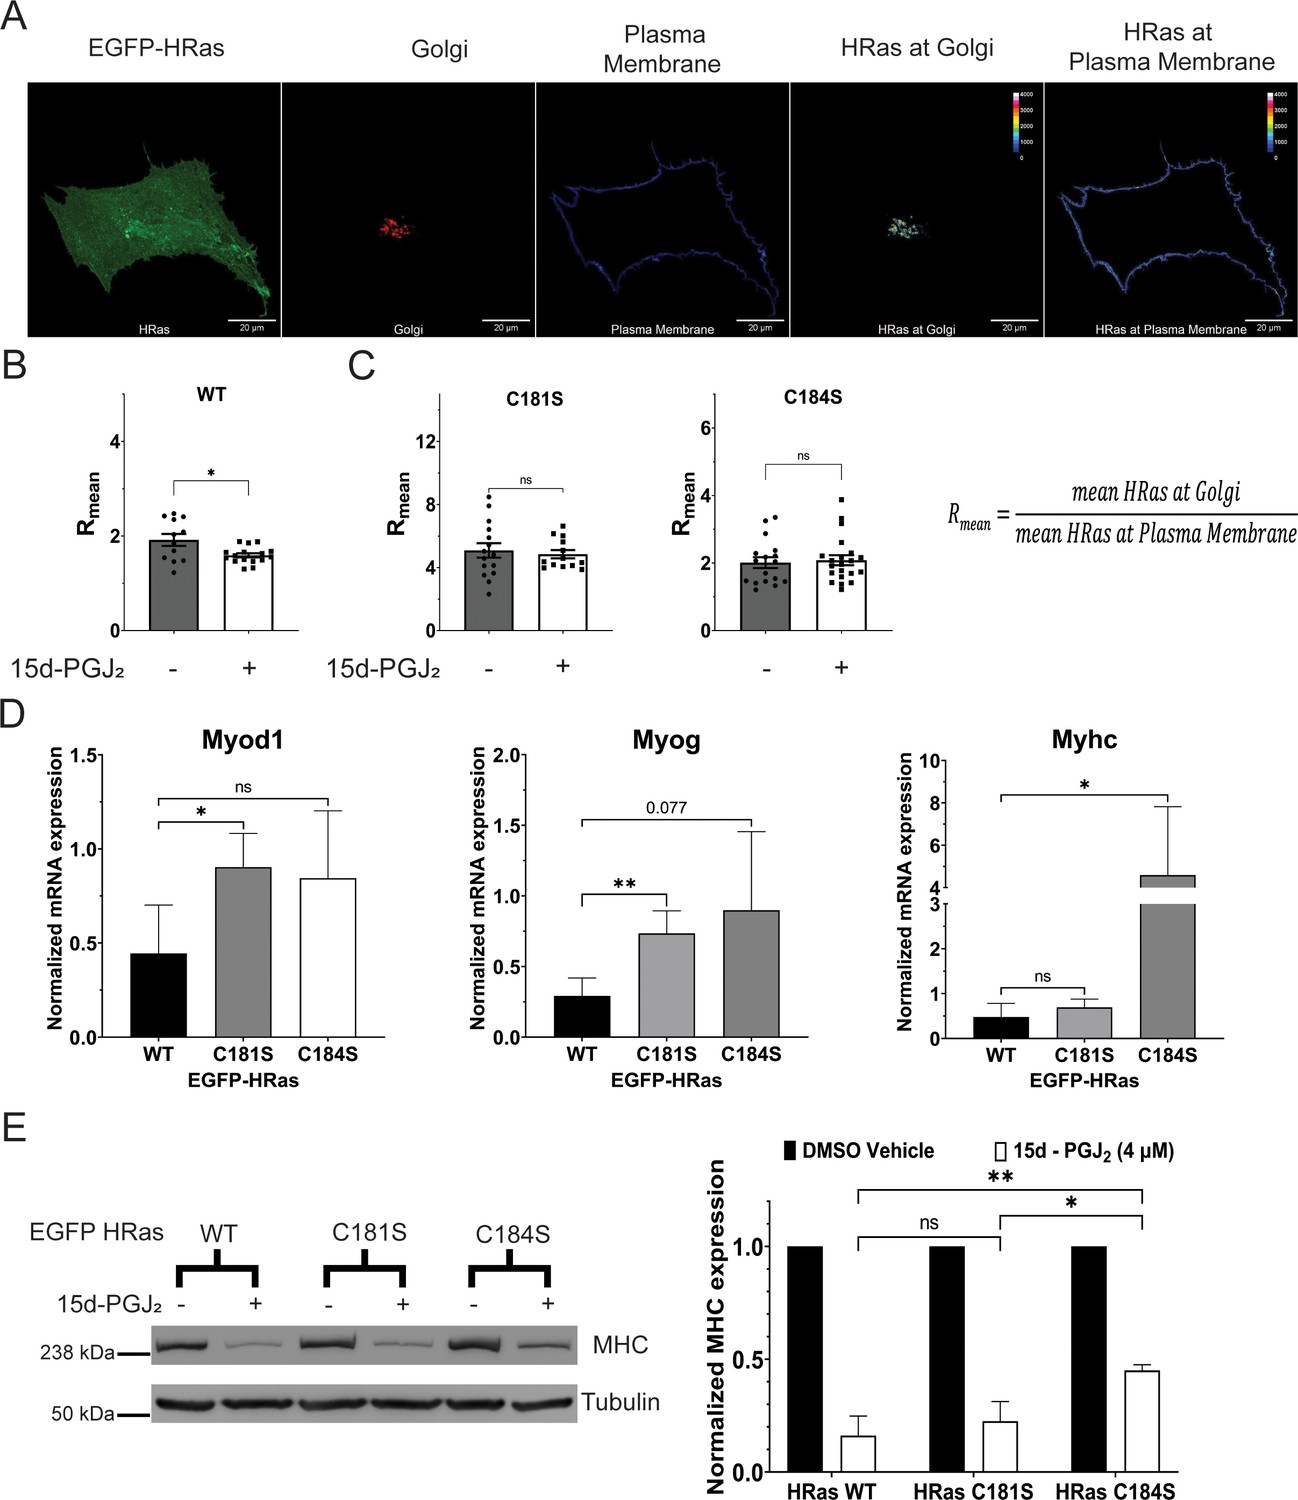
15d-PGJ2 controls the intracellular distribution of HRas and differentiation of C2C12 cells in an HRas C-terminal cysteine-dependent manner.
(A) Representative confocal micrograph of C2C12 myoblasts showing localization of EGFP-tagged HRas between the plasma membrane (stained with Alexa Fluor 633-conjugated Wheat Germ Agglutinin) and the Golgi (labeled with TagRFP-tagged Golgi resident GalT protein). A statistic Rmean was defined as the ratio of mean HRas intensity at the Golgi to the mean HRas intensity at the plasma membrane. (B) Distribution of the wild-type HRas between the Golgi and the plasma membrane, measured by Rmean, in C2C12 myoblasts treated with 15d-PGJ2 (10 µM) or DMSO for 24 hr. (C) Distribution of the C-terminal cysteine mutants of HRas between the Golgi and the plasma membrane, measured by Rmean, in C2C12 myoblasts treated with 15d-PGJ2 (10 µM) or DMSO for 24 hr. (D) Expression of mRNAs of known markers of differentiation (Myod1, Myog, and Myhc), measured by qPCR, in differentiating C2C12 myoblasts expressing the EGFP-tagged wild-type and the C-terminal cysteine mutants of HRas after treatment with 15d-PGJ2 (4 µM) or DMSO for 5 days (N = 3). (E) Expression of MHC protein, measured by immunoblotting, in differentiating C2C12 myoblasts expressing the EGFP-tagged wild-type and the C-terminal cysteine mutants of HRas after treatment with 15d-PGJ2 (4 µM) or DMSO for 5 days (N = 3). (The Standard Deviation between replicates was plotted as error bars. Statistical significance was tested by the two-tailed Student’s t-test ns = p > 0.05, *p < 0.05, **p < 0.01.)
-
Figure 4—source data 1
Uncropped and labelled gels for Figure 4.
- https://cdn.elifesciences.org/articles/95229/elife-95229-fig4-data1-v1.zip
-
Figure 4—source data 2
Raw unedited gels for Figure 4.
- https://cdn.elifesciences.org/articles/95229/elife-95229-fig4-data2-v1.zip
Figure 4—figure supplement 1
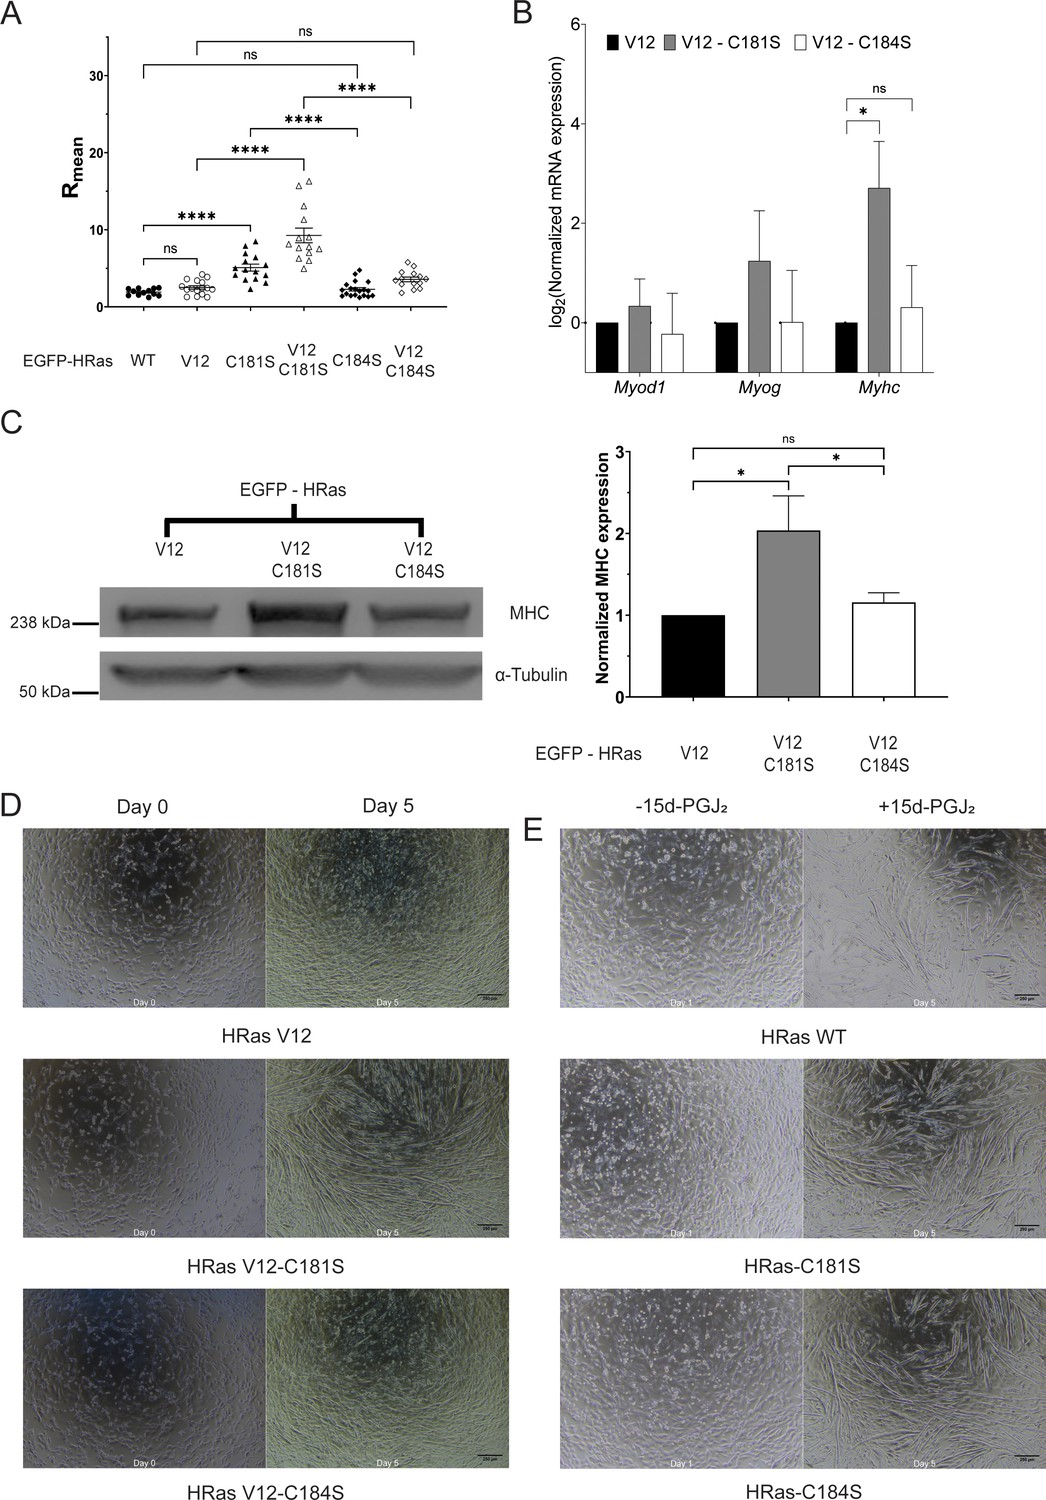
C-terminal cysteine-mediated intracellular distribution of constitutively active HRas (HRas V12) regulates the differentiation of C2C12 myoblasts.
(A) Distribution of EGFP-tagged HRas WT/HRas V12/HRas-C181S/HRas V12-C181S/HRas-C184S/HRas V12-C184S between the Golgi complex and the plasma membrane, as seen by the scatter plot of Rmean, the ratio of the mean HRas intensity at the Golgi complex to that at the plasma membrane, in C2C12 cells. (Statistical significance tested by two-tailed heteroscedastic Student’s t-test, N = 3). (B) mRNA levels of Myod1, Myog, and Myhc relative to 18s rRNA (measured by quantitative PCR) in C2C12 cells expressing EGFP-tagged HRas V12/HRas V12-C181S/HRas V12-C184S in C2C12 differentiation medium for 5 days. (Statistical significance tested by two-tailed heteroscedastic Student’s t-test, N = 3.) (C) Protein levels of MyHC (measured by immunoblotting) in C2C12 cells expressing EGFP-tagged HRas V12/HRas V12-C181S/HRas V12-C184S in C2C12 differentiation medium for 5 days. The densitometric ratio of levels of MyHC to α-Tubulin was normalized to C2C12 cells expressing HRas V12. (Statistical significance tested by two-tailed heteroscedastic Student’s t-test, N = 3.) (D) Brightfield image of C2C12 cells expressing EGFP-HRas V12, V12 C181S, or V12 C184S on Days 0 and 5 of differentiation. (E) Brightfield image of C2C12 cells expressing EGFP-HRas WT, C181S, or C184S after 5 days of treatment with 15d-PGJ2 or DMSO. (The Standard Deviation between replicates was plotted as error bars. Statistical significance was tested by the two-tailed Student’s t-test ns = p > 0.05, *p < 0.05, ****p < 0.0001.)
-
Figure 4—figure supplement 1—source data 1
Uncropped and labelled gels for Figure 4—figure supplement 1.
- https://cdn.elifesciences.org/articles/95229/elife-95229-fig4-figsupp1-data1-v1.zip
-
Figure 4—figure supplement 1—source data 2
Raw unedited gels for Figure 4—figure supplement 1.
- https://cdn.elifesciences.org/articles/95229/elife-95229-fig4-figsupp1-data2-v1.zip
Additional files
-
Supplementary file 1
List of resources used.
(A) List of primers used for qPCR. (B) List of reagents and the catalog numbers. (C) List of antibodies used for the western blot, immunoprecipitation, and immunofluorescence.
- https://cdn.elifesciences.org/articles/95229/elife-95229-supp1-v1.docx
-
MDAR checklist
- https://cdn.elifesciences.org/articles/95229/elife-95229-mdarchecklist1-v1.docx
-
Source code 1
MATLAB script (.m file) used to calculate Rmean.
- https://cdn.elifesciences.org/articles/95229/elife-95229-code1-v1.zip
Download links
A two-part list of links to download the article, or parts of the article, in various formats.
Downloads (link to download the article as PDF)
Open citations (links to open the citations from this article in various online reference manager services)
Cite this article (links to download the citations from this article in formats compatible with various reference manager tools)
Senescent cells inhibit mouse myoblast differentiation via the SASP-lipid 15d-PGJ2 mediated modification and control of HRas
eLife 13:RP95229.
https://doi.org/10.7554/eLife.95229.3


