Nicotine enhances the stemness and tumorigenicity in intestinal stem cells via Hippo-YAP/TAZ and Notch signal pathway
- Department of Diabetes and Metabolic Diseases, Graduate School of Medicine, The University of Tokyo, Japan
- Department of Cardiovascular Medicine, The University of Tokyo Graduate, School of Medicine, Japan
- Department of Frontier Cardiovascular Science, The University of Tokyo, Graduate School of Medicine, Japan
Figures
Figure 1 with 1 supplement
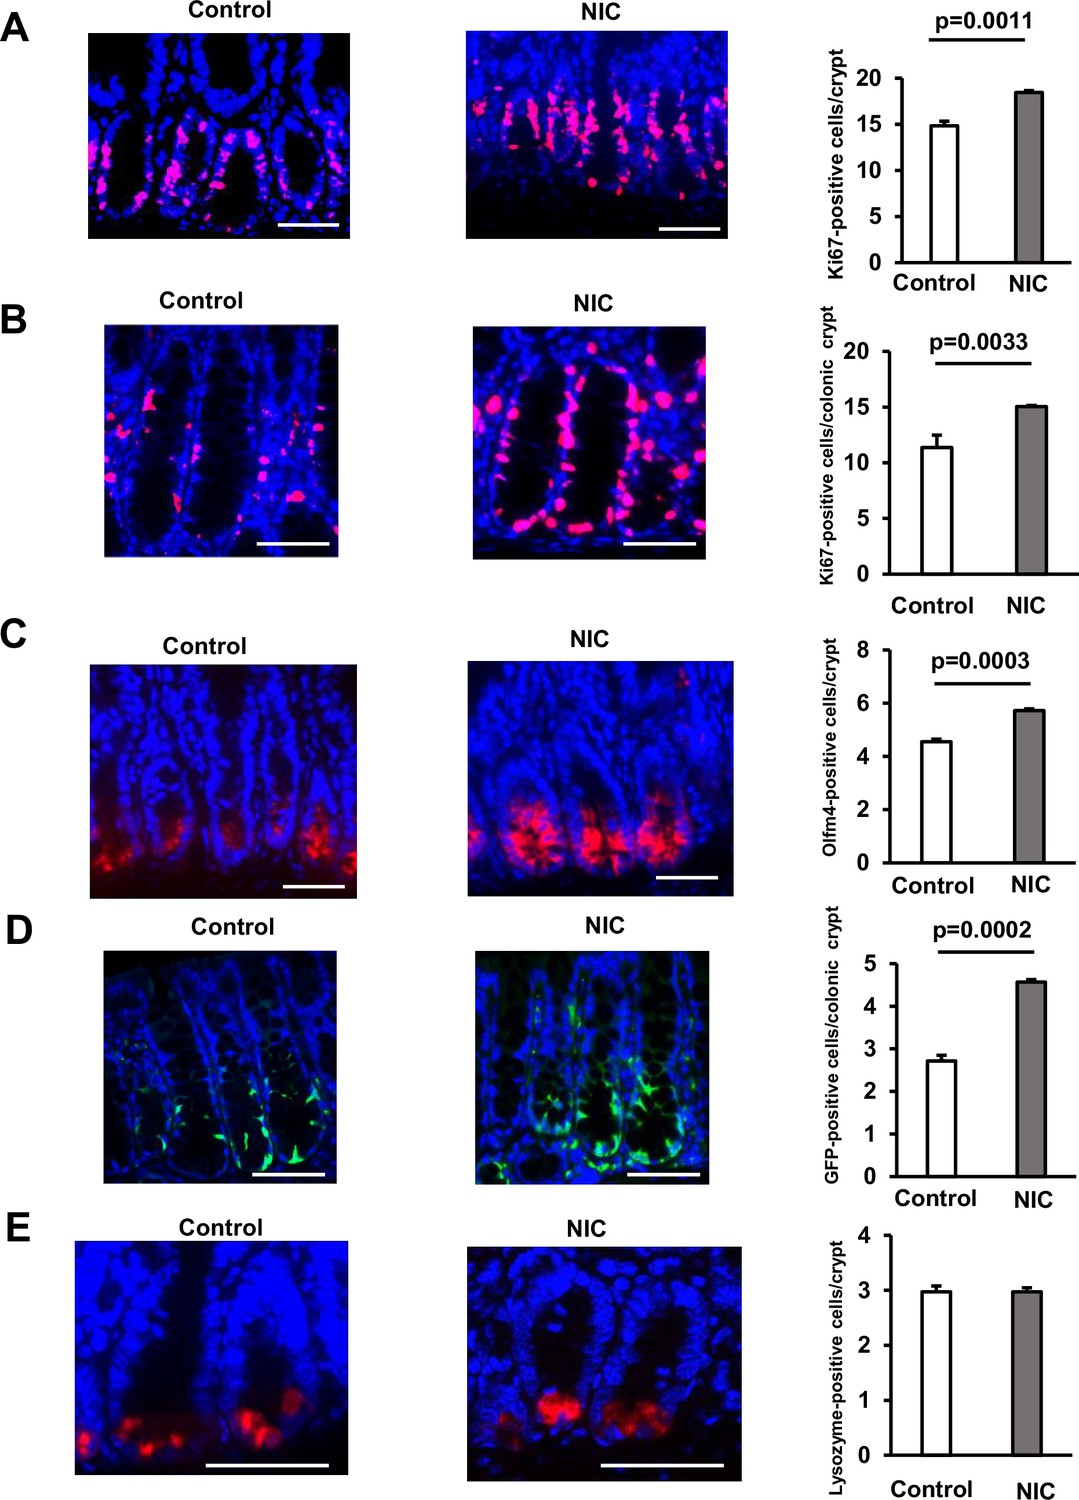
Nicotine (NIC) treatment increases the number of ISCs in the Intestine.
(A and B) Image of Ki67‐positive cells (Red: Ki67, Blue: DAPI) and their quantification at the crypt base of proximal jejunum (A) or colon (B) of NIC-treated and untreated mice (A:3–4 mice per group, B: 3 mice per group). (C) Olfm4 staining image (Red: Olfm4, Blue: DAPI) and the quantification of Olfm4‐positive cells at the crypt base of proximal jejunum with or without NIC treatment (3–4 mice per group). (D) GFP staining image (Green: GFP, Blue: DAPI) and the quantification of LgR5-GFP‐positive cells at the crypt base of the colon in NIC or control-treated Lgr5-EGFP-IRES-CreERT2 mice (3 mice per group). (E) Lysozyme staining image (Red: Lysozyme, Blue: DAPI) and the quantification of Lysozyme‐positive Paneth cells with or without NIC treatment (3–4 mice per group). Original magnifications: 400× (A–E). Scale bar: 50 µm (A–E). Values represent the mean ± SEM. Significant differences are denoted by p values (Student’s t-test). See also Figure 1—figure supplement 1.
-
Figure 1—source data 1
The quantification in immunostaining.
- https://cdn.elifesciences.org/articles/95267/elife-95267-fig1-data1-v1.xlsx
Figure 1—figure supplement 1
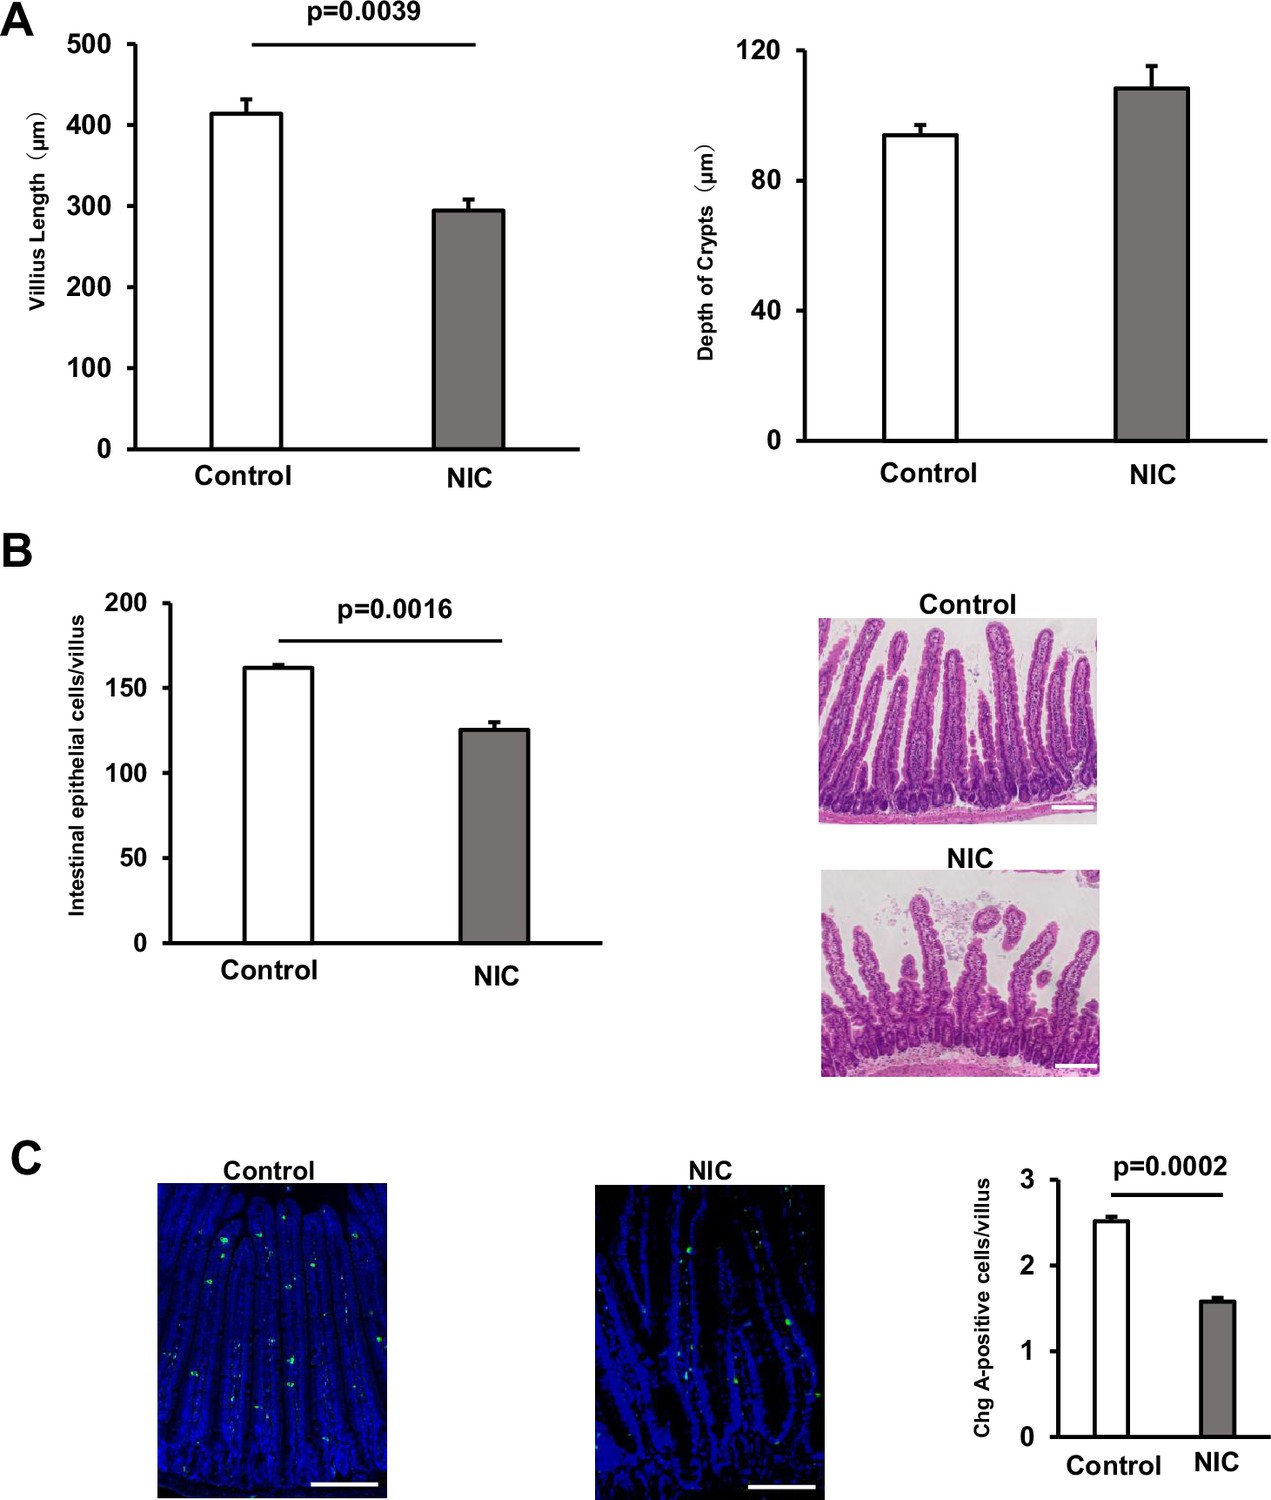
NIC suppresses the differentiation of ISCs.
(A) Images of the H&E-stained crypt and villus and quantification of their length after or without NIC treatment (3–4 mice per group). (B) The quantification of the number of enterocytes per villus in NIC-treated and untreated samples (3 mice per group). (C) Chromogranin A staining image (Green: Chromogranin A, Blue: DAPI) and the quantification of Chromogranin A‐positive cells per villus-crypt unit in NIC-treated and untreated samples (3 mice per group). Original magnifications: ×100 (A), ×200 (C). Scale bar: 100 µm (A and C). Values represent the mean ± SEM. Significant differences are denoted by p values (Student’s t-test). See also Figure 1.
-
Figure 1—figure supplement 1—source data 1
The quantification in staining.
- https://cdn.elifesciences.org/articles/95267/elife-95267-fig1-figsupp1-data1-v1.xlsx
Figure 2 with 1 supplement
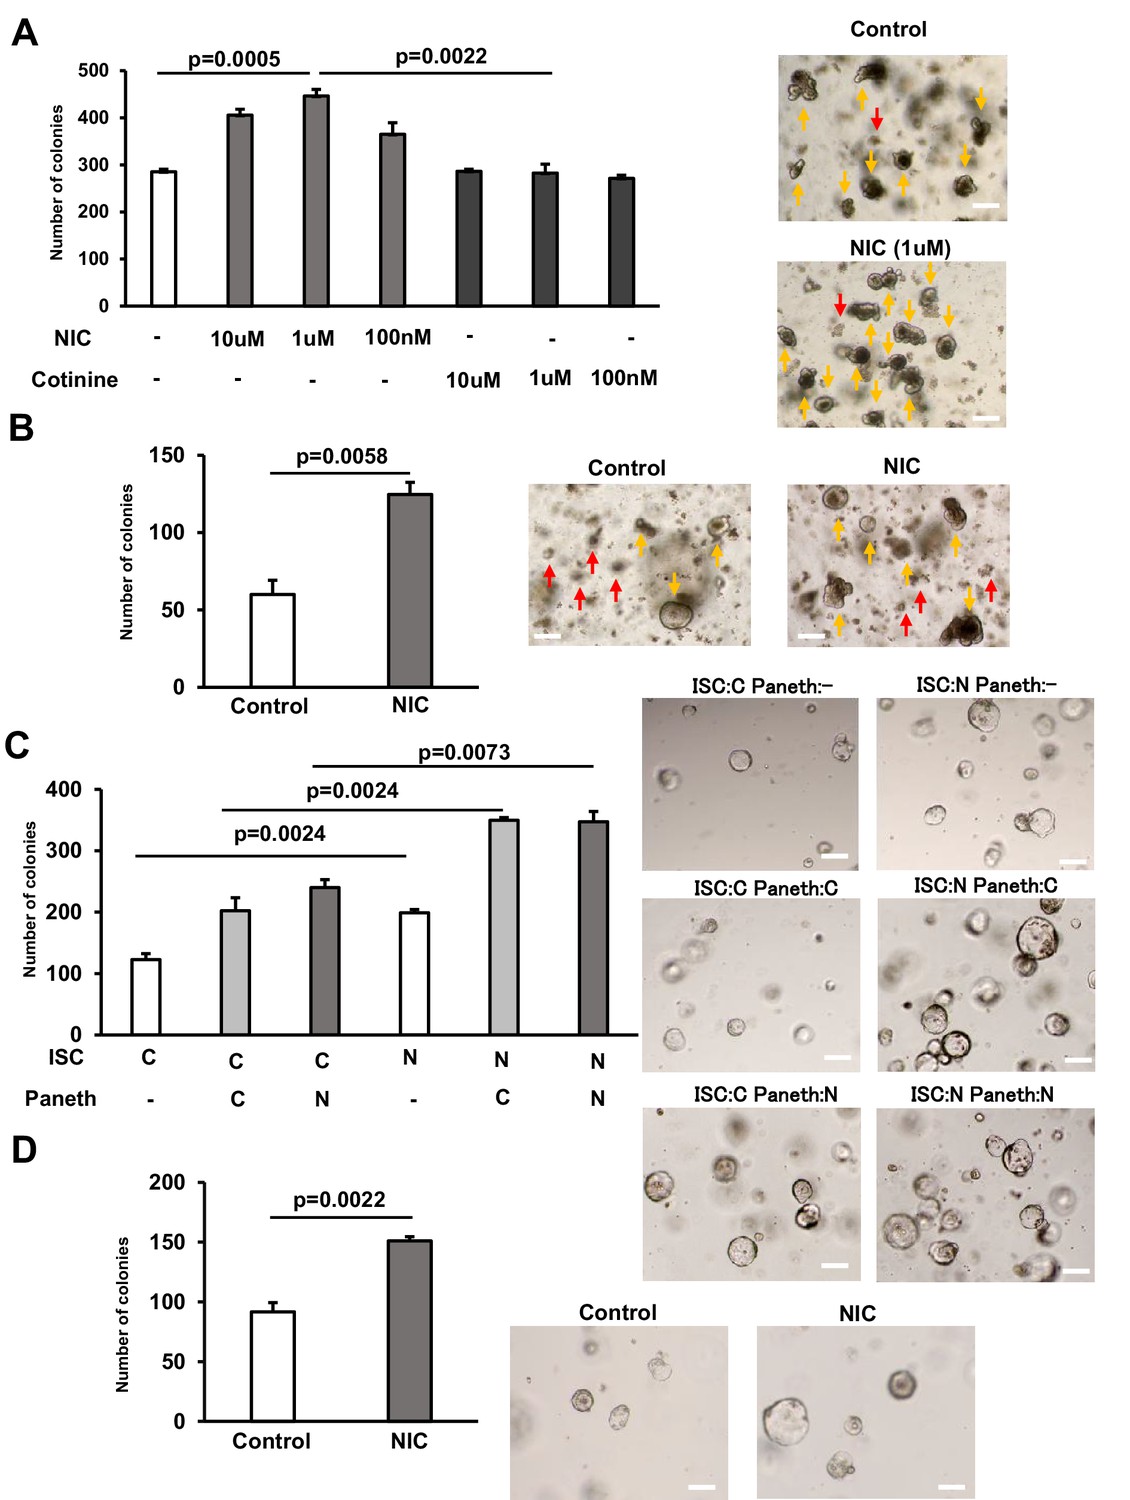
NIC enhances the formation of intestinal organoids from ISCs.
(A) Crypts from the proximal small intestine were cultured with 10 μM, 1 μM, and 100 nM NIC or cotinine to allow ISCs to form organoid colonies; the control set contained no NIC or cotinine. Representative images of the organoids and the quantification of organoids number at day 5 (3 wells/ group) (yellow arrow marks organoids and red arrow indicates aborted crypts). (B) Colonic crypts were cultured with or without 1 μM NIC to allow CSCs to form organoid colonies. Representative images of the organoids and the quantification of organoids number at day 5 are shown (3 wells/ group) (yellow arrow marks organoids and red arrow indicates aborted crypts). (C) ISCs and Paneth cells were isolated from the small intestine of Lgr5‐ EGFP‐IRES‐CreERT2 mice treated with or without NIC; 2×10³ cells each were co‐cultured in the medium containing 10 μM CHIR99021. Representative images of the organoids and the frequency of organoids at day 5 (3 wells/ group). (D) ISCs isolated from the small intestine of Lgr5‐EGFP‐IRES‐CreERT2 mice were cultured in the absence of Paneth cells using the medium containing 10 μM CHIR99021, with or without 1 μM NIC. Representative images of the organoids and the frequency of organoids number at day 5 (3 wells/ group). C: control, N: NIC. Original magnification: 40×. Scale bar: 100 µm. Values represent the mean ± SEM. Significant differences are denoted by p values (Student’s t-test). See also Figure 3—figure supplement 1.
-
Figure 2—source data 1
The quantification of colonies in organoid assay.
- https://cdn.elifesciences.org/articles/95267/elife-95267-fig2-data1-v1.xlsx
Figure 2—figure supplement 1

NIC induces the formation of intestinal organoids from ISCs.
ISCs and Paneth cells were isolated from the small intestine of Lgr5‐EGFP‐IRES‐CreERT2 mice (NIC-treated and untreated); 2×10³ cells were co-cultured using medium without 10 μM CHIR99021. Representative images of the formed organoids and quantification of the organoid number on day 3 are shown (three wells per group). Values represent the mean ± SEM. Significant differences were denoted by p-values (Student’s t-test). See also Figure 2.
-
Figure 2—figure supplement 1—source data 1
The quantification of colonies in organoid assay.
- https://cdn.elifesciences.org/articles/95267/elife-95267-fig2-figsupp1-data1-v1.xlsx
Figure 3 with 1 supplement
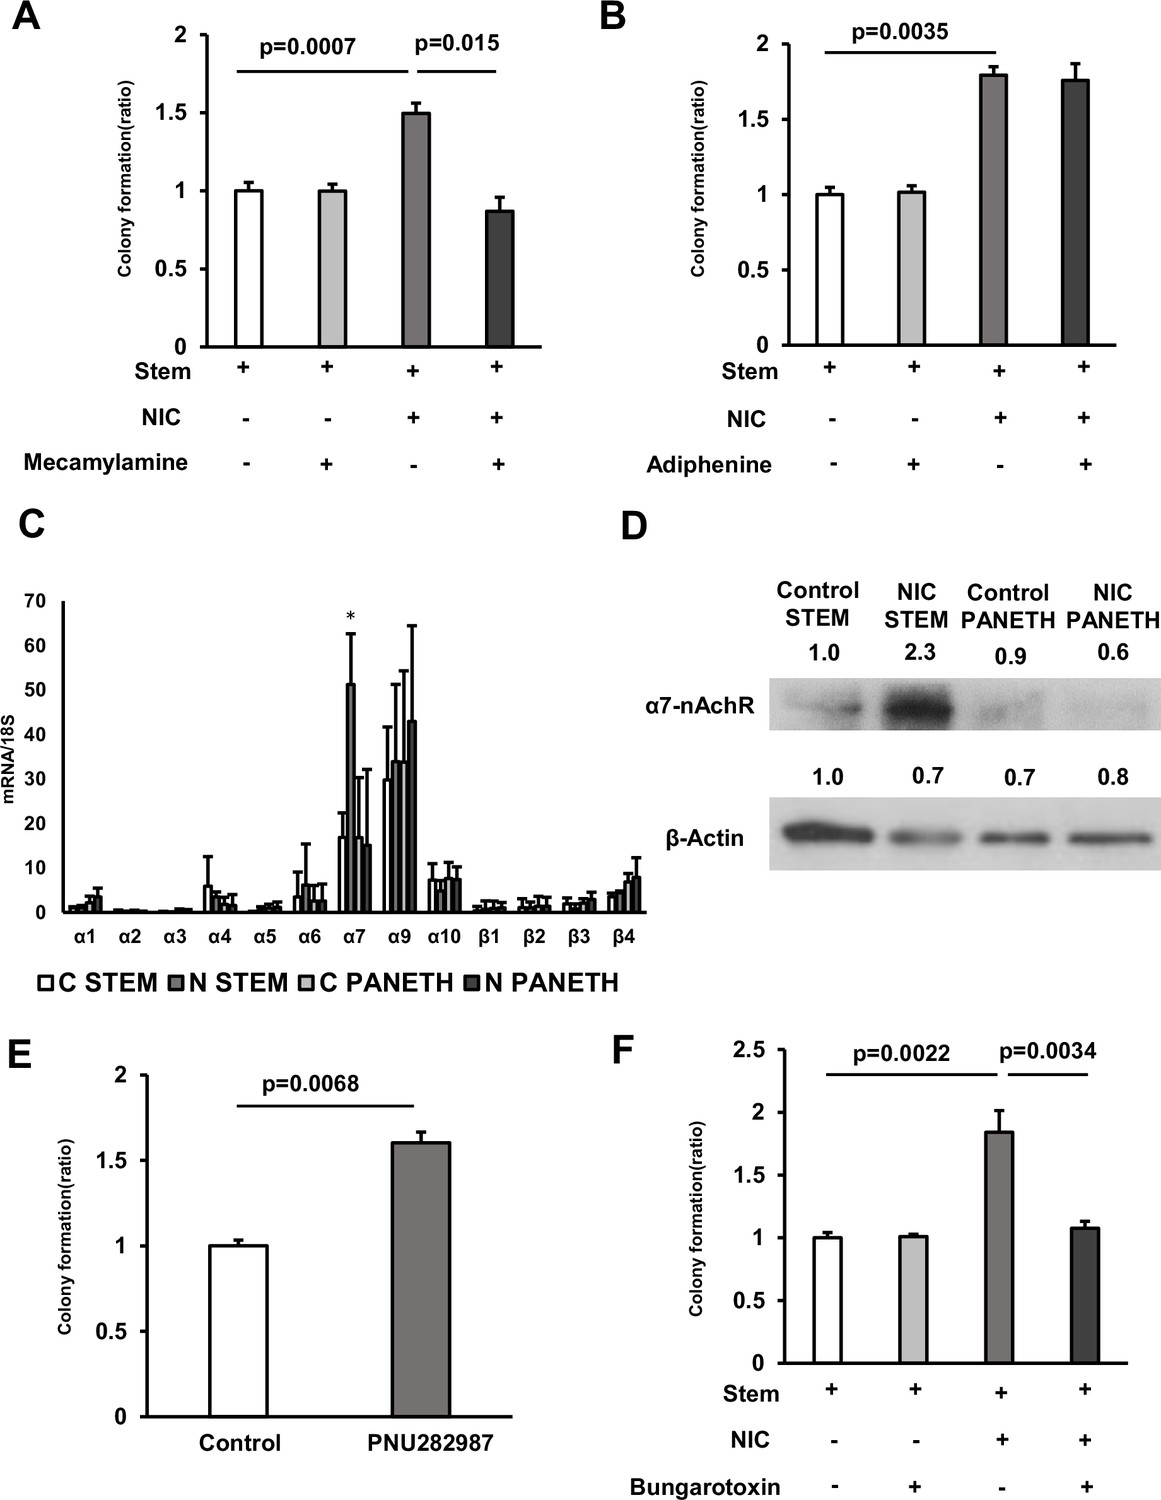
The effect of NIC is mediated via the α7 subunits of α7-nicotinic acetylcholine receptor (nAChR).
(A) Isolated ISCs were cultured in a medium with or without 1 μM NIC and 10 μM Mecamylamine (3 wells/group). (B) Isolated ISCs were cultured in a medium with or without 1 μM NIC and 3 μM Adiphenine hydrochloride (3 wells/group). (C) In ISCs and Paneth cells isolated from control and NIC mice, mRNA levels of nAchR subunits were analyzed using quantitative real-time PCR (n=5 per group; C: control, N: NIC). ∗p < 0.05 (vs C STEM) (Student’s t-test). (D) ISC or Paneth cell lysates prepared from control and NIC mice were immunoblotted with antibodies against α7-nAchR and β-actin. (E) Isolated ISCs were cultured in a medium supplemented with or without 10 μM PNU 282987 (3 wells/group). (F) Isolated ISCs were cultured in a medium with or without 1 μM NIC and 1 μM α-Bungarotoxin (3 wells/group). Values represent the mean ± SEM. Significant differences are denoted by p values (Student’s t-test). See also Figure 3—figure supplement 1.
-
Figure 3—source data 1
Colony quantification and qRT-PCR.
- https://cdn.elifesciences.org/articles/95267/elife-95267-fig3-data1-v1.xlsx
-
Figure 3—source data 2
Immunoblotting data with labeling.
- https://cdn.elifesciences.org/articles/95267/elife-95267-fig3-data2-v1.zip
-
Figure 3—source data 3
Immunoblotting raw data.
- https://cdn.elifesciences.org/articles/95267/elife-95267-fig3-data3-v1.zip
Figure 3—figure supplement 1

The distribution of human nAchR subunits in ISCs and Pante cells.
(A) Violin plots for nAchR subunits in ISCs and Panth cells by the analysis of human gut single-cell datasets (Elmentaite et al., 2021). (B) The number of positive cells for each nAchR in ISCs and Panth cells are shown. See also Figure 3.
Figure 4 with 1 supplement
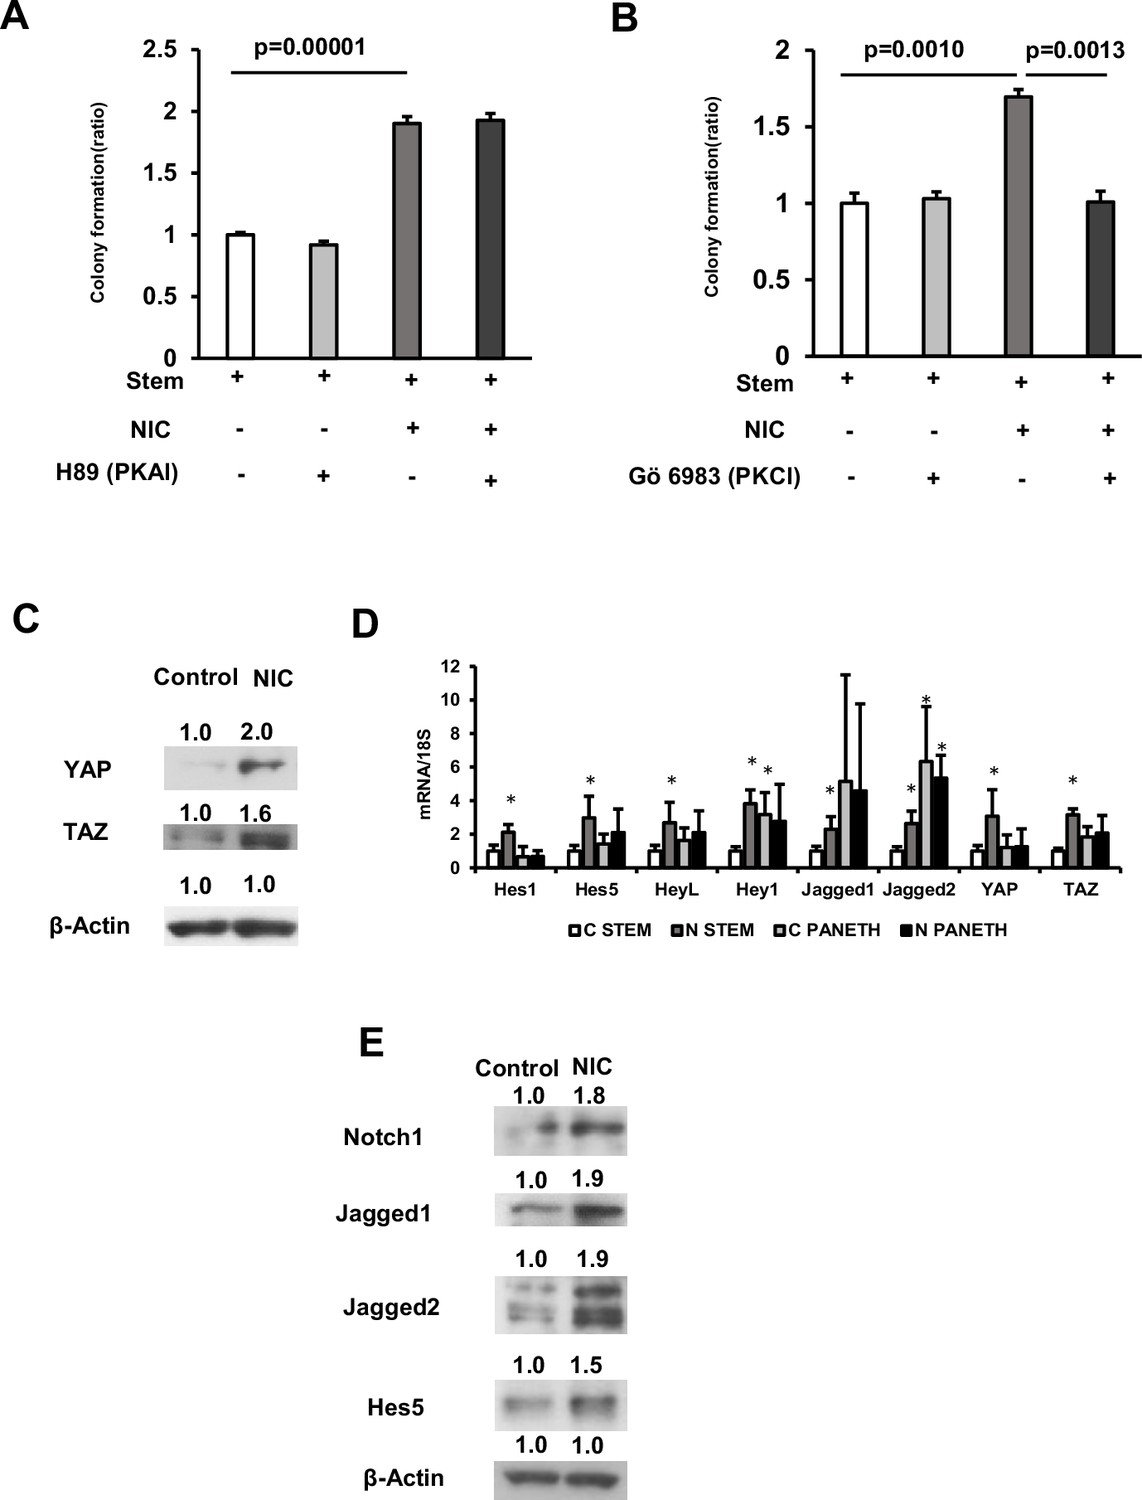
NIC induces Hippo-YAP/TAZ and notch signaling in ISCs.
(A and B) Isolated ISCs cultured using a medium supplemented with or without 1 μM NIC combined with either (A) 1 μM H89 dihydrochloride (PKA inhibitor) or (B) 10 nM Gö 6983 (PKC inhibitor; 3 wells/group). (C) Crypt lysates isolated from control and NIC-treated mice were immunoblotted using antibodies against YAP, TAZ, and β-actin. (D) In ISCs or Paneth cells (n=5 per group) isolated from control or NIC mice, mRNA levels of genes associated with Hippo-YAP/TAZ and Notch signaling were determined through quantitative real-time PCR. ∗p < 0.05 (vs C STEM) (Student’s t-test). (E) Crypt lysates obtained from control and NIC-treated mice were immunoblotted using antibodies against Notch1, Jagged1, Jagged2, Hes5, and β-actin. Values represent the mean ± SEM. Significant differences are denoted by p values (Student’s t-test). See also Figure 4—figure supplement 1.
-
Figure 4—source data 1
Colony quantification and qRT-PCR.
- https://cdn.elifesciences.org/articles/95267/elife-95267-fig4-data1-v1.xlsx
-
Figure 4—source data 2
Immunoblotting data with labeling.
- https://cdn.elifesciences.org/articles/95267/elife-95267-fig4-data2-v1.zip
-
Figure 4—source data 3
Immunoblotting raw data.
- https://cdn.elifesciences.org/articles/95267/elife-95267-fig4-data3-v1.zip
Figure 4—figure supplement 1
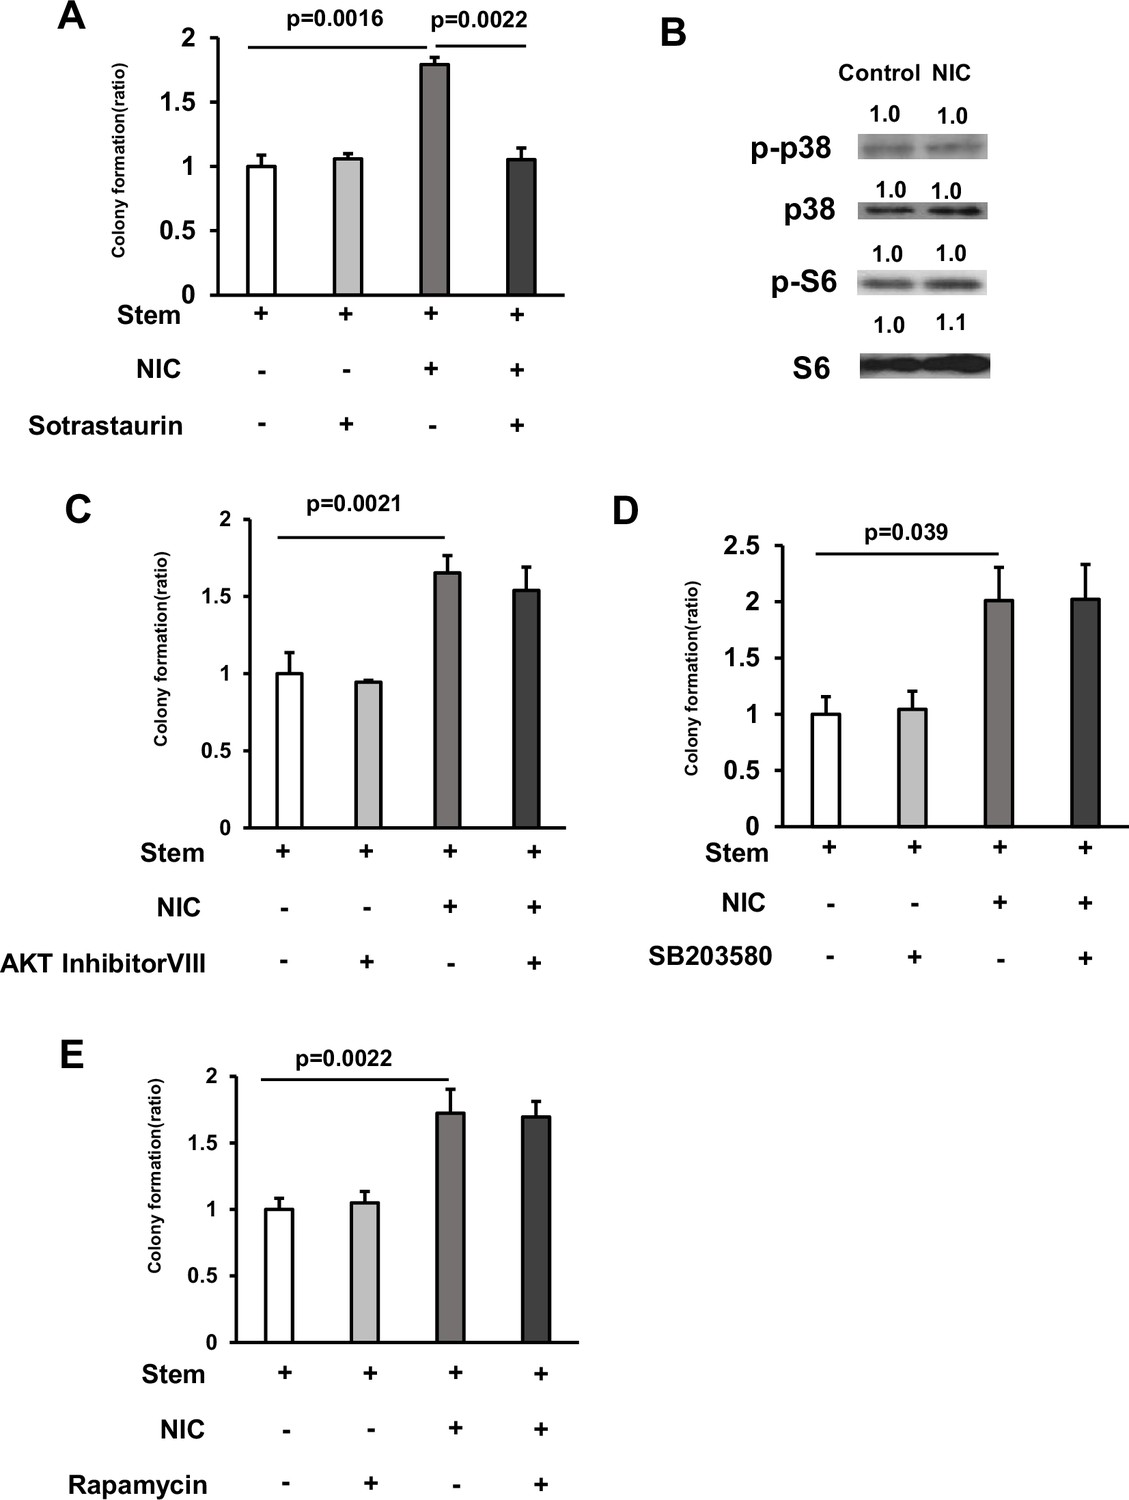
PI3K/AKT, mTORC1, and p38 /MAPK signaling cascades do not mediate the effect of NIC.
(A) Isolated ISCs cultured using a medium supplemented with or without 1 μM NIC combined with 5 nM Sotrastaurin (PKC inhibitor) (3 wells/group). (B) Immunoblotting analyses of p38, p-p38, p-S6, or S6 in ISCs isolated from mice treated with vehicle or NIC. (C) Isolated ISCs were cultured in a medium with or without 1 μM NIC and 1 μM AKT inhibitor VIII (3 wells/group). (D) Isolated ISCs were cultured in a medium with or without 1 μM Nicotine and 5 μM SB 203580 (3 wells/group). (E) Isolated ISCs were cultured in a medium with or without 1 μM NIC and 1 μM Rapamycin (3 wells/group). Significant differences are denoted by p values (Student’s t-test). See also Figure 4.
-
Figure 4—figure supplement 1—source data 1
The quantification of colonies in organoid assay.
- https://cdn.elifesciences.org/articles/95267/elife-95267-fig4-figsupp1-data1-v1.xlsx
-
Figure 4—figure supplement 1—source data 2
Immunoblotting data with labeling.
- https://cdn.elifesciences.org/articles/95267/elife-95267-fig4-figsupp1-data2-v1.zip
-
Figure 4—figure supplement 1—source data 3
Immunoblotting raw data.
- https://cdn.elifesciences.org/articles/95267/elife-95267-fig4-figsupp1-data3-v1.zip
Figure 5
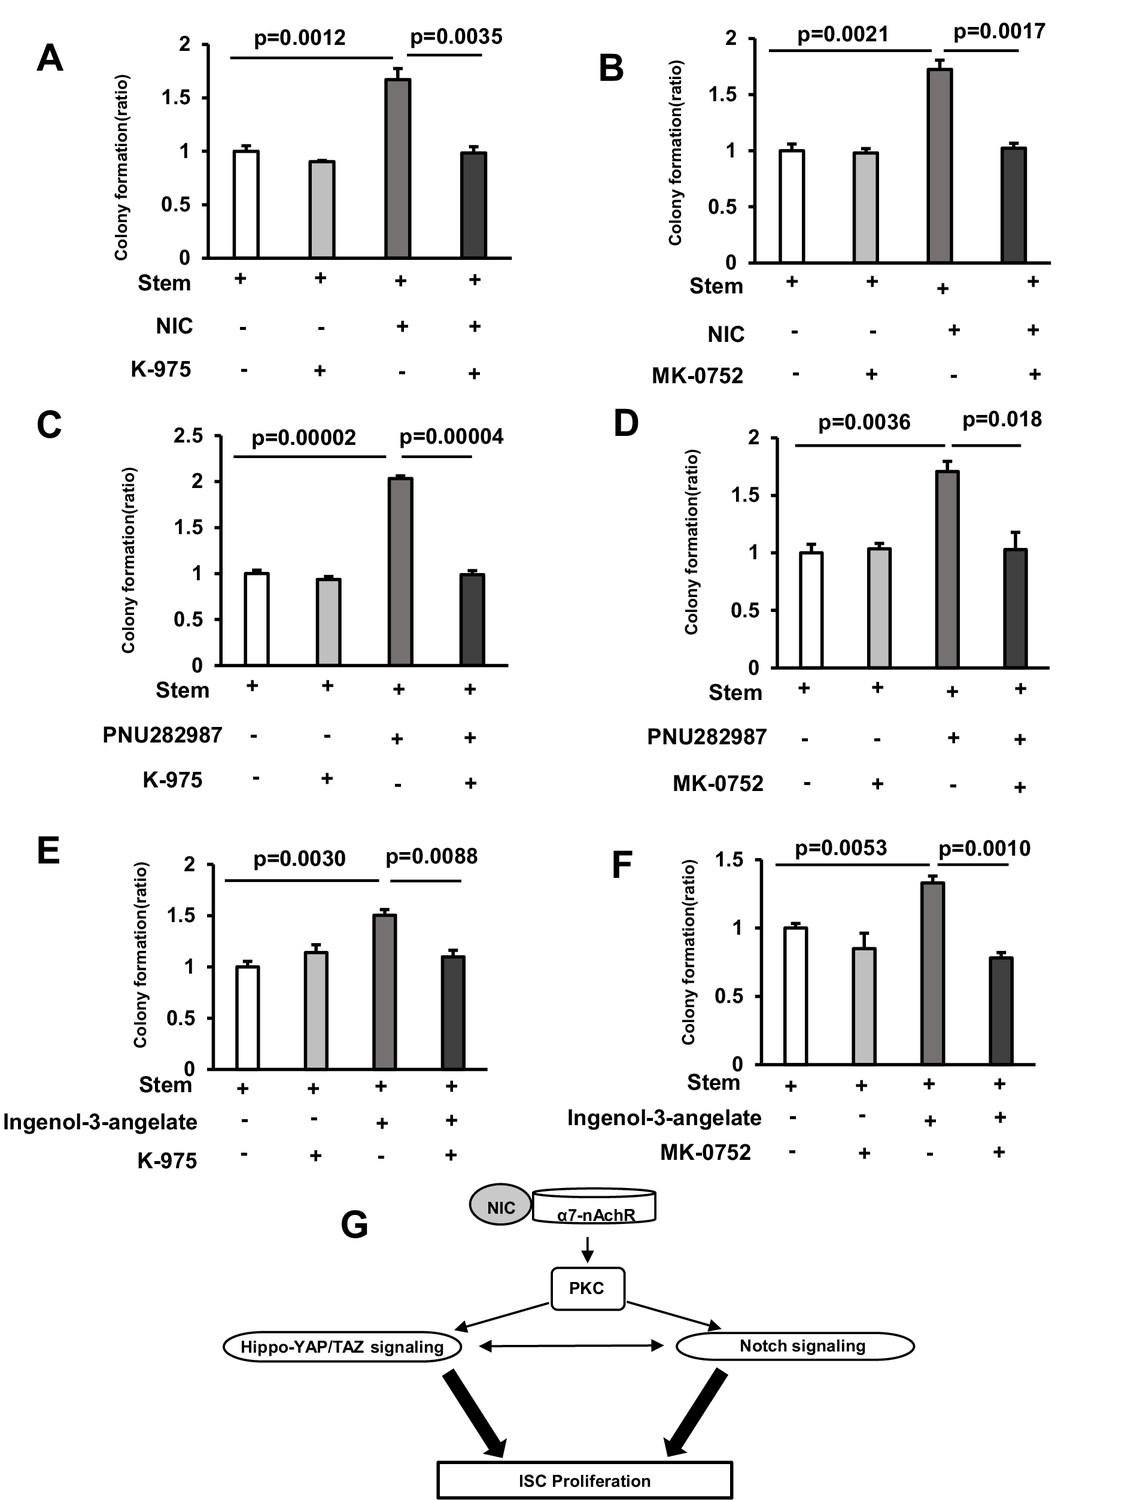
Inactivation of Hippo-YAP/TAZ and Notch signaling suppresses NIC-induced Colony Formation in mice.
(A) Isolated ISCs were cultured using a medium with or without 1 μM Nicotine and 5 nM K-975 (3 wells/group). (B) Isolated ISCs were cultured using a medium with or without 1 μM Nicotine and 1 μM MK-0752 (3 wells/group). (C) Isolated ISCs were cultured using a medium with or without 10 μM PNU282987 and 5 nM K-975 (3 wells/group). (D) Isolated ISCs were cultured using a medium with or without 10 μM PNU282987 and 1 μM MK-0752 (3 wells/group). (E) Isolated ISCs were cultured in a medium with or without 1 nM Ingenol-3-angelate and 5 nM K-975 (3 wells/group). (F) Isolated ISCs were cultured in a medium with or without 1 nM Ingenol-3-angelate and 1 μM MK-0752 (3 wells/group). (G) Schematic model of NIC-associated signaling pathway in ISCs. The model traces a signaling cascade via α7-nAchR, PKC, Hippo-YAP/TAZ and Notch signaling in ISCs. Values represent the mean ± SEM. Significant differences are denoted by p values (Student’s t-test).
-
Figure 5—source data 1
The quantification of colonies in organoid assay.
- https://cdn.elifesciences.org/articles/95267/elife-95267-fig5-data1-v1.xlsx
Figure 6 with 1 supplement
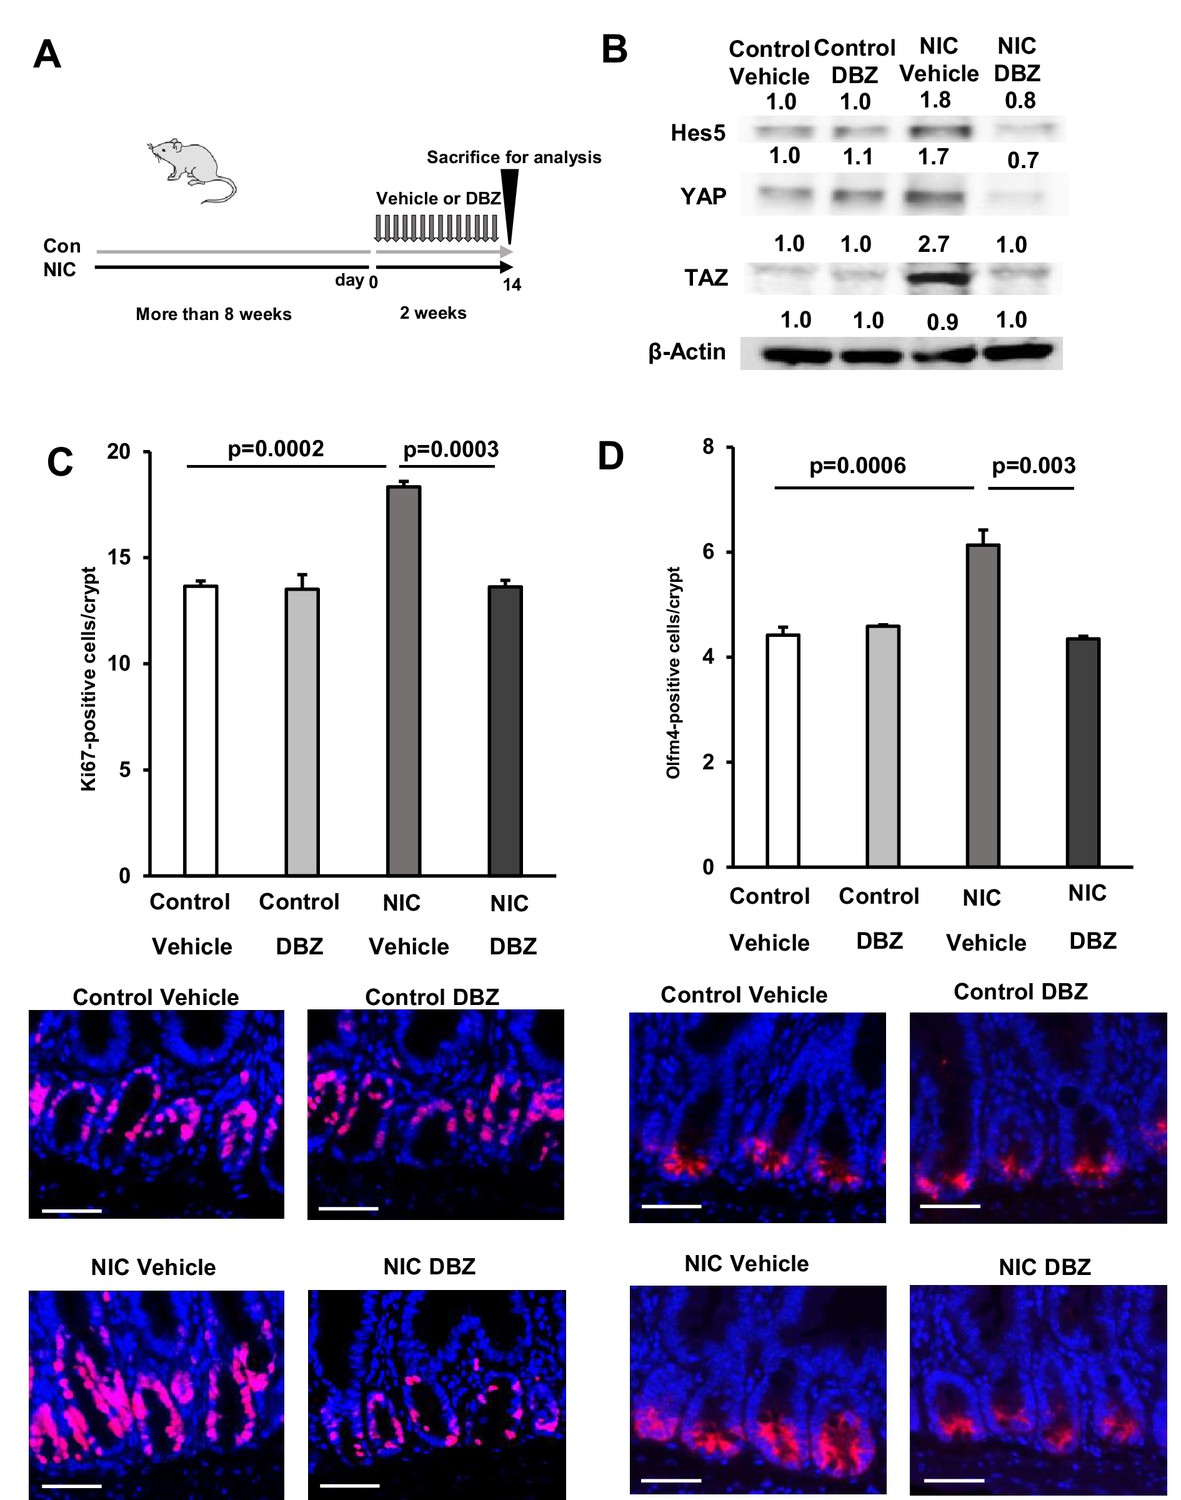
Dibenzazepine (DBZ) treatment suppresses the NIC-induced expansion of ISCs in vivo.
(A) Schematic representation of the treatment showing daily injection of DBZ (1 mg/kg body weight) for 2 weeks. (B) Immunoblotting analysis of crypt lysate isolated from DBZ- and vehicle-treated mice in control and NIC-treatment groups using Hes5, YAP, TAZ, and β-actin antibodies. (C and D) Immunostained Ki67-positive and (C) (Red, Ki67; Blue, DAPI) Olfm4-positive cells (D) (Red, Olfm4; blue, DAPI) and their quantification in the proximal jejunum of DBZ- or vehicle-treated mice (NIC-treated and untreated) (n=3 per group). Original magnifications: ×400 (C and D). Scale bar: 50 µm (C and D). Values represent the mean ± SEM. Significant differences are denoted by p values (Student’s t-test). See also Figure 6—figure supplement 1.
-
Figure 6—source data 1
The quantification in immunostaining.
- https://cdn.elifesciences.org/articles/95267/elife-95267-fig6-data1-v1.xlsx
-
Figure 6—source data 2
Immunoblotting data with labeling.
- https://cdn.elifesciences.org/articles/95267/elife-95267-fig6-data2-v1.zip
-
Figure 6—source data 3
Immunoblotting raw data.
- https://cdn.elifesciences.org/articles/95267/elife-95267-fig6-data3-v1.zip
Figure 6—figure supplement 1
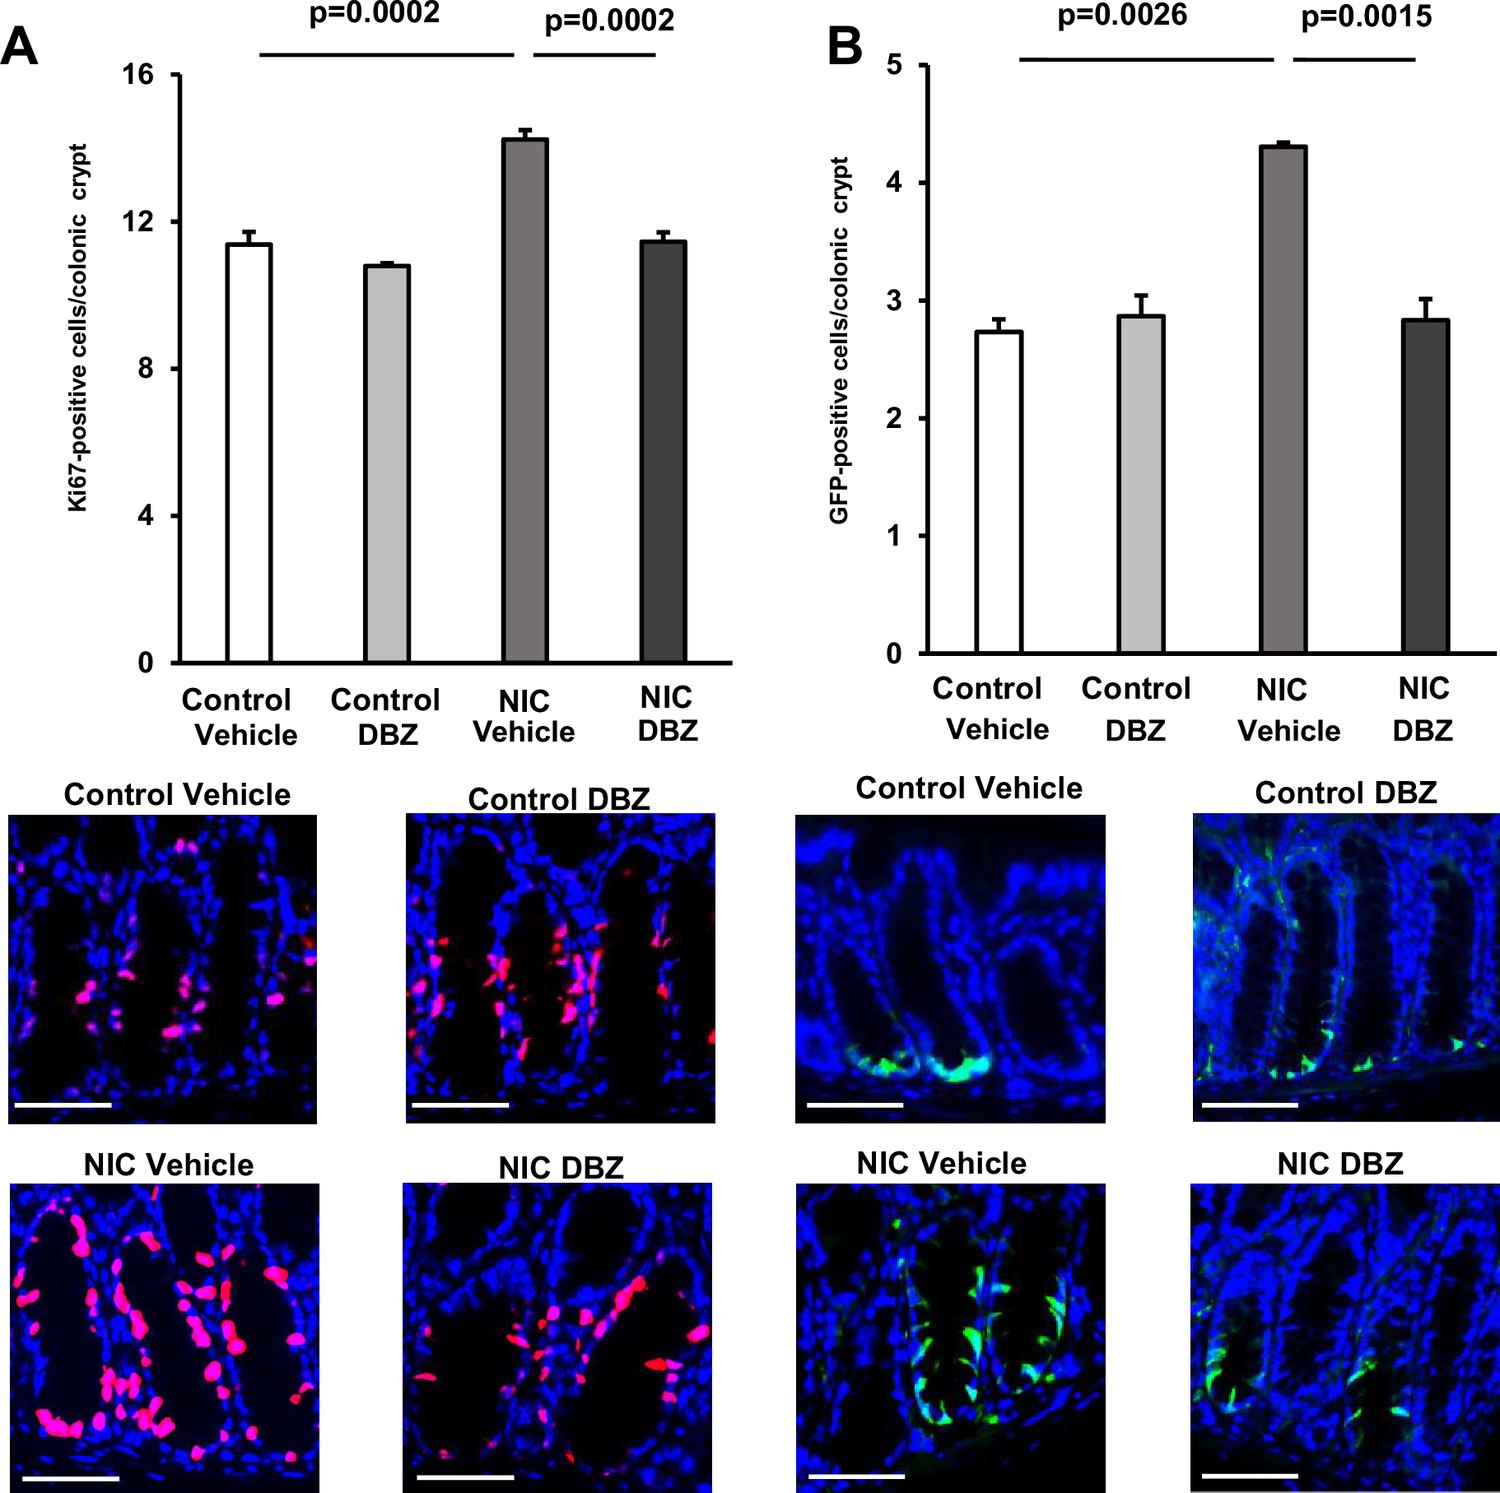
DBZ treatment suppresses the NIC-induced expansion of CSCs in vivo.
(A and B) Immuno-stained Ki67-positive cells (A) (Red, Ki67; Blue, DAPI) and LgR5-GFP-positive cells (B) (Red, Olfm4; blue, DAPI) and quantification of their abundance in the colon of DBZ or vehicle-treated Lgr5-EGFP-IRES-CreERT2 mice (NIC-treated and untreated; n=3 per group). Original magnifications: ×400. Scale bar: 50 µm. Values represent the mean ± SEM. Significant differences are denoted by p values (Student’s t-test). See also Figure 6.
-
Figure 6—figure supplement 1—source data 1
The quantification in immunostaining.
- https://cdn.elifesciences.org/articles/95267/elife-95267-fig6-figsupp1-data1-v1.xlsx
Figure 7
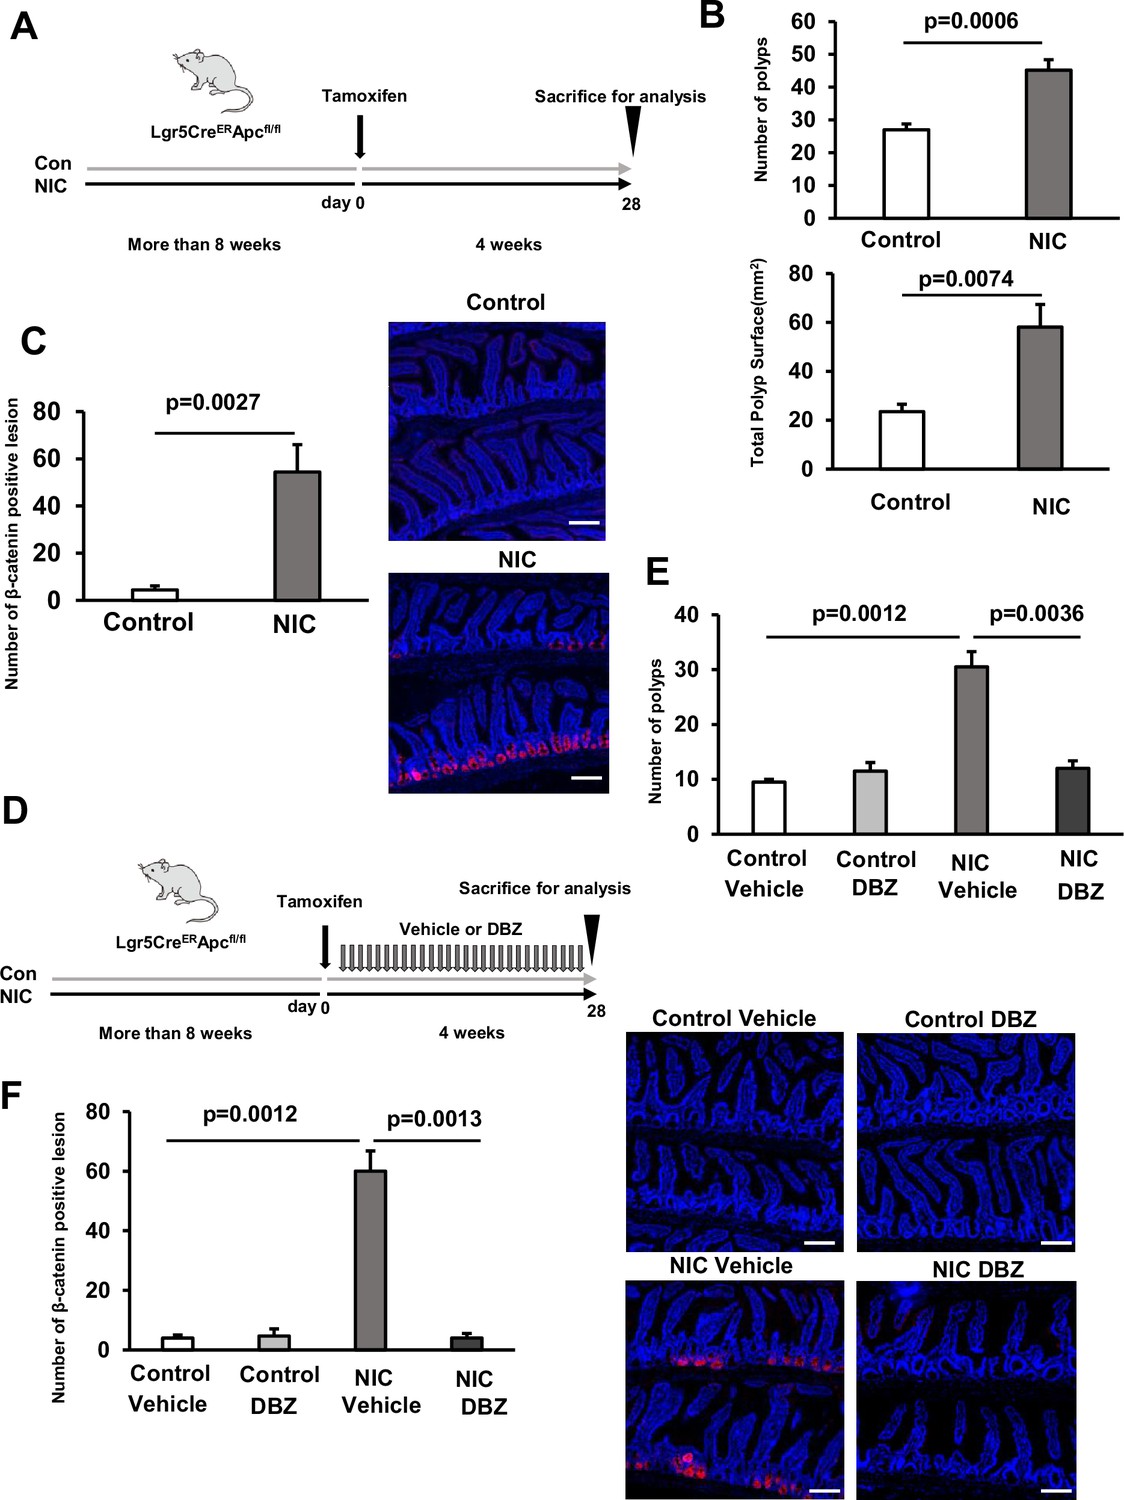
BZ inhibits intestinal tumor growth by NIC.
(A) Schematic representation of Apcflox/flox; Lgr5-EGFP-IRES-CreERT2 (Lgr5CreERT2 Apcfl/fl)tumor initiation. Mice were treated with control or NIC more than 8 weeks before a single Tamoxifen injection (30 mg/kg body weight), continued for 4 weeks before tissue collection. (B) Macroscopic quantification of the number and area of polyps in the entire intestine of control or NIC-treated Lgr5CreERT2 Apcfl/fl mice. (C) Representative images (Red: β-catenin, Blue: DAPI) and the quantification of the number of β-catenin positive adenomatous lesions in the entire intestine of control or NIC-treated Lgr5CreERT2 Apcfl/fl mice. (D) Schematic presentation of Lgr5CreERT2 Apcfl/fl tumor initiation. Control or NIC-treated Lgr5CreERT2 Apcfl/fl mice were subjected to a single Tamoxifen injection (30 mg/kg body weight), followed by daily DBZ or vehicle injections continued for 4 weeks before tissue collection. (E) Macroscopic quantification of the number of polyps in the entire intestine of DBZ or vehicle-treated Lgr5CreERT2 Apcfl/fl mice (NIC-treated and untreated). (F) Representative images (Red: β-catenin, Blue: DAPI) and the quantification of the number of β-catenin positive adenomatous lesions in the entire intestine of DBZ or vehicle-treated Lgr5CreERT2 Apcfl/fl mice (NIC-treated and untreated). Original magnifications: ×200 (C, and F). Scale bar: 50 µm (C, and F). Values represent the mean ± SEM. Significant differences are denoted by p values (Student’s t-test).
-
Figure 7—source data 1
The quantification of polyps and β-catenin positive lesions.
- https://cdn.elifesciences.org/articles/95267/elife-95267-fig7-data1-v1.xlsx
Tables
Key resources table
| Reagent type (species) or resource | Designation | Source or reference | Identifiers | Additional information |
|---|---|---|---|---|
| Strain, strain background (Mus musculus) | Lgr5-EGFP-IRES-CreERT2 mice | Jackson Laboratory | #008875 | |
| Strain, strain background (Mus musculus) | Apc CKO mice | National Cancer Institute | #01XAA | |
| Strain, strain background (Mus musculus) | Rosa26-CAG-lsl-tdTomato mice | Jackson Laboratory | #007909 | |
| Antibody | rabbit monoclonal anti-Ki67 | Cell Signaling Technology | #12202 | IHC (1:200) |
| Antibody | rabbit monoclonal anti-Olfm4 | Cell Signaling Technology | #39141 | IHC (1:400) |
| Antibody | mouse monoclonal anti-GFP | Santa Cruz Biotechnology | #sc-9996 | IHC (1:50) |
| Antibody | rabbit polyclonal anti-Lysozyme | Thermo Fisher Schientific | #PA5-16668 | IHC (1:50) |
| Antibody | mouse monoclonal anti-chromogranin A | Santa Cruz Biotechnology | #sc-393941 | IHC (1:50) |
| Antibody | rabbit polyclonal anti-β-catenin | Cell Signaling Technology | #9562 | IHC (1:200) |
| Antibody | goat polyclonal anti-mouse IgG H&L (Alexa Fluor 488) | Abcam | #ab150113 | IHC (1:200) |
| Antibody | mouse monoclonal anti-β-actin | Santa Cruz | #sc-47778 | WB (1:200) |
| Antibody | mouse monoclonal anti-YAP | Santa Cruz | #sc-101199 | WB (1:200) |
| Antibody | mouse monoclonal anti-TAZ | Santa Cruz | #sc-293183 | WB (1:200) |
| Antibody | mouse monoclonal anti-α7-AchR | Santa Cruz | #sc-58607 | WB (1:200) |
| Antibody | mouse monoclonal anti-Notch1 | Santa Cruz | #sc-376403 | WB (1:100) |
| Antibody | mouse monoclonal anti-Jagged1 | Santa Cruz | #sc-390177 | WB (1:100) |
| Antibody | mouse monoclonal anti-Jagged2 | Santa Cruz | #sc-515725 | WB (1:100) |
| Antibody | mouse monoclonal anti-Hes5 | Santa Cruz | #sc-293445 | WB (1:200) |
| Antibody | mouse monoclonal anti-p38 | Santa Cruz | #sc-81621 | WB (1:200) |
| Antibody | mouse monoclonal anti-phospho-p38 | Santa Cruz | #sc-166182 | WB (1:100) |
| Antibody | rabbit monoclonal anti-S6 | Cell Signaling | #2217 | WB (1:1000) |
| Antibody | rabbit monoclonal anti-phospho-S6 Ser235/236 | Cell Signaling | #4858 | WB (1:2000) |
| Antibody | anti-Mouse IgG, HRP-Linked Whole Ab Sheep | Cytiva | NA931 | WB (1:5000) |
| Antibody | anti-Rabbit IgG, HRP-Linked Whole Ab Donkey | Cytiva | NA934 | WB (1:5000) |
| Antibody | rat monoclonal APC-conjugated anti-mouse CD24 Antibody | Biolegend | #101814 | FCY (1:500) |
| Commercial assay or kit | TSA Plus Cyanine 3 System | Akoya Biosciences | #NEL744001KT | |
| Chemical compound, drug | Mecamylamine | Cayman Chemical | #14602 | |
| Chemical compound, drug | Adiphenine hydrochloride | MedChemExpress | #HY-B0379A | |
| Chemical compound, drug | PNU282987 | MedChemExpress and Cayman Chemical | #17424 #HY-12560A | |
| Chemical compound, drug | α-Bungarotoxin | R&D | #2133/1 | |
| Chemical compound, drug | H-89 dihydrochloride | MedChemExpress | #HY-15979A | |
| Chemical compound, drug | Gö 6983 | Cayman Chemical | #13311 | |
| Chemical compound, drug | Sotrastaurin | MedChemExpress | #HY-10343 | |
| Chemical compound, drug | K-975 | MedChemExpress | #HY-138565 | |
| Chemical compound, drug | MK-0752 | MedChemExpress | #HY-10974 | |
| Chemical compound, drug | Ingenol-3-angelate | Cayman Chemical | #16207 | |
| Chemical compound, drug | AKT Inhibitor VIII | MedChemExpress | #HY-10355 | |
| Chemical compound, drug | SB203580 | Tokyo Chemical Industry | #F0864 | |
| Chemical compound, drug | Rapamycin | LKT Laboratories, Inc | #R0161 | |
| Chemical compound, drug | Collagenase Type IV | Worthington Biochemical Corporation | #CLS4 | |
| Chemical compound, drug | Valproic acid sodium salt | FUJIFILM Wako Pure Chemical Corporation | #2815/100 | |
| Chemical compound, drug | [-]-Cotinine | Sigma-Aldrich | #C-016 | |
| Chemical compound, drug | Nicotine hemisulfate salt | Sigma-Aldrich | #N1019 | |
| Chemical compound, drug | DBZ (Dibenzazepine) | Cayman Chemical | #14627 | |
| Chemical compound, drug | Tamoxifen | Cayman Chemical | #13258 | |
| Chemical compound, drug | Mounting medium With DAPI Aqueous Fluoroshield | Abcam | #ab104139 | |
| Chemical compound, drug | Can Get Signal Immunoreaction Enhancer Solution | TOYOBO | NKB-101 |
Additional files
Download links
A two-part list of links to download the article, or parts of the article, in various formats.
Downloads (link to download the article as PDF)
Open citations (links to open the citations from this article in various online reference manager services)
Cite this article (links to download the citations from this article in formats compatible with various reference manager tools)
Nicotine enhances the stemness and tumorigenicity in intestinal stem cells via Hippo-YAP/TAZ and Notch signal pathway
eLife 13:RP95267.
https://doi.org/10.7554/eLife.95267.4


