Subcortical correlates of consciousness with human single neuron recordings
- Laboratory of Cognitive Neuroscience, Neuro-X Institute & Brain Mind Institute, Faculty of Life Sciences, Swiss Federal Institute of Technology (EPFL), Switzerland
- Department of Neurosciences, WVU Rockefeller Neuroscience Institute, United States
- University Grenoble Alpes, Inserm U1216, CHU Grenoble Alpes, Grenoble Institut Neurosciences, France
- University Grenoble Alpes, University Savoie Mont Blanc, CNRS, LPNC, France
- Departments of Neurosurgery, WVU Rockefeller Neuroscience Institute, United States
- Department of Computer Science and Electrical Engineering, West Virginia University, United States
- Department of Radiology, Washington University in St. Louis, United States
- Department of Clinical Neurosciences, University Hospital Geneva, Switzerland
Figures
Figure 1 with 2 supplements
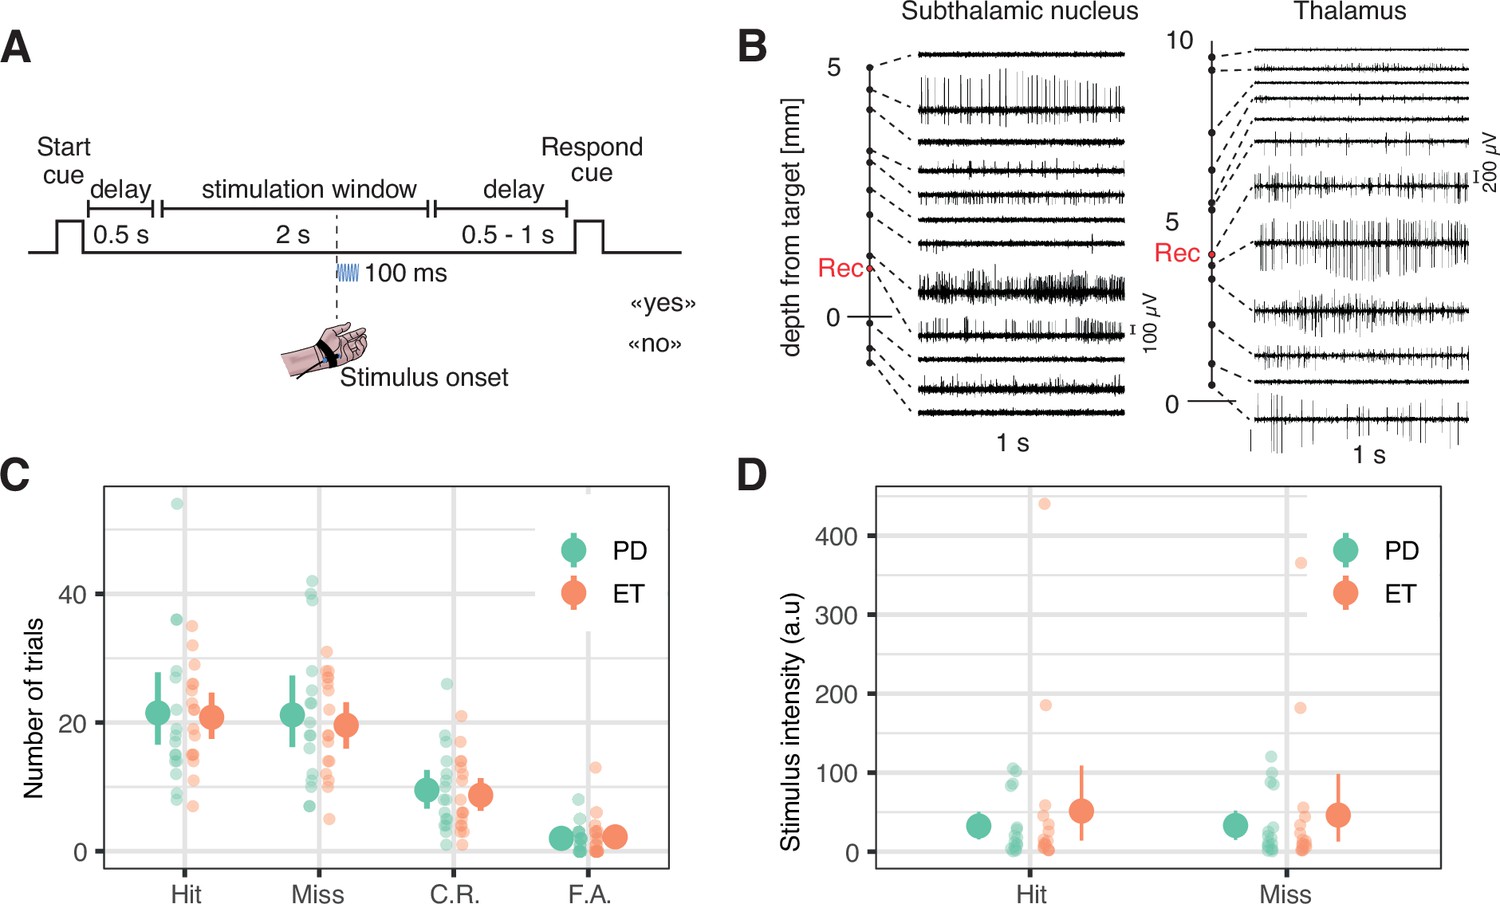
Task and behavior.
(A) Task timeline. Each trial started with an auditory start cue, followed by a 0.5 s delay. Next, the stimulus could occur anytime during a 2 s stimulation window. After a variable 0.5–1 s delay, a response cue prompted patients to answer whether or not they detected the stimulus. (B) Two example sets of 1-s-long microelectrode recordings along the surgical tract showing specific firing for the subthalamic nucleus (left) and the motor thalamus (right). The depth at which the research data was collected is represented as a red dot (see Figure 1—figure supplement 1 for anatomical correspondence). (C) Number of hits, misses, correct rejections (C.R.), and false alarms (F.A.) collected during the main experiment. (D) Averages of the absolute vibrotactile intensity in hits and misses in arbitrary units (values cannot be compared between participants). In panels C and D, each small dot represents a participant with Parkinson’s disease (PD, in green, n = 16) or essential tremor (ET, in orange, n = 17). Big dots represent averages; error bars represent 95% confidence intervals.
Figure 1—figure supplement 1

Confirmatory localization analysis.
(A) Tract reconstruction based on pre-surgery MRI and post-surgery CT images (green segment) with red markers at 5 mm above and at target (0 mm) corresponding to depths in Figure 1. (B) Improvement in UPDRS scores pre- and post-surgery.
Figure 1—figure supplement 2
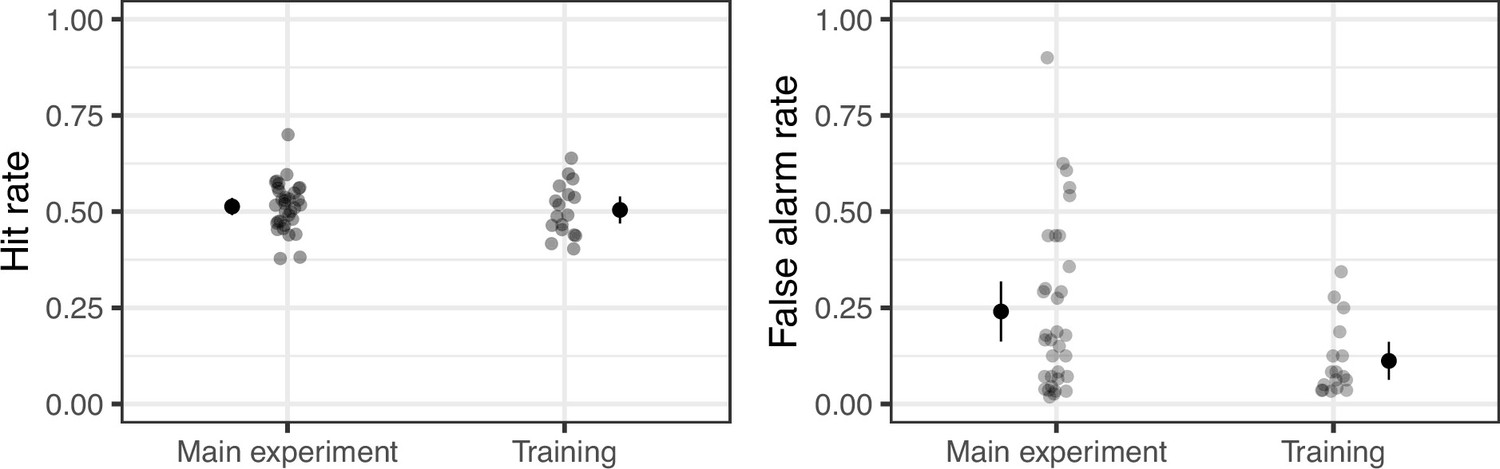
Hit rate and false alarm rate observed during the main experiment and the training session.
Each small dot represents a participant (n = 36). Big dots represent averages; error bars represent 95% confidence intervals.
Figure 2 with 2 supplements
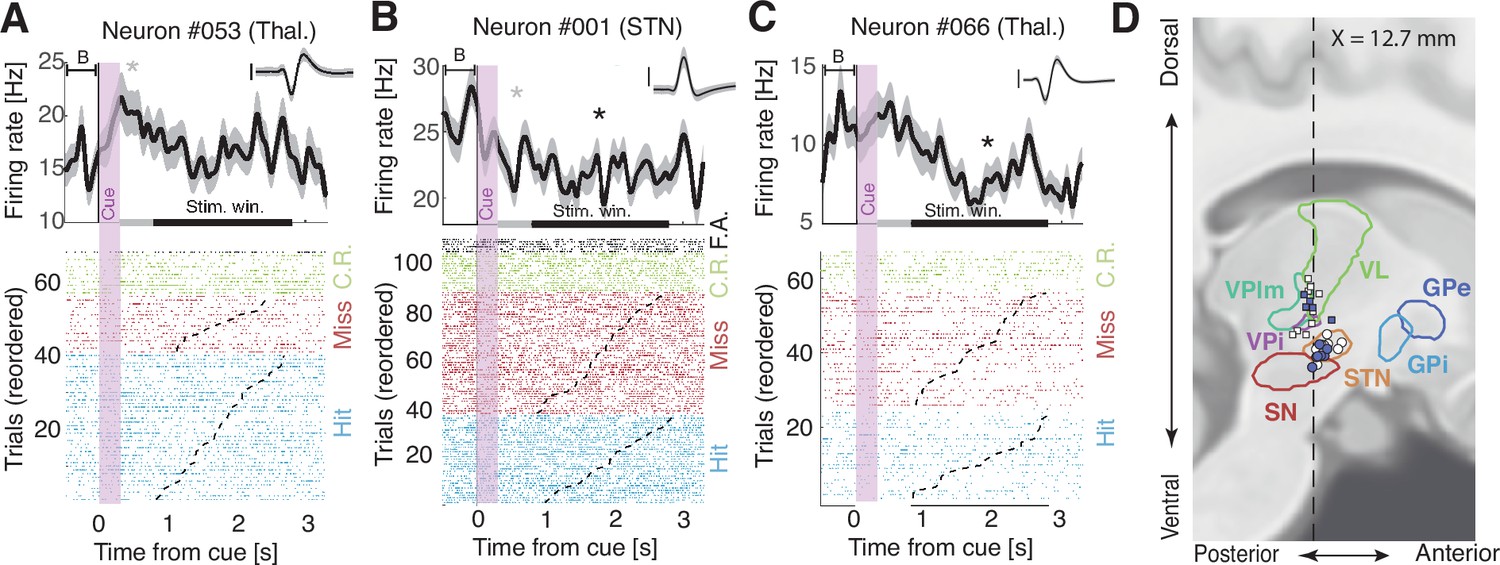
Representative cue- and task-responsive neurons in distinct patients.
(A–C) Upper panels: firing rates time-locked to the onset of a trial (300-ms-long auditory cue; vertical purple shade), compared to a 500 ms pre-cue baseline (B). Two significance windows were tested: the post-cue window (500 ms after cue offset; gray horizontal bar; cue-selective neurons) or the stimulation window (800–2800 ms post-cue; black horizontal bar; task-selective neurons). Asterisks represent statistical significance (p<0.05). Shaded areas indicate bootstrapped standard errors. Inset: corresponding action potentials (shaded area indicates standard deviation; vertical bar corresponds to 100 µV, duration: 2.5 ms). Lower panels: raster plot with trials sorted by stimulus onset (dashed lines) and type: hits (blue), misses (red), correct rejections (C.R.; green), and false alarms (F.A.; black). (A) Cue-selective neuron in the thalamus. (B) Cue- and task-selective neurons in the STN. (C) Task-selective neuron in the thalamus. (D) Sagittal view of recording locations for thalamic (squares) and subthalamic (circles) targets (see Figure 2—figure supplement 2 for a coronal view) for patients for which we could obtain anatomical images. Filled circles or squares are cue/task-selective neurons. Legend: VL: ventral lateral thalamus, VPlm: ventral posterior lateral and medial thalamus, VPi: ventral posterior inferior thalamus, STN: subthalamic nucleus, SN: substantia nigra, GPi/e: globus pallidus internalis/externalis.
Figure 2—figure supplement 1
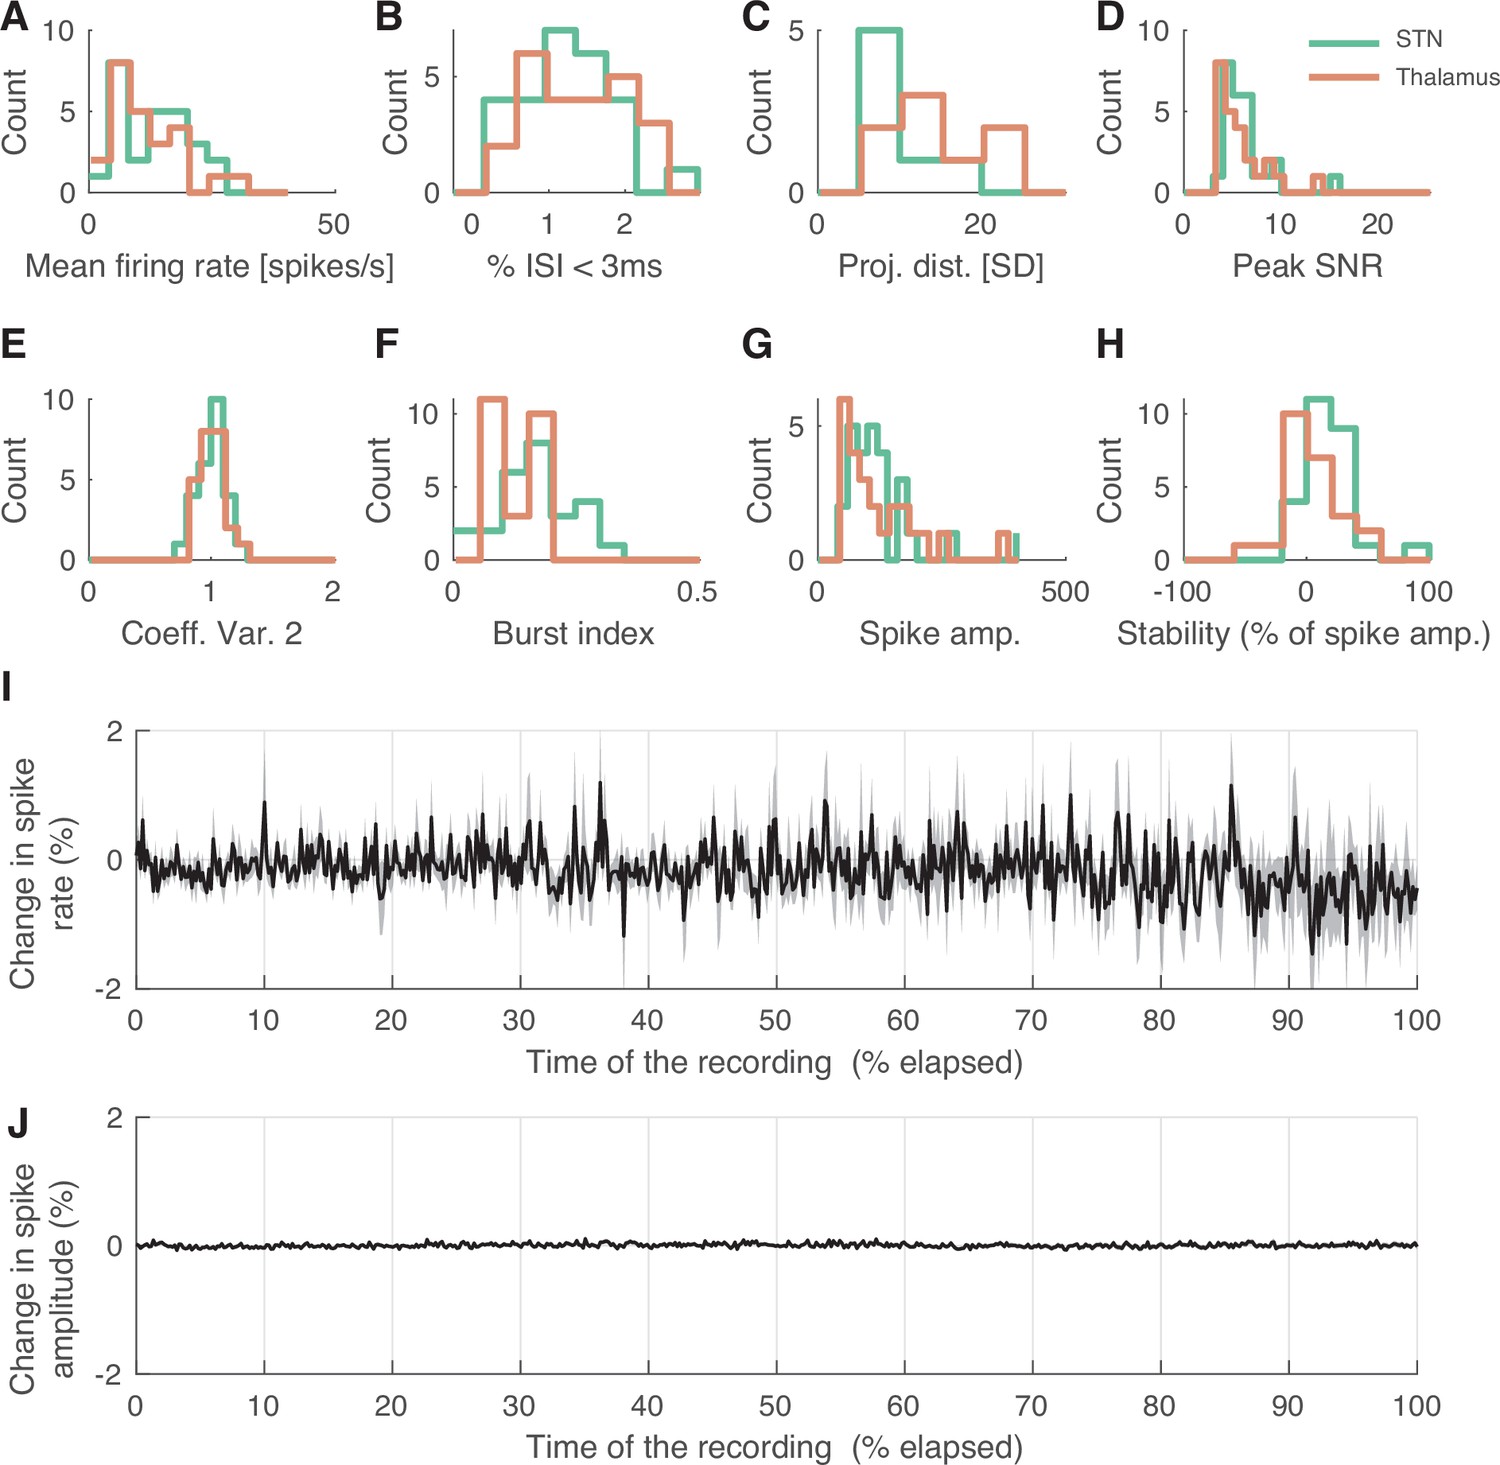
Spike sorting metrics.
(A) Histogram of firing rate during the time recordings was analyzed for neurons in the subthalamic nucleus (STN) (green) and thalamus (orange). (B) Percentage of inter-spike intervals falling within a 3 ms refractory period. (C) Projection distance in standard deviation (SD). (D) Peak signal-to-noise ratio (SNR). (E) Modified coefficient of variation (Coeff. Var. 2). (F) Burst index (BI). (G) Average spike amplitude in µV. (H) Percentage of change in spike amplitude between the beginning and end of time recordings was analyzed. (I) Change (in percent related to start) in the firing rate, reinterpolated for comparison across sessions. (J) Change (in percent related to start) in the spike amplitude, reinterpolated for comparison across sessions. The shaded area represents the bootstrapped standard error of the mean across recordings.
Figure 2—figure supplement 2

Coronal view of recording locations.
Thalamic (squares) and subthalamic (circles) targets for patients for which we could obtain anatomical images. Filled circles or squares correspond to task-selective neurons. Legend: VL: ventral lateral thalamus, VPlm: ventral posterior lateral and medial thalamus, VPi: ventral posterior inferior thalamus, STN: subthalamic nucleus, SN: substantia nigra, GPi/e: globus pallidus internalis/externalis.
Figure 3 with 1 supplement
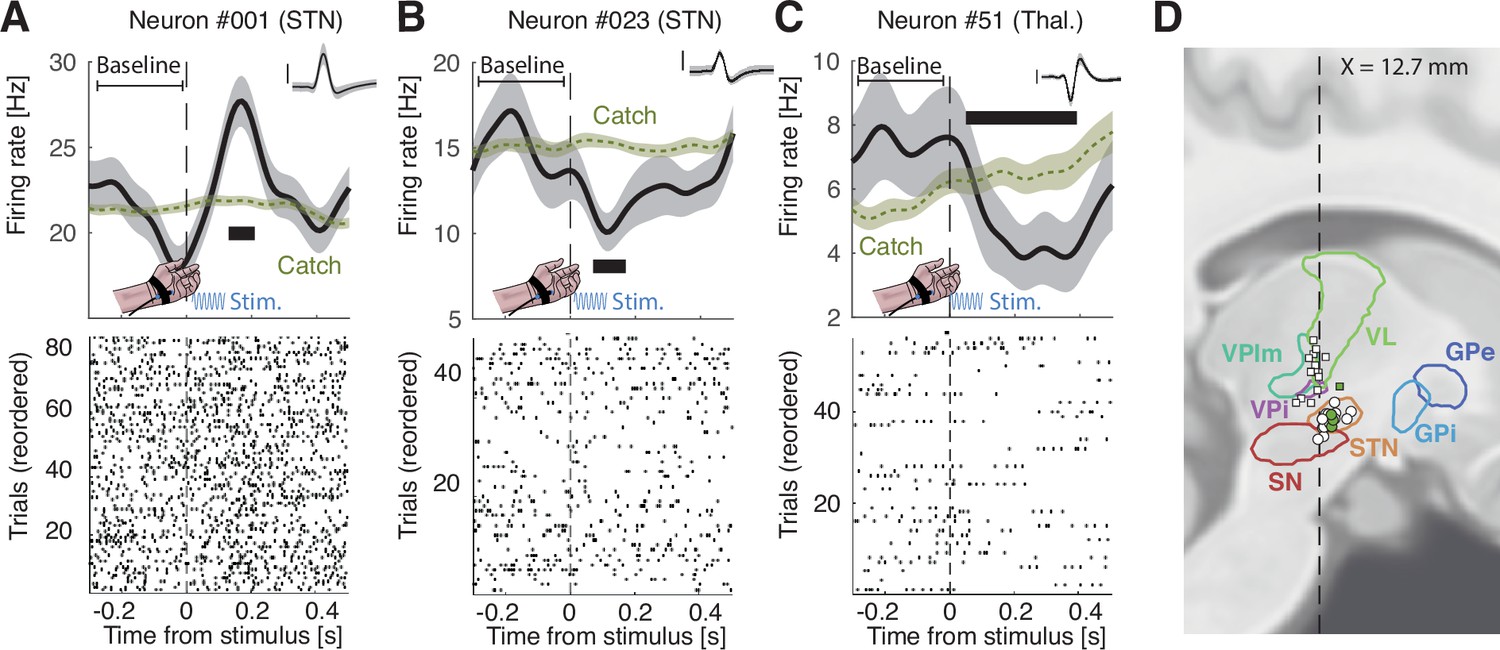
Representative stimulus-responsive neurons in distinct patients.
(A–C) Upper panels: firing rate time-locked to the onset of the stimulus (100 ms vibrotactile stimulation; blue sinusoid) for all trials before baseline correction. Green trace represents corresponding activity for catch trials. Thick horizontal black segments show significant time windows. Shaded areas indicate bootstrapped standard errors. Inset: corresponding action potentials (shaded area indicates standard deviation; vertical bar corresponds to 100 µV, duration: 2.5 ms). Lower panels: raster plot. The 300 ms pre-stimulus baseline was used only for statistics. (D) Sagittal view of recording locations for thalamic (squares) and subthalamic (circles) targets (see Figure 3—figure supplement 1 for a coronal view) for patients for which we could obtain anatomical images. Filled circles or squares are sensory-selective neurons. Legend: VL: ventral lateral thalamus, VPlm: ventral posterior lateral and medial thalamus, VPi: ventral posterior inferior thalamus, STN: subthalamic nucleus, SN: substantia nigra, GPi/e: globus pallidus internalis/externalis.
Figure 3—figure supplement 1

Coronal view of recording locations.
Thalamic (squares) and subthalamic (circles) targets for patients for which we could obtain anatomical images. Filled circles or squares correspond to sensory-selective neurons. Legend: VL: ventral lateral thalamus, VPlm: ventral posterior lateral and medial thalamus, VPi: ventral posterior inferior thalamus, STN: subthalamic nucleus, SN: substantia nigra, GPi/e: globus pallidus internalis/externalis.
Figure 4 with 4 supplements
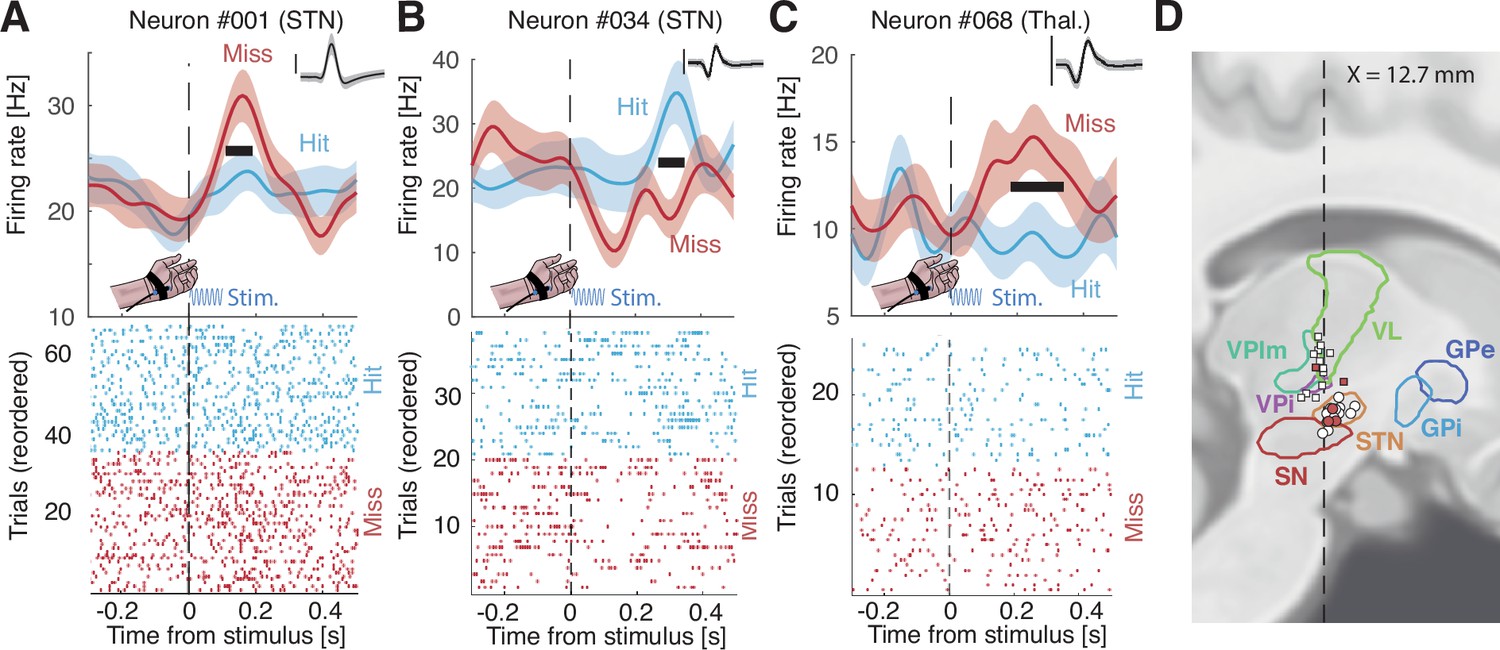
Representative perception-selective neurons in distinct patients.
(A–C) Upper panels: firing rate time-locked to the onset of the stimulus (100 ms vibrotactile stimulation; blue sinusoid) for hits (light blue) and misses (red). Thick horizontal black segments show significant time windows. Shaded areas indicate bootstrapped standard errors. Inset: corresponding action potentials (shaded area indicates standard deviation; vertical bar corresponds to 100 µV, duration: 2.5 ms). Lower panels: raster plot for hits (light blue) and misses (red). See Figure 4—figure supplement 1 for all neurons that are perception- or sensory-selective. (D) Sagittal view of recording locations for thalamic (squares) and subthalamic (circles) targets (see Figure 4—figure supplement 2 for a coronal view) for patients for which we could obtain anatomical images. Filled circles or squares are perception-selective neurons. Legend: VL: ventral lateral thalamus, VPlm: ventral posterior lateral and medial thalamus, VPi: ventral posterior inferior thalamus, STN: subthalamic nucleus, SN: substantia nigra, GPi/e: globus pallidus internalis/externalis.
Figure 4—figure supplement 1
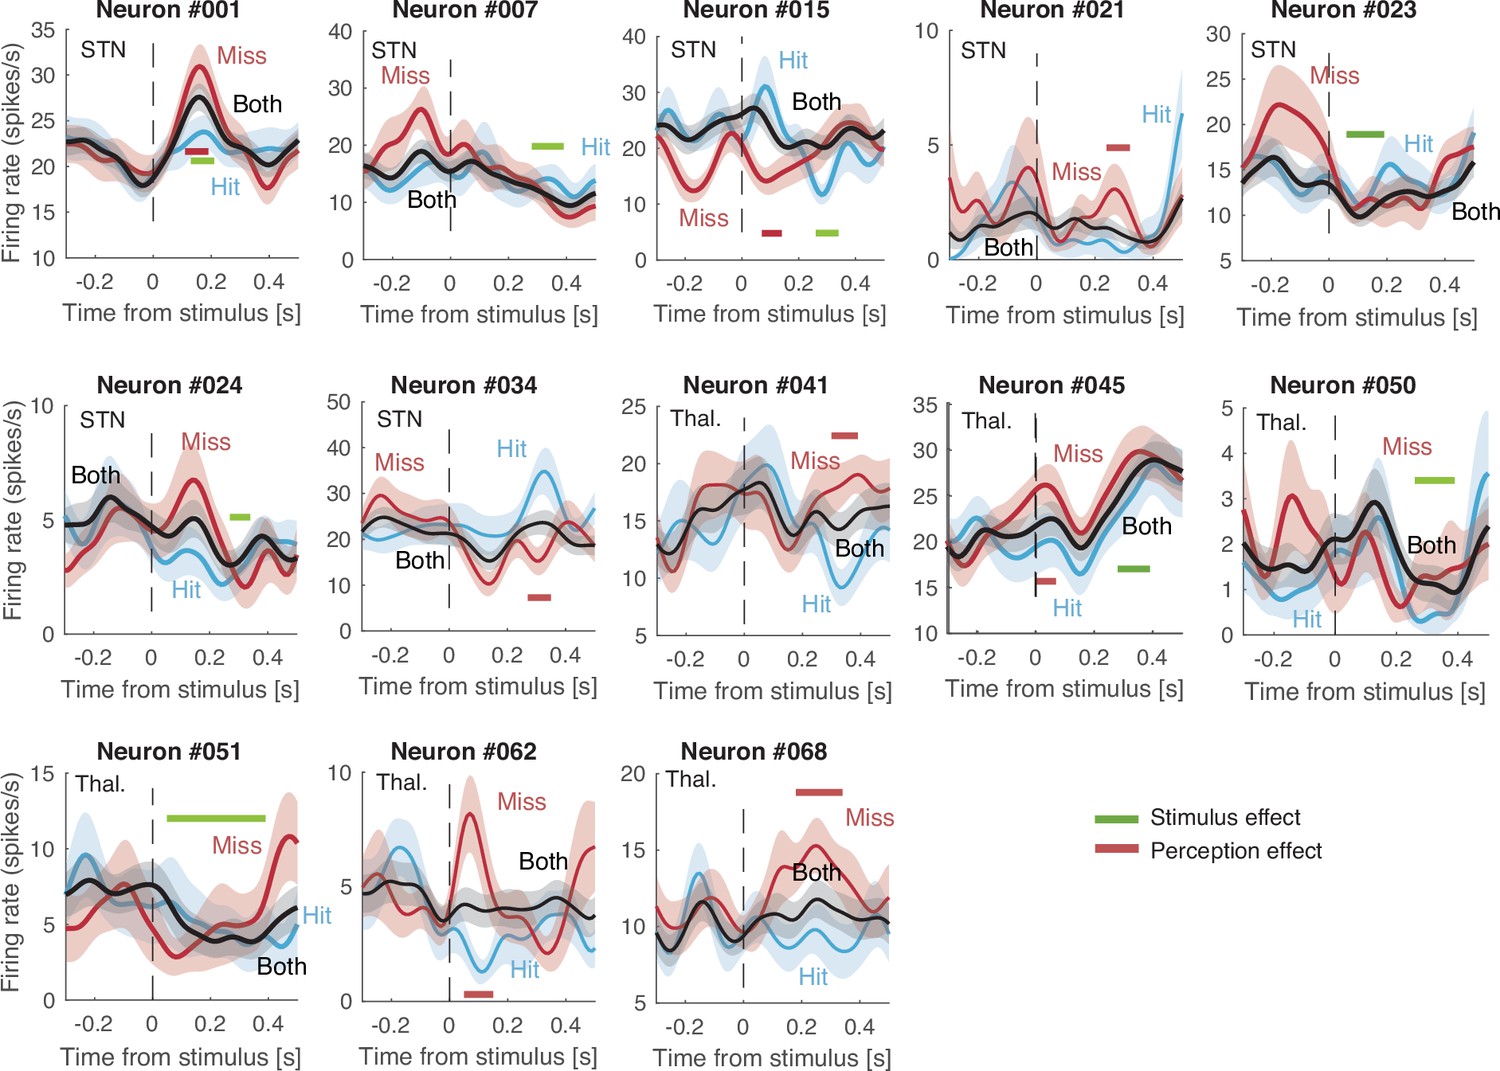
Firing rate time-locked to the onset of the stimulus (100 ms vibrotactile stimulation; vertical dashed line) for hits (light blue), misses (red), and for combined data (both; black).
Thick horizontal segments show significant time windows for stimulus- (green) and perception-selective neurons (red). Shaded areas indicate bootstrapped standard errors.
Figure 4—figure supplement 2

Coronal view of recording locations.
Thalamic (squares) and subthalamic (circles) targets for patients for which we could obtain anatomical images. Filled circles or squares correspond to perception-selective neurons. Legend: VL: ventral lateral thalamus, VPlm: ventral posterior lateral and medial thalamus, VPi: ventral posterior inferior thalamus, STN: subthalamic nucleus, SN: substantia nigra, GPi/e: globus pallidus internalis/externalis.
Figure 4—figure supplement 3

Neurons from Figure 4 for different stimulus intensities and onsets.
We used the same trials as in Figure 4 but segregated in high vs low stimulus intensities (upper panel) or short and long stimulus onsets (lower panel). We found only 5/32 neurons sensitive to stimulus intensity (16%; p=0.13; permutation test) and no neurons sensitive to stimulus onset (0/35). None of the 5 intensity-selective neurons corresponded to a perception-sensitive neuron. (A–C) Firing rate time-locked to the onset of the stimulus (100 ms vibrotactile stimulation; blue sinusoid) for high-intensity (light blue) and low-intensity (dark blue) trials (upper panel) or early (green) and late (orange) stimulus onsets. Shaded areas indicate bootstrapped standard errors. Inset: corresponding action potentials (shaded area indicates standard deviation; vertical bar corresponds to 100 µV, duration: 2.5 ms).
Figure 4—figure supplement 4
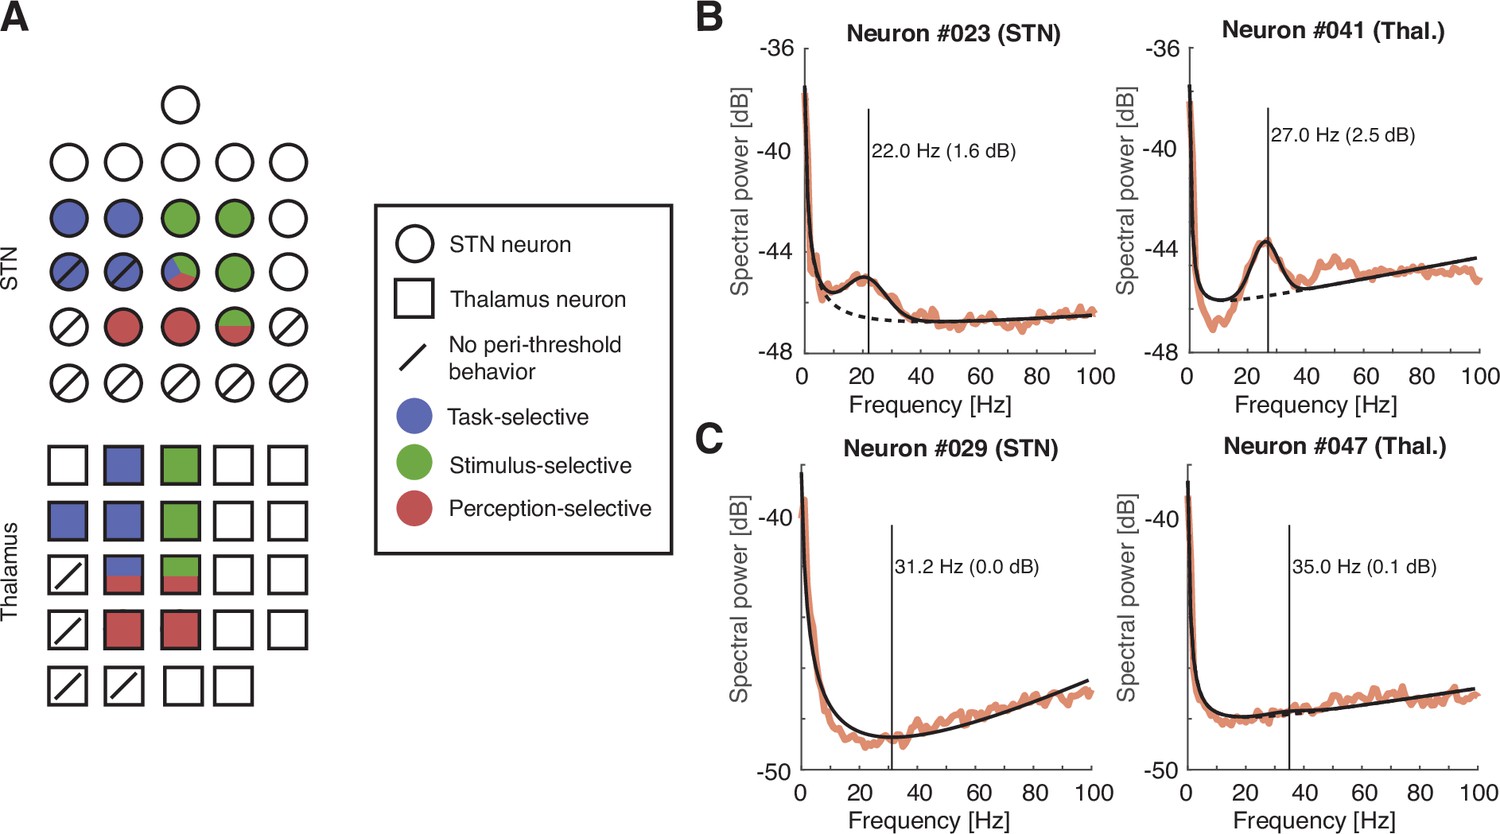
Distribution of subthalamic neurons and relation to beta oscillations.
(A) Distribution of subthalamic nucleus (STN) (circles) and thalamus (square) neurons for task- (blue), stimulus (green), and perception selectivity (red). Neurons for which we did not obtain a sufficient number of trials for which behavior could be considered to be around the tactile perceptual threshold (see Methods) are stricken by an oblique line. (B–C) The resulting spectra (orange trace) and the resulting fit (black trace). To measure the beta component, we fitted the spectrum of the power spectral density of the spikes with seven parameters: four to model the 1/f decay and three to model the bump in the spectrum: beta amplitude * (beta frequency + K*beta width), with K a Gaussian kernel of mean 0 and unit standard deviation. We found no relationship between the selectivity of neurons and the frequency or amplitude of the beta component (p>0.10). The spectrum without the beta component is plotted as a black dashed line. (B) Neurons with the highest beta components in the STN (left) and thalamus (right). (C) Neurons with the lowest beta components in the STN (left) and thalamus (right).
Figure 5
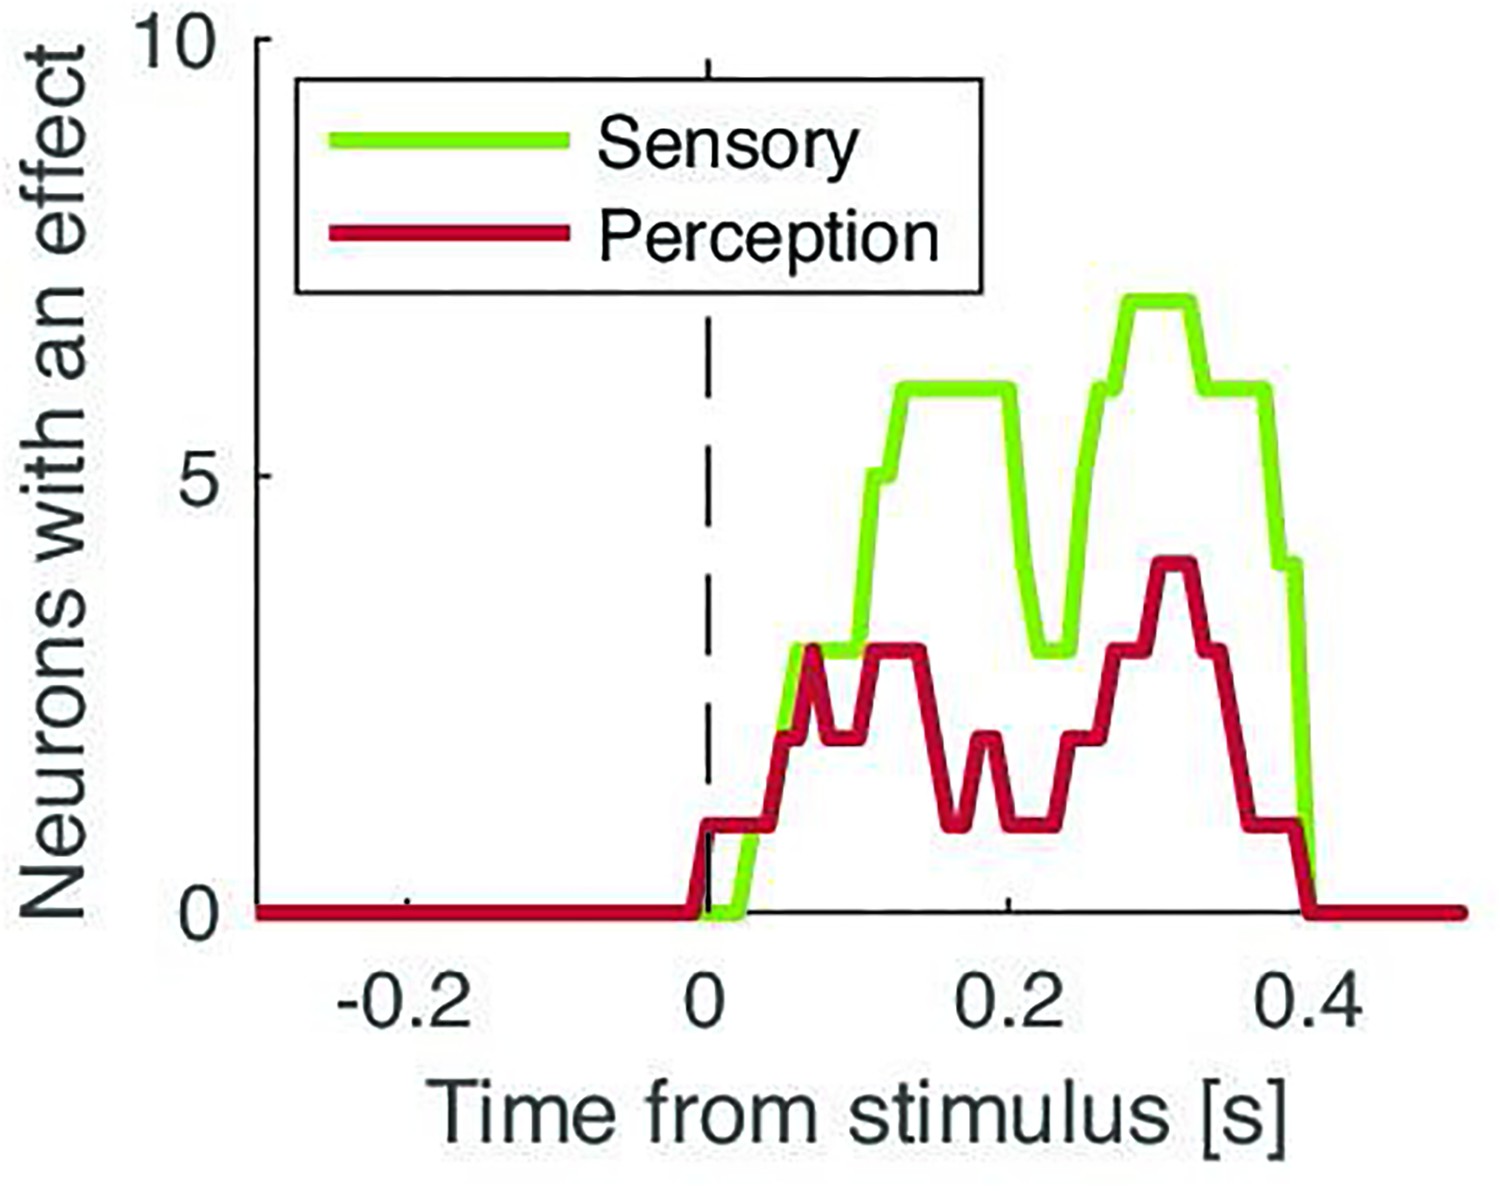
Number of neurons with a significant effect over time for sensory-selective neurons (green) and perception-selective neurons (red).
Arrows show the corresponding early and late cluster centroids (green for sensory; red for perception).
Additional files
Download links
A two-part list of links to download the article, or parts of the article, in various formats.
Downloads (link to download the article as PDF)
Open citations (links to open the citations from this article in various online reference manager services)
Cite this article (links to download the citations from this article in formats compatible with various reference manager tools)
Subcortical correlates of consciousness with human single neuron recordings
eLife 13:RP95272.
https://doi.org/10.7554/eLife.95272.3


