LPS-induced systemic inflammation is suppressed by the PDZ motif peptide of ZO-1 via regulation of macrophage M1/M2 polarization
- Department of Medical Science, Kosin University College of Medicine, Republic of Korea
- Department of Chemical Engineering, Pukyong National University, Republic of Korea
- Department of Anatomy, Kosin University College of Medicine, Republic of Korea
- Department of Biochemistry, Kosin University College of Medicine, Republic of Korea
- Department of Integrative Biological Sciences and Industry, College of Life Sciences, Sejong University, Republic of Korea
Figures
Figure 1
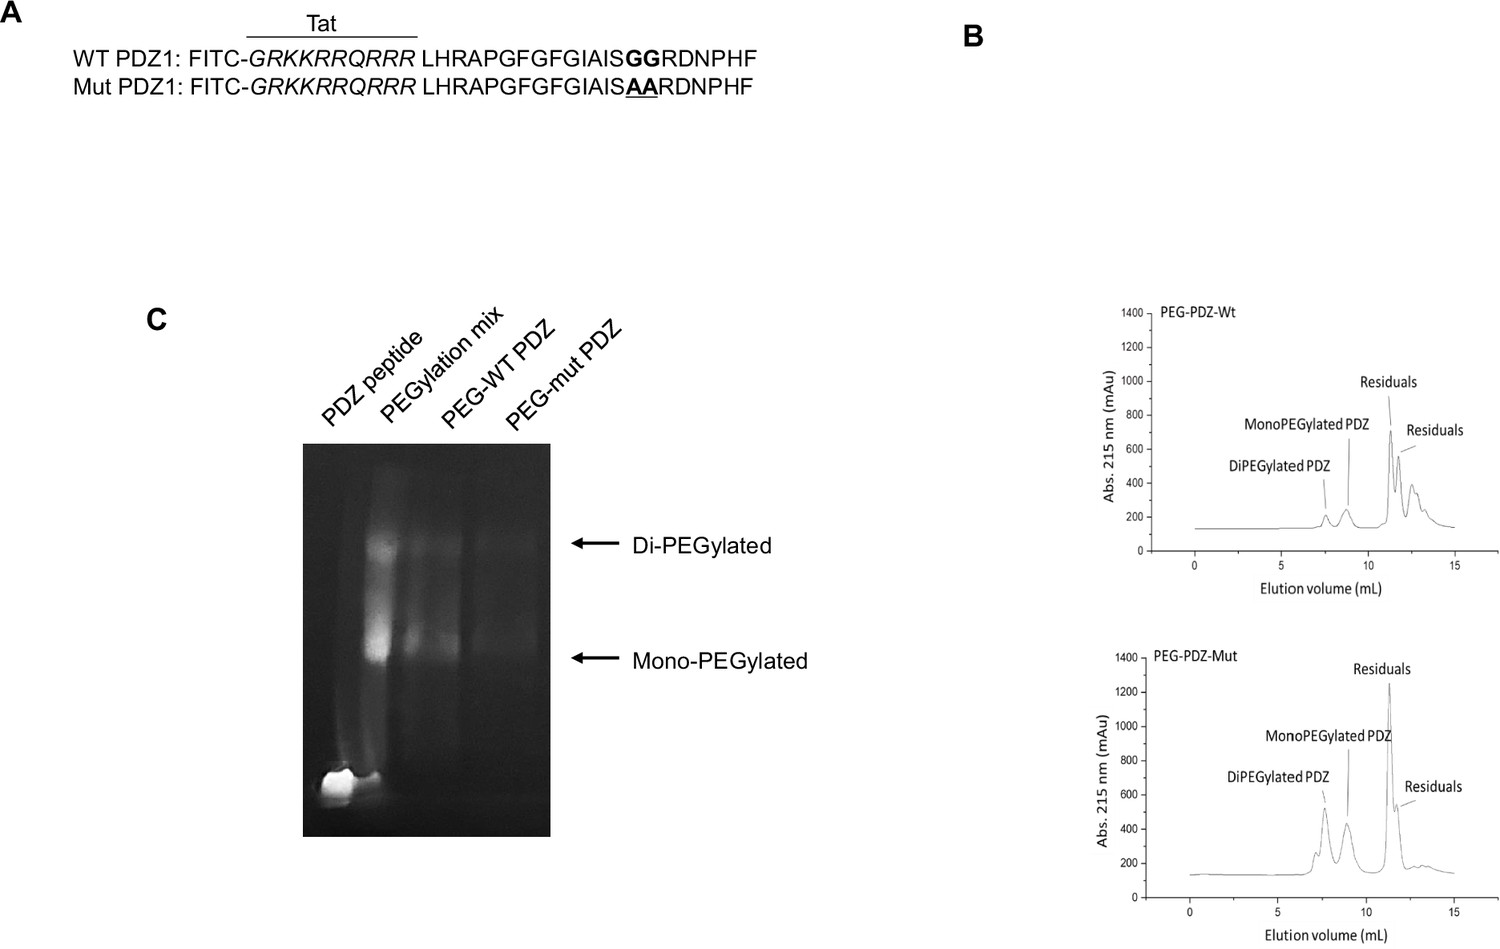
PEGylation and purification of PEGylated PDZ (PEG-WT PDZ) and PEGylated mut PDZ (PEG-mut PDZ).
(A) Peptides were synthesized with fluorescein isothiocyanate (FITC) and entered the Tat region (italicized amino acids) for cell penetration based on the first PDZ domain sequence (A, upper panel), and 25GG26 was changed to 25AA26 for the mutant PDZ peptide (mut PDZ peptide; lower panel). (B) Size exclusion chromatography for isolation of PEG-WT PDZ or PEG-mut PDZ from the mixture of WT PDZ or mut PDZ reacted with m-PEG-succinimidyl succinate (MW 5000). (C) SDS-PAGE analysis for visualization of PEGylated products. Samples were run on SDS-PAGE and then illuminated at λex = 480 nm to obtain in-gel fluorescence.
-
Figure 1—source data 1
Labelled gel for Figure 1C.
- https://cdn.elifesciences.org/articles/95285/elife-95285-fig1-data1-v1.pdf
-
Figure 1—source data 2
Raw unedited gels for Figure 1C.
- https://cdn.elifesciences.org/articles/95285/elife-95285-fig1-data2-v1.tif
Figure 2
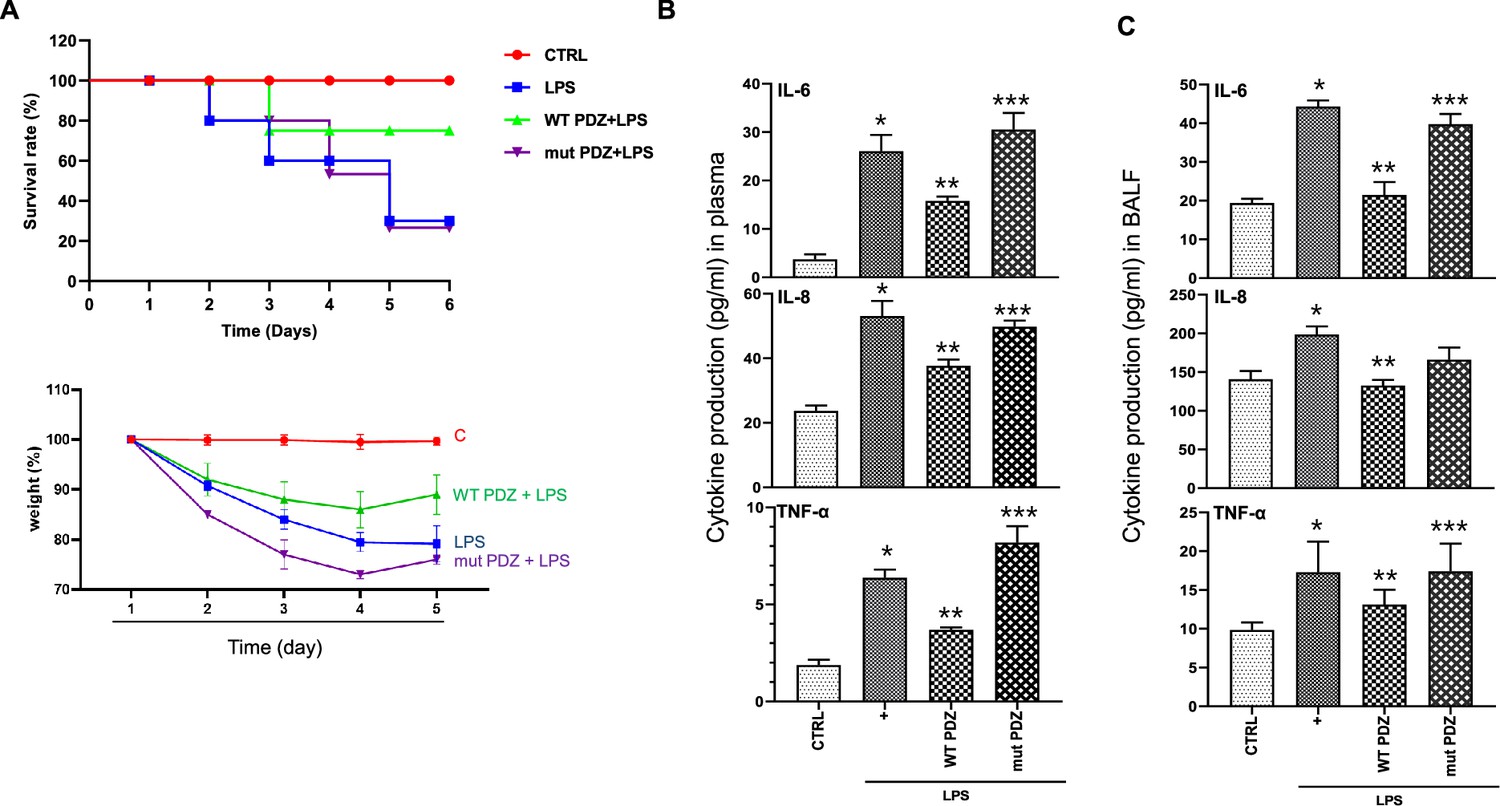
The inhibitory effect of PDZ peptide on lipopolysaccharide (LPS)-induced systemic inflammatory responses in vivo.
(A) Comparison of survival rate and body weight change after administration of LPS or both LPS and PDZ peptide. The body weight was measured for the duration of LPS administration (5 days). LPS administration (10 mg/kg/30 μL) into the peritoneum of mice that were injected 4 hr prior with either the wild-type (WT) PDZ peptide or the mutant PDZ peptide (7.5 mg/kg/30 μL, i.v.). (B) After 5 days, the IL-6, IL-8, and TNF-α concentrations in the plasma were measured using specific ELISAs. (C) To examine lung pathology, BALF was harvested. The IL-6, IL-8, and TNF-α concentrations in the BALF were measured using specific ELISAs. *p<0.05 compared with saline-treated mice; **p<0.05 compared with LPS-treated mice; ***p<0.05 compared with LPS- and WT PDZ peptide-treated mice.
Figure 3
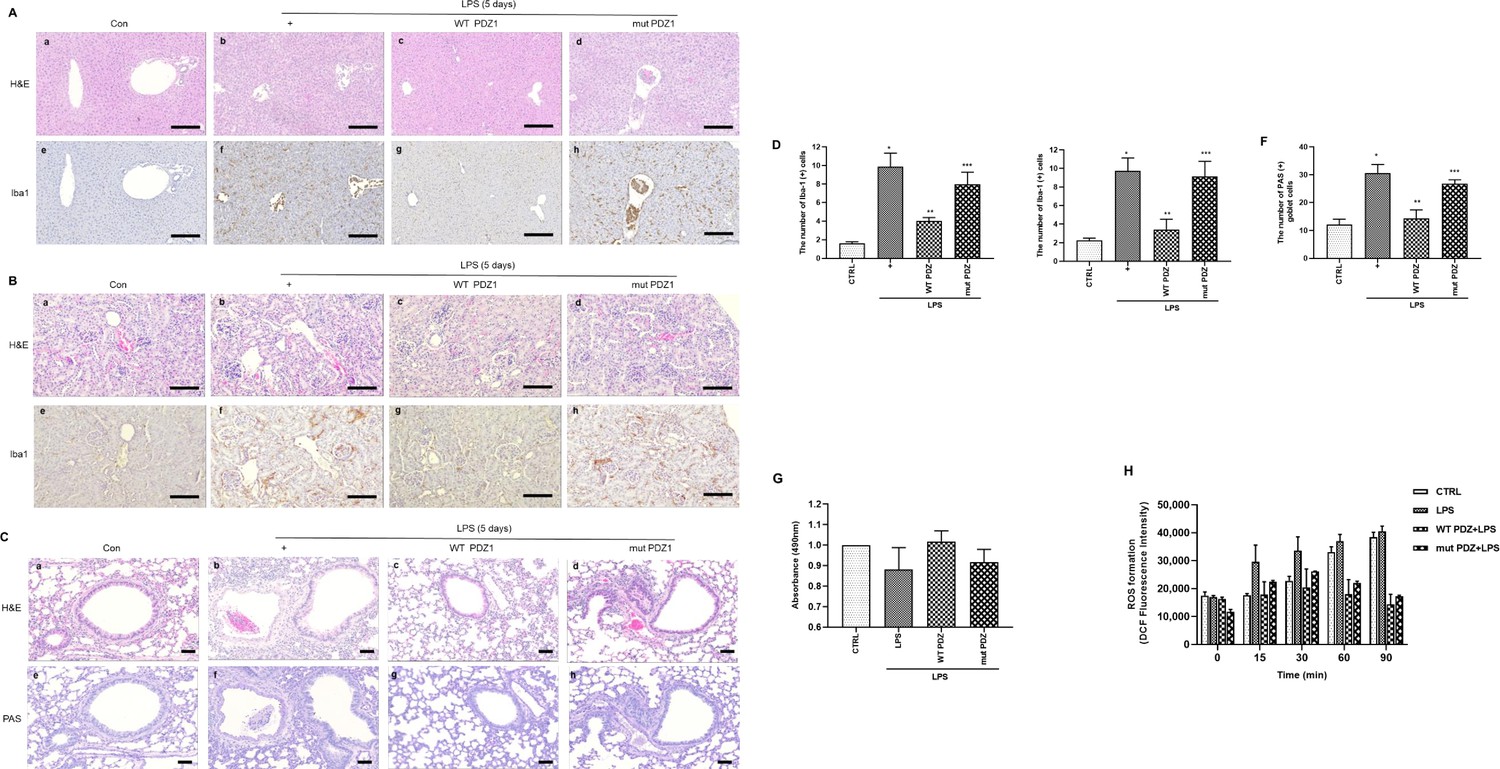
The effects of PDZ peptide on liver, kidney, and lung injuries in lipopolysaccharide (LPS)-administered mice.
LPS administration (10 mg/kg/30 μL) into the peritoneum of mice injected 4 hr prior with either the wild-type (WT) PDZ peptide or the mutant PDZ peptide (7.5 mg/kg/30 μL, i.v.). After administration for 5 days, the liver (a), kidney (b), and lung (c) were harvested. Both hematoxylin and eosin (H&E) and iba-1 staining were performed on the tissue sections from the treated mice (400x). Indicated scale bars were 20 μm. (d,e,f) Semi-quantitative analysis of each is positive for Iba-1 in the liver and kidney, and positive cells of periodic acid Schiff (PAS) in the lung, respectively. (g) After the kidneys were harvested, tissue lysates were used for MTT assay. (h) After mitochondria from the kidneys was isolated, the mitochondria lysates were used for ROS measurement. *p<0.05 compared with saline-treated mice; **p<0.05 compared with LPS-treated mice; ***p<0.05 compared with LPS- and WT PDZ peptide-treated mice. All data shown are representative of three independent experiments.
Figure 4
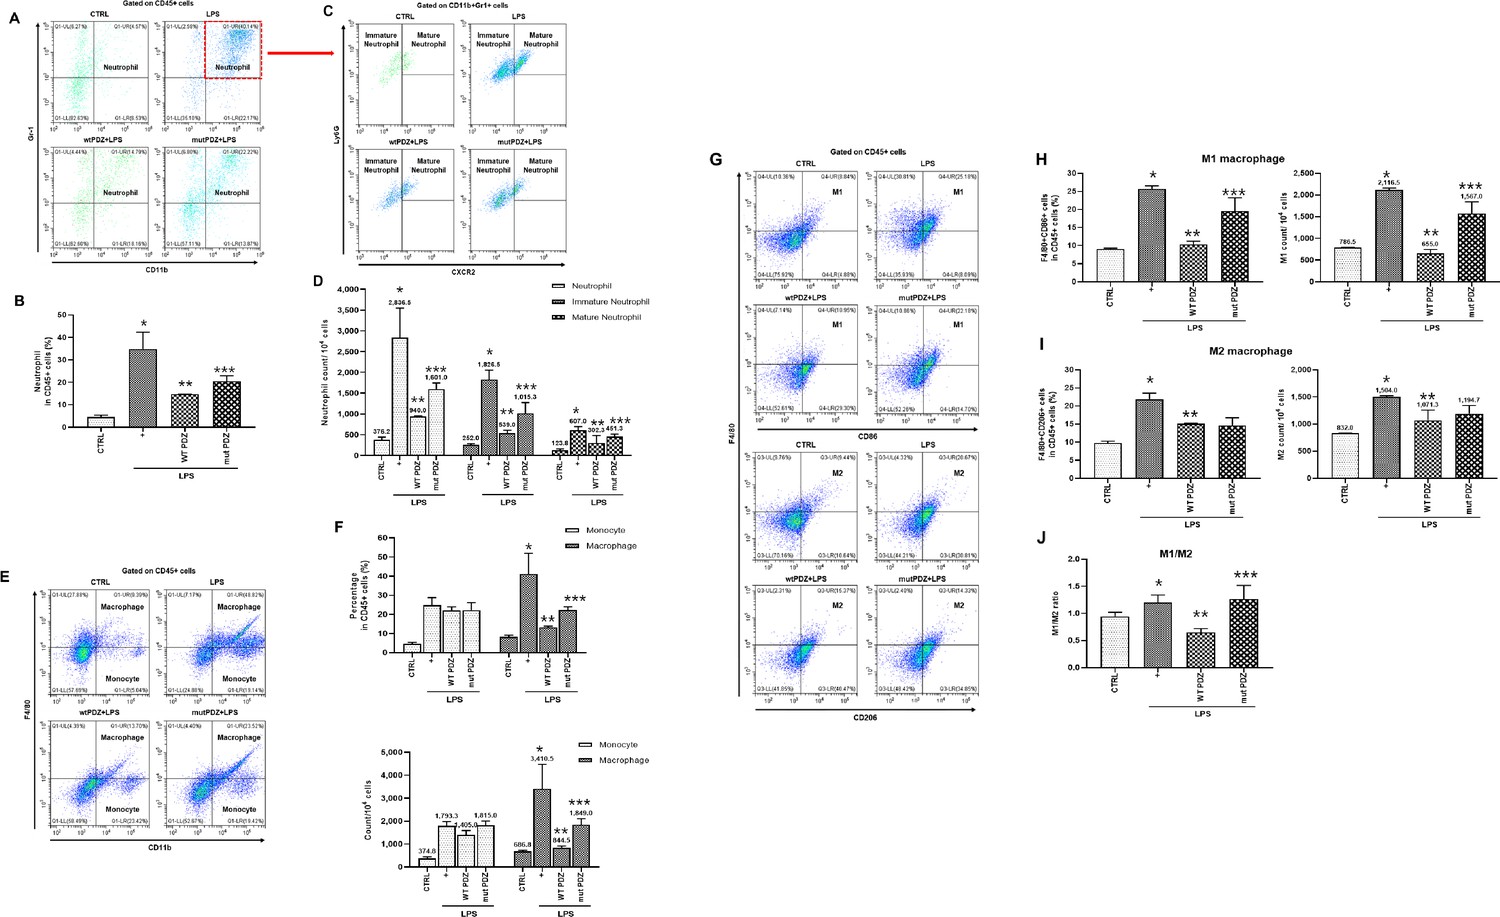
Gating strategy used in flow cytometry to determine the populations of immune cells in mice administered lipopolysaccharide (LPS) and PDZ peptides.
Five days after LPS administration (10 mg/kg/30 μL) into the peritoneum of mice that were injected 4 hr prior with either the wild-type (WT) PDZ peptide or the mutant PDZ peptide (7.5 mg/kg/30 μL, i.v.). After administration for 5 days, spleens were harvested. (A, C) Subpopulations of either immature or mature neutrophils were identified as CXCR2-Ly6Glo/+ (immature) and CXCR2+Ly6G+ (mature). (B, D) Data for each neutrophil phenotype are displayed as the percentages of neutrophil (CD11b+Gr-1+) in CD45+ cells and the exact number of immature- and mature-neutrophil counted per 104 total neutrophil cells. (E, F) Flow cytometry of monocyte (CD11b+F4/80int) and macrophage (CD11b+F4/80+) expression in CD45+ cells is shown. Data for each cell phenotype are displayed as the percentages of monocytes and macrophages in CD45+ cells and the exact number of monocytes and macrophages counted per 104 total single cells. (G) Subpopulations of two types of macrophages were identified as CD86+F4/80+ (M1) and CD206+F4/80+ (M2) in CD45+ cells. (H, I) Data for each cell phenotype are displayed as the percentages of M1- and M2-macrophages in CD45+ cells and the exact number of M1- and M2- macrophages counted per 104 total single cells. (J) The M1/M2 ratio was calculated based on the percentage of F4/80+CD86+ cells and F4/80+CD206+ cells in CD45+ cells. *p<0.05 compared with saline-treated mice; **p<0.05 compared with LPS-treated mice; ***p<0.05 compared with LPS- and WT PDZ peptide-treated mice. All data shown are representative of three independent experiments.
Figure 5
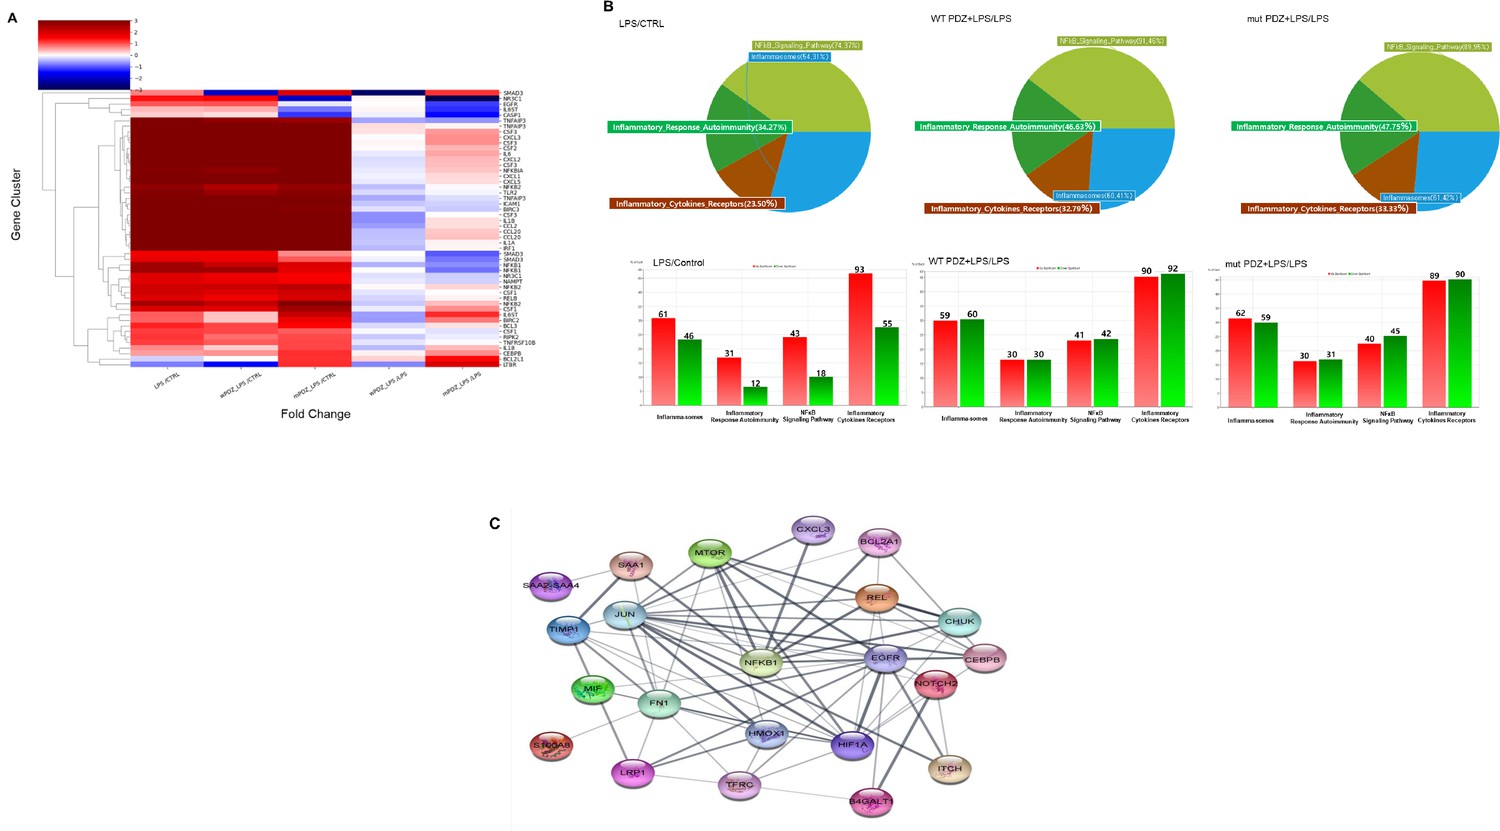
Comparison of mRNA expression in PDZ-treated BEAS-2B cells.
BEAS-2B cells were treated with wild-type PDZ or mutant PDZ peptide for 24 hr and then incubated with lipopolysaccharide (LPS) for 2 hr, after which RNA sequencing analysis was performed. (A) The heat map shows the general regulation pattern of about 51 inflammation-related genes that are differentially expressed when WT PDZ and mut PDZ are treated with LPS, an inflammatory substance. All samples are RED = upregulated and BLUE = downregulated relative to the gene average. Each row represents a gene, and the columns represent the values of the control group treated only with LPS and the WT PDZ and mut PDZ groups with LPS. This was used by converting each log value into a fold change value. All genes were adjusted to have the same mean and standard deviation, the unit of change is the standard deviation from the mean, and the color value range of each row is the same. (B) Significant genes were selected using Gene category chat (Fold change value of 2.00 and normalized data (log2) value of 4.00). The above pie chart shows the distribution of four gene categories when comparing LPS versus control, WT PDZ +LPS/LPS, and mut PDZ +LPS/LPS. The bar graph below shows RED = upregulated, and GREEN = downregulated for each gene category, and shows the number of upregulated and downregulated genes in each gene category. (C) The protein-protein interaction network constructed by the STRING database differentially displays commonly occurring genes by comparing WT PDZ +LPS/LPS, mut PDZ +LPS/LPS, and LPS. These nodes represent proteins associated with inflammation, and these connecting lines denote interactions between two proteins. Different line thicknesses indicate types of evidence used in predicting the associations.
Figure 6
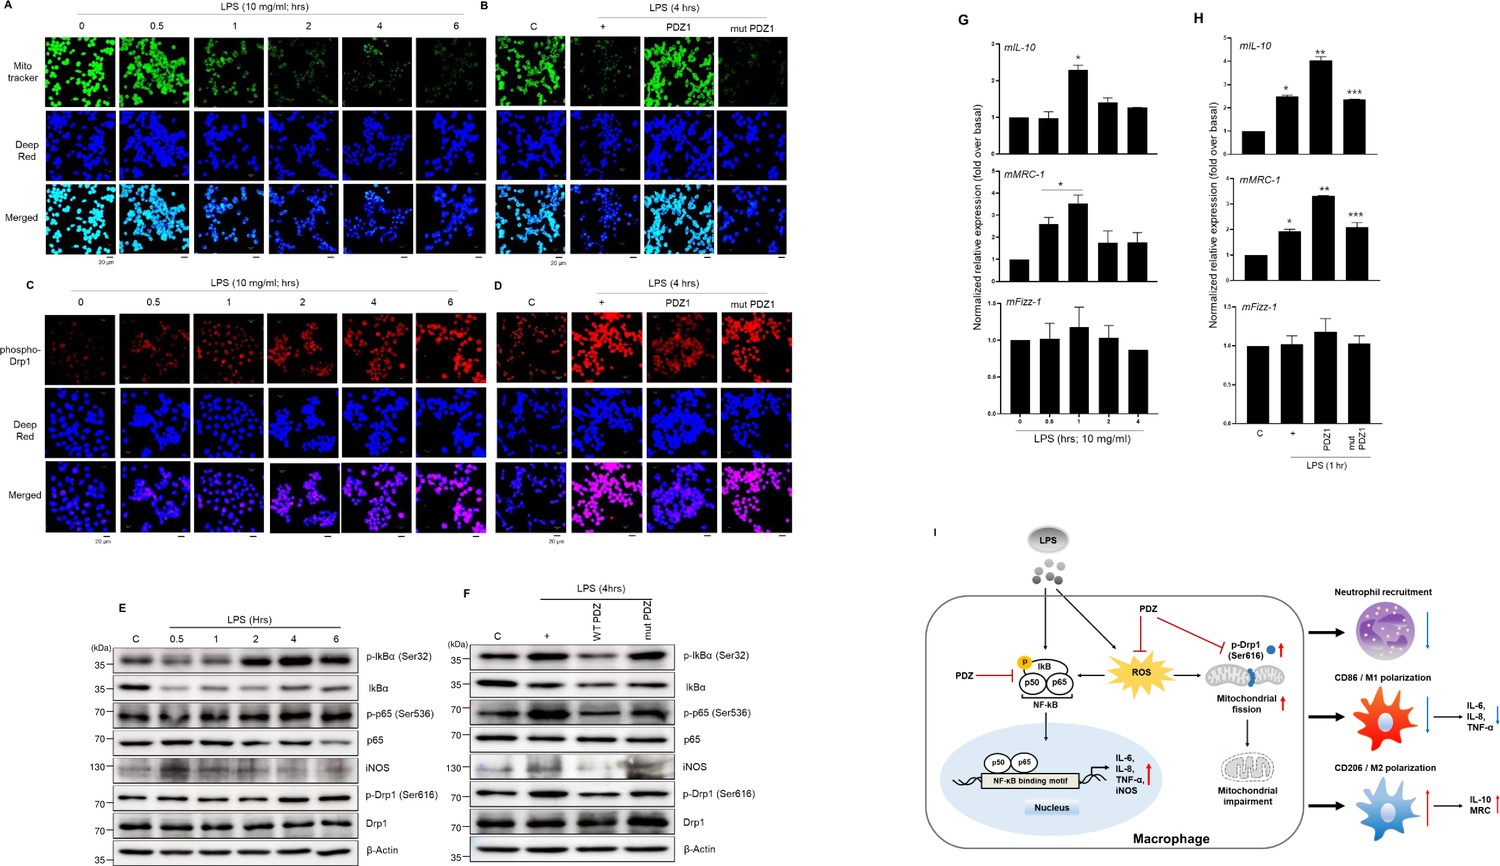
PDZ peptide dramatically increases M2 marker proteins to regulate M1/M2 polarization via NF-κB signaling and ROS production.
(a, c, e, g) The cells were treated with lipopolysaccharide (LPS) in a time-dependent manner. After treatment with wild-type (WT) PDZ and mutant PDZ, the cells were treated with LPS for 4 hr (b, d, f) or 1 hr (h). The mitochondria morphology was stained using MitoTracker Green FM and visualized (a, b). The mitochondria fission was stained using phospho-Drp1 antibody and visualized (c, d).Indicated scale bars were 20 μm. The phospho-specific and total antibodies were assessed by Western blot analysis. β-actin was used as a loading control (e, f). The lysates were prepared for qPCR for the expression of M1 and M2 marker proteins (g, h). *p< 0.05 compared with control; **p< 0.05 compared with LPS treatment; ***p< 0.05 compared with WT PDZ-treated transfectants. All of the data shown are representative of three independent experiments. (i) A graphic abstract illustrating that the PDZ peptide of zonula occludens-1 (ZO-1) protein inhibits LPS-induced systemic inflammation by regulating the activation of NF-κB signaling pathways, ROS production, and M1/M2 polarization.
-
Figure 6—source data 1
Uncropped and labelled gels for Figure 6E, F.
- https://cdn.elifesciences.org/articles/95285/elife-95285-fig6-data1-v1.zip
-
Figure 6—source data 2
Raw unedited gels for Figure 6E, F.
- https://cdn.elifesciences.org/articles/95285/elife-95285-fig6-data2-v1.zip
Author response image 1

Author response image 2

Tables
Table 1
The effects of PDZ peptide on lipopolysaccharide (LPS)-induced damage markers in plasma.
Five days after LPS administration (10 mg/kg/30 μL) into the peritoneum of mice that were injected with either the wild-type (WT) PDZ peptide or the mutant PDZ peptide (mPDZ peptide; 7.5 mg/kg/30 μL, i.v.) 4 hr previously. The blood samples were centrifuged, and the plasma was harvested. The ALT, AST, BUN, and creatinine levels were analyzed (n=5).
| Plasma maker | Control | LPS only | LPS+WT PDZ | LPS+mut PDZ |
|---|---|---|---|---|
| ALT (U/L) | 8.286±2.456 | 11.785±4.167 | 8.024±0.24 | 6.16±1.917 |
| AST (U/L) | 54.555±14.702 | 82.306±20.569 | 62.176±14.275 | 65.445±16.042 |
| BUN (mg/dl) | 5.716±1.646 | 7.742±2.317 | 9.120±0.215 | 11.996±1.51 |
| Creatinine (mg/dl) | 0.172±0.095 | 0.472±0.065 | 0.214±0.048 | 0.434±0.078 |
Additional files
Download links
A two-part list of links to download the article, or parts of the article, in various formats.
Downloads (link to download the article as PDF)
Open citations (links to open the citations from this article in various online reference manager services)
Cite this article (links to download the citations from this article in formats compatible with various reference manager tools)
LPS-induced systemic inflammation is suppressed by the PDZ motif peptide of ZO-1 via regulation of macrophage M1/M2 polarization
eLife 13:RP95285.
https://doi.org/10.7554/eLife.95285.4


