Secreted antigen A peptidoglycan hydrolase is essential for Enterococcus faecium cell separation and priming of immune checkpoint inhibitor therapy
- Department of Immunology and Microbiology, Scripps Research, United States
- Department of Integrative Structural & Computational Biology, Scripps Research, United States
- Department of Chemistry, Scripps Research, United States
Figures
Figure 1 with 2 supplements
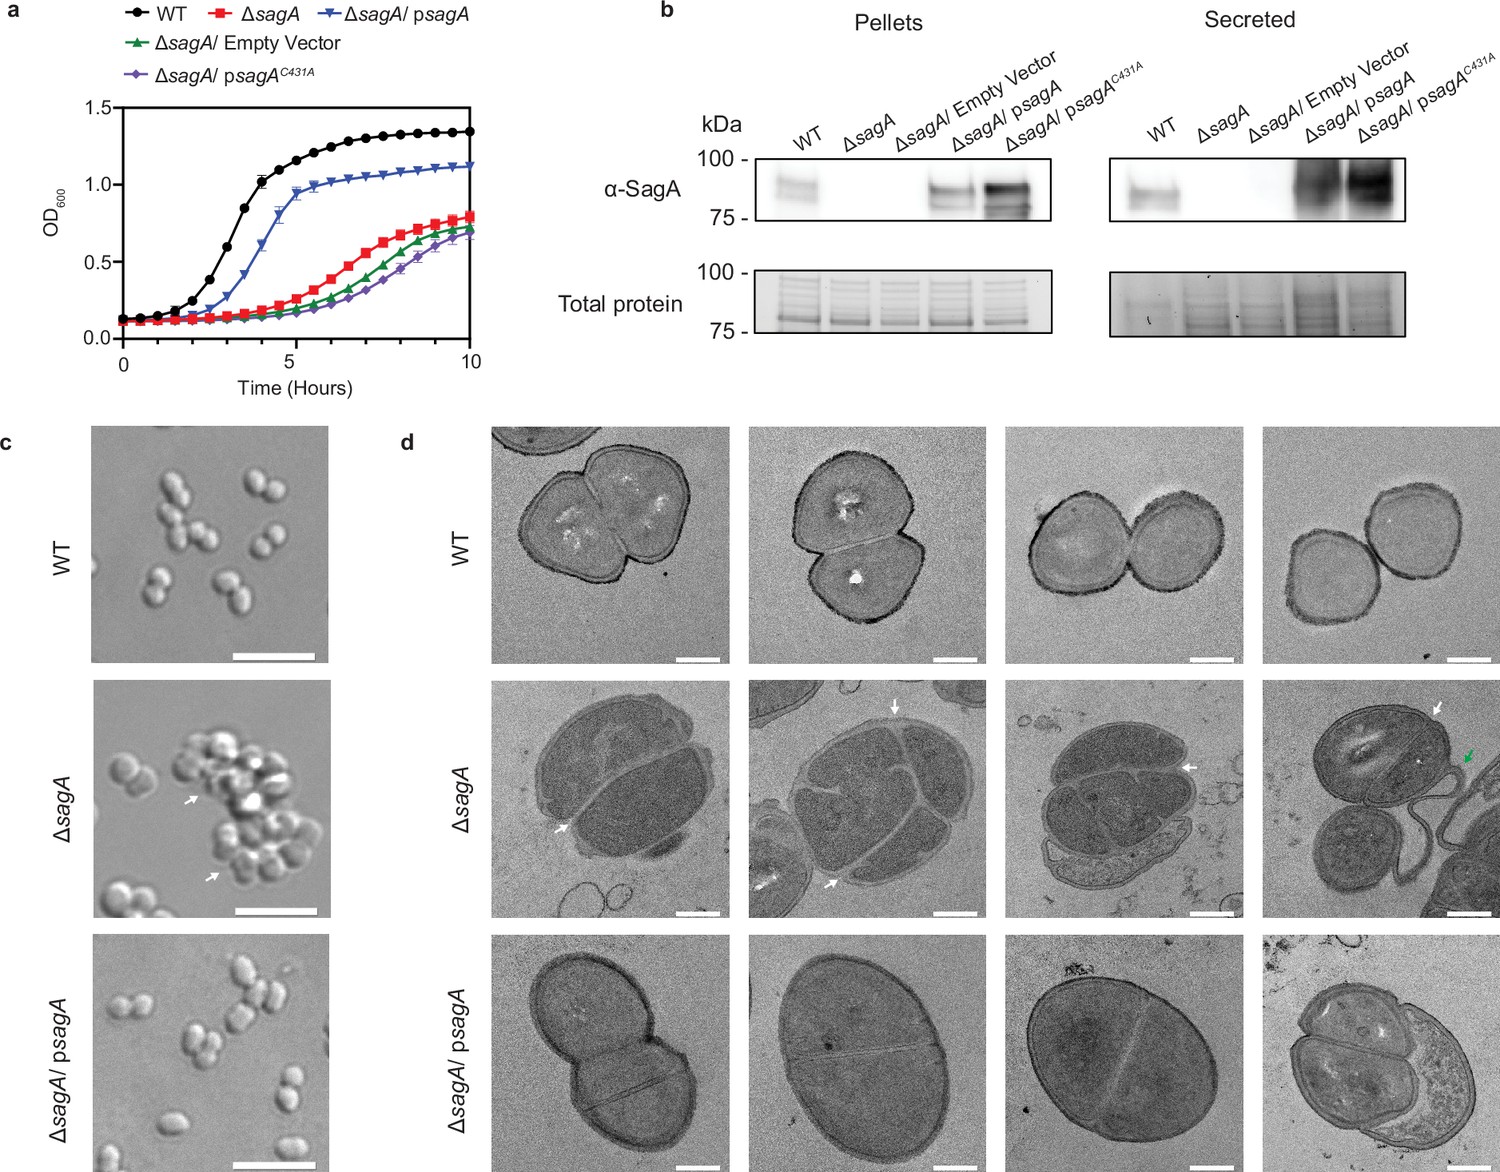
Growth and morphology phenotypes of wild-type, ΔsagA, and psagA complemented E. faecium Com15 strains.
(a) Growth curves of E. faecium WT, ΔsagA, and complementation strains with functional and nonfunctional sagA genes (n=3). Data are presented as mean value ± standard deviation. (b) ɑ-SagA western blot of E. faecium WT, ΔsagA, and complementation strains with functional and nonfunctional sagA genes, on both whole cell lysate (pellets) and total secreted proteins (secreted). Bottom panel shows total protein loading visualized by Stain-free imaging and serves as protein loading control. (c) Differential interference contrast (DIC) microscopy of E. faecium WT, ΔsagA, and ΔsagA/psagA complemented strains. White arrows point to cell clusters. Scale bar = 5 µm. (d) Transmission electron microscopy (TEM) of E. faecium WT, ΔsagA, and ΔsagA/psagA complemented strains. White arrows point to failed cell separation in ΔsagA. Green arrow points to undegraded peptidoglycan in ΔsagA. Scale bar = 0.2 µm.
-
Figure 1—source data 1
Excel file containing numeric data used to generate Figure 1a.
- https://cdn.elifesciences.org/articles/95297/elife-95297-fig1-data1-v1.xlsx
-
Figure 1—source data 2
Uncropped western blots and gels (total protein) used to generate Figure 1b.
- https://cdn.elifesciences.org/articles/95297/elife-95297-fig1-data2-v1.zip
-
Figure 1—source data 3
Uncropped images used to generate Figure 1c.
- https://cdn.elifesciences.org/articles/95297/elife-95297-fig1-data3-v1.zip
-
Figure 1—source data 4
Uncropped images used to generate Figure 1d.
- https://cdn.elifesciences.org/articles/95297/elife-95297-fig1-data4-v1.zip
-
Figure 1—source data 5
Validation of sagA deletion and image of bacterial strain growth.
Uncropped images used to generate Figure 1d.
- https://cdn.elifesciences.org/articles/95297/elife-95297-fig1-data5-v1.zip
Figure 1—figure supplement 1

Analysis of E.faecium ΔsagA deletion and complementation studies.
(a) PCR validation of ΔsagA deletion. (b) ΔsagA cells are sedimented at the bottom of the tube compared to E. faecium wild-type (WT) and ΔsagA / psagA.
-
Figure 1—figure supplement 1—source data 1
Uncropped gel used to generate Figure 1—figure supplement 1a and uncropped photo used to generate Figure 1—figure supplement 1b.
- https://cdn.elifesciences.org/articles/95297/elife-95297-fig1-figsupp1-data1-v1.xlsx
Figure 1—figure supplement 2
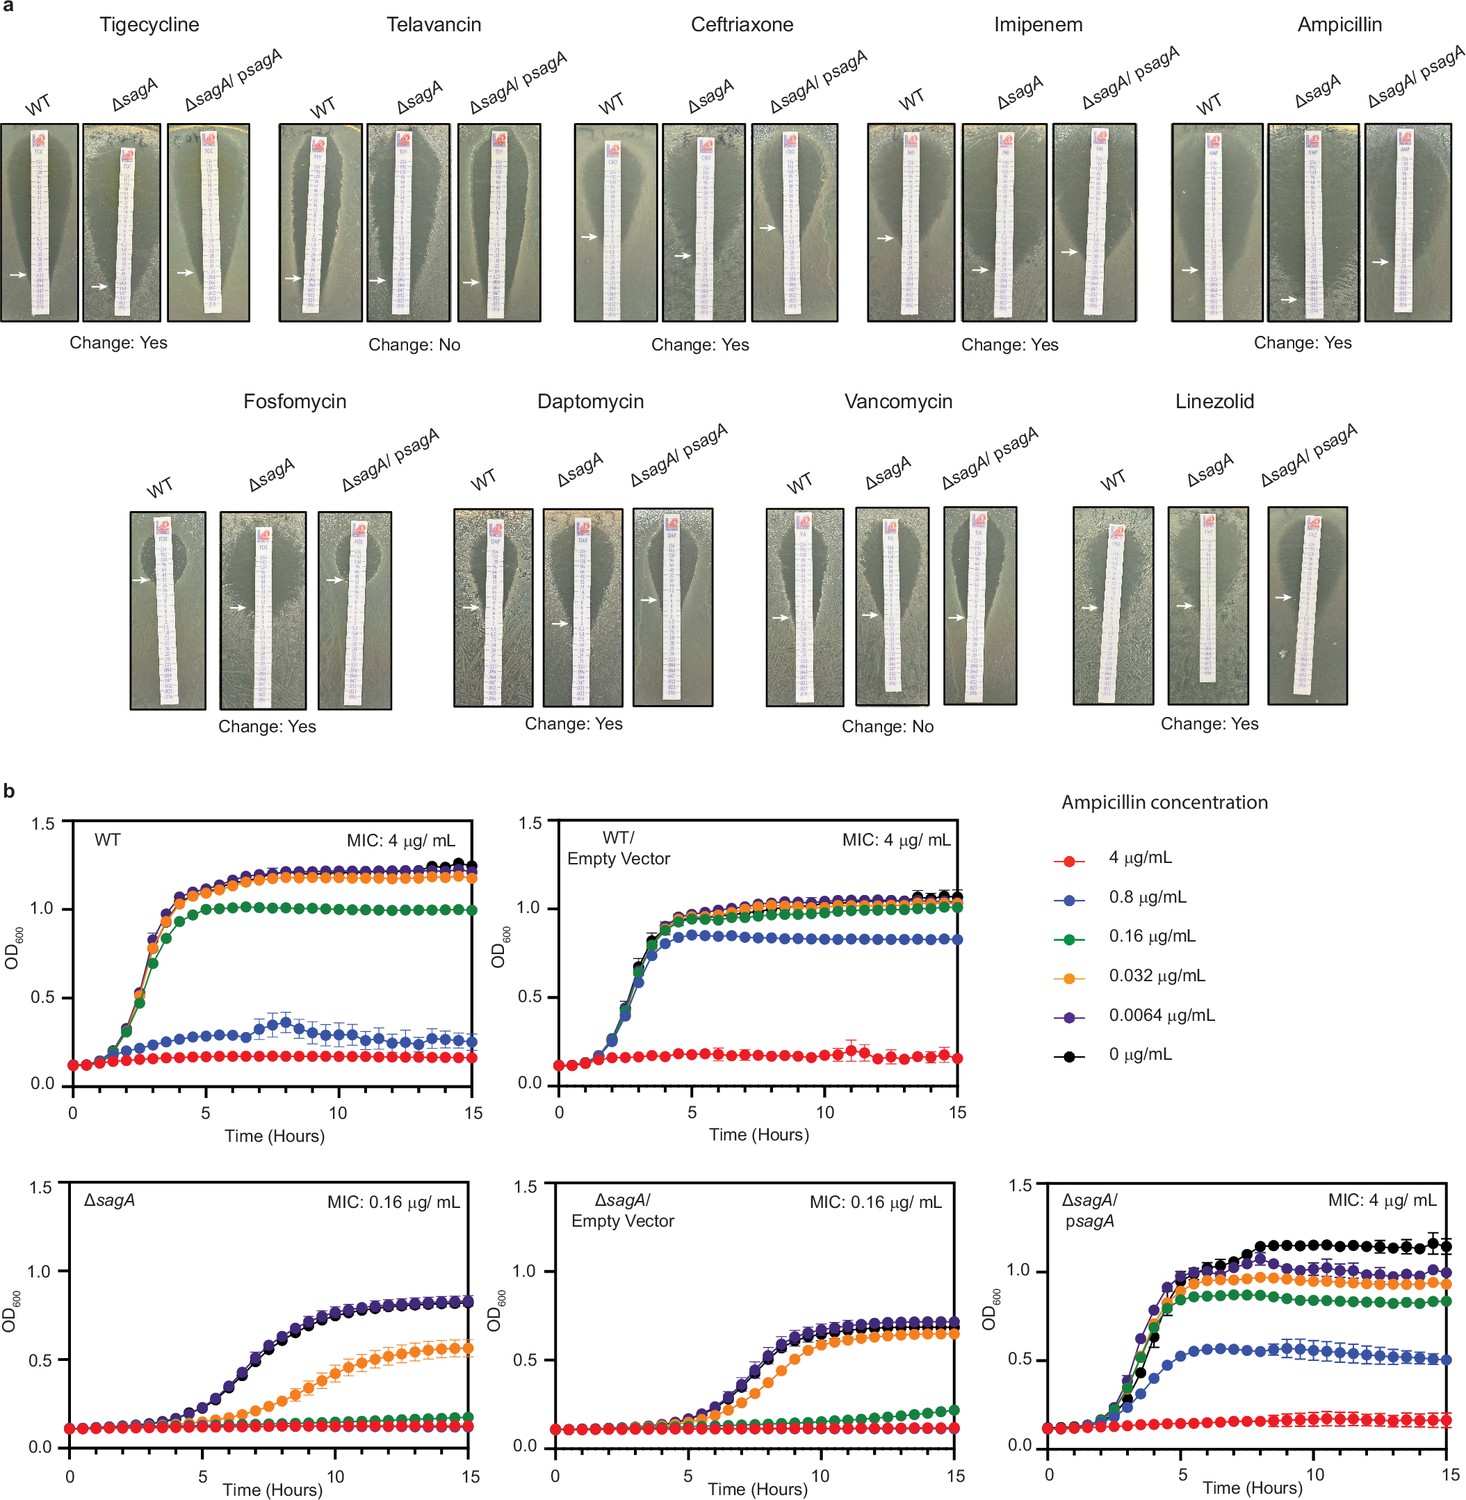
Antibiotic sensitivity of ΔsagA.
(a) Approximate minimum inhibitory concentration (MIC) determinations via antibiotic test strips for E. faecium wild-type (WT), ΔsagA and ΔsagA/ psagA. White arrows point to MIC values (summary of MIC determination is in Figure 1—figure supplement 2—source data 2). (b) Liquid culture MIC determination for ampicillin. Growth curves of E. faecium WT, ΔsagA, and ΔsagA/ psagA in the presence of serially diluted ampicillin (n=3). Data are presented as mean value ± standard deviation. MIC is defined as minimum tested concentration at which no bacterial growth is observed.
-
Figure 1—figure supplement 2—source data 1
Uncropped images used to generate Figure 1—figure supplement 2a.
- https://cdn.elifesciences.org/articles/95297/elife-95297-fig1-figsupp2-data1-v1.xlsx
-
Figure 1—figure supplement 2—source data 2
Excel file containing numeric data used to generate Figure 1—figure supplement 2b.
- https://cdn.elifesciences.org/articles/95297/elife-95297-fig1-figsupp2-data2-v1.zip
Figure 2 with 2 supplements
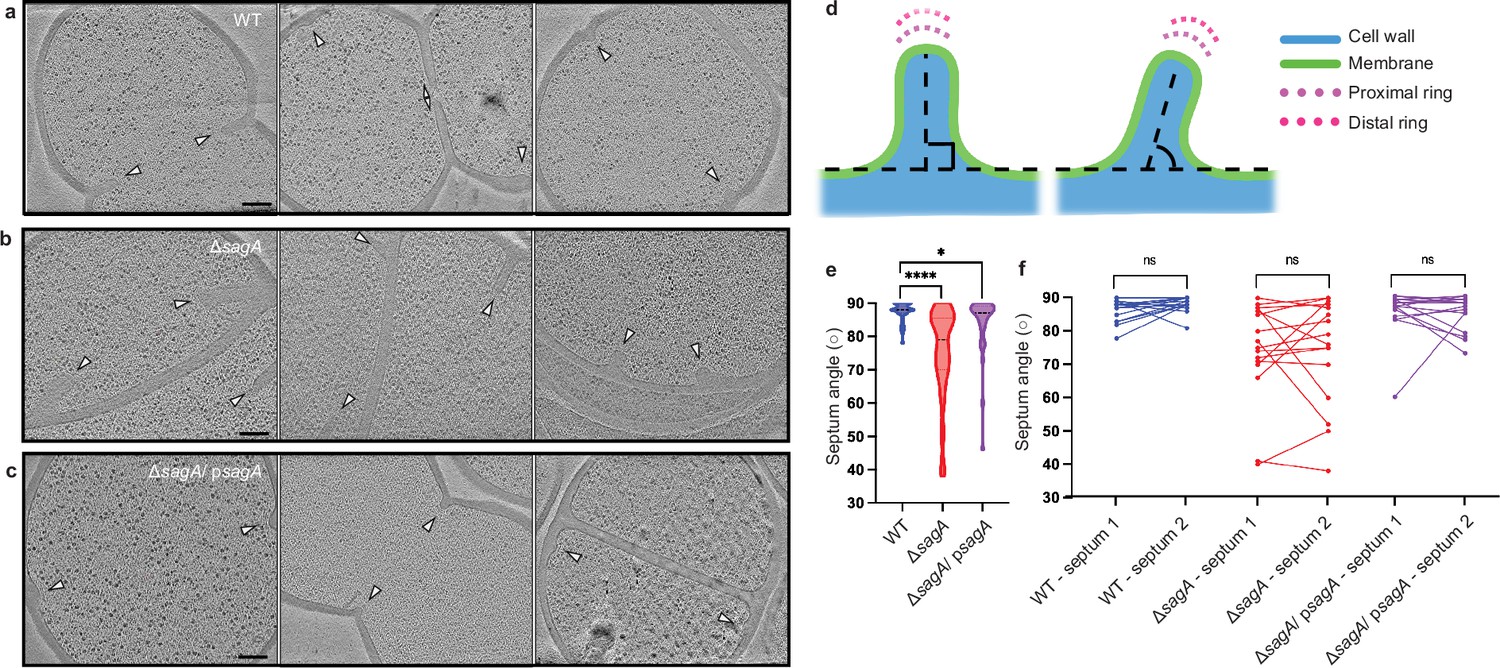
Deletion of sagA changes the angle of growing septum.
(a-c) Representative tomographic slices (n=3) of E. faecium strains: E. faecium wild-type (WT) (a), ΔsagA (b), and ΔsagA/psagA (c). Cell division septa are indicated by white arrows. Scale bar = 100 nm. (d) A diagram indicating how septum angle measurements were collected. Acute angles are recorded for further analysis. (e) Comparison of septum angle. The violin plot displays the distribution of septum angle, with E. faecium WT (n=40) shown in blue, ΔsagA (n=49) shown in red, and ΔsagA/psagA (n=37) shown in magenta. Black dotted lines represent median (E. faecium WT: 88°, ΔsagA: 79°, ΔsagA/ psagA: 87°) while the colored dotted lines represent quartiles. Welch’s t-test was used to calculate statistical significance. *p< 0.05; ****p< 0.0001. (f), Pairwise comparison of septum angle in opposing septa. The paired plot displays the distribution of septum angle, with E. faecium WT (n=18) shown in blue, ΔsagA (n=16) shown in red, and ΔsagA/ psagA (n=16) shown in magenta. Two septum angles from opposing septa are linked with straight lines. Paired t-test was used to calculate statistical significance. ns, p≥0.05.
-
Figure 2—source data 1
Excel file containing numeric data to generate Figure 2e–f.
- https://cdn.elifesciences.org/articles/95297/elife-95297-fig2-data1-v1.xlsx
Figure 2—figure supplement 1
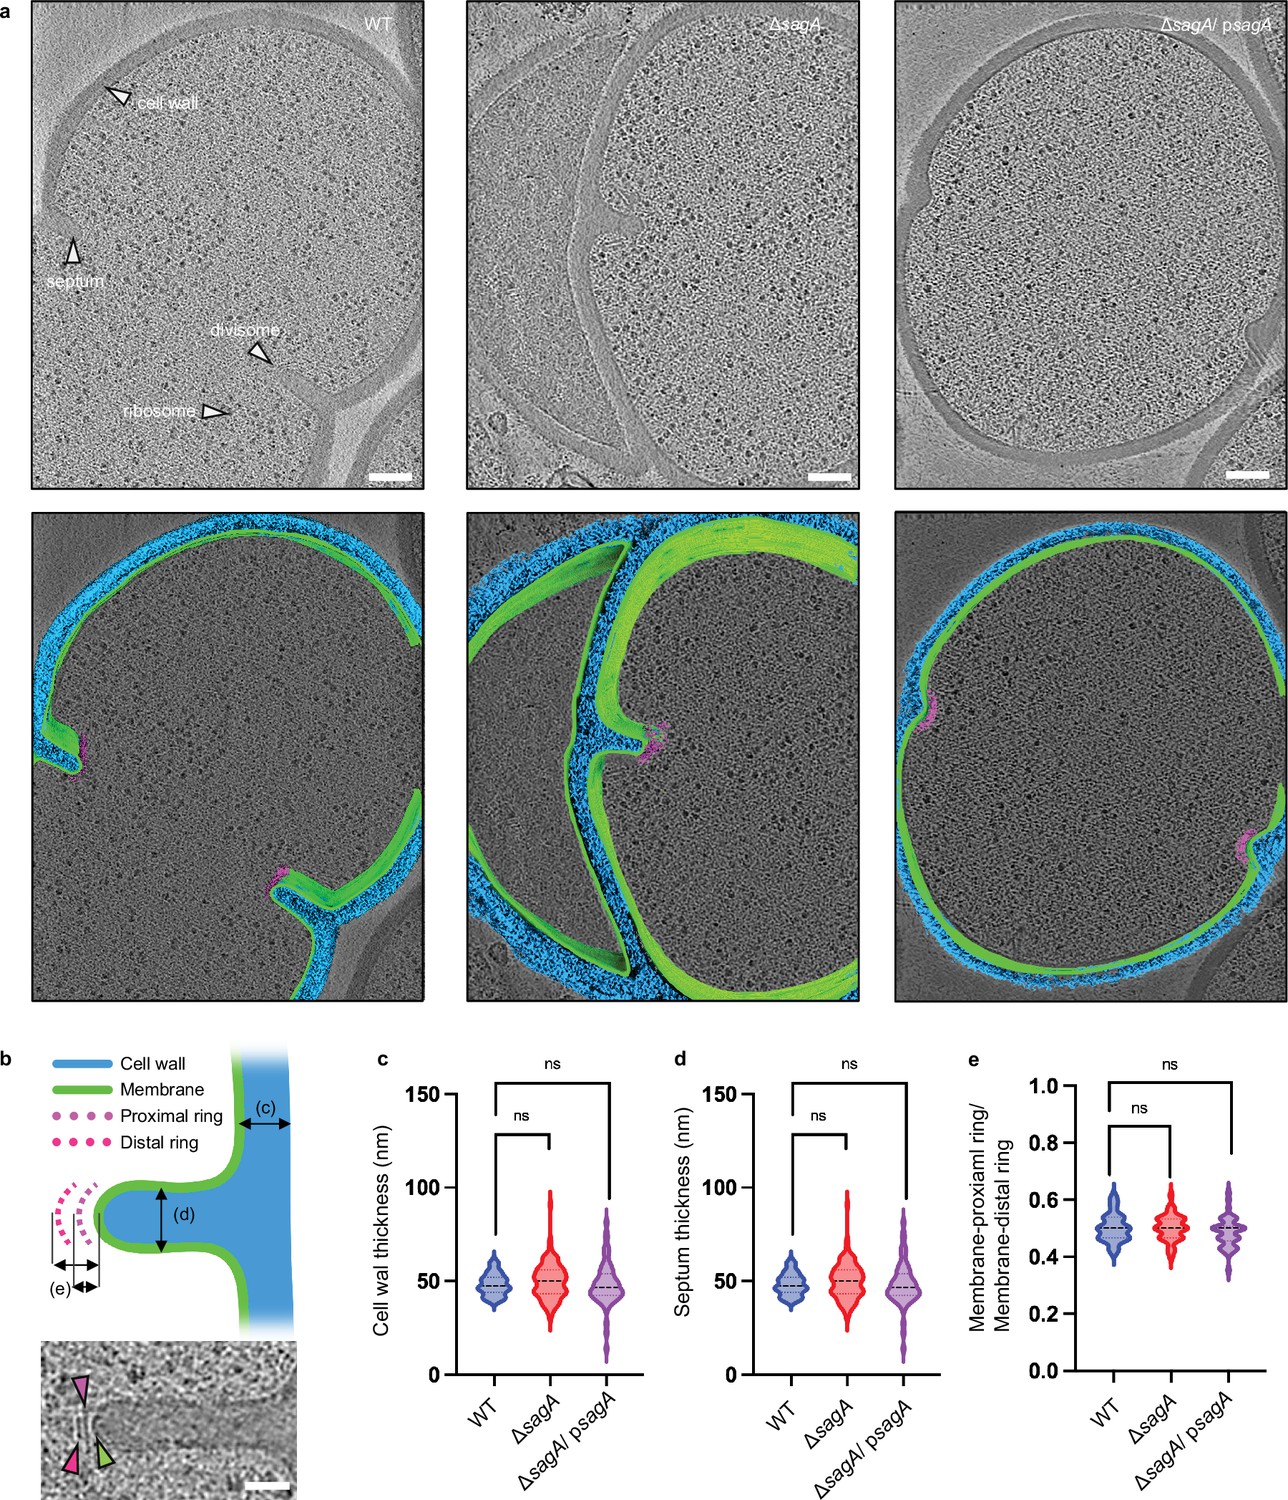
E.faecium ΔsagA exhibits no defects in cell wall and septum thickness.
(a) Representative cryo-electron tomography (cryo-ET) images of E. faecium wild-type (WT), ΔsagA, and ΔsagA/psagA are shown in the top row. The cell wall, septum, divisome, and ribosome are indicated by white arrows. 3D segmentations are shown in the bottom row. The cell wall is annotated in blue, the membrane in green, and the divisome in magenta. Scale bar = 100 nm. (b) The upper panel shows a diagram illustrating how measurements are collected. In the lower panel, a representative cryo-ET image of the septum is shown. Scale bar = 50 nm. (c), Comparison of cell wall thickness. The violin plot displays the distribution of cell wall thickness, with E. faecium WT (n=66) shown in blue, ΔsagA (n=96) shown in red, and ΔsagA/psagA (n=69) shown in magenta. Black dotted lines represent median (E. faecium WT: 47.48 nm, ΔsagA: 50.11 nm, ΔsagA/ psagA: 46.42 nm) while the colored dotted lines represent quartiles. Welch’s t-est was used to calculate statistical significance. ns, p≥ 0.05. (d) Comparison of septum thickness. The violin plot displays the distribution of septum thickness, with E. faecium WT (n=26) shown in blue, ΔsagA (n=62) shown in red, and ΔsagA/psagA (n=16) shown in magenta. Black dotted lines represent median (E. faecium WT: 54.33 nm, ΔsagA: 54.86 nm, ΔsagA/psagA: 57.50 nm) while the colored dotted lines represent quartiles. Welch’s t-test was used to calculate statistical significance. ns, p≥ 0.05. (e) Comparison of divisome architecture. To assess potential alterations in the divisome architecture, the distance between the apical end of the septum and the membrane-proximal ring was divided by the distance between the apical end of the septum and the membrane-distal ring. The violin plot displays the distribution of the ratios, with E. faecium WT (n=31) shown in blue, ΔsagA (n=40) shown in red, and ΔsagA/psagA (n=42) shown in magenta. Black dotted lines represent median (E. faecium WT: 0.5, ΔsagA: 0.5, ΔsagA/psagA: 0.5) while the colored dotted lines represent quartiles. Welch’s t-test was used to calculate statistical significance. ns, p≥0.05.
-
Figure 2—figure supplement 1—source data 1
Excel file containing numeric data to generate Figure 2—figure supplement 1c–e.
- https://cdn.elifesciences.org/articles/95297/elife-95297-fig2-figsupp1-data1-v1.xlsx
Figure 2—figure supplement 2
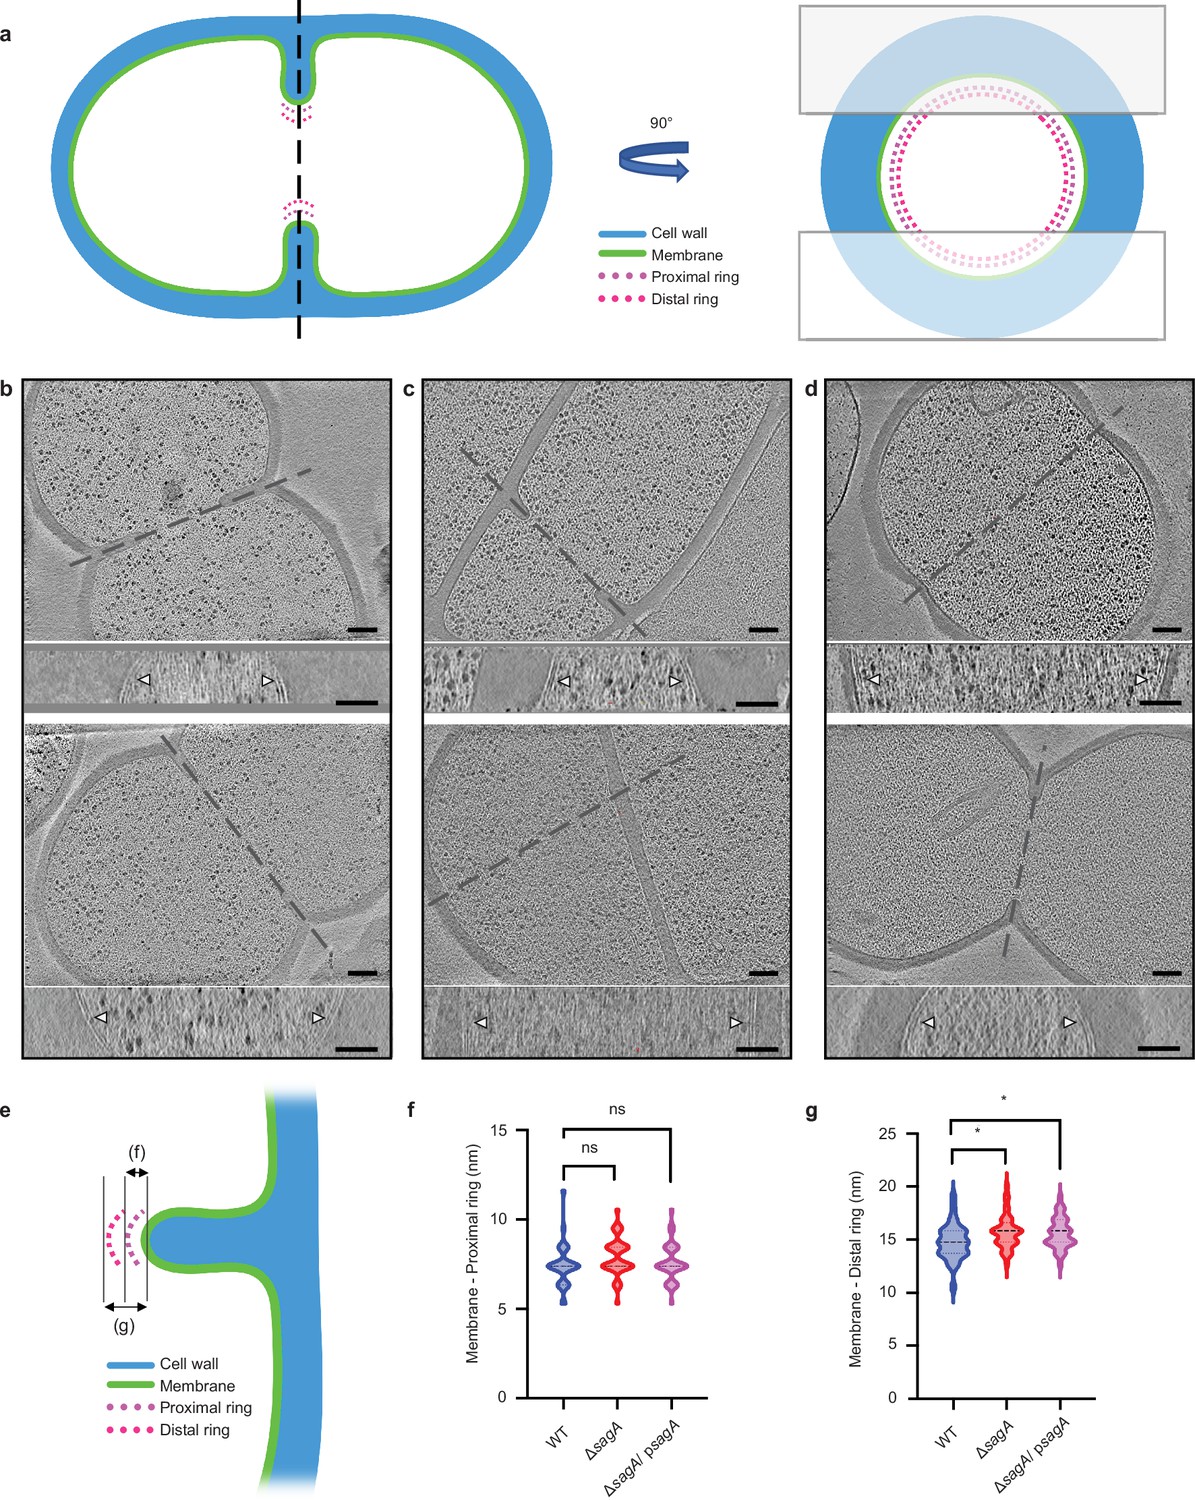
Deletion of sagA alters the position of cell division.
(a) Cartoon model depicting cell division site in the xy coordinate plane (left) and xz coordinate plane (right). The two boxes shown in right represent the cryo-focused ion beam (cryo-FIB) milling patterns used to generate thin sections of E. faecium for subsequent cryo-electron tomography (cryo-ET) imaging. (b–d) Representative tomographic slices (n=2) of E. faecium strains: E. faecium wild-type (WT) (b), ΔsagA (c), and ΔsagA/ psagA. (d). The upper panels show the view of dividing cells in the xy coordinate plane and, while the corresponding bottom panels show the divisome complex (annotated with white arrows) at the highlighted areas in the corresponding upper panels in the xz coordinate plane, obtained by rotating the cell 90° along the highlighted axis. Scale bar = 100 nm. (e) A diagram indicating how measurements were collected. (f) Comparison of membrane to proximal ring distance. The violin plot displays the distribution of distance between the apical end of septum membrane to the proximal ring, with E. faecium WT (n=31) shown in blue, ΔsagA (n=40) shown in red, and ΔsagA/psagA (n=42) shown in magenta. Black dotted lines represent median (E. faecium WT: 7.39 nm, ΔsagA: 7.39 nm, ΔsagA/psagA: 7.39 nm) while the colored dotted lines represent quartiles. Welch’s t-est was used to calculate statistical significance. ns, p≥0.05. (g) Comparison of membrane to distal ring distance. The violin plot displays the distribution of distance between the apical end of septum membrane to the distal ring, with E. faecium WT (n=31) shown in blue, ΔsagA (n=40) shown in red, and ΔsagA/psagA (n=42) shown in magenta. Black dotted lines represent median (E. faecium WT: 14.77 nm, ΔsagA: 15.83 nm, ΔsagA/psagA: 15.83 nm) while the colored dotted lines represent quartiles. Welch’s t-test was used to calculate statistical significance. *p< 0.05.
-
Figure 2—figure supplement 2—source data 1
Excel file containing numeric data used to generate Figure 2—figure supplement 2f–g.
- https://cdn.elifesciences.org/articles/95297/elife-95297-fig2-figsupp2-data1-v1.xlsx
Figure 3 with 1 supplement
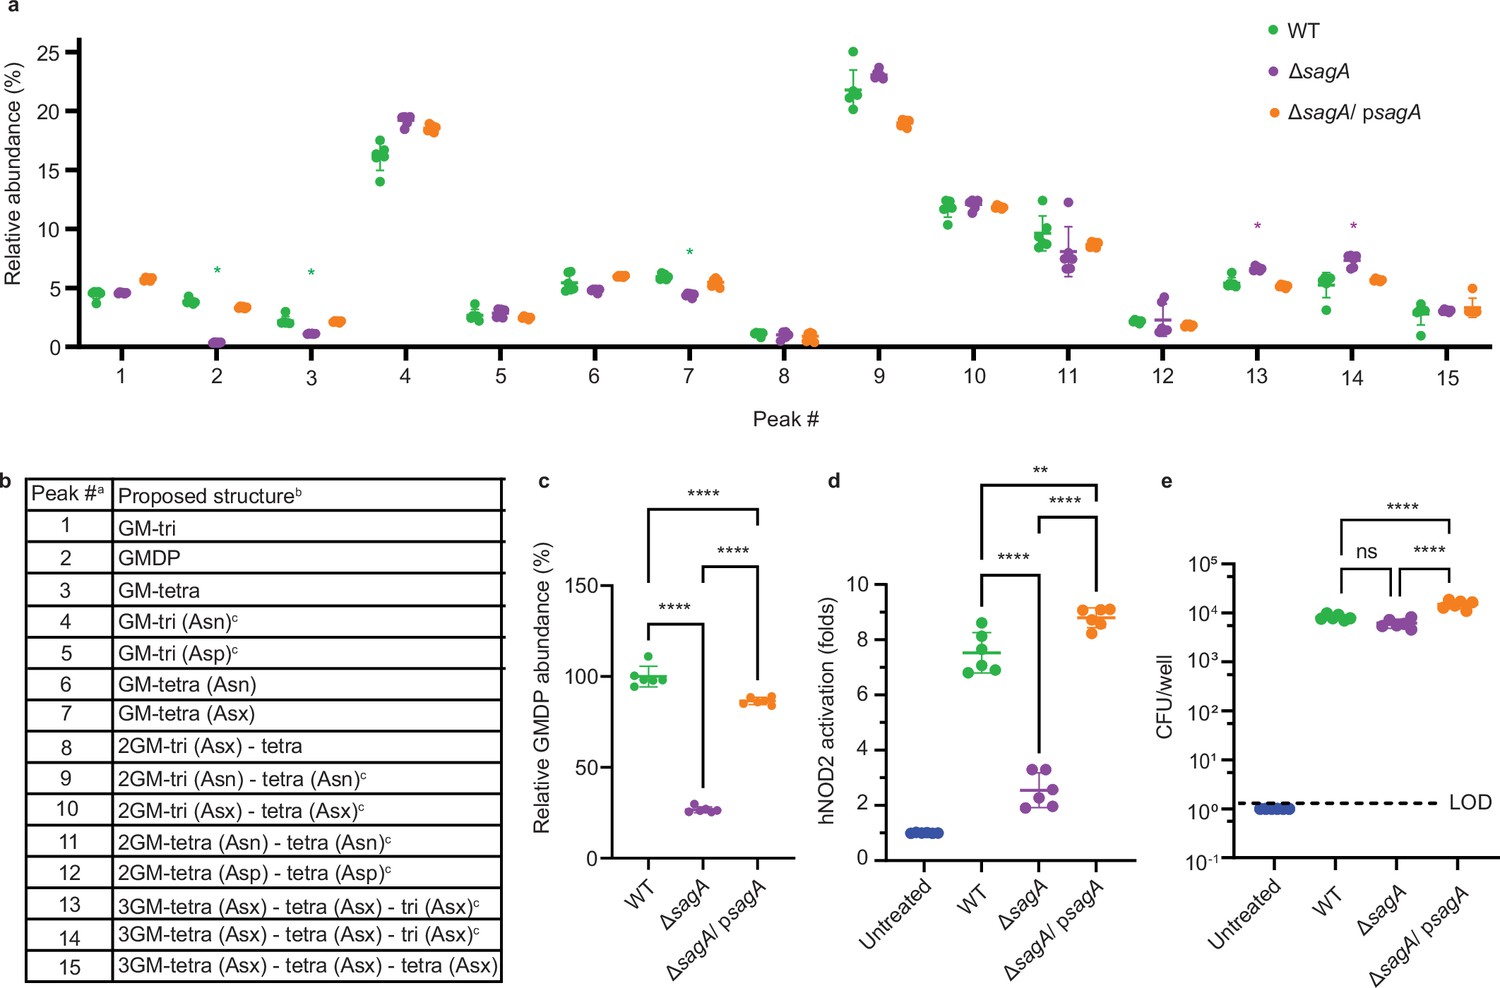
Peptidoglycan profile and NOD2 activation of E.faecium ΔsagA.
(a) Relative abundance of muropeptides isolated from mutanolysin-digested sacculi of E. faecium strains and analyzed by LC-MS (n=6). Green asterisks highlight changes in abundance of small muropeptides, purple asterisks highlight changes in abundance of crosslinked peptidoglycan fragments. Numbers correspond to different muropeptides from LC-MS analysis listed in legend. (b) Composition of muropeptides from E. faecium sacculi. a Peak numbers refer to (a). b GM, disaccharide (GlcNAc-MurNAc); 2 GM, disaccharide-disaccharide (GlcNAc-MurNAc-GlcNAc-MurNAc); 3 GM, disaccharide-disaccharide-disaccharide (GlcNAc-MurNAc-GlcNAc-MurNAc-GlcNAc-MurNAc); GM-Tri, disaccharide tripeptide (L-Ala-D-iGln-L-Lys); GM-Tetra, disaccharide tetrapeptide (L-Ala-D-iGln-L-Lys-D-Ala); GM-Penta, disaccharide pentapeptide (L-Ala-D-iGln-L-Lys-D-Ala -D-Ala). c The assignment of the amide and the hydroxyl functions to either peptide stem is arbitrary. (c) Relative abundance of GMDP relative to wild-type (WT) from LC-MS chromatograms (n=6). (d), NF-κB responses of HEK-Blue hNOD2 cells to live E. faecium strains (MOI = 1, n=6). NOD2 activation is expressed as fold change relative to untreated control. (e) Colony forming units (CFU) of E. faecium strains (MOI = 1) internalized in HEK-Blue hNOD2 cells (n=6). Dashed line indicates Limit of Detection (LOD). Data for (a, c–e) represent mean value ± standard deviation and analyzed with one-way ANOVA and Tukey’s multiple comparison post hoc test. *p≤0.05; **p≤0.01; ***p≤0.005; ****p≤0.001; ns, not significant.
-
Figure 3—source data 1
Excel file containing numeric data used to generate Figure 3a and c–e.
- https://cdn.elifesciences.org/articles/95297/elife-95297-fig3-data1-v1.xlsx
Figure 3—figure supplement 1
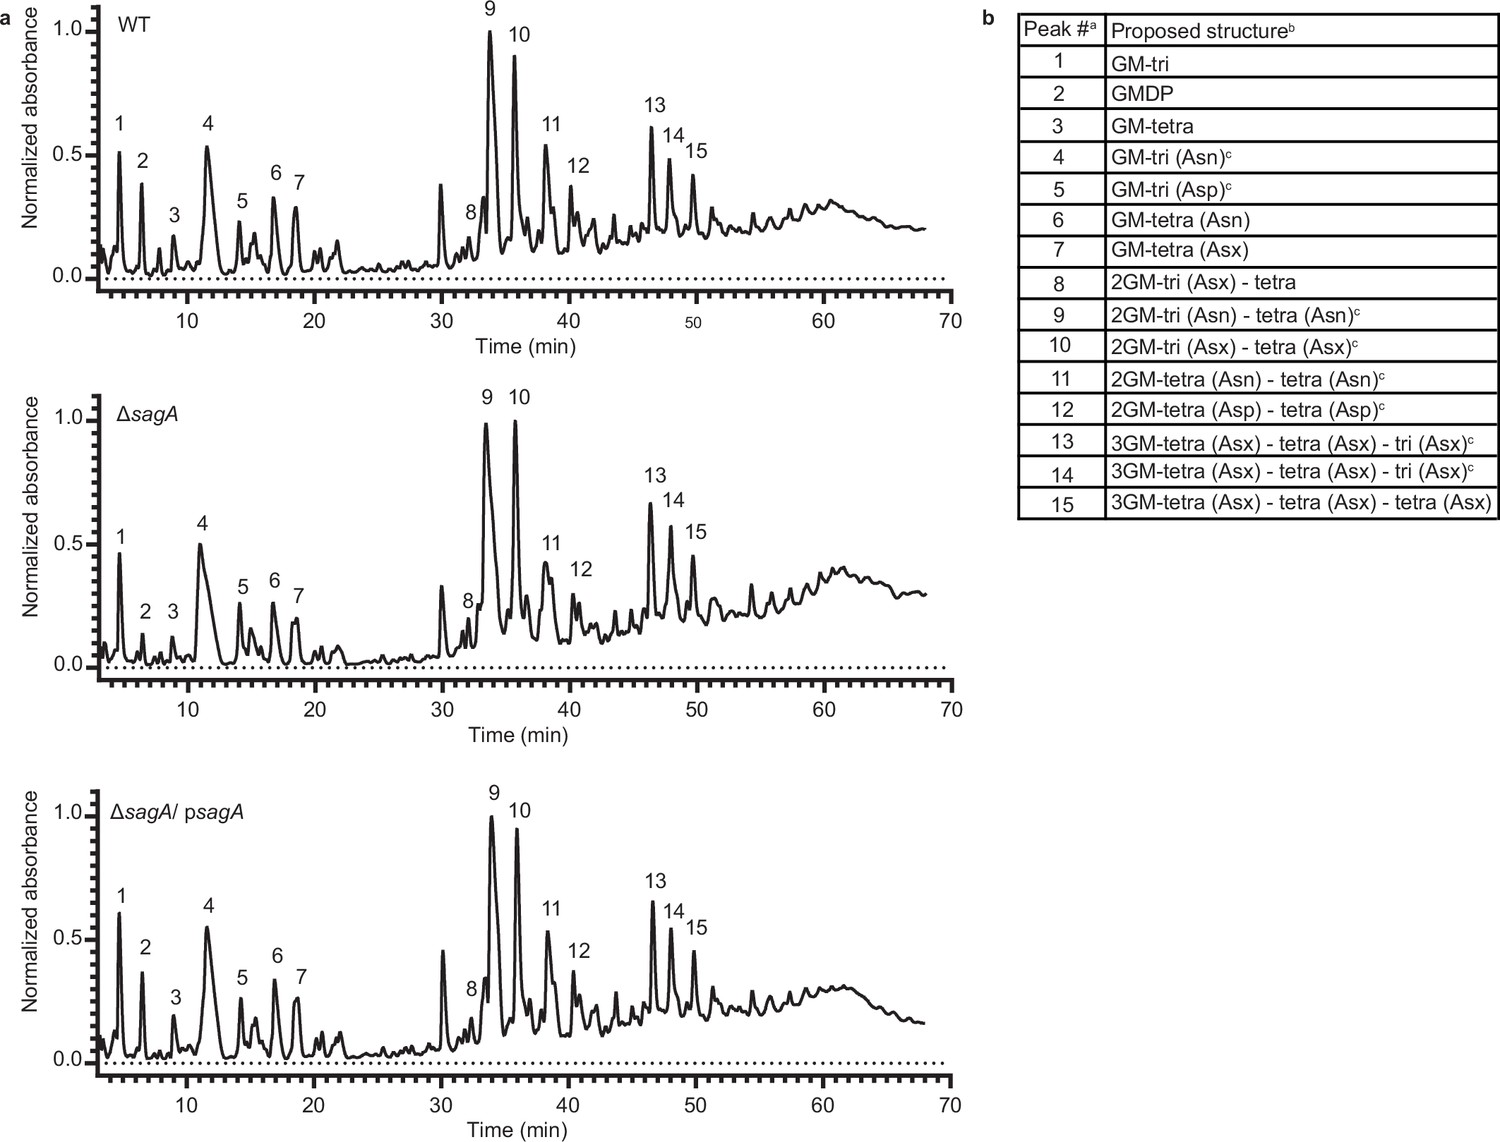
Peptidoglycan profile of E. faecium ΔsagA by LC-MS.
(a) Representative LC-MS chromatograms of mutanolysin-digested peptidoglycan isolated from sacculi of E. faecium wild-type (W)T (top), ΔsagA (middle), and ΔsagA/ psagA (bottom). Numbers correspond to each muropeptide annotated in the table (b) b Composition of mutanolysin-digested peptidoglycan isolated from E. faecium sacculi. a Peak numbers refer to (a). b GM, disaccharide (GlcNAc-MurNAc); 2 GM, disaccharide-disaccharide (GlcNAc-MurNAc-GlcNAc-MurNAc); 3 GM, disaccharide-disaccharide-disaccharide (GlcNAc-MurNAc-GlcNAc-MurNAc-GlcNAc-MurNAc); GM-Tri, disaccharide tripeptide (L-Ala-D-iGln-L-Lys); GM-Tetra, disaccharide tetrapeptide (L-Ala-D-iGln-L-Lys-D-Ala); GM-Penta, disaccharide pentapeptide (L-Ala-D-iGln-L-Lys-D-Ala -D-Ala). c The assignment of the amide and the hydroxyl functions to either peptide stem is arbitrary.
-
Figure 3—figure supplement 1—source data 1
Excel file containing numeric data used to generate Figure 3—figure supplement 1a.
- https://cdn.elifesciences.org/articles/95297/elife-95297-fig3-figsupp1-data1-v1.xlsx
Figure 4 with 1 supplement
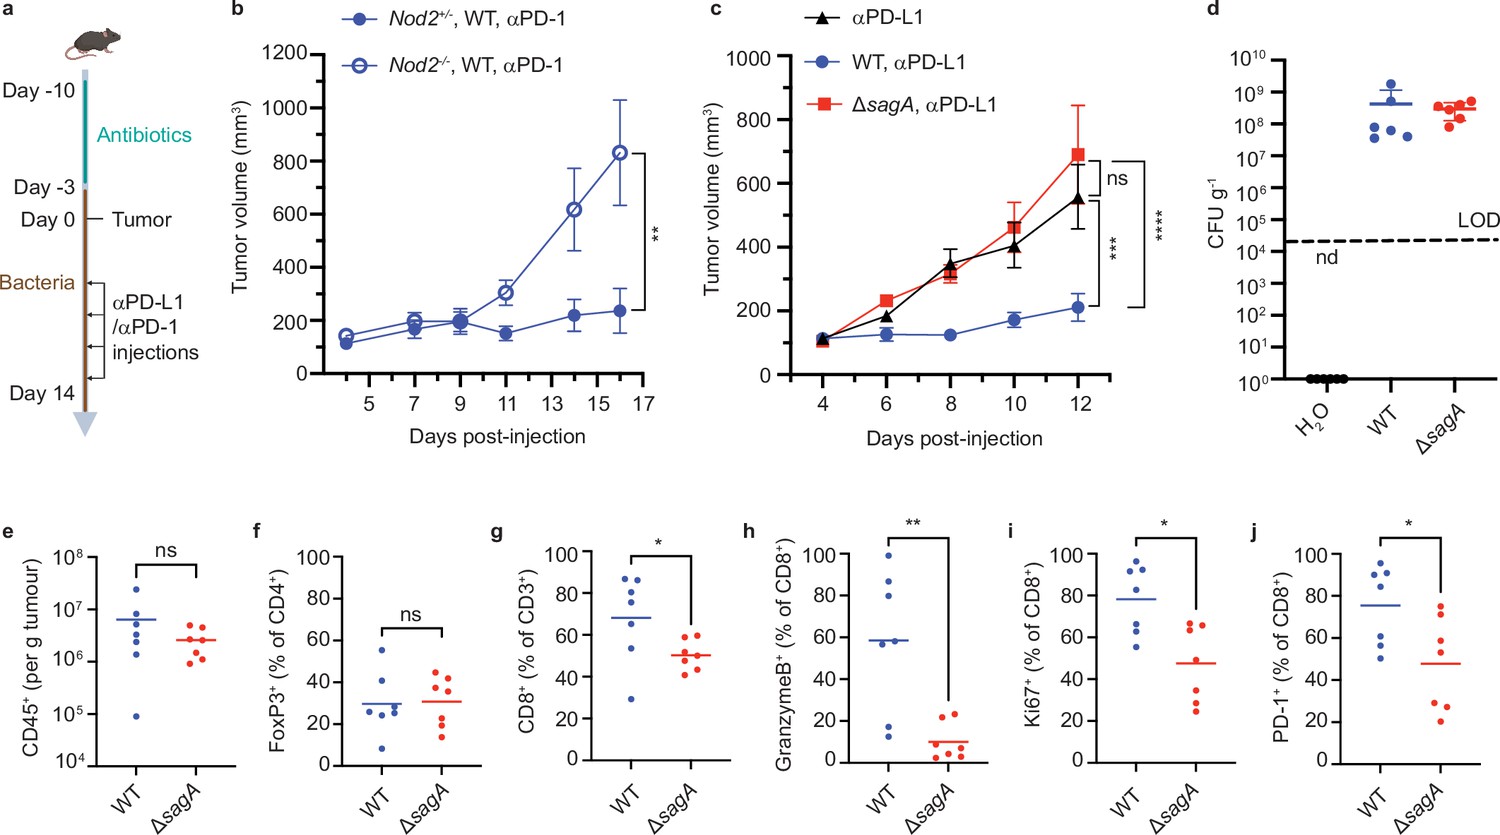
Immune checkpoint inhibitor antitumor activity and tumor immune profile of E.faecium ΔsagA colonized mice.
(a) Schematic of tumor growth experiment: mice were provided water containing antibiotics for one week and started drinking bacteria three days before tumor implantation. Once the tumor reaches ~100 mm3, the measurement starts, and two days after treated with anti-PD-1 (MC38) or anti-PD-L1 (B16F10) every other day. (b) MC-38 tumor growth in Nod2+/- or Nod2-/- mice that were colonized with E. faecium WT and treated with anti-PD-1 starting at day 7. +/-=10 for Nod2+/- +/-, n=6 for Nod2-/- mice. (c) B16F10 tumor growth in C57BL/6 mice that were colonized with E. faecium wild-type (WT) or ΔsagA and treated with anti-PD-L1 starting at day 6. No bacterial colonization group as a control (black). n=7–8 mice per group. (d) Fecal colony forming units (CFU) analysis of E. faecium on HiCrome Enterococcus faecium agar plates from (c) at day 6. n=6 per group. Each dot represents one mouse. The line indicates the limit of detection (LOD, 4000 CFU g–1). Nd, not detected. Data represent means ± 95% confidence interval. (e–j) Quantification of tumor infiltrating CD45+ cells (e), FoxP3+ cells (f), CD3+ CD8+ cells (g), GranzymeB+ CD8+ T cells (h), Ki67+ CD8+ T cells (i), and PD-1+ CD8+ T cells (j). For (f, h-j), fluorescence minus one (FMO) control was used to define gates. n=7 mice per group. Data for (b) and (c) represent mean ± SEM and were analyzed using a mixed effects model with Tukey’s multiple comparisons post hoc test. Data for (e–j) represent mean ± SEM and were analyzed by the Mann-Whitney U (one-tail) test. *p<0.05, **p<0.01, ***p<0.001, ****p<0.0001; ns, not significant.
-
Figure 4—source data 1
Excel file containing numeric data used to generate Figure 4b–j.
- https://cdn.elifesciences.org/articles/95297/elife-95297-fig4-data1-v1.xlsx
Figure 4—figure supplement 1
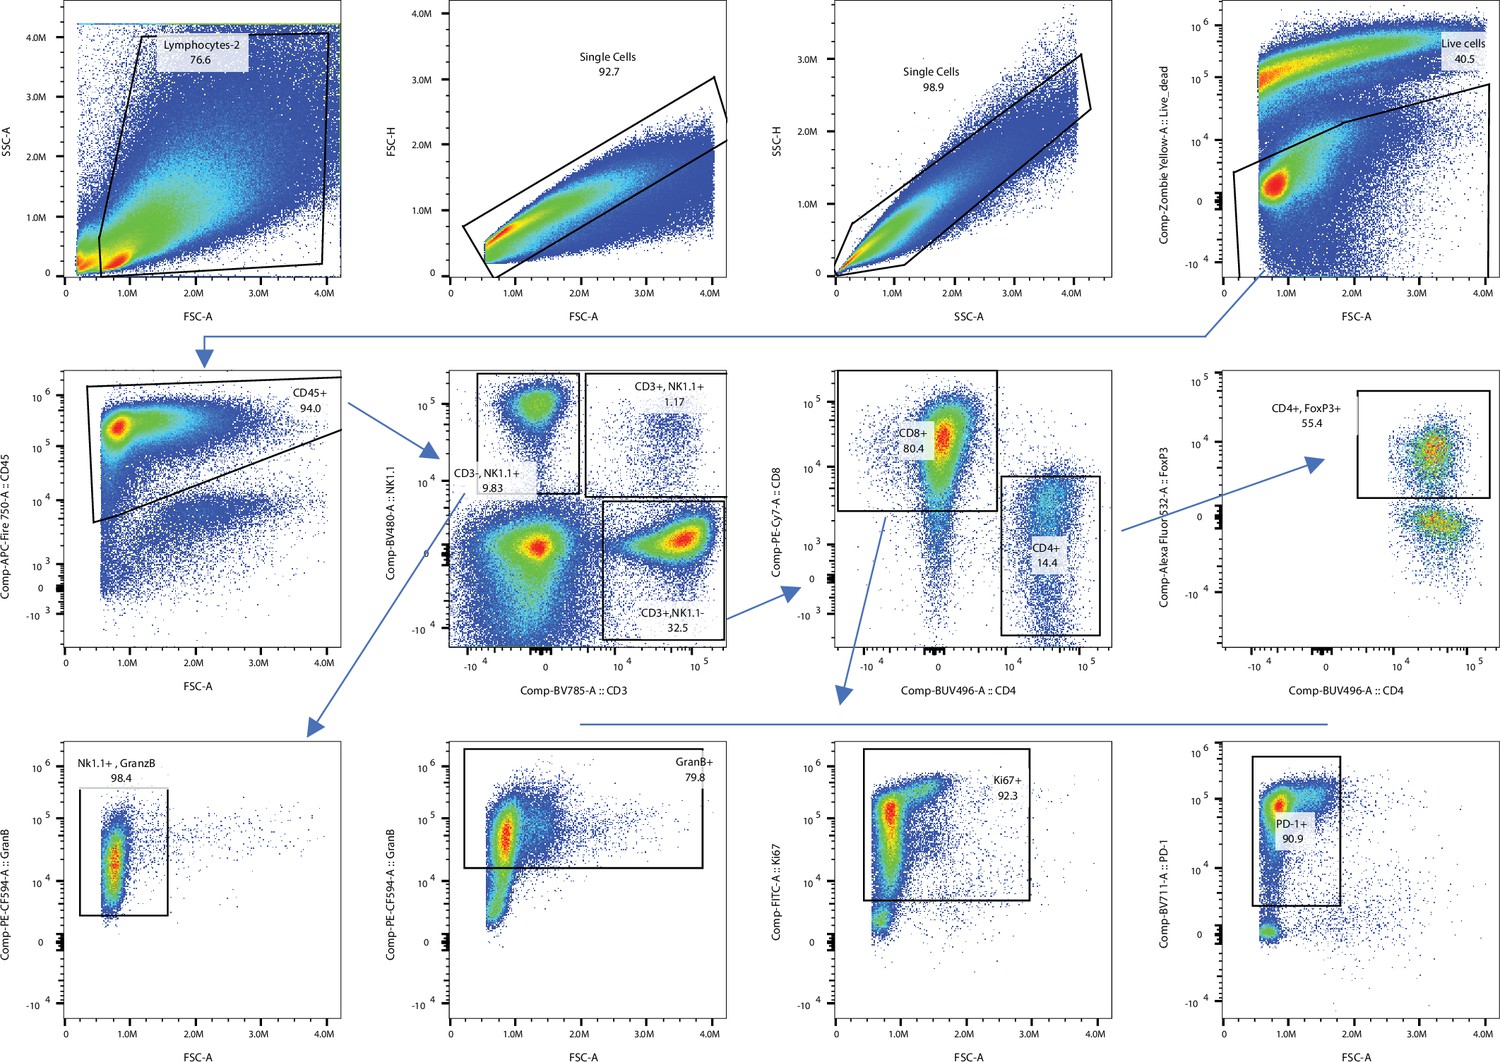
Gating strategy used for flow cytometry analysis of tumor infiltrating lymphocytes (TILs).
We first identified total tumor infiltrating cells by forward and side scatter gating. We then selected single cells using forward scatter area (FSC-A) versus forward scatter height (FSC-H) parameters and side scatter area (SSC-A) versus side scatter height (SSC-H) parameters, respectively. From the single-cell population, we selected live cells by gating on LIVE/DEAD dye events. Then, we selected total leukocytes from live cells, using the pan-leukocyte marker CD45. From the total leukocytes, we identified T cells and NK cells using the pan-T cell marker CD3 and the NK cell marker NK1.1. We then split T cells (CD3+ NK1.1-) into CD4+ and CD8+ populations using CD4 and CD8 expression. From the total CD8+ T cells, we further gated GranzymeB+CD8+ cytotoxic T cells, Ki67+CD8+ T cells, and PD-1+CD8+ T cells. From the total CD4+ T cells, FoxP3+ CD4+ T cells were identified as regulatory T cells. We also gated the GranzymeB+ NK cells from NK (CD3- NK1.1+) cells.
-
Figure 4—figure supplement 1—source data 1
Excel file containing numeric data used to generate Figure 4—figure supplement 1.
- https://cdn.elifesciences.org/articles/95297/elife-95297-fig4-figsupp1-data1-v1.xlsx
Figure 5
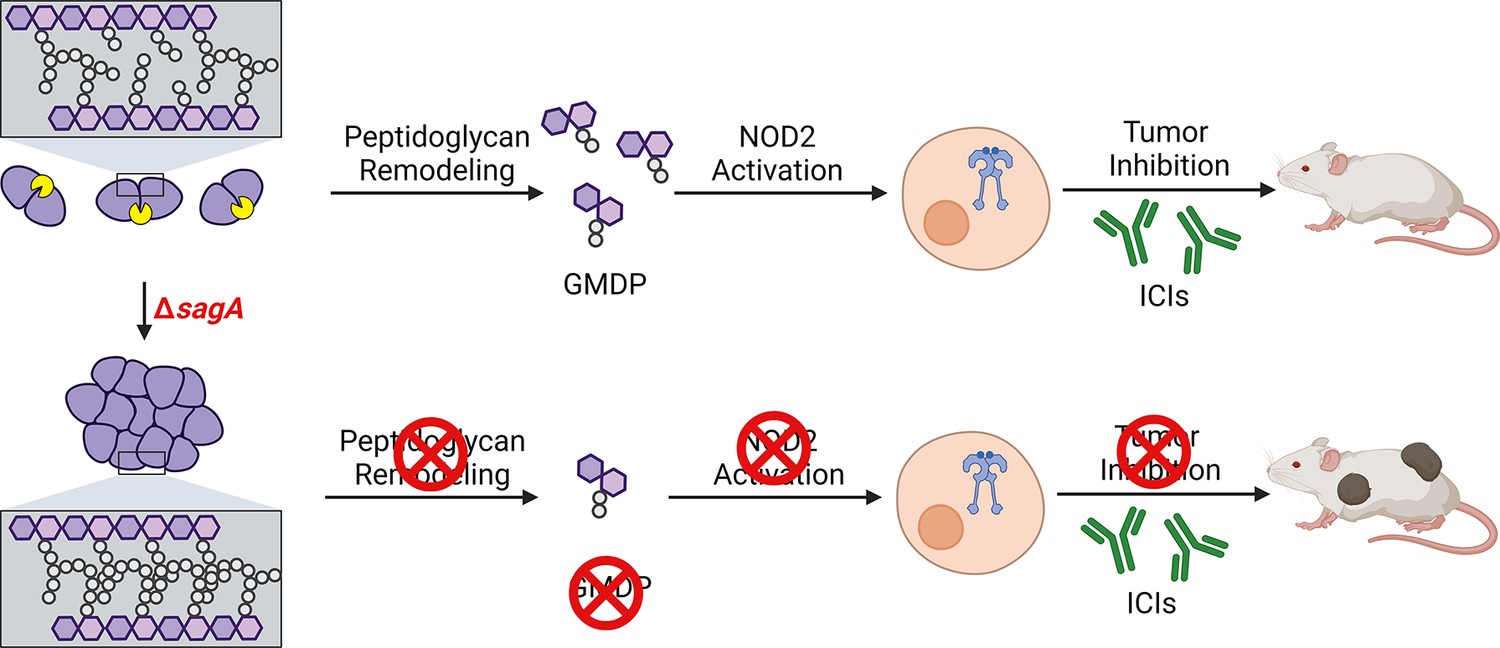
Summary of SagA function in E. faecium and impact on host immunity during ICI cancer therapy.
Deletion of sagA impairs peptidoglycan remodeling and cell separation in E. faecium and limits the activation of NOD2 in mammalian cells to promote immune checkpoint inhibitor cancer therapy in mouse models. Created with BioRender.com.
© 2024, BioRender Inc. Figure 5 was created using BioRender, and is published under a CC BY-NC-ND license. Further reproductions must adhere to the terms of this license.
Additional files
-
Supplementary file 1
Mutations detected in ΔsagA E. faecium Com15 strain.
- https://cdn.elifesciences.org/articles/95297/elife-95297-supp1-v1.docx
-
Supplementary file 2
Summary of MIC determinations via antibiotic test strips for E. faecium wild-type (WT), ΔsagA, and ΔsagA/psagA (Figure 1—figure supplement 2a).
- https://cdn.elifesciences.org/articles/95297/elife-95297-supp2-v1.docx
-
Supplementary file 3
E. faecium strains used in this study.
- https://cdn.elifesciences.org/articles/95297/elife-95297-supp3-v1.docx
-
Supplementary file 4
Plasmids used in this study.
- https://cdn.elifesciences.org/articles/95297/elife-95297-supp4-v1.docx
-
Supplementary file 5
Primers used in this study for generating complementation plasmids and empty vector.
- https://cdn.elifesciences.org/articles/95297/elife-95297-supp5-v1.docx
-
Supplementary file 6
Primers used in this study for SagA mutagenesis.
- https://cdn.elifesciences.org/articles/95297/elife-95297-supp6-v1.docx
-
Supplementary file 7
Masses of peptidoglycan fragments were detected with MSD API-ES.
- https://cdn.elifesciences.org/articles/95297/elife-95297-supp7-v1.docx
-
MDAR checklist
- https://cdn.elifesciences.org/articles/95297/elife-95297-mdarchecklist1-v1.docx
Download links
A two-part list of links to download the article, or parts of the article, in various formats.
Downloads (link to download the article as PDF)
Open citations (links to open the citations from this article in various online reference manager services)
Cite this article (links to download the citations from this article in formats compatible with various reference manager tools)
Secreted antigen A peptidoglycan hydrolase is essential for Enterococcus faecium cell separation and priming of immune checkpoint inhibitor therapy
eLife 13:RP95297.
https://doi.org/10.7554/eLife.95297.3


