RBM7 deficiency promotes breast cancer metastasis by coordinating MFGE8 splicing switch and NF-kB pathway
- Sino-US Research Center for Cancer Translational Medicine of the Second Affiliated Hospital of Dalian Medical University & Institute of Cancer Stem Cell, Dalian Medical University, China
- Department of Oncology & Sino-US Research Center for Cancer Translational Medicine, the Second Affiliated Hospital, Dalian Medical University, China
- Department of Pathology, the First Affiliated Hospital of Dalian Medical University, Dalian Medical University, China
- Institute of Cancer Stem Cell, Dalian Medical University, China
- Department of Prosthodontics, College of Stomatology, Dalian Medical University, China
- Soochow University Cancer Institute, China
Figures
Figure 1 with 1 supplement
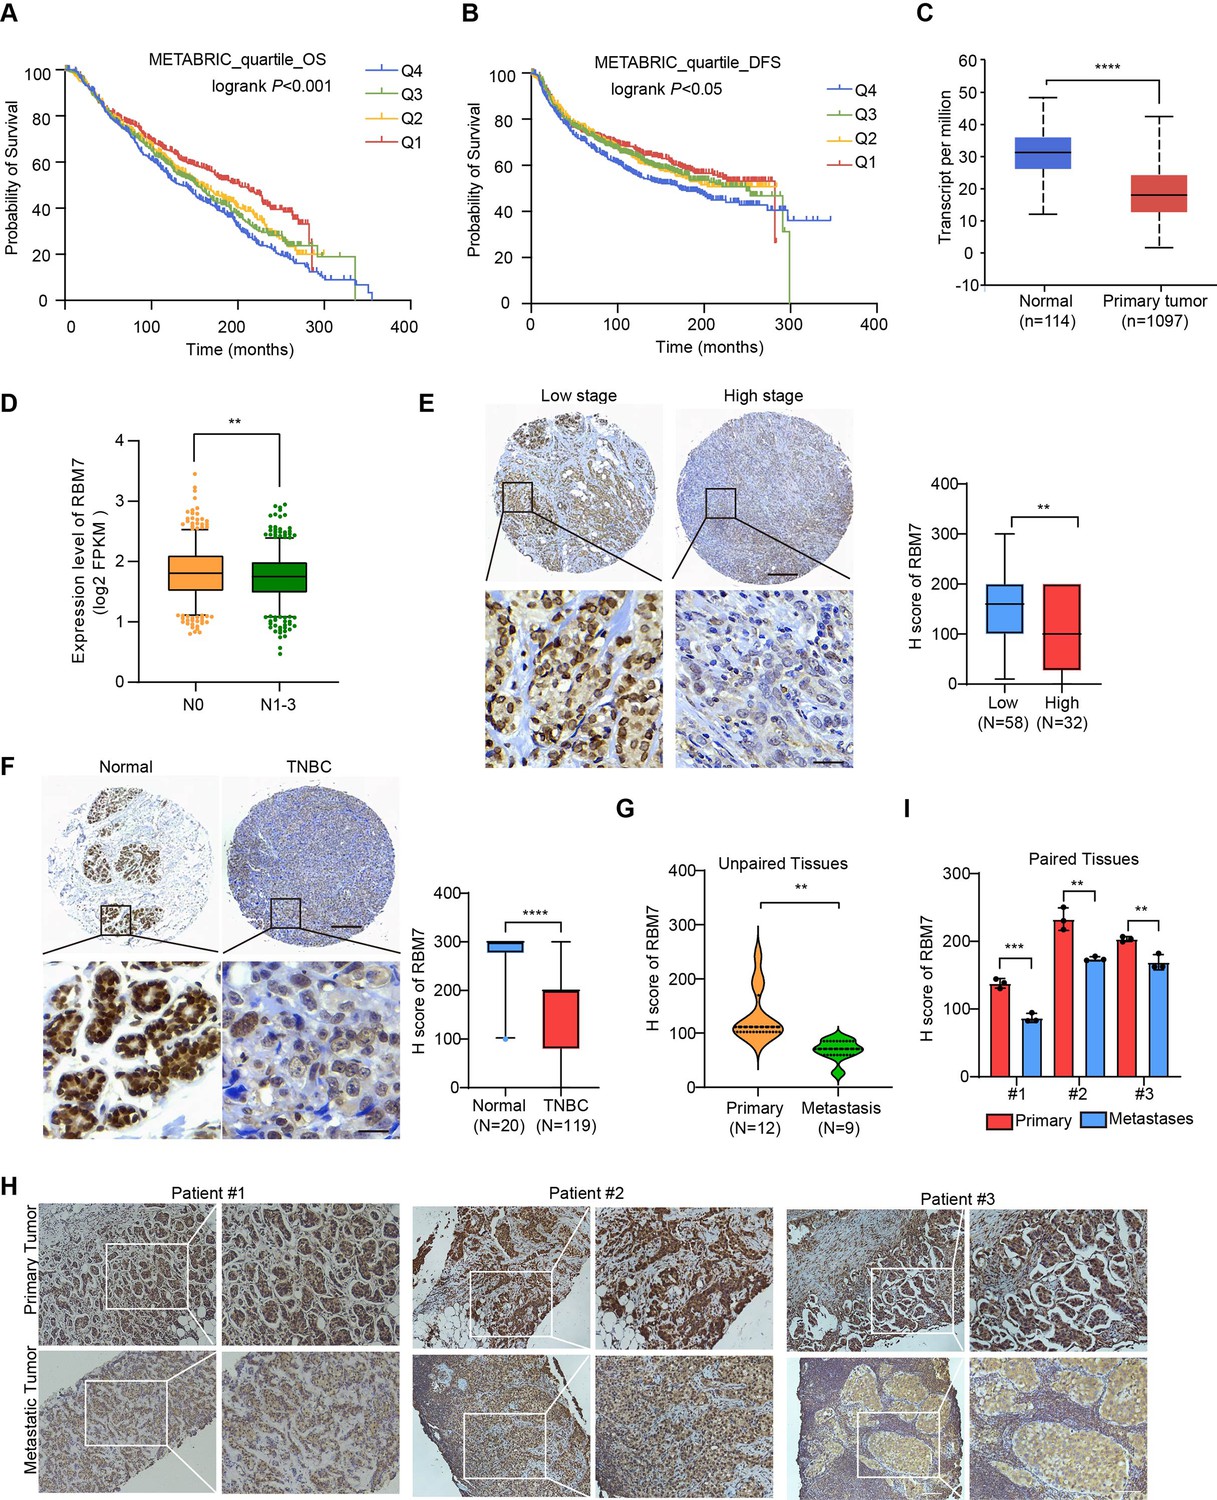
Decreased RBM7 expression was associated with poor prognosis of breast cancer.
(A–B) The correlation between RBM7 mRNA expression and overall survival (OS) or disease-free-survival (DFS) of breast cancer patients (n=1980) was analyzed based on the METABRIC dataset. The samples were divided into four equal parts, containing lower quartile Q1, median quartile Q2, upper quartile Q3 and higher quartile Q4 according to the expression of RBM7. Data are presented as means ± SD and p values were obtained by Mantel-Cox log-rank test. (C) The expression of RBM7 in primary breast carcinoma (n=1097) compared to normal tissues (n=114) was analyzed through UALCAN dataset. (D) Analysis of RBM7 expression in breast cancer lymph node metastases in comparison with breast cancer tissues with no lymph node metastasis based on TCGA dataset. BRCA samples were classified into N0 (No regional lymph node involvement) (n=515), and metastases in lymph node (N1–N3) (n=565). (E) Representative IHC images of RBM7 staining for patients at high (n=32) or low (n=58) clinical stages on tissue microarray of breast cancer specimens. Scale bars = 300 μm (top) or 30 μm (bottom). (F) Representative images of the IHC staining of RBM7 in a tissue microarray containing triple-negative breast cancer (n=119) and para-carcinoma tissues (n=20). Scale bars = 300 μm (top) and 30 μm (bottom). (G) Quantitative analysis of RBM7 expression according to IHC staining scores in primary breast cancer (n=12) and distant metastases (breast cancer lung metastases, n=4; breast cancer liver metastases, n=5). (H–I) Representative IHC images and quantitative analyses for RBM7 staining in 3 paired primary breast cancer and lymphatic metastases are shown. Scale bar = 100 μm. Data are presented as means ± SD and p values were obtained by unpaired Student t test (C–I). **p < 0.01, ***p < 0.001, ****p< 0.0001.
Figure 1—figure supplement 1
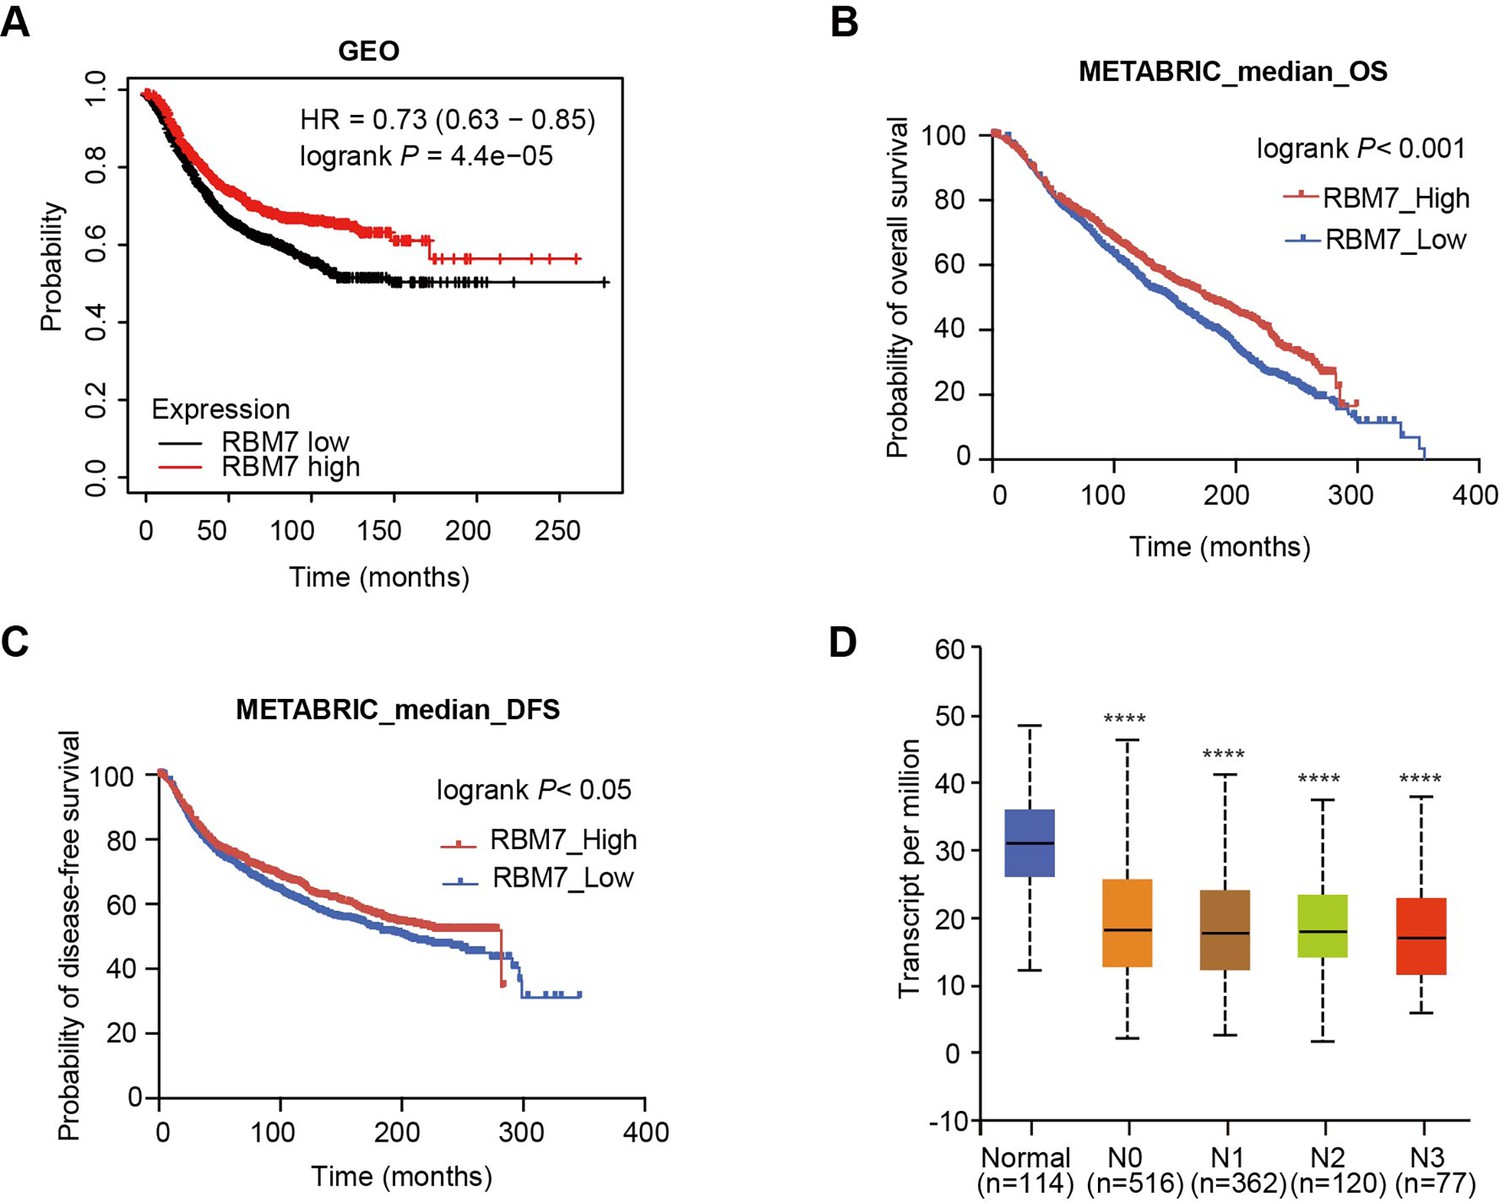
The low expression of RBM7 in breast cancer was positively correlated with poor prognosis of breast cancer patients.
(A) The correlation between RBM7 expression and overall survival of breast cancer patients based on data from the Kaplan–Meier Plotter cohort. (B–C) METABRIC analysis of the correlation between RBM7 expression and overall survival (OS) or disease-free survival (DFS) of breast cancer patients based on the METABRIC dataset. p value was obtained by log-rank test (A, B, C). (D) RBM7 mRNA level was analyzed in breast invasive carcinoma based on lymph nodal metastasis status from the UALCAN dataset. p value was calculated by unpaired Student’s t-test by comparing different types of lymph node metastasis of breast cancer with normal tissue (n=114). N, Lymph node metastases: N0, no metastases (n=516); N1, 1–3 metastases (n=362); N2, 4–9 metastases (n=120); N3, 10 or more metastases (n=77).
Figure 2 with 1 supplement
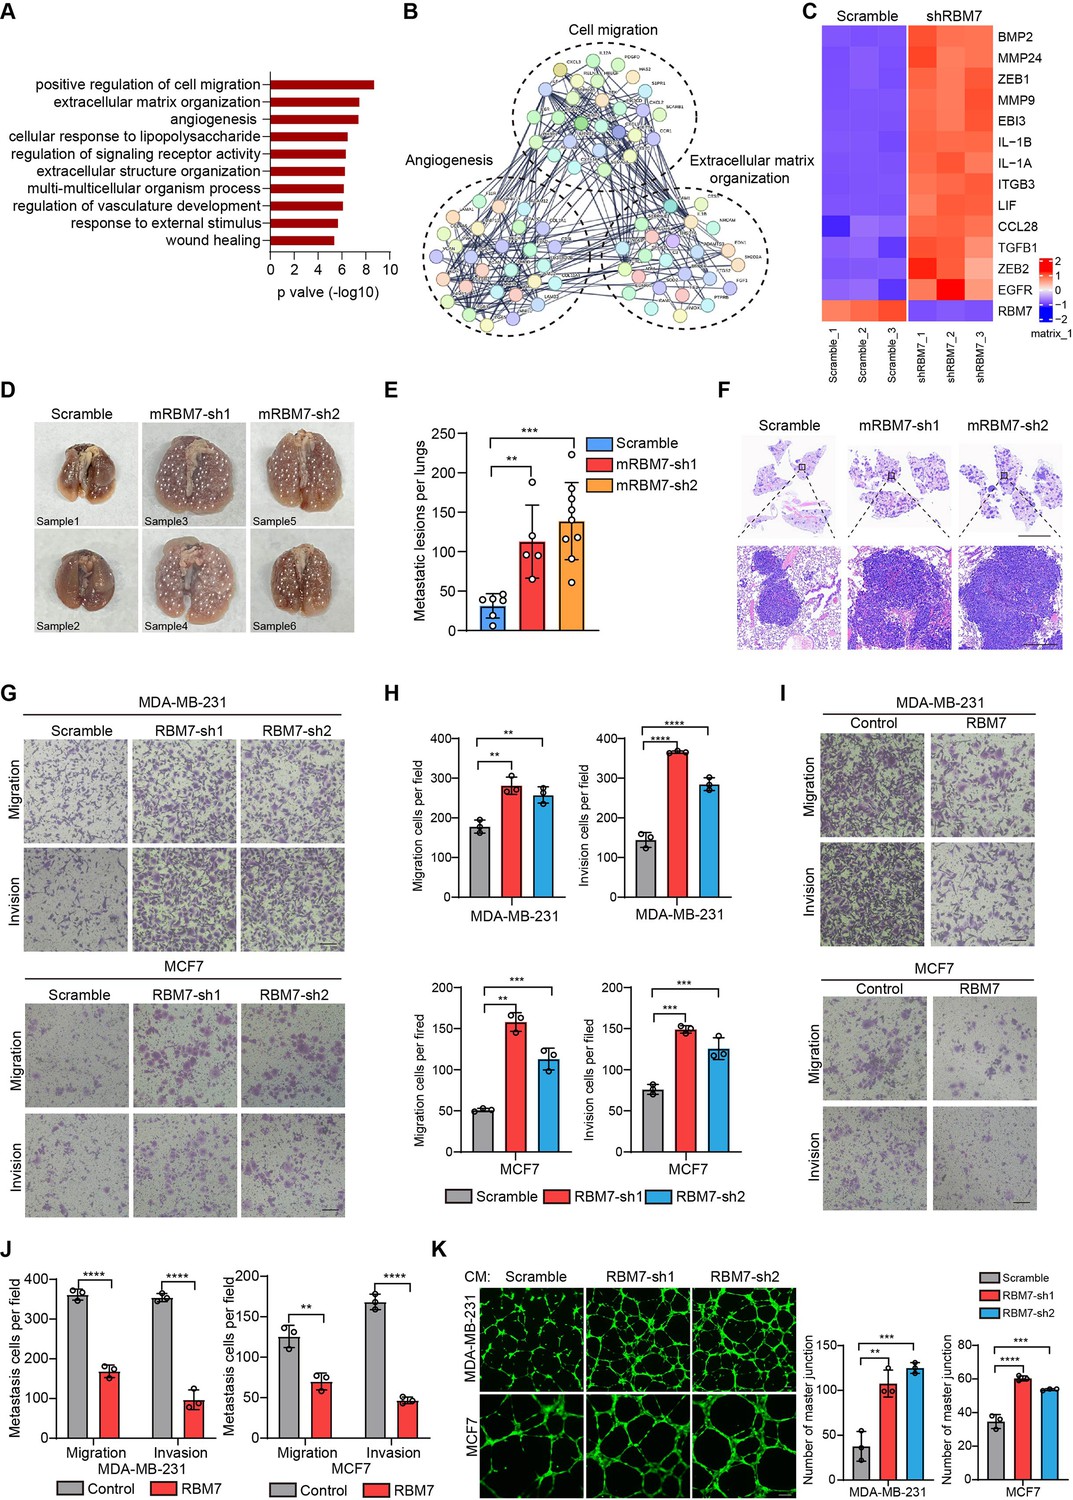
RBM7 negatively regulated breast cancer metastatic potential.
(A) Gene Ontology analysis showed the significantly affected biological process upon RBM7 knockdown in MDA-MB-231 cells. (B) Functional association network of RBM7-regulated targets. The genes were analyzed using the STRING database, and subgroups are marked according to their function. (C) A heatmap showing the qRT-PCR analysis of differentially expressed genes upon RBM7 knockdown in breast cancer cells from three biological replicates. (D–F) 4T1 cells without or with RBM7 knockdown were injected into tail vein of immunodeficient BALB/c mice to establish a lung metastasis model. Spontaneous pulmonary metastases were assessed after about 3 weeks, the white arrow indicates lung lesions macroscopically (D). (H and E) stained lung sections were quantified for the number of spontaneous metastatic lesions from BALB/c mice (n=6, 5 and 9). Data are presented as mean ± SD and p values were determined by one-way ANOVA with Dunnett’s multiple comparisons test (E). Representative images of H&E stained lung sections are shown. Top panel scale bars indicate 7 mm; bottom panel scale bars indicate 300 μm (F). (G–J) The metastatic ability of breast cancer cells with RBM7 depletion (G) or ectopic expression of RBM7 (I) were evaluated by transwell assay. Scale bars: 100 μm. Data are mean ± SD from three random fields. p values were determined by one-way ANOVA with Dunnett’s multiple comparisons test (H) or unpaired Student’s T test (J). (K) Representative images of the tube formation of HUVEC cells treated with conditional medium from RBM7-KD cells or control cells for 12 hr. Scale bars: 100 μm. Quantification of number of junctions formed by HUVEC was calculated by Image J software. **p < 0.01, ***p < 0.001, ****p< 0.0001.
Figure 2—figure supplement 1
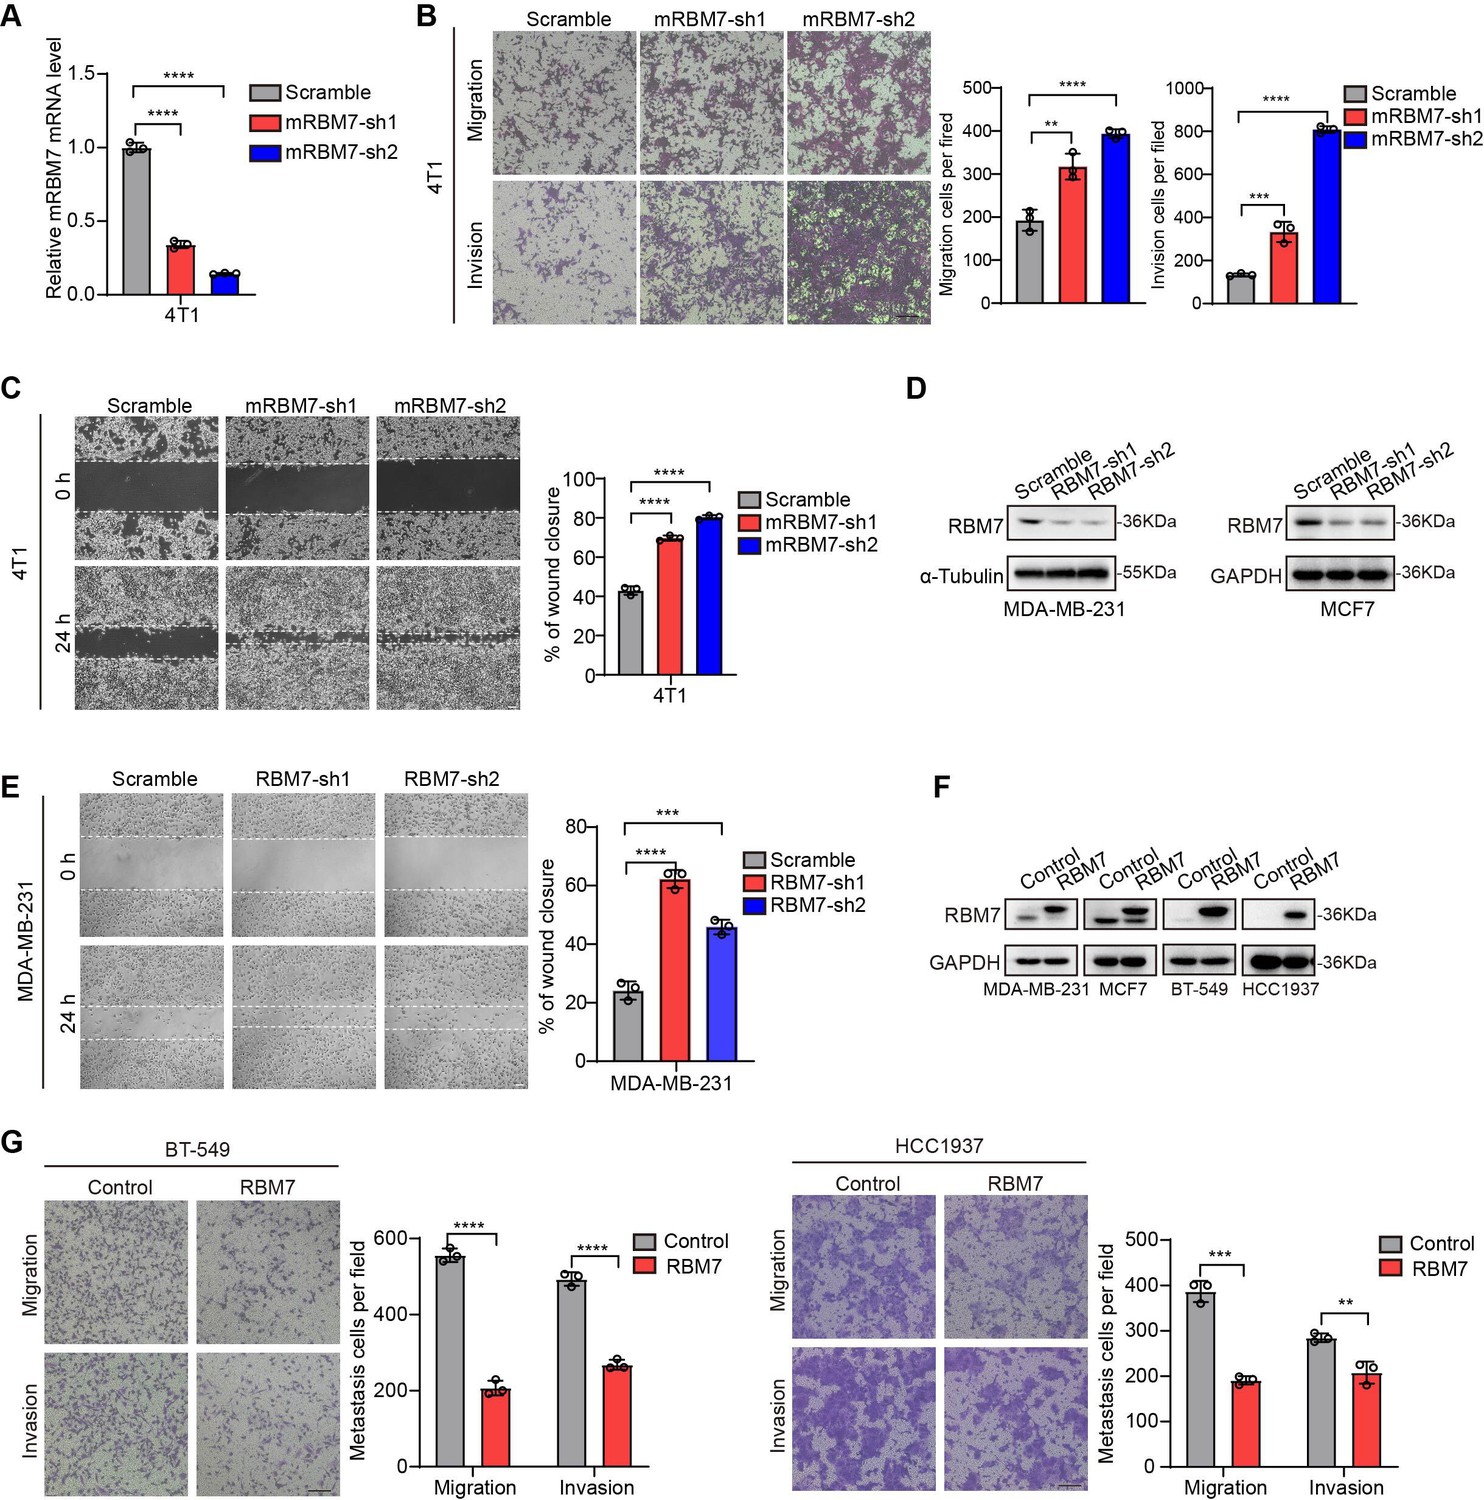
RBM7 depletion promoted breast cancer cell migration and invasion.
(A) The mouse cell line 4T1 with RBM7 knockdown was constructed. The knockdown efficiency of RBM7 was detected by real-time quantitative PCR. (B) The migration and invasion ability of RBM7-knockdown 4T1 cells was detected by transwell chambers coated with or without Matrigel. Scale bars: 100 μm. (C) The metastatic capability of RBM7-depleted 4T1 cells was evaluated by wound healing assay. Scale bars: 100 μm. (D) Western blotting showed the expression of RBM7 in MDA-MB-231 and MCF7 cells with RBM7 depletion (see also Figure 2—figure supplement 1—source data 1, Figure 2—figure supplement 1—source data 2). (E) The metastatic capability of RBM7-knockdown MDA-MB-231 cells was evaluated by wound healing assay. Scale bars: 100 μm.(F) Western blotting showed the expression of RBM7 in various breast cancer cell lines with ectopic expression of RBM7 (see also Figure 2—figure supplement 1—source data 3, Figure 2—figure supplement 1—source data 4). (G) The metastatic ability of BT-549 cells and HCC1937 cells upon RBM7 overexpression was evaluated by transwell assay. Data are mean ± SD from three random fields. Scale bars: 100 μm. p values were determined by unpaired Student’s T test (G).p value was calculated by one-way ANOVA with Dunnett’s multiple comparisons test (A, B, C, E).
-
Figure 2—figure supplement 1—source data 1
Original file for the western blot analysis in Figure 2—figure supplement 1D (anti-RBM7 and anti-tubulin).
- https://cdn.elifesciences.org/articles/95318/elife-95318-fig2-figsupp1-data1-v1.zip
-
Figure 2—figure supplement 1—source data 2
PDF containing Figure 2—figure supplement 1D and original scans of the relevant western blot analysis (anti-RBM7 and anti-tubulin) with highlighted bands and sample labels.
- https://cdn.elifesciences.org/articles/95318/elife-95318-fig2-figsupp1-data2-v1.zip
-
Figure 2—figure supplement 1—source data 3
Original file for the Western blot analysis in Figure 2—figure supplement 1F (anti-RBM7 and anti-tubulin).
- https://cdn.elifesciences.org/articles/95318/elife-95318-fig2-figsupp1-data3-v1.zip
-
Figure 2—figure supplement 1—source data 4
PDF containing Figure 2—figure supplement 1F and original scans of the relevant western blot analysis (anti-RBM7 and anti-tubulin) with highlighted bands and sample labels.
- https://cdn.elifesciences.org/articles/95318/elife-95318-fig2-figsupp1-data4-v1.zip
Figure 3 with 1 supplement
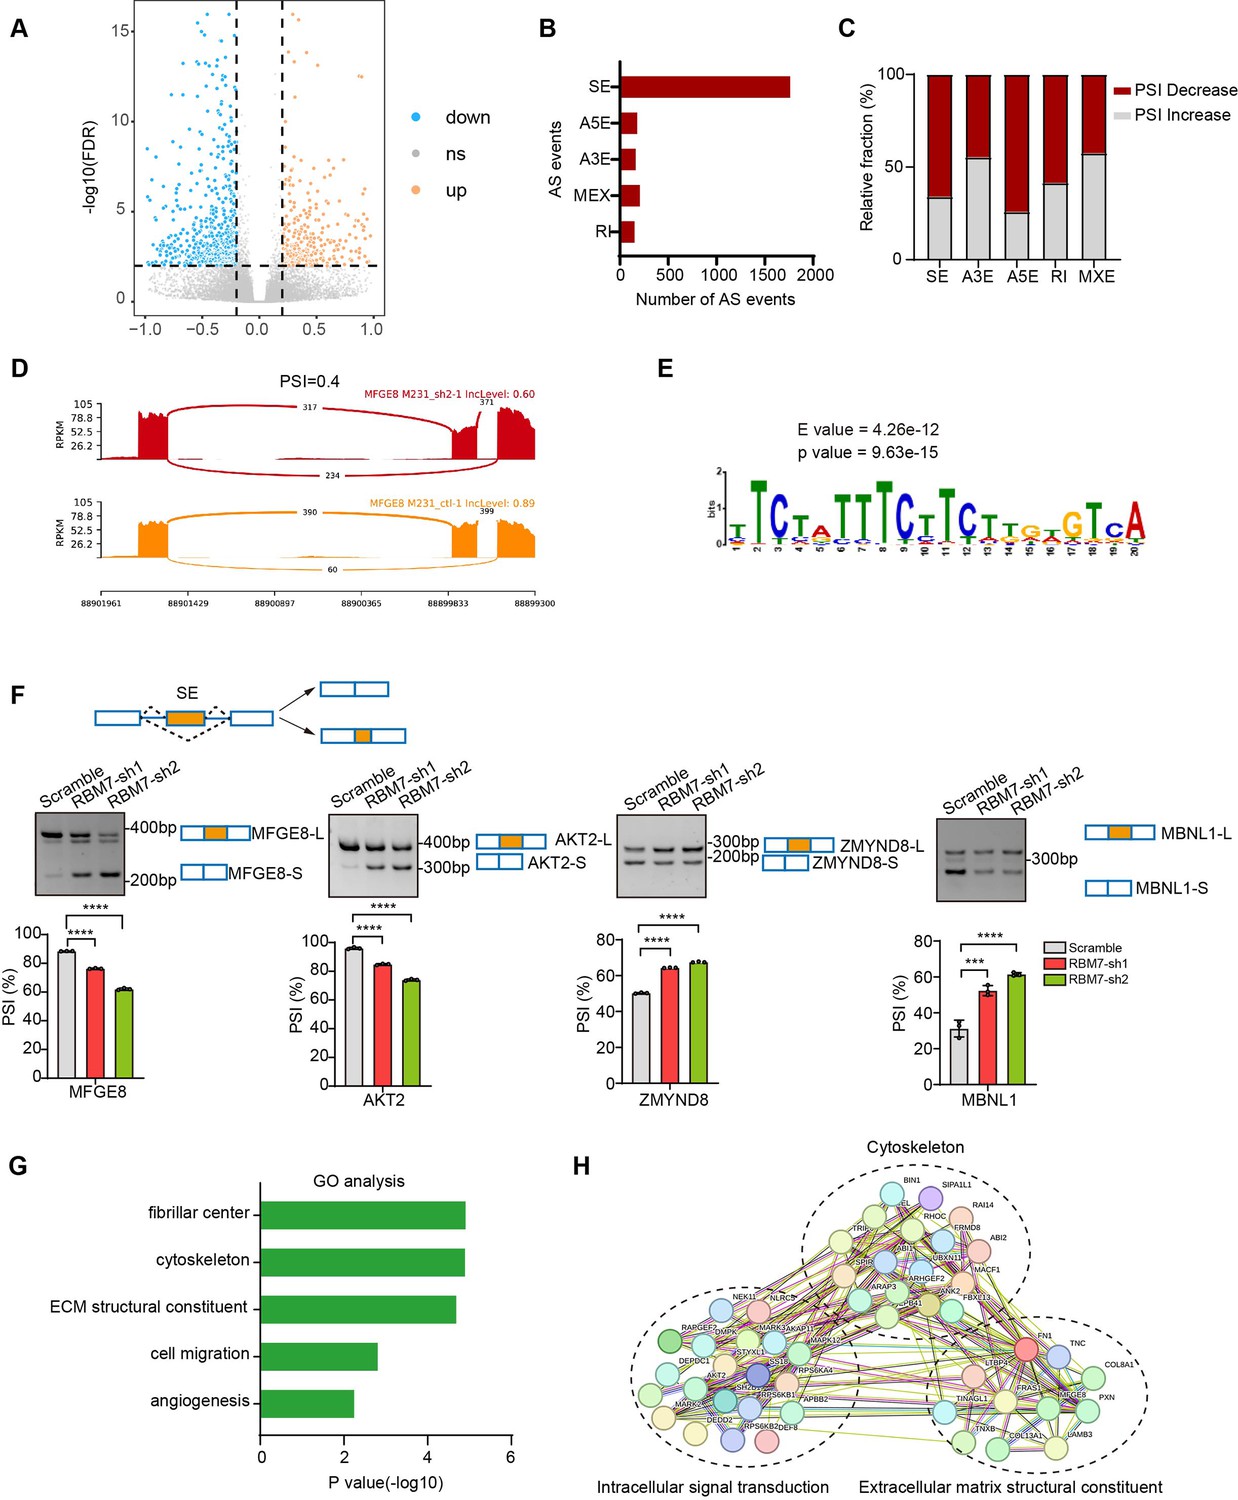
Global identification of alternative splicing events regulated by RBM7.
(A–E) RNA-seq analysis was performed on RBM7-knockdown MDA-MB-231 cells or control cells, and the changes in splicing events were analyzed. (A) Volcano plot illustrating up-regulated/down-regulated alternative splicing events upon RBM7 depletion. (B) Comparison of the differential splicing events in five types of AS events affected by RBM7 depletion. (C) The relative fraction of splicing events undergoing percent spliced in (PSI) increase or decrease induced by RBM7 depletion. (D) Alternative splicing of MFGE8 was chosen to represent a decrease of PSI, and numbers of exon junction reads were indicated. (E) The hit top enriched motifs identified in the differential spliced genes regulated by RBM7. (F) RBM7-regulated exon skipping events were identified by semiquantitative RT-PCR using RBM7-depleted or control MDA-MB-231 cells (see also Figure 3—source data 1, Figure 3—source data 2). The mean ± SD of PSI from three independent experiments was plotted, with p values determined by one-way ANOVA with Dunnett’s multiple comparisons test. (G) Gene Ontology analysis showed the significantly enriched biological processes of changed splicing events affected upon RBM7 knockdown in MDA-MB-231 cells. (H) KEGG pathway enrichment analysis of functional association network of the RBM7-controlled AS targets.
-
Figure 3—source data 1
Original file for the RT-PCR analysis of splicing shifts in Figure 3F (MFGE8, AKT2, ZMYN8, or MBNL1).
- https://cdn.elifesciences.org/articles/95318/elife-95318-fig3-data1-v1.zip
-
Figure 3—source data 2
PDF containing Figure 3F and original scans of the relevant RT-PCR analysis of splicing shifts (MFGE8, AKT2, ZMYN8, or MBNL1) with highlighted bands and sample labels.
- https://cdn.elifesciences.org/articles/95318/elife-95318-fig3-data2-v1.zip
Figure 3—figure supplement 1
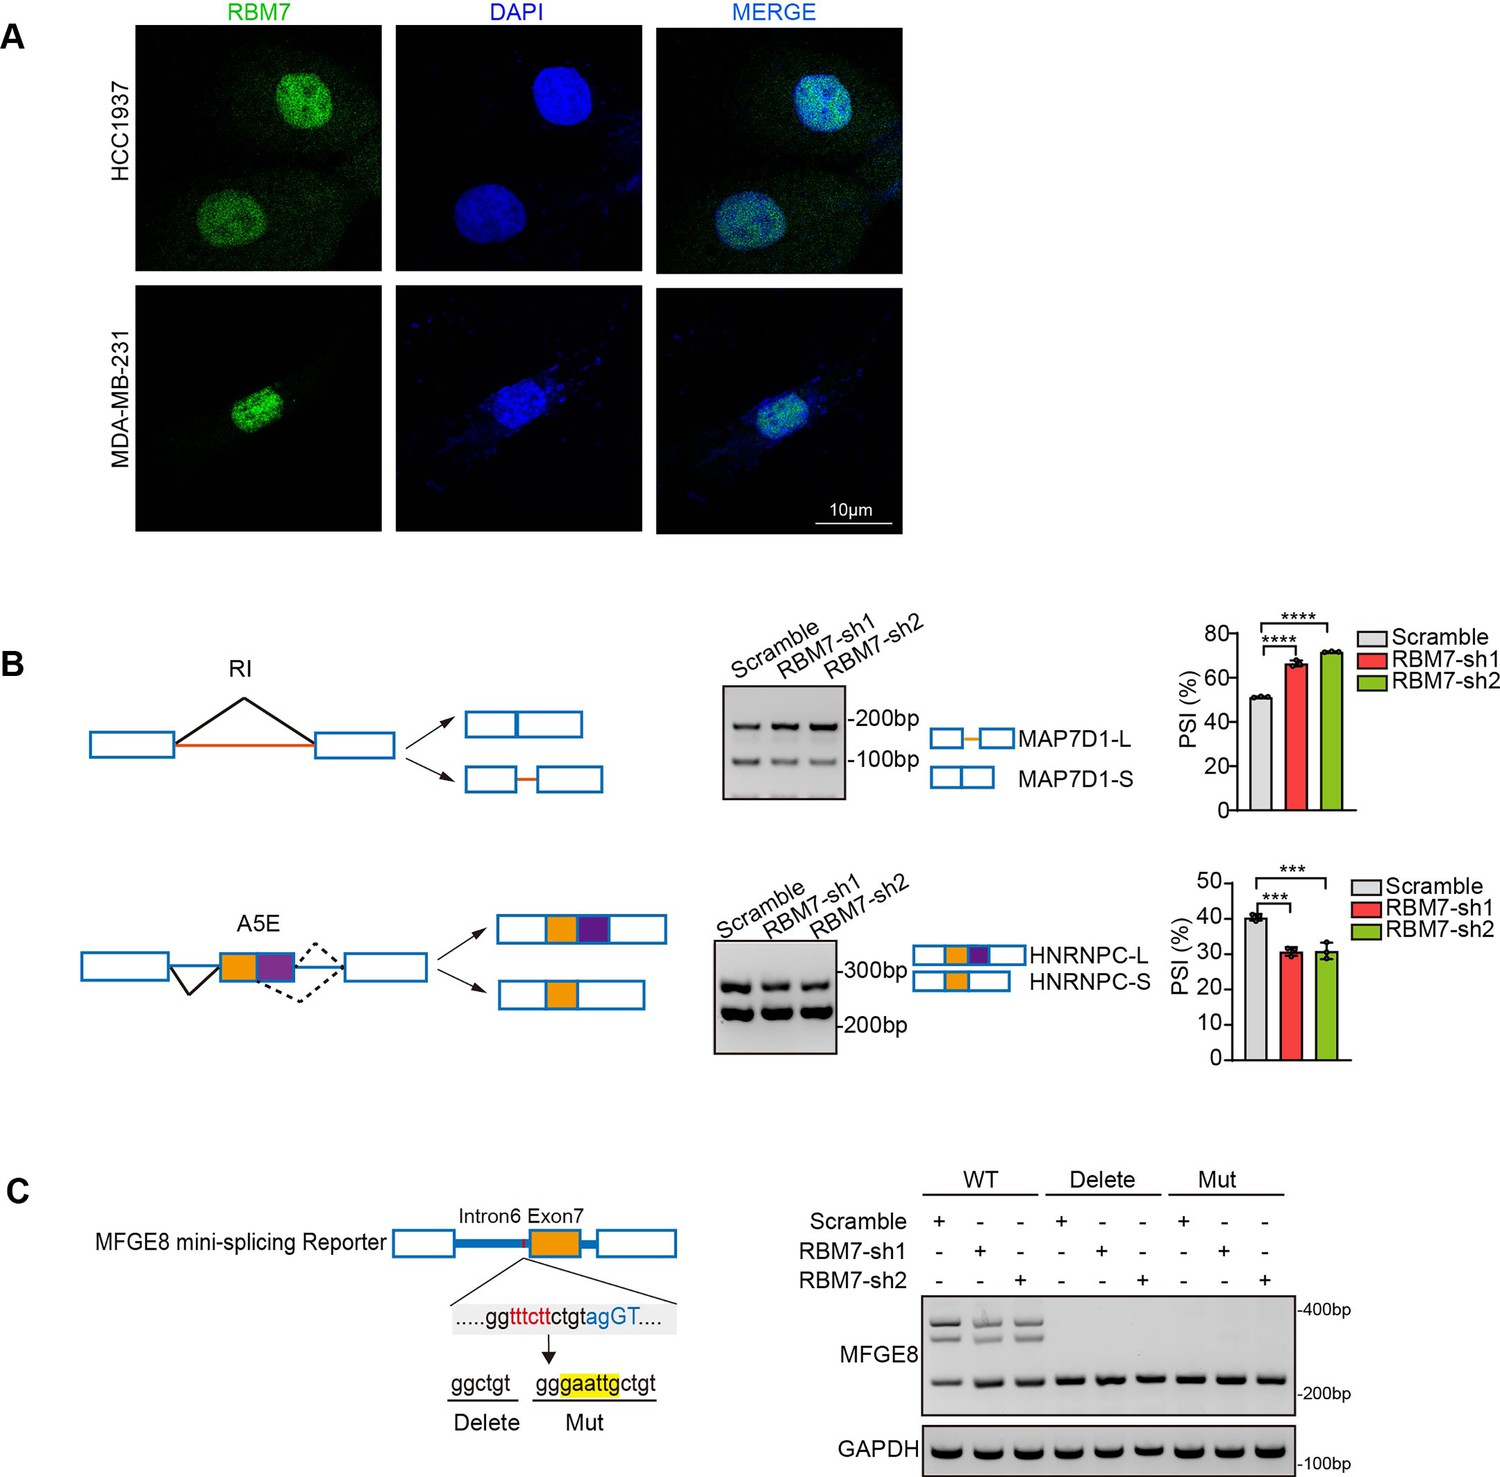
RBM7 had a potential role in regulating alternative splicing of breast cancer cells.
(A) Immunofluoresence shows endogenous RBM7 subcellular localization in breast cancer cell lines. Scale bars: 10 μm. (B) Semi-quantitative RT-PCR was performed to validate the RI (intron retention) and A5E (alternative 5’ splice site exon) splicing events in MDA-MB-231 cells with RBM7 knockdown compared with vector control (see also Figure 3—figure supplement 1—source data 1, Figure 3—figure supplement 1—source data 2). p value was calculated by one-way ANOVA with Dunnett’s multiple comparisons test. (C) MFGE8 min-splicing reporters with mutation in the RBM7 binding site or a non-specific binding were generated and shown in cartoon (left); RT-PCR assays were performed to identify the splicing outcomes of MFGE8 reporter while RBM7 was depleted in breast cancer cells (right). See also Figure 3—figure supplement 1—source data 3, Figure 3—figure supplement 1—source data 4.
-
Figure 3—figure supplement 1—source data 1
Original file for the RT-PCR analysis of MAP7D1 or HNRNPC splicing switch in Figure 3—figure supplement 1B.
- https://cdn.elifesciences.org/articles/95318/elife-95318-fig3-figsupp1-data1-v1.zip
-
Figure 3—figure supplement 1—source data 2
PDF containing Figure 3—figure supplement 1B and original scans of the relevant RT-PCR analysis for splicing switch of MAP7D1 or HNRNPC variants with highlighted bands and sample labels.
- https://cdn.elifesciences.org/articles/95318/elife-95318-fig3-figsupp1-data2-v1.zip
-
Figure 3—figure supplement 1—source data 3
Original file for RT-PCR analysis of splicing switch of MFGE8 minigene reporter in Figure 3—figure supplement 1C.
- https://cdn.elifesciences.org/articles/95318/elife-95318-fig3-figsupp1-data3-v1.zip
-
Figure 3—figure supplement 1—source data 4
PDF containing Figure 3—figure supplement 1C and original scans of the relevant RT-PCR analysis of MFGE8 splicing switch with highlighted bands and sample labels.
- https://cdn.elifesciences.org/articles/95318/elife-95318-fig3-figsupp1-data4-v1.zip
Figure 4
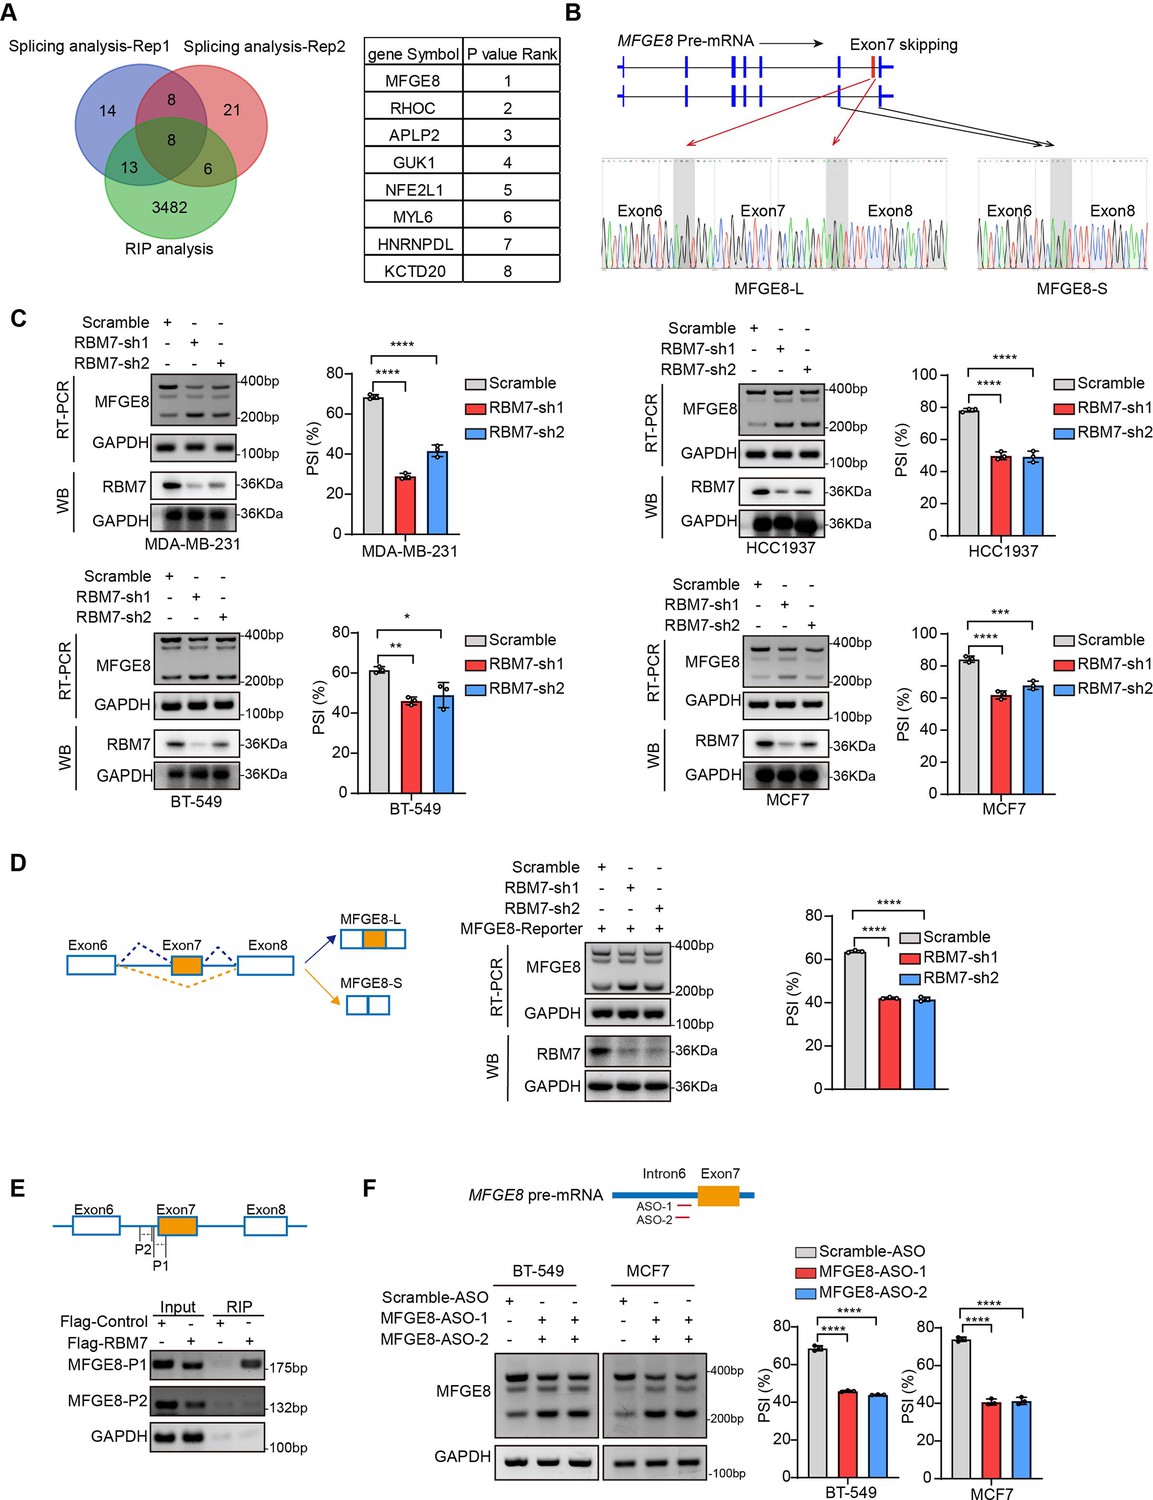
RBM7 knockdown promoted exon 7 skipping of MFGE8.
(A) Comparison of RBM7-binding candidates from the RNA immunoprecipitation (RIP) sequencing (GSE144075 dataset) and two gene sets containing top 43 differentially AS genes in RNA-seq data of breast cancer cells expressing RBM7 shRNA1/2 as presented by venn diagram. The gene lists on the right were shown according to the FDR P value of top genes with significantly changed AS in RNA-seq. (B) Upper: schematics of human MFGE8 pre-mRNA (NM_005928.4). MFGE8-long isoform included the exon 7 (hereafter referred to as MFGE8-L), whereas it is skipped in MFGE8-short isoform (hereafter referred to as MFGE8-S). The arrow indicates the direction of transcription. Lower: primers were designed on exon 6/8, and RT-PCR was performed to identify PSI changes using RBM7-knockdown or control MDA-MB-231 cells. The base peak diagram of sanger sequencing of RT-PCR results showed the splicing junction sites (filled with gray). (C) Various breast cancer cells lines with stable depletion of RBM7 or control were constructed. Alternative splicing events of MFGE8 regulated by RBM7 were examined by semi-quantitative RT-PCR. The knockdown efficiency of RBM7 expression was detected by western blotting. (see also Figure 4—source data 1, Figure 4—source data 2). The mean ± SD of PSIs from three independent repeated experiments were plotted with p value calculated by one-way ANOVA with Dunnett’s multiple comparisons test. (D) Left, Schematics of MFGE8 mini-splicing reporter including exons 6–8 and two flanking introns in the 600 bp region upstream and downstream of 5’/3’ splice sites; middle, RBM7 stable knockdown or control cells were transfected with splicing reporter and collected for RNA extraction after 48 hr. The splicing changes of exogenous MFGE8 were detected by RT-PCR with specific primers on the reporter gene. The level of RBM7 protein was detected in MCF7 cells by western blotting (see also Figure 4—source data 3, Figure 4—source data 4). p value was calculated by one-way ANOVA with Dunnett’s multiple comparisons test from three repeated experiments. (E) As shown in schematic diagram, orange box indicates cassette exon 7 and primers were designed in the putative binding regions P1 and P2. Binding of MFGE8 pre-mRNA with RBM7 was examined by RIP assay in HEK293T cells expressing Flag-RBM7. (see also Figure 4—source data 5, Figure 4—source data 6) (F) Upper: the red line in diagram indicates ASOs targeting region which contain UUUCUU residues; down: MCF7 and BT-549 cells were transfected with ASOs targeting MFGE8 pre-mRNA for 48 hr and then applied for RT-PCR identification (see also Figure 4—source data 7, Figure 4—source data 8). *p < 0.05, **p < 0.01, ***p < 0.001, and ****p< 0.0001.
-
Figure 4—source data 1
Original file for the RT-PCR analysis of MFGE8 splicing switch and western blot identification of RBM7 knockdown in various breast cancer cell lines in Figure 4C.
- https://cdn.elifesciences.org/articles/95318/elife-95318-fig4-data1-v1.zip
-
Figure 4—source data 2
PDF containing Figure 4C and original scans of the relevant RT-PCR analysis for MFGE8 splicing switch and western blot identification of RBM7 knockdown with highlighted bands and sample labels.
- https://cdn.elifesciences.org/articles/95318/elife-95318-fig4-data2-v1.zip
-
Figure 4—source data 3
Original file for the RT-PCR analysis of splicing switch in MFGE8 mini-splicing reporter and western blot identification of RBM7 knockdown in Figure 4D.
- https://cdn.elifesciences.org/articles/95318/elife-95318-fig4-data3-v1.zip
-
Figure 4—source data 4
PDF containing Figure 4D and original scans of the relevant RT-PCR analysis of splicing switch in MFGE8 mini-splicing reporter and western blot identification of RBM7 knockdown with highlighted bands and sample labels.
- https://cdn.elifesciences.org/articles/95318/elife-95318-fig4-data4-v1.zip
-
Figure 4—source data 5
Original file for the RT-PCR analysis of RBM7 protein- MFGE8 pre-mRNA binding from RIP assay in Figure 4E.
- https://cdn.elifesciences.org/articles/95318/elife-95318-fig4-data5-v1.zip
-
Figure 4—source data 6
PDF containing Figure 4E and original scans of the RT-PCR analysis of RBM7 protein- MFGE8 pre-mRNA binding from RIP assay with highlighted bands and sample labels.
- https://cdn.elifesciences.org/articles/95318/elife-95318-fig4-data6-v1.zip
-
Figure 4—source data 7
Original file for the RT-PCR analysis of MFGE8 splicing switch upon ASO treatment in Figure 4F.
- https://cdn.elifesciences.org/articles/95318/elife-95318-fig4-data7-v1.zip
-
Figure 4—source data 8
PDF containing Figure 4F and original scans of the relevant RT-PCR analysis for splicing switch of MFGE8 variants with highlighted bands and sample labels.
- https://cdn.elifesciences.org/articles/95318/elife-95318-fig4-data8-v1.zip
Figure 5 with 1 supplement
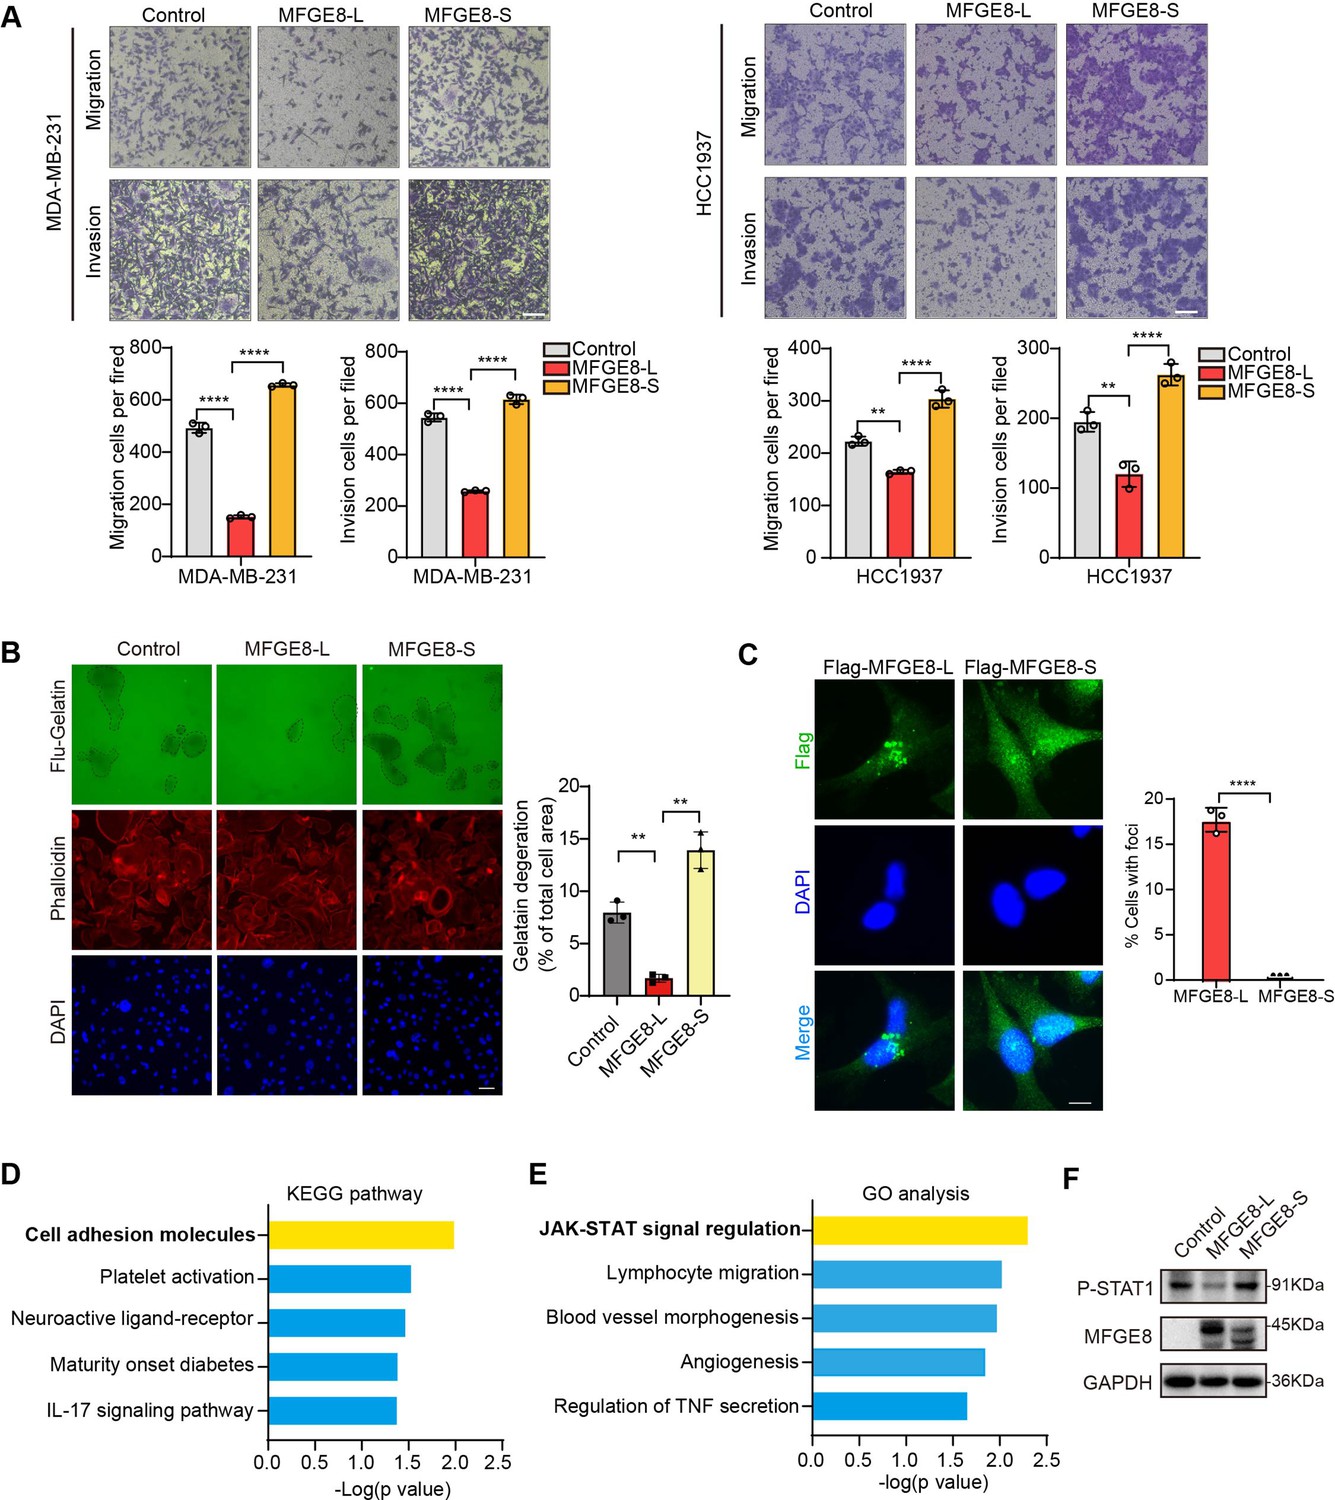
MFGE8-L inhibited breast cancer cell migration and invasion.
(A) The function of MFGE8-L/S on breast cancer cell migration and invasion were evaluated by transwell assays. Scale bars: 100 μm. (B) Gelatin degradation assay was performed to test the effect of RBM7 knockdown on invadopodia function. A total of 10,000 cells were plated onto FITC-gelatin substrates (Green) and cultured for 48 hr. Representative images are shown (red, Cy3-phalloidin; blue, DAPI) and the degraded areas were quantified by Image J software. Scar bars = 50 μm. P values were determined by one-way ANOVA with Tukey’s multiple comparisons test (n=3). (C) The subcellular localizations of MFGE8 isoforms. MDA-MB-231 cells were transfected with Flag-tagged MFGE8-L or MFGE8-S, and visualized with immunofluorescence assay. Scale bar = 10 μm. The percent of cells with foci were quantified and plotted (about 80 cells were captured and quantified in both samples). (D–E) The KEGG pathway and Gene ontology analysis of genes up-regulated by MFGE-S compared with MFGE8-L. (F) The expression levels of p-STAT1(Tyr701) in HCC1937 cells overexpressing MFGE8-L/S was detected by western blotting. (see also Figure 5—source data 1, Figure 5—source data 2). p values were determined by one-way ANOVA with Tukey’s multiple comparisons test. **p < 0.01, ****p< 0.0001.
-
Figure 5—source data 1
Original file for the western blot analysis in Figure 5F (anti-P-STAT1, anti-MFGE8 and anti-GAPDH).
- https://cdn.elifesciences.org/articles/95318/elife-95318-fig5-data1-v1.zip
-
Figure 5—source data 2
PDF containing Figure 5F and original scans of the relevant western blot analysis (anti-P-STAT1, anti-MFGE8 and anti-GAPDH) with highlighted bands and sample labels.
- https://cdn.elifesciences.org/articles/95318/elife-95318-fig5-data2-v1.zip
Figure 5—figure supplement 1
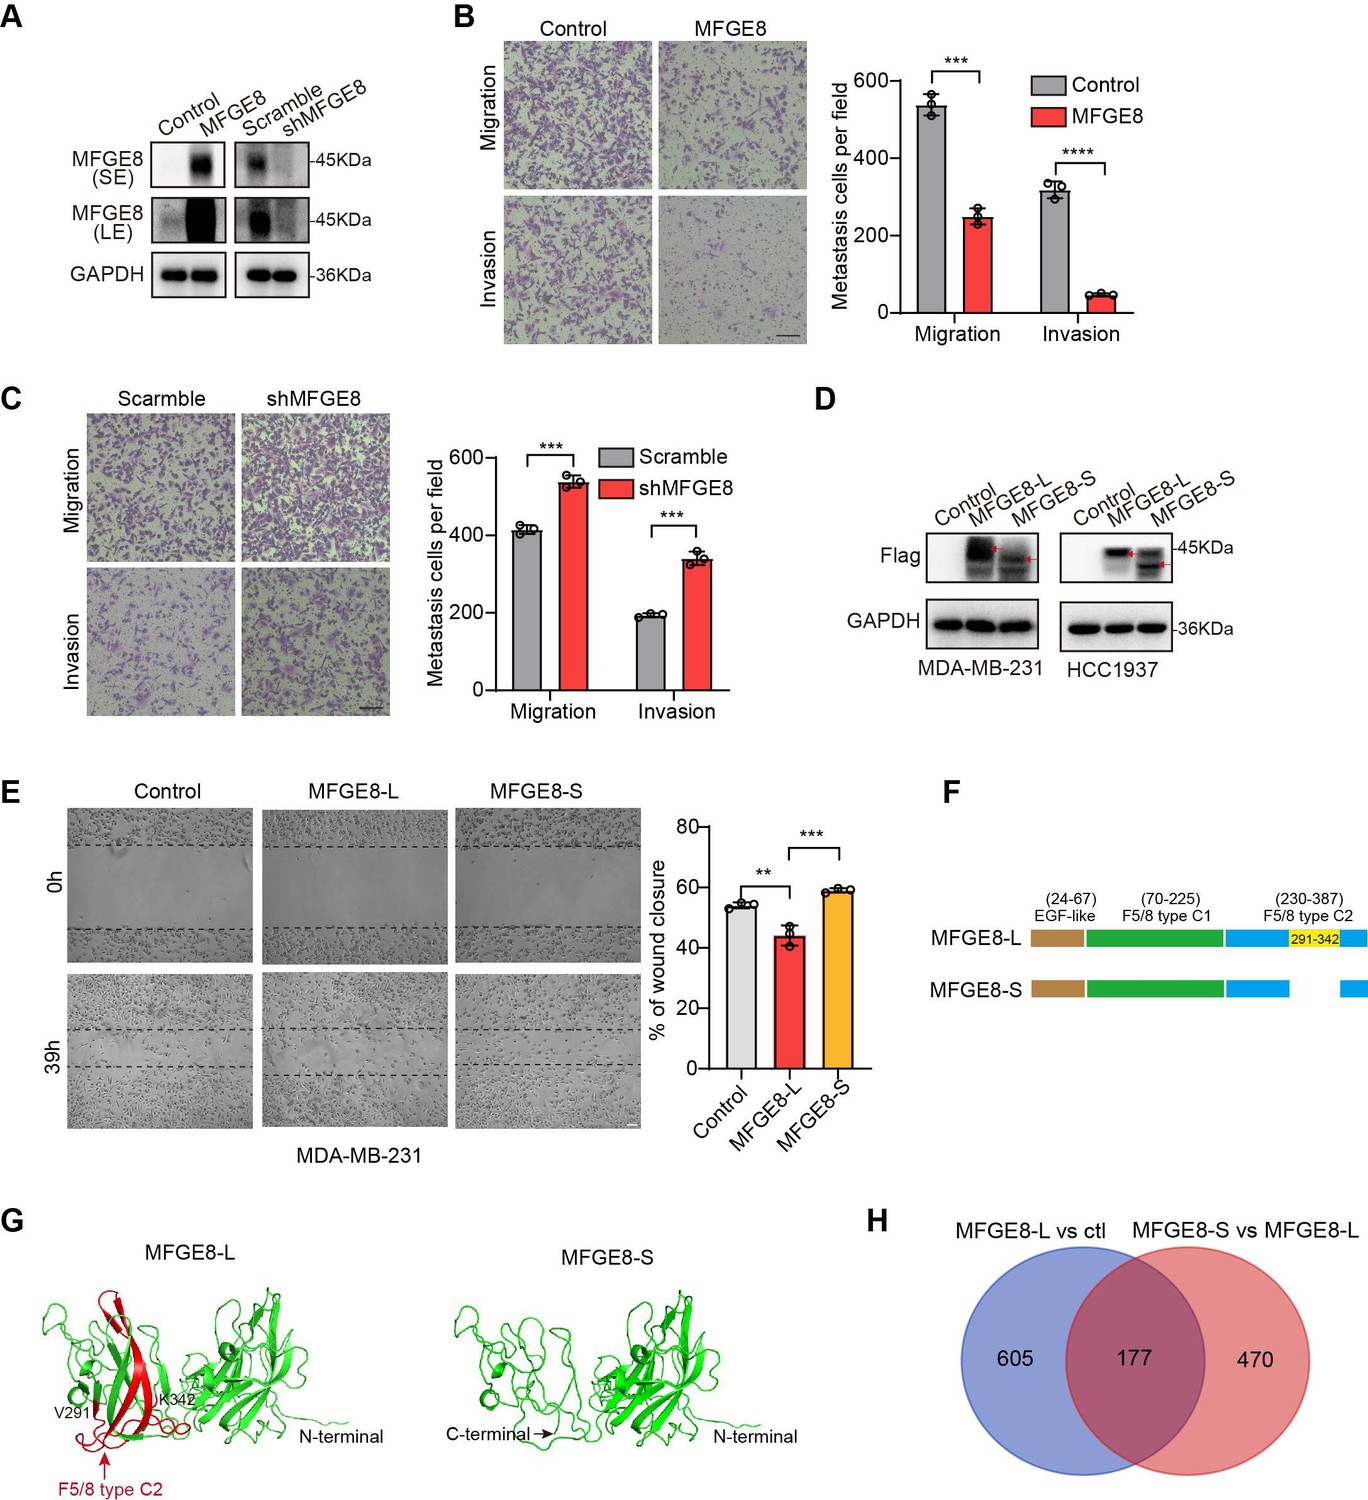
MFGE8-L suppressed breast cancer cells migration and invasion.
(A) The protein expression of MFGE8 was determined by western blot in MDA-MB-231 cells with over-expression or knockdown of MFGE8-L. SE denotes long exposure and LE denotes long exposure (see also Figure 5—figure supplement 1—source data 1, Figure 5—figure supplement 1—source data 2). (B–C) Transwell assay with Matrigel or not was performed using MDA-MB-231 cells with overexpression (B) or depletion (C) of MFGE8. Scale bars: 100 μm. P value was calculated by unpaired Student’s t test. (D) Western blot showed the extrinsic expression of MFGE8-L or MFGE8-S isoform in MDAMB-231 and HCC1937 transfected with Flag-MFGE8-L, Flag-MFGE8-S or empty vectors, respectively (see also Figure 5—figure supplement 1—source data 3, Figure 5—figure supplement 1—source data 4). The red arrow indicates the position of MFGE8-L/S protein band. (E) MDA-MB-231 cell line over-expressing MFGE8-L, MFGE8-S or vector control were analyzed by wound healing assay. Scale bars: 100 μm. The scratch healing rates were measured in triplicate experiments with mean ± SD plotted (p values were calculated by one-way ANOVA with Tukey’s multiple comparisons test). (F) Schematic diagram of the domain composition of two MFGE8 isoforms. Upper: the full-length variant with exon7 indicated by yellow square; down: the truncated variant with exon7 skipping. (G) The model structure of two MFGE8 isoforms was implemented using SwissModel software. The F5/8 type C2 protein domain excluded from MFGE8-S variant was marked in red. (H) Transcriptome sequencing was performed using MDA-MB-231 cells overexpressing MFGE8-L or MFGE8-S. Venn diagram of 782 MFGE8-L down-regulated genes compared to control and 647 MFGE8-S up-regulated genes compared to MFGE8-L.
-
Figure 5—figure supplement 1—source data 1
Original file for the western blot analysis in Figure 5—figure supplement 1A (anti-MFGE8 and anti-GAPDH).
- https://cdn.elifesciences.org/articles/95318/elife-95318-fig5-figsupp1-data1-v1.zip
-
Figure 5—figure supplement 1—source data 2
PDF containing Figure 5—figure supplement 1A and original scans of the relevant western blot analysis (anti-MFGE8 and anti-GAPDH) with highlighted bands and sample labels.
- https://cdn.elifesciences.org/articles/95318/elife-95318-fig5-figsupp1-data2-v1.zip
-
Figure 5—figure supplement 1—source data 3
Original file for the western blot analysis in Figure 5—figure supplement 1D (anti-Flag and anti-GAPDH).
- https://cdn.elifesciences.org/articles/95318/elife-95318-fig5-figsupp1-data3-v1.zip
-
Figure 5—figure supplement 1—source data 4
PDF containing Figure 5—figure supplement 1D and original scans of the relevant western blot analysis (anti-Flag and anti-GAPDH) with highlighted bands and sample labels.
- https://cdn.elifesciences.org/articles/95318/elife-95318-fig5-figsupp1-data4-v1.zip
Figure 6 with 1 supplement
RBM7 knockdown enhanced aggressiveness of breast cancer relying on MFGE8 splicing switch to the short variant and NF-κB pathway activation.
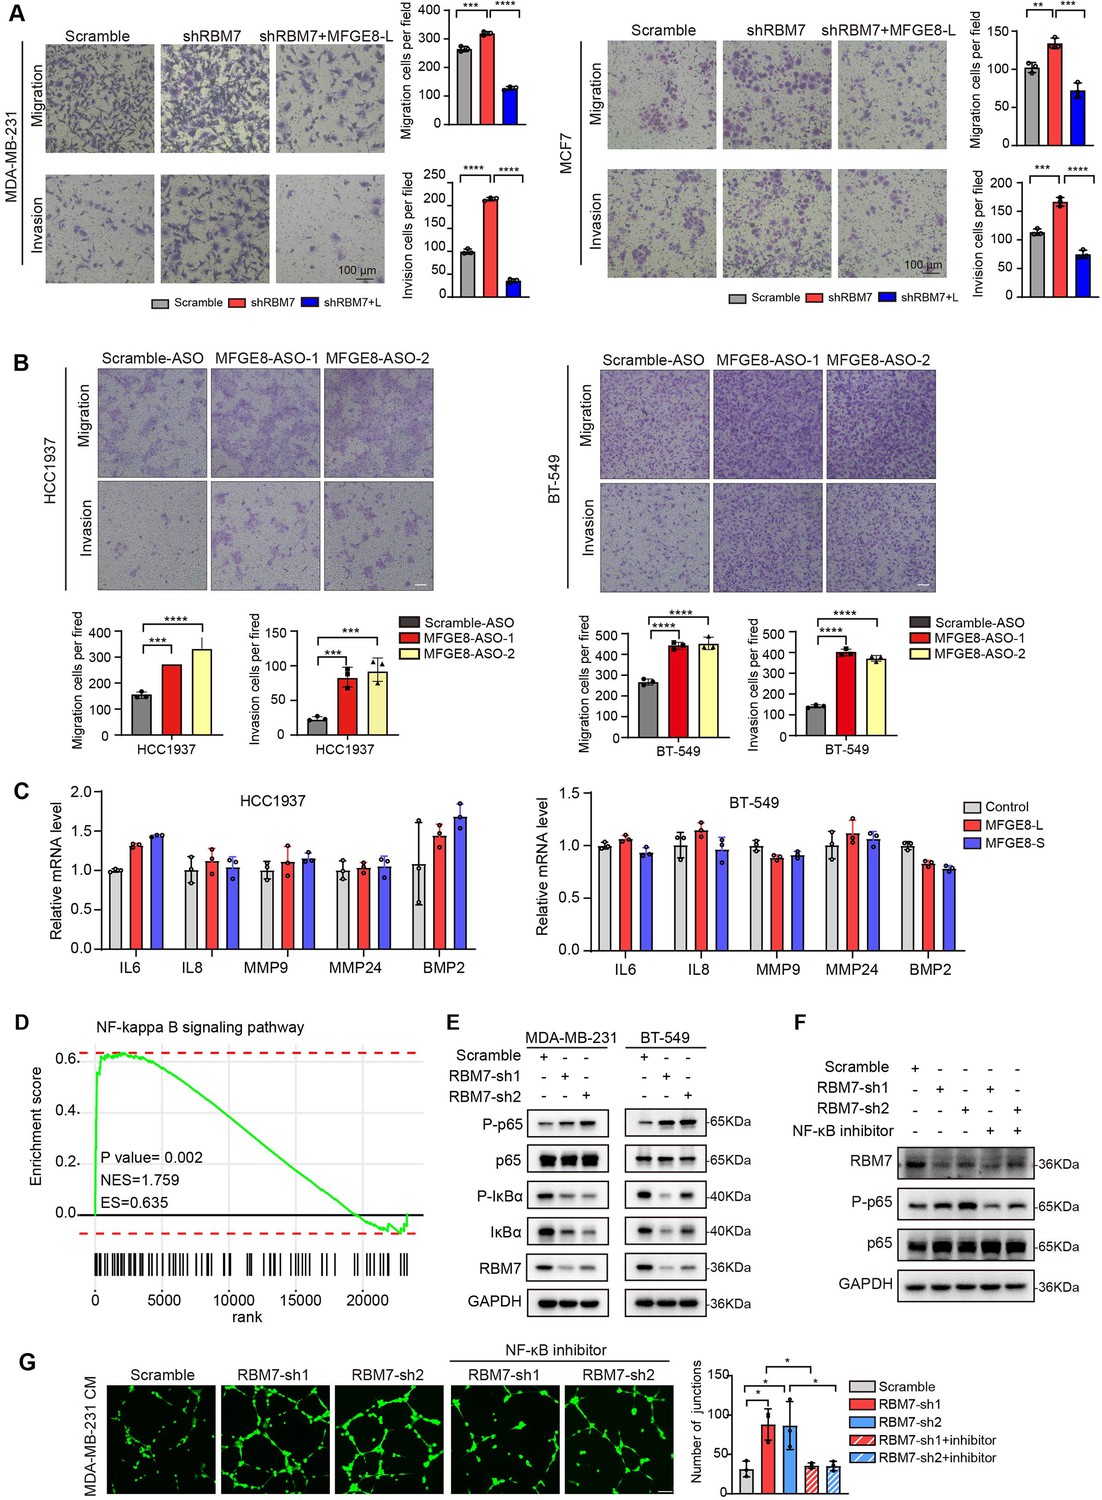
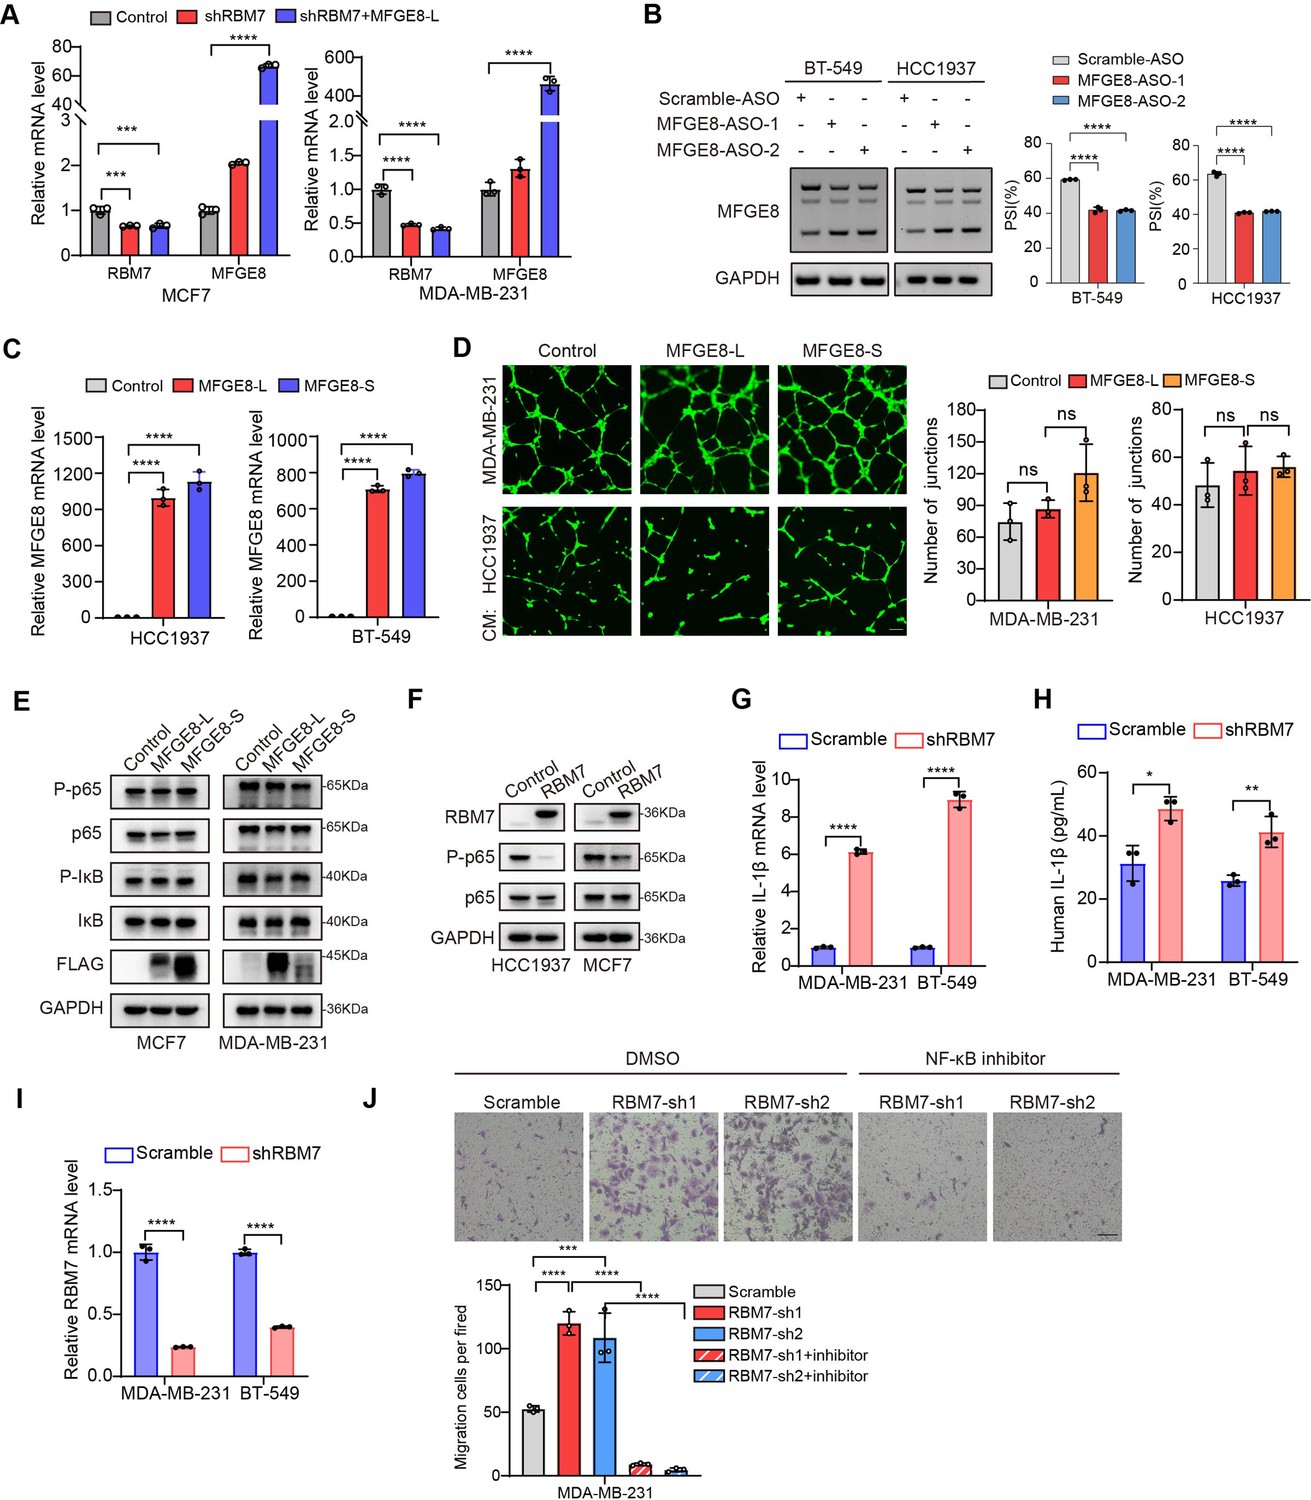
(A) Breast cancer cells MDA-MB-231 and MCF7 were cotransfected with shRNA targeting RBM7 or control and shRNA-resistant Flag-MFGE8-L vectors and then subjected to transwell migration assay or invasion assay. Migrated or invaded cells were counted from random sites of the transwell with Image J. p values were determined by one-way ANOVA with Tukey’s multiple comparison test. Scale bars: 100 μm. (B) Representative transwell analysis of migrative/invasive capability of breast cancer cells transfected with 500 nM ASO directed against RBM7-binding region in MFGE8 pre-mRNA. Cells migrating through transwell membrane with matrigel or not were imaged and representative images are shown (upper) along with quantification (down). Scale bars: 100 μm.p values were determined by one-way ANOVA with Tukey’s multiple comparison test. (C) The expression of metastasis-related factors in HCC1937 and BT-549 cells stably expressing MFGE8-L, MFGE8-S or control vector was measured by real-time PCR assay. (D) NF-κB signaling pathway was enrichment via KEGG analysis in RBM7 knockdown breast cancer cells. (E) Western blotting showed the expression of p65, p-p65, IκBα and p-IκBα in NF-κB pathway in RBM7-depleted or control MDA-MB-231 and BT-549 breast cancer cells (see also Figure 6—source data 1, Figure 6—source data 2). (F) Western blotting was performed to test the expression of RBM7, p65 and p-p65 in RBM7-depleted MDA-MB-231 cells treated with or without NF-κB inhibitor PDTC 10 μm for 48 hr (see also Figure 6—source data 3, Figure 6—source data 4). (G) Representative images of the tube formation of HUVEC cells treated with conditional medium from RBM7-depleted MDA-MB-231 in the presence or absence of 10 μm NF-κB inhibitor PDTC. Scale bars: 100 μm. Quantification of junctions of endothelial network was conducted by ImageJ software. p values were determined by one-way ANOVA with Tukey’s multiple comparison test (n=3). *p < 0.05, **p < 0.01, ***p < 0.001, and ****p< 0.0001.
-
Figure 6—source data 1
Original file for the western blot analysis in Figure 6E (anti-p65, anti-P-p65, anti-IκB, anti-P-IκB, anti-RBM7, and anti-GAPDH).
- https://cdn.elifesciences.org/articles/95318/elife-95318-fig6-data1-v1.zip
-
Figure 6—source data 2
PDF containing Figure 6E and original scans of the relevant western blot analysis (anti-p65, anti-P-p65, anti-IκB, anti-P-IκB, anti-RBM7, and anti-GAPDH) with highlighted bands and sample labels.
- https://cdn.elifesciences.org/articles/95318/elife-95318-fig6-data2-v1.zip
-
Figure 6—source data 3
Original file for the western blot analysis in Figure 6F (anti-p65, anti-P-p65, anti-RBM7, and anti-GAPDH).
- https://cdn.elifesciences.org/articles/95318/elife-95318-fig6-data3-v1.zip
-
Figure 6—source data 4
PDF containing Figure 6F and original scans of the relevant western blot analysis (anti-p65, anti-P-p65, anti-RBM7, and anti-GAPDH) with highlighted bands and sample labels.
- https://cdn.elifesciences.org/articles/95318/elife-95318-fig6-data4-v1.zip
Figure 6—figure supplement 1
MFGE8-L/S isoforms had no effect on NF-κB pathway in breast cancer cells.
(A) MCF7 and MDA-MB-231 cells stably expressing shRNA against RBM7 with ectopic MFGE8-L or control vector were generated. The expression of RBM7 and MFGE8 was measured by qRT-PCR assay. (B) RT-PCR quantification of two MFGE8 isoforms after transfecting breast cancer cells with 500 nM ASO directed against RBM7-binding region in MFGE8 pre-mRNA. See also Figure 6—figure supplement 1—source data 1, Figure 6—figure supplement 1—source data 2. (C) HCC1937 and BT-549 cells stably expressing MFGE8-L, MFGE8-S, or control were generated. The expression of MFGE8 was measured by qRT-PCR assay. (D) Representative images of the tube formation of HUVEC cells treated with conditional medium from breasst cancer cells with ectopic expression of MFGE8-L or MFGE8-S for 48 hr. Scale bars: 100 μm. Quantification of number of junctions formed by HUVEC was determined by Image J software. (E) Western blotting results showed the phosphorylation and expression of p65 in RBM7-overexpressing breast cancer cells (see also Figure 6—figure supplement 1—source data 3, Figure 6—figure supplement 1—source data 4). (F) Western blotting was performed to detect the indicated proteins in breast cancer cells with up-expression of MFGE8-L/S (see also Figure 6—figure supplement 1—source data 5, Figure 6—figure supplement 1—source data 6). (G) The mRNA levels of IL-1β in MDA-MB-231 or BT549 cells with stable RBM7 knockdown or control vector were examined by qRT-PCR approach. (H) Supernatants from RBM7-knockdown MDA-MB-231 or BT549 cells were collected and protein expression of IL-1β was measured by ELISA kit. (I) The knockdown efficiency of RBM7 in two breast cancer cell lines were determined by qRT-PCR approach. (J) RBM7-depleted MDA-MB-231 cells were treated with or without NF-κB inhibitor PDTC 10 μm for 48 hr. Then Transwell assays were performed to assess cell migration ability. Scale bars: 100 μm. p values were calculated by one-way ANOVA with Tukey’s multiple comparisons.
-
Figure 6—figure supplement 1—source data 1
Original file for the RT-PCR analysis of MFGE8 splicing switch upon ASO treatment in Figure 6—figure supplement 1B.
- https://cdn.elifesciences.org/articles/95318/elife-95318-fig6-figsupp1-data1-v1.zip
-
Figure 6—figure supplement 1—source data 2
PDF containing Figure 6—figure supplement 1B and original scans of the relevant RT-PCR analysis for splicing switch of MFGE8 variants with highlighted bands and sample labels.
- https://cdn.elifesciences.org/articles/95318/elife-95318-fig6-figsupp1-data2-v1.zip
-
Figure 6—figure supplement 1—source data 3
Original file for the western blot analysis in Figure 6—figure supplement 1E (anti-p65, anti-P-p65, anti-IκB, anti-P-IκB, anti-Flag, and anti-GAPDH).
- https://cdn.elifesciences.org/articles/95318/elife-95318-fig6-figsupp1-data3-v1.zip
-
Figure 6—figure supplement 1—source data 4
PDF containing Figure 6—figure supplement 1E and original scans of the relevant Western blot analysis (anti-p65, anti-P-p65, anti-IκB, anti-P-IκB, anti-Flag, and anti-GAPDH) with highlighted bands and sample labels.
- https://cdn.elifesciences.org/articles/95318/elife-95318-fig6-figsupp1-data4-v1.zip
-
Figure 6—figure supplement 1—source data 5
Original file for the western blot analysis in Figure 6—figure supplement 1F (anti-p65, anti-P-p65, anti-RBM7, and anti-GAPDH).
- https://cdn.elifesciences.org/articles/95318/elife-95318-fig6-figsupp1-data5-v1.zip
-
Figure 6—figure supplement 1—source data 6
PDF containing Figure 6—figure supplement 1F and original scans of the relevant western blot analysis (anti-p65, anti-P-p65, anti-RBM7, and anti-GAPDH) with highlighted bands and sample labels.
- https://cdn.elifesciences.org/articles/95318/elife-95318-fig6-figsupp1-data6-v1.zip
Figure 7 with 1 supplement
Splicing shift of MFGE8 toward exon7 exclusion was negatively correlated with RBM7 expression in patients with breast cancer.
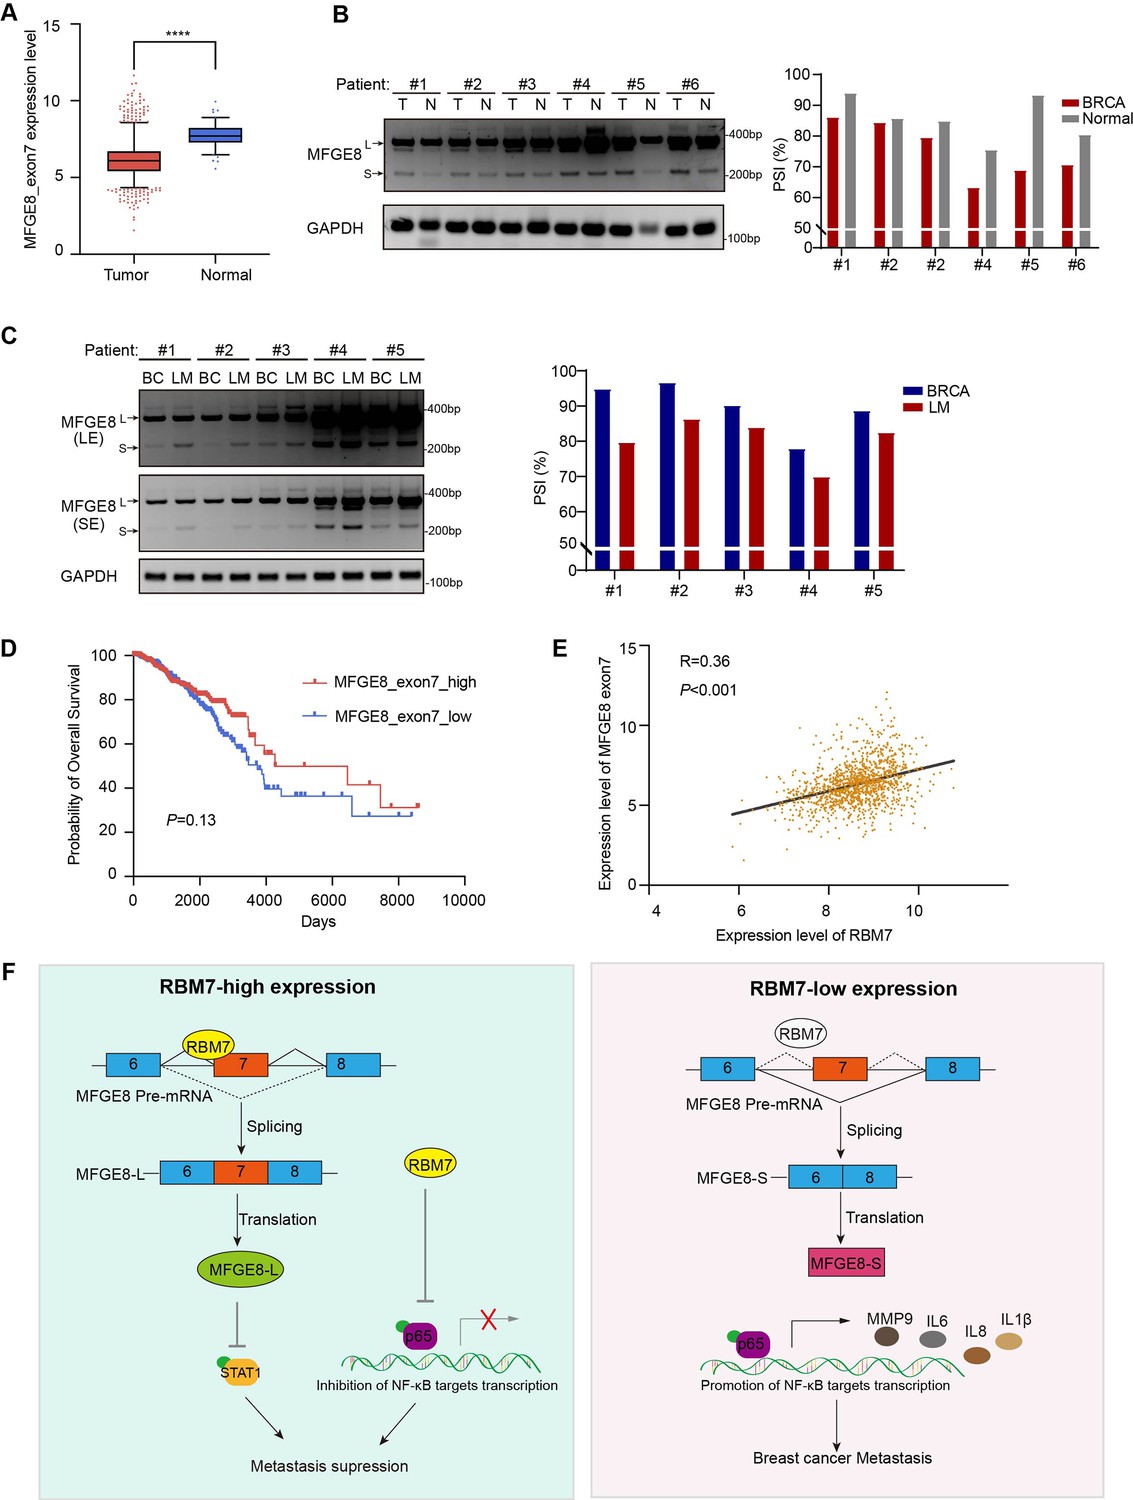
(A) MFGE8 exon7 expression level was analyzed in breast carcinoma in comparison with normal tissues based on the TCGA dataset. Plotted are the mean ± SD from 114 normal tissues and 1094 tumor tissues, with **** p<0.0001 as determined by unpaired Student’ t test. (B) The splicing alteration of MFGE8 in 6 pairs of primary breast cancer tissues and adjacent normal tissues was examined using RT-PCR (see also Figure 7—source data 1, Figure 7—source data 2). The quantification of PSI vales was based on relative band intensities using Image J software. (C) The splicing alteration of MFGE8 in primary breast cancer tissues and corresponding lymph node metastases was identified by RT-PCR assays (see also Figure 7—source data 3, Figure 7—source data 4). The quantification of PSI vales was determined by Image J software. (D) The correlation between the expression of MFGE8 exon7 and overall survival (OS) of breast cancer patients was analyzed based on the TCGA dataset. p value was assessed with Mantel-Cox log-rank test. (E) Correlation of RBM7 expression with MFGE8 exon7 levels was analyzed using Pearson’s correlation coefficient method. (F) The mechanistic model of how RBM7 regulated metastasis of breast cancer through regulating MFGE8 splicing switch.
-
Figure 7—source data 1
Original file for the RT-PCR analysis of MFGE8 splicing switch in primary breast cancer tissues and adjacent normal tissues in Figure 7B.
- https://cdn.elifesciences.org/articles/95318/elife-95318-fig7-data1-v1.zip
-
Figure 7—source data 2
PDF containing Figure 7B and original scans of the relevant RT-PCR analysis for MFGE8 splicing switch with highlighted bands and sample labels in primary breast cancer tissues and adjacent normal tissues.
- https://cdn.elifesciences.org/articles/95318/elife-95318-fig7-data2-v1.zip
-
Figure 7—source data 3
Original file for the RT-PCR analysis of MFGE8 splicing switch in primary breast cancer tissues and corresponding lymph node metastases in Figure 7C.
- https://cdn.elifesciences.org/articles/95318/elife-95318-fig7-data3-v1.zip
-
Figure 7—source data 4
PDF containing Figure 7C and original scans of the relevant RT-PCR analysis for splicing switch of MFGE8 variants with highlighted bands and sample labels in primary breast cancer tissues and corresponding lymph node metastases.
- https://cdn.elifesciences.org/articles/95318/elife-95318-fig7-data4-v1.zip
Figure 7—figure supplement 1
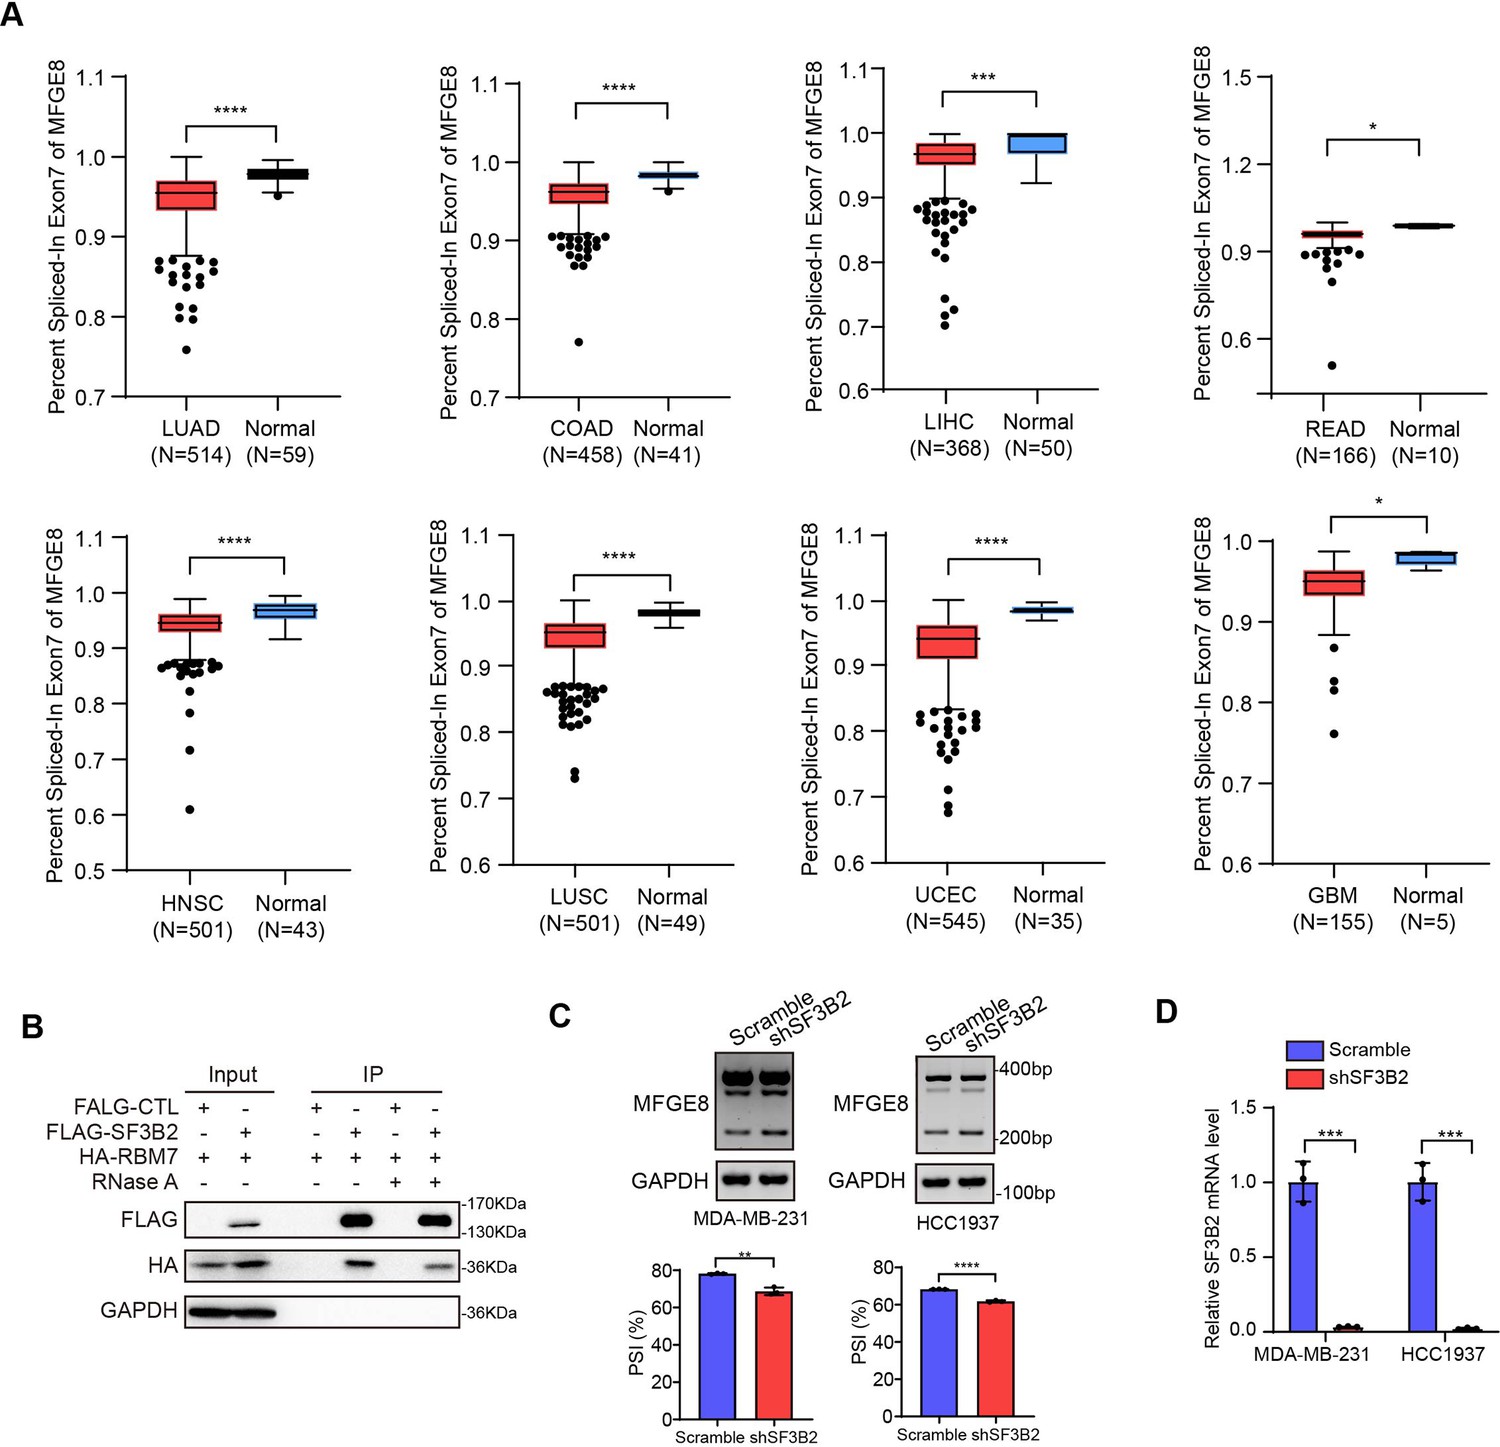
MFGE8 exon7 skipping is enhanced in a variety of cancers.
(A) The PSI values for the MFGE8 exon7 were analyzed in various cancers according to TCGA SpliceSeq dataset. p value was calculated by unpaired Student’s t-test. (B) Immunoprecipitation assay was performed in breast cancer cells expressing HA-RBM7 and Flag-SF3B2 or empty vector. The Flag-tagged precipitated complexes and lysates were analyzed through western blotting. See also Figure 7—figure supplement 1—source data 1, Figure 7—figure supplement 1—source data 2. (C) The splicing shift of MFGE8 upon SF3B2 knockdown in breast cancer cells was examined by RT-PCR approach. See also Figure 7—figure supplement 1—source data 3, Figure 7—figure supplement 1—source data 4. The mean ± SD of PSI values derived from three independent replicates is shown. (D) The SF3B2 knockdown efficiency was examined by qRT-PCR assays. p value was calculated by unpaired Student’s t-test.
-
Figure 7—figure supplement 1—source data 1
Original file for the western blot analysis of Flag-tagged precipitated complexes in Figure 7—figure supplement 1B (anti-Flag, anti-HA and anti-GAPDH).
- https://cdn.elifesciences.org/articles/95318/elife-95318-fig7-figsupp1-data1-v1.zip
-
Figure 7—figure supplement 1—source data 2
PDF containing Figure 7—figure supplement 1B and original scans of the relevant western blot analysis of Flag-tagged precipitated complexes (anti-Flag, anti-HA, and anti-GAPDH) with highlighted bands and sample labels.
- https://cdn.elifesciences.org/articles/95318/elife-95318-fig7-figsupp1-data2-v1.zip
-
Figure 7—figure supplement 1—source data 3
Original file for RT-PCR analysis of splicing switch of MFGE8 upon SF3B2 knockdown in Figure 7—figure supplement 1C.
- https://cdn.elifesciences.org/articles/95318/elife-95318-fig7-figsupp1-data3-v1.zip
-
Figure 7—figure supplement 1—source data 4
PDF containing Figure 7—figure supplement 1C and original scans of the relevant RT-PCR analysis of MFGE8 splicing switch upon SF3B2 knockdown with highlighted bands and sample labels.
- https://cdn.elifesciences.org/articles/95318/elife-95318-fig7-figsupp1-data4-v1.zip
Author response image 1
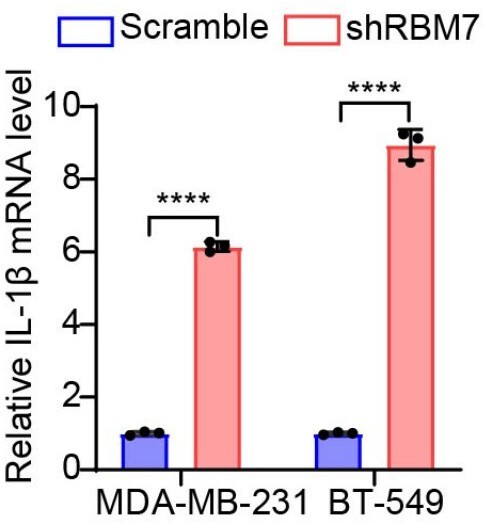
The mRNA levels of IL-1β in MDA-MB-231 or BT549 cells with stable RBM7 knockdown or control vector were examined by qRT-PCR approach.
Author response image 2

Supernatants from RBM7-knockdown MDA-MB-231 or BT549 cells were collected and protein expression of IL-1β was measured by ELISA kit.
Author response image 3

The knockdown efficiency of RBM7 in two breast cancer cell lines were determined by qRT-PCR approach.
Author response image 4

Immunoprecipitation assay was performed in breast cancer cells expressing HA-RBM7 and Flag-SF3B2 or empty vector.
The Flag-tagged precipitated complexes and lysates were analyzed through western blotting.
Author response image 5

The splicing shift of MFGE8 upon SF3B2 knockdown in breast cancer cells was examined by RT-PCR approach.
The mean ± SD of PSI values derived from three independent replicates is shown.
Author response image 6
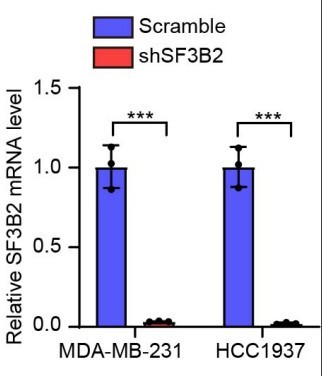
The SF3B2 knockdown efficiency was examined by qRT-PCR.
Author response image 7

Gelatin degradation assay was performed to test the effect of RBM7 knockdown on invadopodia function.
10000 cells were plated onto FITC-gelatin substrates (Green) and cultured for 48 h. Representative images are shown (red, Cy3-phalloidin; blue, DAPI) and the degraded areas were quantified by Image J software. Scar bars = 50 μm. P values were determined by one-way ANOVA with Tukey's multiple comparison test (n = 3).
Author response image 8

Representative transwell analysis of migrative/invasive capability of breast cancer cells transfected with 500 nM ASO directed against RBM7-binding region in MFGE8 pre-mRNA.
P values were determined by one-way ANOVA with Tukey's multiple comparison test.
Author response image 9

RT-PCR quantification of two MFGE8 isoforms after transfecting breast cancer cells with 500 nM ASO directed against RBM7-binding region in MFGE8 pre-mRNA.
P values were calculated by one-way ANOVA with Tukey's multiple comparison test.
Author response image 10

Upper: the red line in diagram indicates ASOs targeting region which contains UUUCUU; down: MCF7 and MDA-MB-231 cells were transfected with ASOs targeting MFGE8 pre-mRNA for 48h and then applied for RT-PCR identification.
P values were determined by one-way ANOVA with Tukey's multiple comparison test.
Author response image 11

Upper: MFGE8 min-splicing reporters with mutation in the RBM7 binding site or a non-specific binding were generated and shown in cartoon; down: RT-PCR assays were performed to identify the splicing outcomes of MFGE8 reporter while RBM7 was depleted in breast cancer cells.
Author response image 12

Schematic diagram of the domain composition of two MFGE8 isoforms.
Upper: the full-length variant with exon7 indicated by yellow square; down: the truncated variant with exon7 skipping.
Author response image 13

The model structure of two MFGE8 isoforms was implemented using SwissModel software.
The F5/8 type C2 protein domain excluded from MFGE8-S variant was marked in red.
Author response image 14

The splicing alteration of MFGE8 in 6 pairs of primary breast cancer tissues and adjacent normal tissues was examined using RT-PCR.
The quantification of PSI vales was based on relative band intensities using Image J software.
Author response image 15

The splicing alteration of MFGE8 in primary breast cancer tissues and corresponding lymph node metastases was identified by RT-PCR assays.
The quantification of PSI vales wa determined by Image J software.
Additional files
Download links
A two-part list of links to download the article, or parts of the article, in various formats.
Downloads (link to download the article as PDF)
Open citations (links to open the citations from this article in various online reference manager services)
Cite this article (links to download the citations from this article in formats compatible with various reference manager tools)
RBM7 deficiency promotes breast cancer metastasis by coordinating MFGE8 splicing switch and NF-kB pathway
eLife 13:RP95318.
https://doi.org/10.7554/eLife.95318.3


