Mechanism of dimer selectivity and binding cooperativity of BRAF inhibitors
- Department of Pharmaceutical Sciences, University of Maryland School of Pharmacy, United States
- Division of Applied Regulatory Science, Office of Clinical Pharmacology, Office of Translational Sciences, Center for Drug Evaluation and Research, United States Food and Drug Administration, United States
- Department of Biochemistry, Department of Medicine, Department of Oncology, Montefiore Einstein Comprehensive Cancer Center, Albert Einstein College of Medicine, United States
- Department of Oncological Sciences, Icahn School of Medicine at Mount Sinai, United States
Figures
Figure 1 with 3 supplements
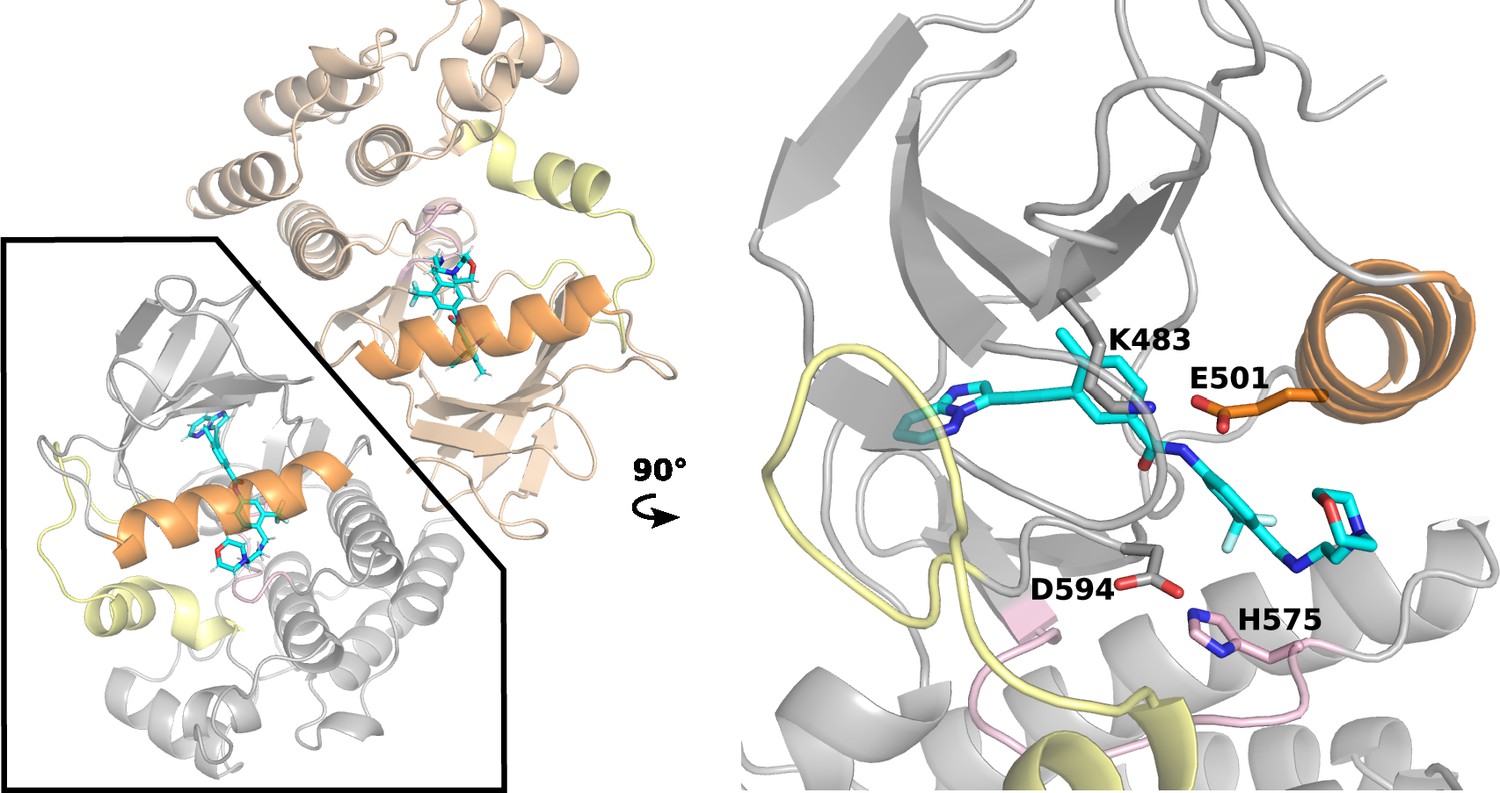
The X-ray structure of the BRAFV600E dimer in complex with PHI1.
Left. Cartoon representation of the BRAFV600E dimer in complex with PHI1 (PDB: 6P7G Cotto-Rios et al., 2020, two protomers are colored tan and grey). The αC-helix, a-loop, and c-loop are colored orange, yellow, and pink, respectively. Right. A zoomed-in view of a PHI1-bound protomer. PHI1 and the sidechains of DFG-Asp594, αC-Glu501, catalytic Lys483, and HRD-His574 are shown as sticks.
Figure 1—figure supplement 1

Visualization of the H510-H477-D595 interactions at the dimer interface of BRAFV600E.
Left. Visualization of the BRAFV600E dimer (PDB ID: 6 P7G) (Cotto-Rios et al., 2020). The αC helix is colored brown and PHI1 is colored cyan. The dimer interface residues H477, H510, and D595 are shown in sticks. Right. A zoomed-in view of the interactions between H477 in protomer A (light brown color) and H510 or D595 in the protomer B (grey color).
Figure 1—figure supplement 2
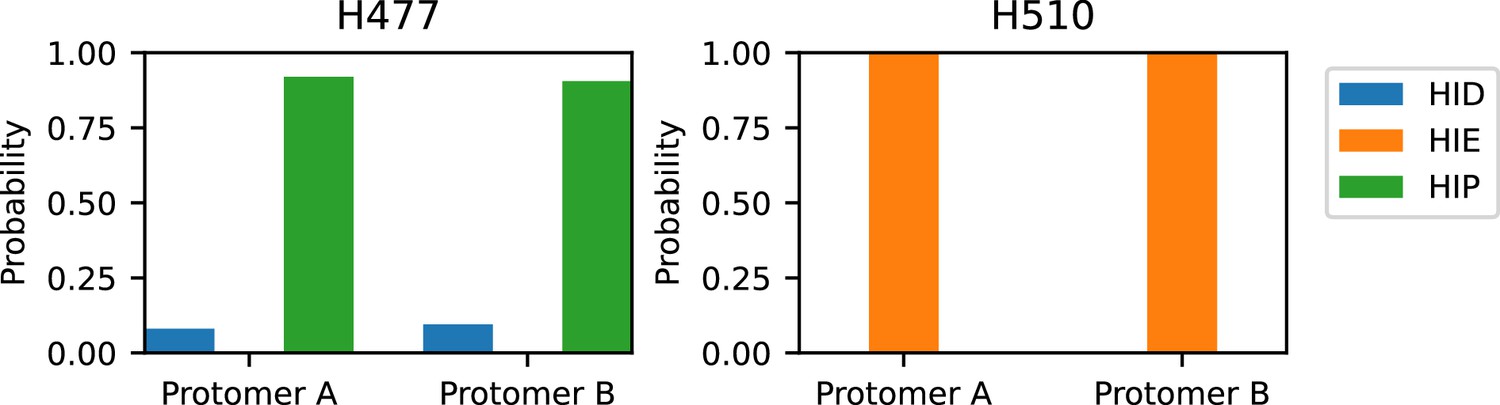
Protonation and tautomer states of the interface histidines determined by the all-atom PME-CpHMD titration.
Left. Calculated probabilities of the neutral (HID in blue, HIE in orange) and charged (HIP in green) states for H477 (left) and H510 (right) at pH 7.5. The probabilities of protonation states for either histidine is nearly identical between the two protomers. As a default in the CpHMD program (Harris et al., 2022), the charged HIP state was defined by, while the neutral states were defined by and (HID) or (HIE). The last 5 ns of the replica runs were used for the calculation.
Figure 1—figure supplement 3
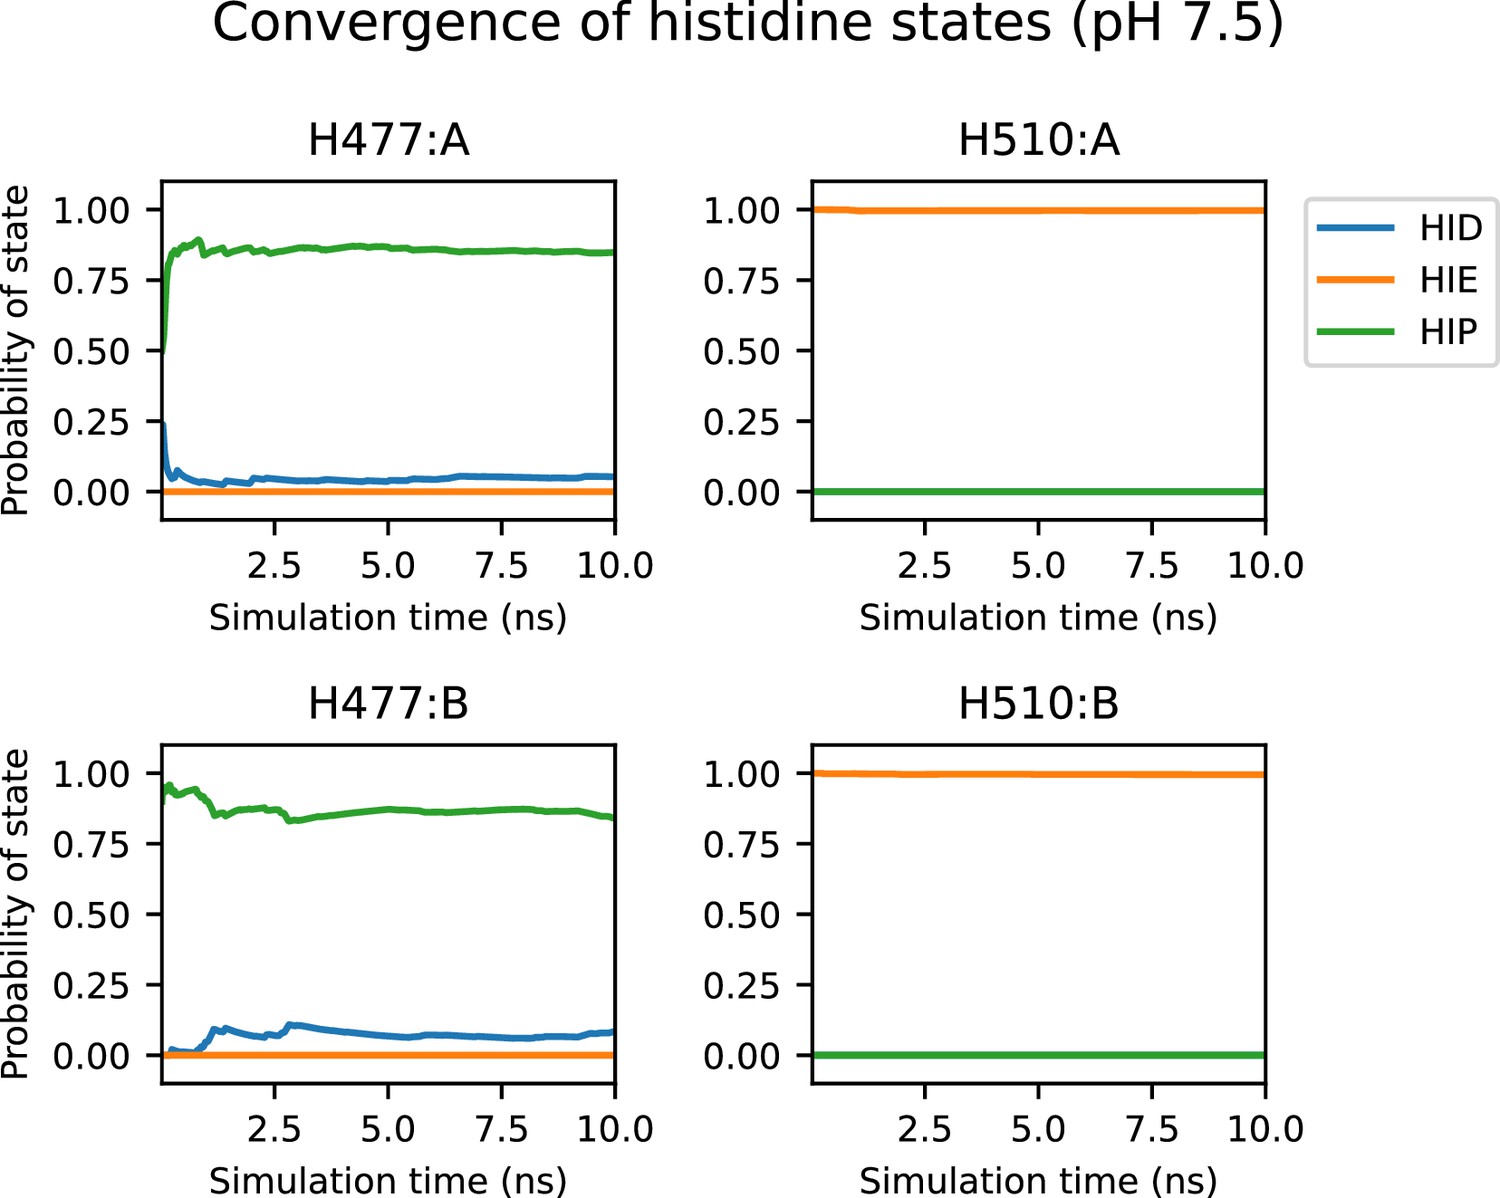
Convergence of the protonation/tautomer states of H477 and H510 at pH 7.5.
Running average probability of each protonation/tautomer state for H477 and H510 at pH 7.5 as a function of simulation time (top plots for protomer A and bottom plots for protomer B). Convergence of the probability occurs after roughly 2 ns, with little change after 5 ns.
Figure 2 with 1 supplement
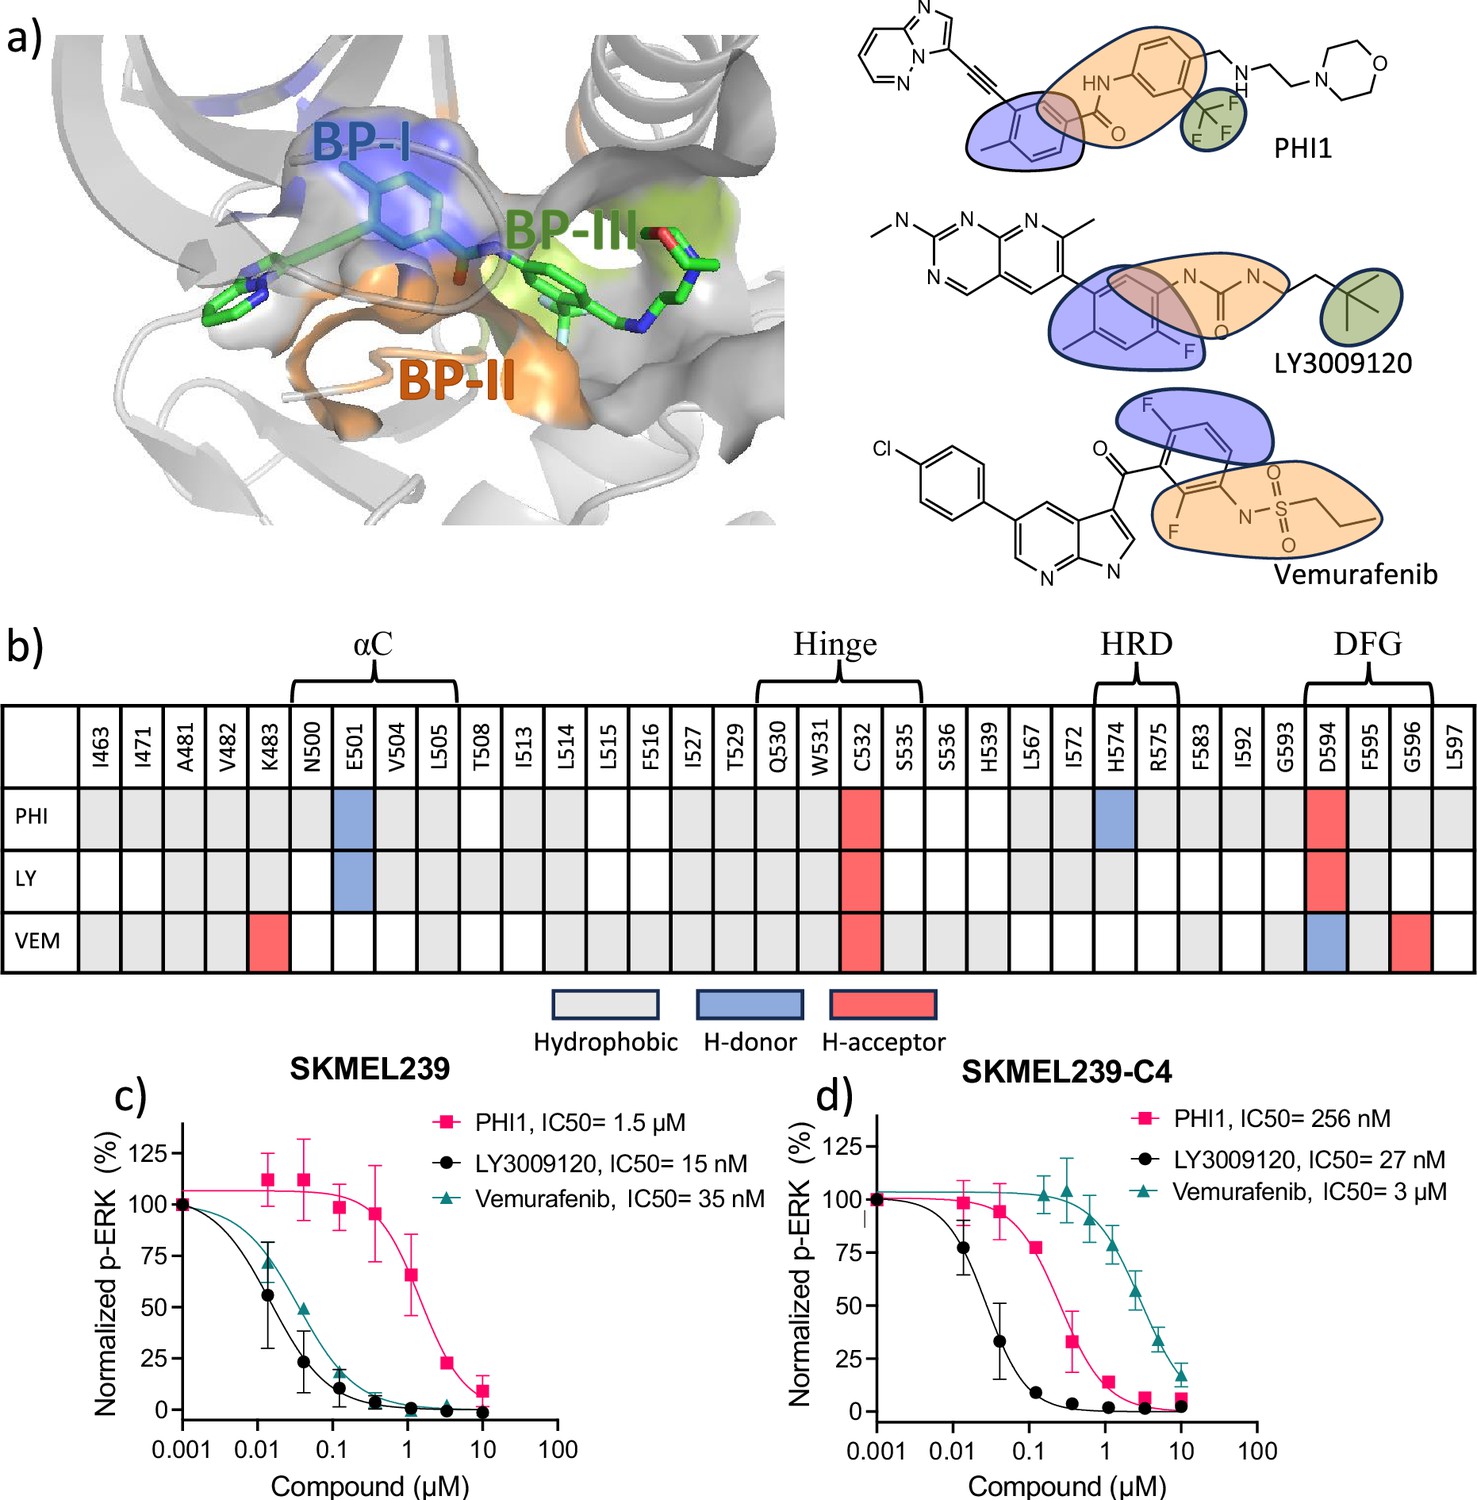
Protein-ligand interaction fingerprints for PHI1, LY3009120, Vermurafenib, and the inhibition of ERK1/2 phosphorylation in melanoma cells.
a) Left. Visualization of the back pockets (BPs) in BRAFV600E in complex with PHI1. BP-I, BP-II, and BP-III are colored blue, orange, and green, respectively. BP definitions of Liao, 2007) are followed. (a) Right. Chemical structures of the example dimer selective (PHI1), equipotent (LY3009120 or LY), and monomer selective (Vermurafenib or VEM) inhibitors of BRAFV600E. Portions of structures are highlighted according to the BPs they occupy in the co-crystal structure (PDB IDs: 6P7G, 5C9C, and 4RZV). (b) Protein-ligand interaction fingerprints for PHI1, LY, and VEM in BRAFV600E according to the co-crystal structures (PDB IDs: 6P7G, 5C9C, and 4RZV). White indicates no interaction, while grey, blue, and red indicate hydrophobic, h-bond donor (H-donor) and acceptor (H-acceptor) interactions, respectively. These interactions were calculated by KLIFS (Kooistra et al., 2016) and manually verified and corrected. A h-bond was defined using the donor-accept distance cutoff of 3.5 Å, and a hydrophobic contact cutoff of 4 Å was used for aromatic interactions and 4.5 Å for non-aromatic interactions. For simplicity, aromatic face-to-face interactions are indicated as hydrophobic. An extensive list of monomer-selective and dimer-compatible inhibitors with co-crystal structures is given in Supplementary file 1A. (c,d) Inhibition of ERK1/2 T202/Y204 phosphorylation in SKMEL239 (c) and SKMEL239-C4 (d) melanoma cells (50,000 cells/well) following one hour treatment at 37° C by PHI1, LY3009120, and Vemurafenib in different concentrations. Normalized values and non-linear regression fits of ERK phosphorylation % are shown for different compounds. Error bars represent mean ± SEM with n=3.
Figure 2—figure supplement 1
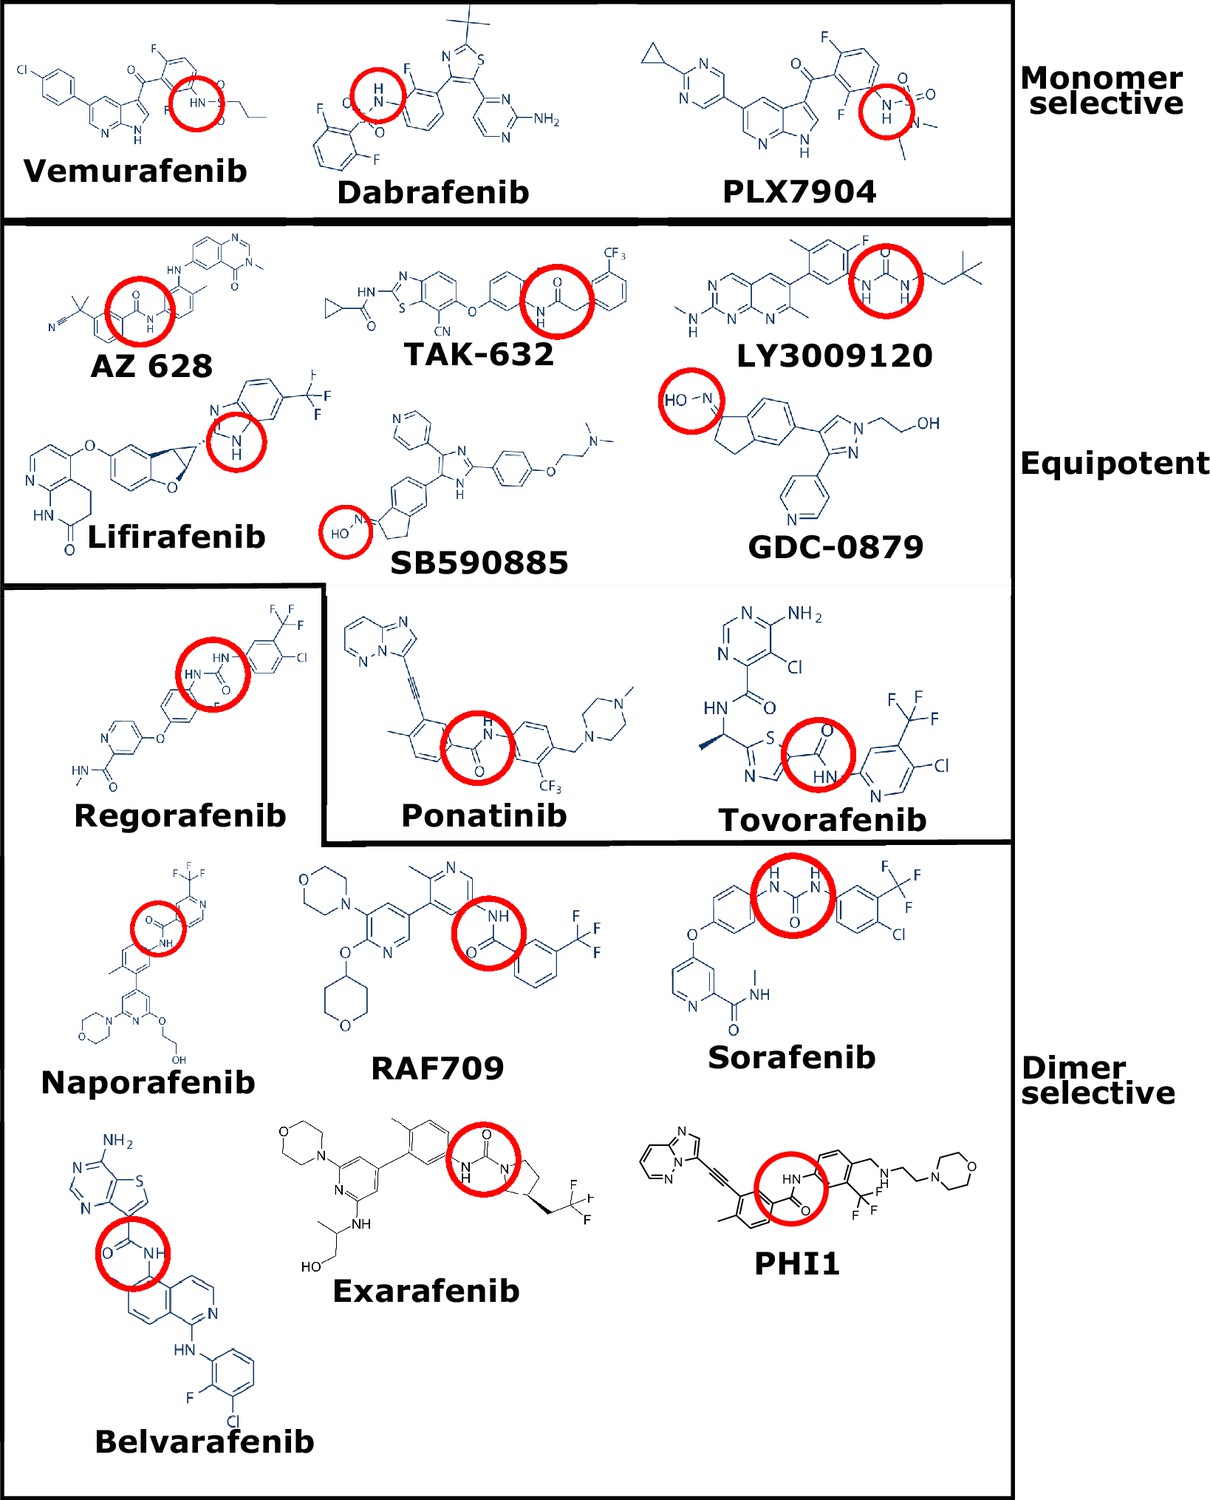
Chemical structures of the monomer-selective, equipotent, and dimer-selective BRAFV600E inhibitors in Supplementary file 1A.
The chemical group responsible for forming the hydrogen bonds with E501 and/or D594 are circled in red.
Figure 3 with 5 supplements
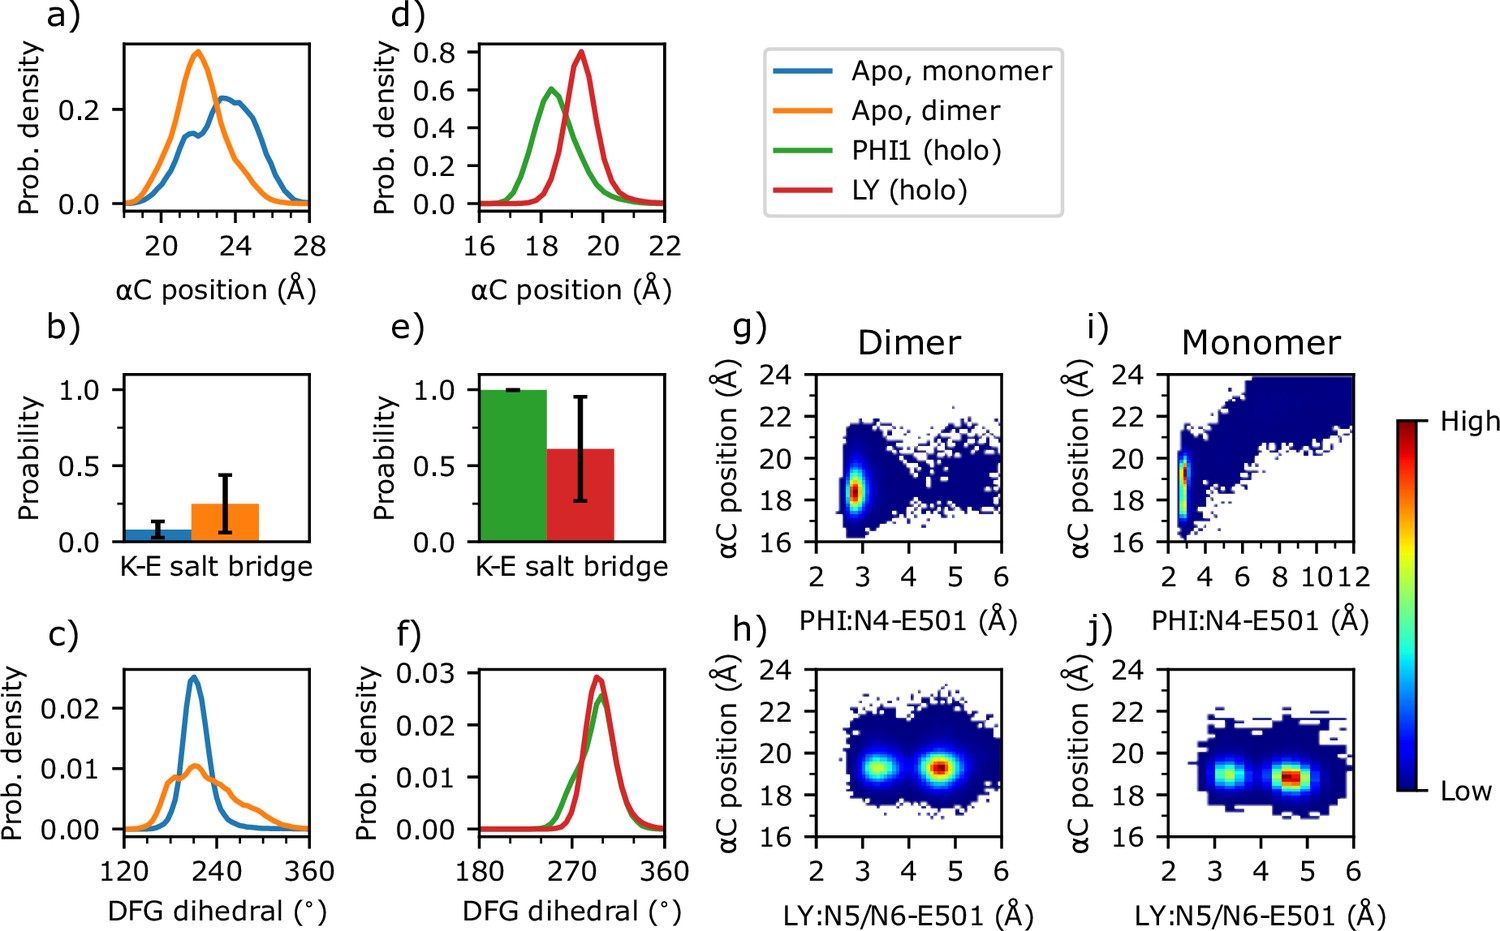
Dimerization and inhibitor binding modulate the conformation and dynamics of the αC-helix and DFG motif of BRAFV600E.
(a–f) Probability distribution of the αC position, probability of the Lys483–Glu501 salt bridge, and probability distribution of the DFG pseudo dihedral angle in the apo monomer (blue), apo dimer (orange), PHI1-bound dimer (green), and LY-bound dimer BRAFV600E (red). The αC position is defined by the distance between the Cα of Ile582 on β7 and the Cα center of mass of Asn500, Glu501, and Val502 (Kanev et al., 2021). A salt bridge between Lys483 and Glu501 is defined by a cutoff distance of 4 Å between the nitrogen of Lys483 and the nearest carboxylate oxygen of Glu501; the standard deviation of the probability across replicas (n=3) are shown as error bars. The DFG pseudo dihedral is defined by the Cα atoms of Ile592, Gly593, Asp594, and Phe595 (Möbitz, 2015). (g–j) Density plots of the αC position vs. the minimum distance between Glu501 and the amide group of PHI1 (g ,i) or LY (h, j) in the holo dimer (g, h) or holo monomer (i, j) BRAFV600E.
Figure 3—figure supplement 1
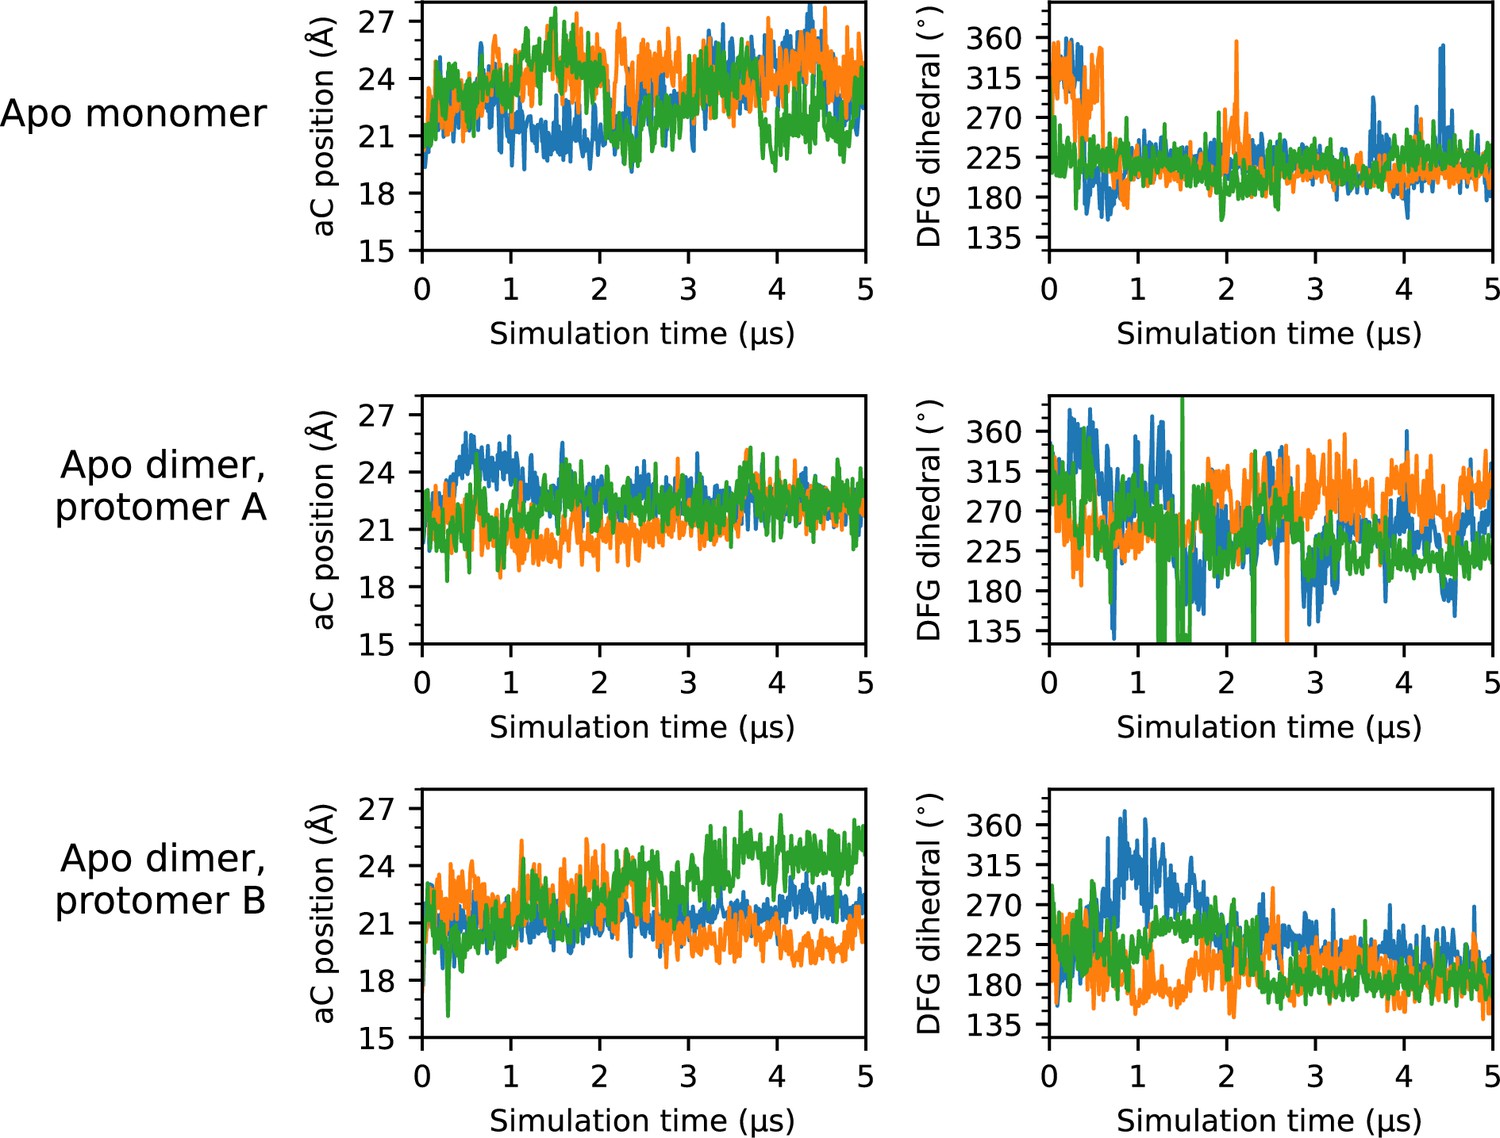
Time series of αC-helix position and DFG dihedral for all apo simulations.
Time series plots of the αC-helix position (left column) and DFG dihedral (right column) for each apo protomer simulated. Each of the three replicas are represented as a separate line; for simplicity, a stride of 10 ns was used while plotting.
Figure 3—figure supplement 2
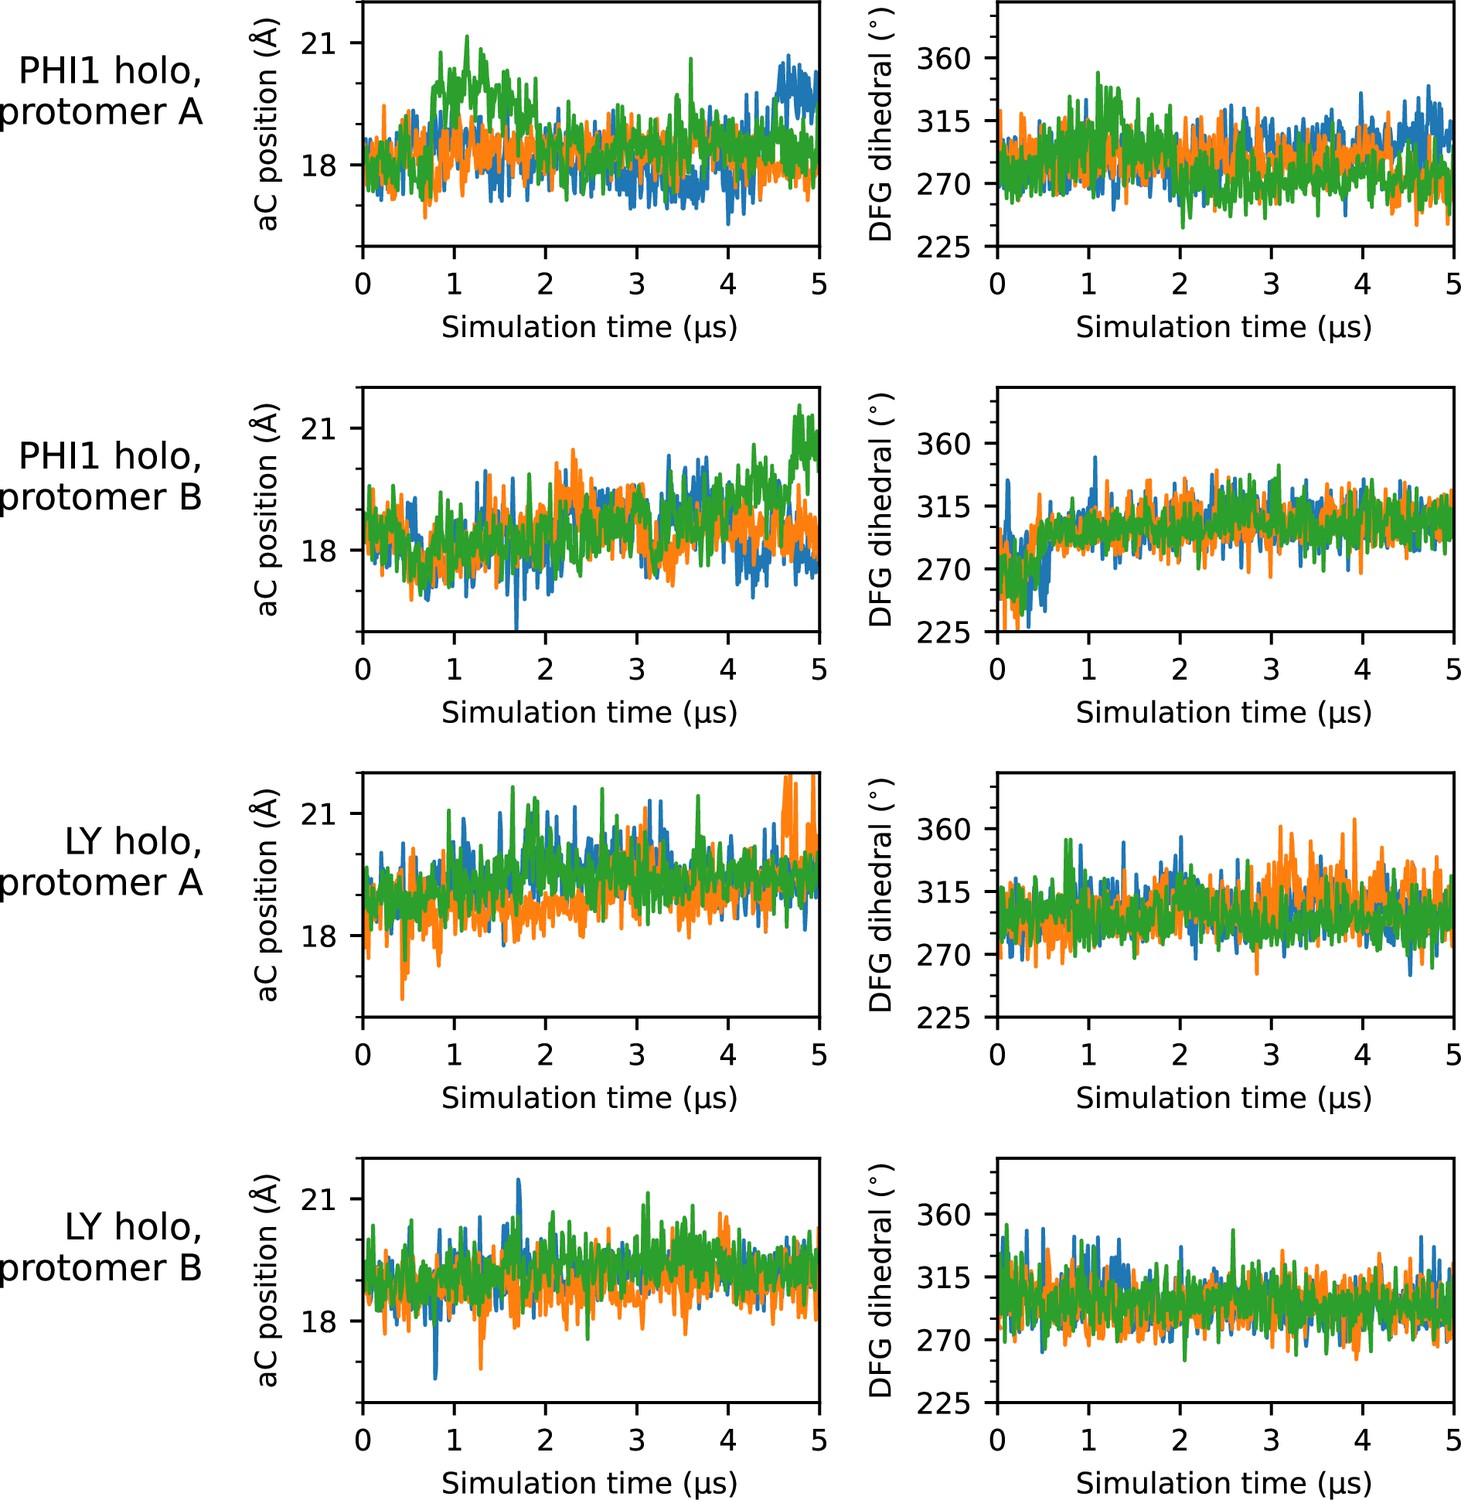
Time series of αC-helix position and DFG dihedral for all holo simulations.
Time series plots of the αC-helix position (left column) and DFG dihedral (right column) for each holo protomer simulated. Each of the three replicas are represented as a separate line; for simplicity, a stride of 10 ns was used while plotting.
Figure 3—figure supplement 3
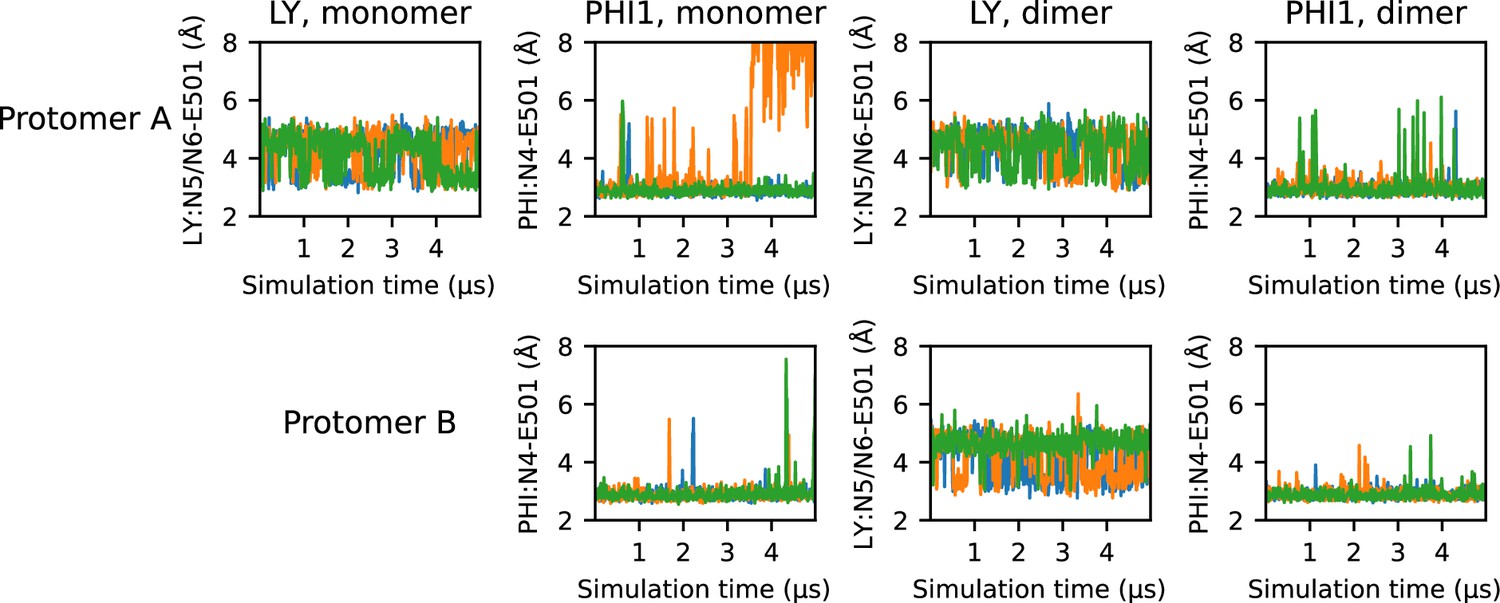
Time series of E501-ligand hydrogen bonding.
Time series of the minimum distance between E501 carboxylate oxygens and the proton donor of LY (N5 or N6) and PHI1 (N4). Each of the three replicas are represented as a separate line; for simplicity, a stride of 10 ns was used while plotting.
Figure 3—figure supplement 4
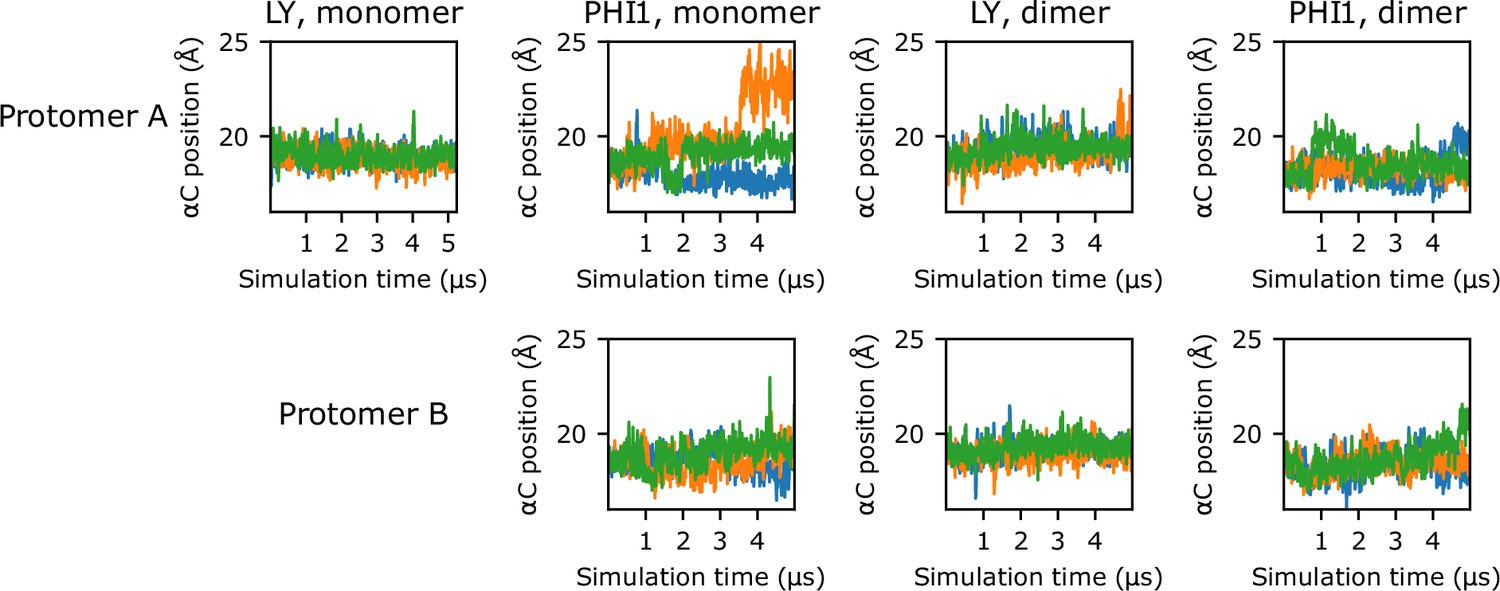
Time series of αC-helix position.
Time series of the αC-helix position for inhibited monomer and dimer simulations. Each of the three replicas are represented as a separate line; for simplicity, a stride of 10 ns was used while plotting.
Figure 3—figure supplement 5
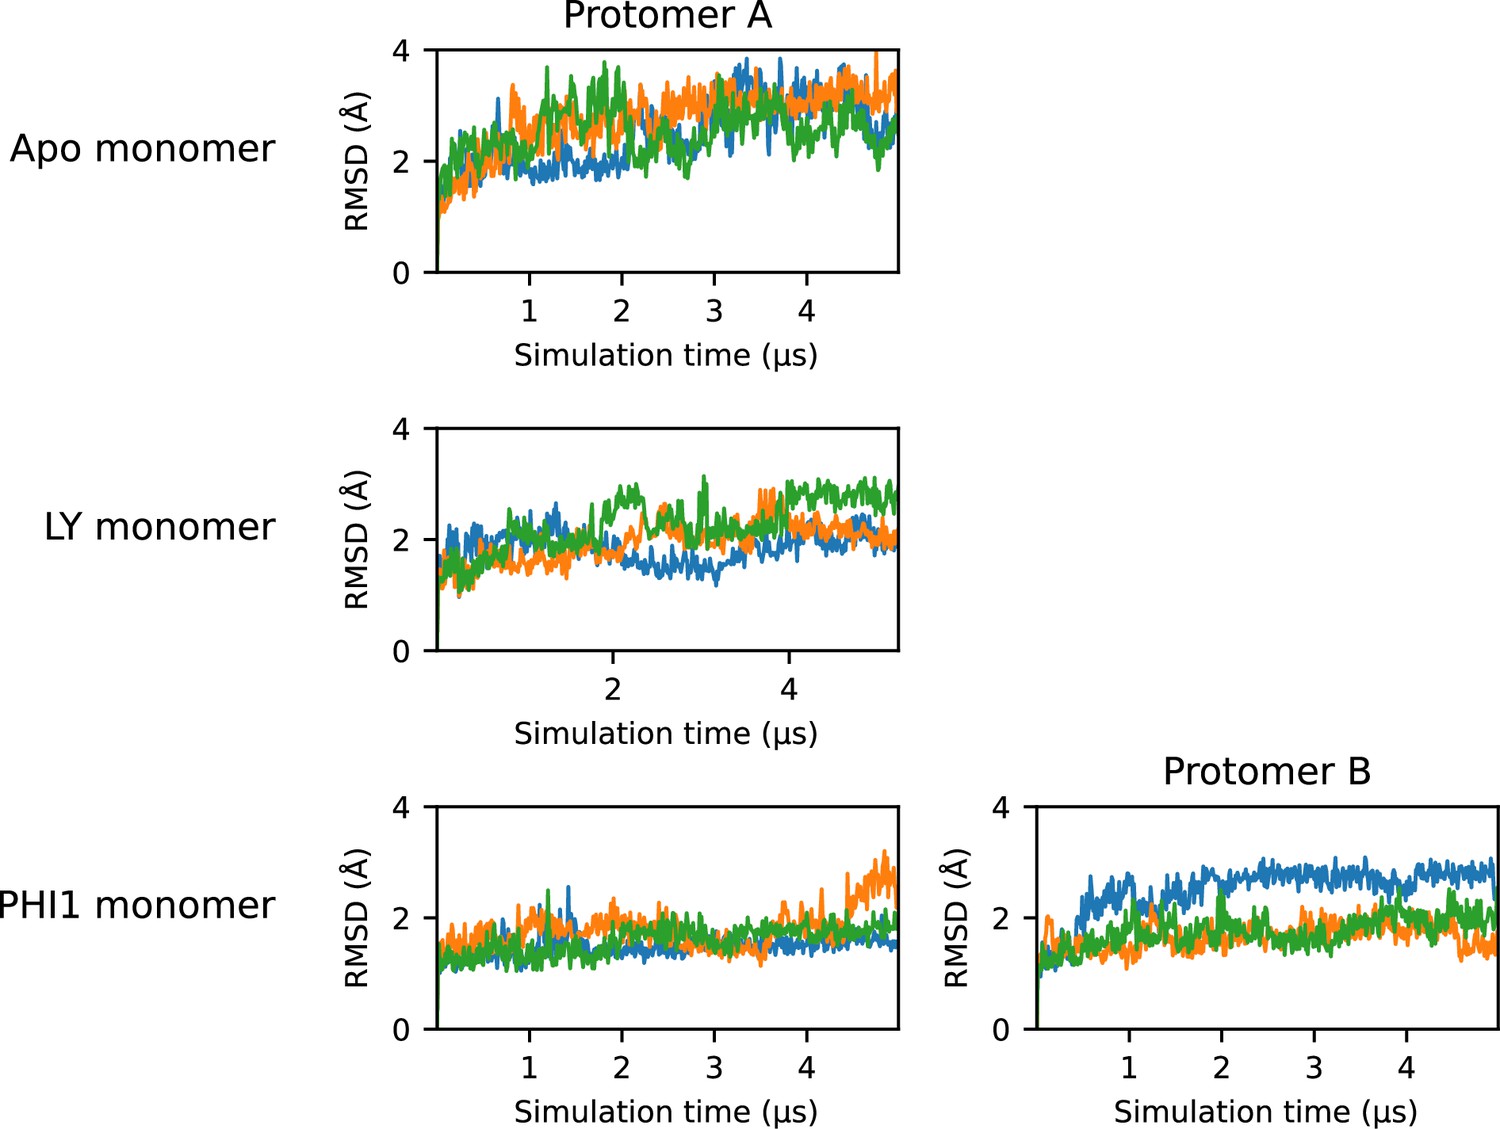
RMSD time series for the monomer simulations.
Time series plots of the root-mean-square deviation (RMSD) of the protomer in each monomer simulation. The RMSD was calculated using heavy atoms of the protomer backbone, excluding residues on the a-loop and αC-helix. Each of the three replicas are represented as a separate line; for simplicity, a stride of 10 ns was used while plotting.
Figure 4

Both PHI1 and LY stabilize the interprotomer contacts of BRAFV600E.
Left. The N-lobe (blue for A; grey for B) and C-lobe (red for A; orange for B) of each protomer in the BRAFV600E dimer are separated into different communities according to the difference contact network analysis (Yao et al., 2018). Right. The average number of interprotomer contacts was calculated for the apo and holo BRAFV600E dimer. (PHI1 top or LY(bottom)). The difference between the holo and apo contacts is shown in the graph form for PHI1 (top) and LY (bottom), and the sum (0.3) is given. Interprotomer contacts are shown as blue (more contacts in holo simulations) or red (more contacts in apo simulations) edges. The difference contact network analysis was performed using the dCNA program (Yao et al., 2018). The cutoff distance defining a contact was 4.5 Å; the threshold for determining a stable contact was set to 0.7, and the number of communities was set to 4.
Figure 5 with 2 supplements
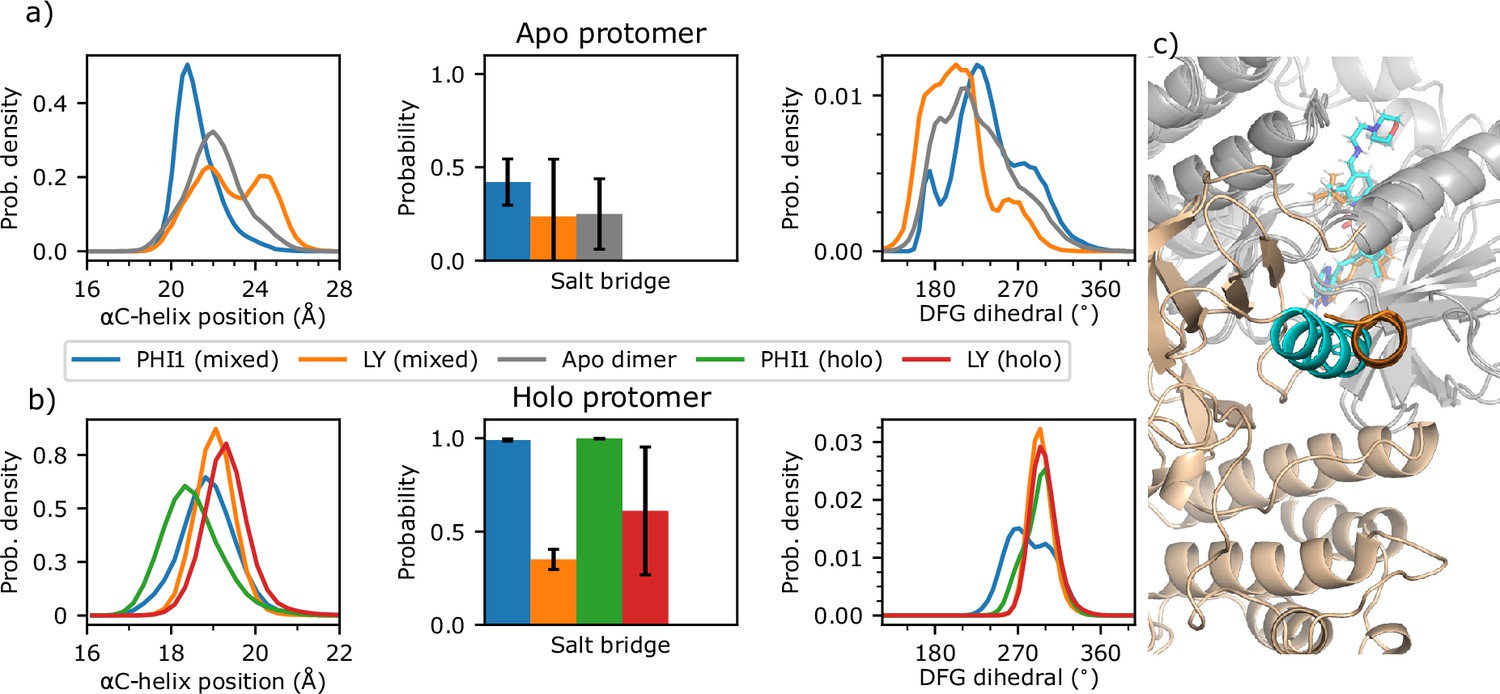
Conformation of the αC helix and DFG motif is dependent on the presence or absence of PHI1 in the second protomer.
(a) The αC helix position, probability of the Glu501–Lys483 salt bridge, and DFG pseudo dihedral of the apo protomer in the one PHI1- (blue) or one LY-bound (orange) mixed dimer simulations. As a reference, the apo dimer data is shown in grey. (b) The same quantities as in (a) but for the holo protomer in the one PHI1- (blue) or LY-bound (orange) mixed dimer simulations. As a reference, the two PHI1- and LY-bound holo dimer data are shown in green and red, respectively. The standard deviation of the probability across replicas (n=3) is shown in error bars. (c) Snapshot from both mixed dimers, after aligning the PHI1- (cyan) and LY-bound (orange) holo protomers (gray). The αC-helix of the apo protomer is highlighted in cyan for PHI1-bound and orange for LY-bound mixed dimer. For simplicity, only the apo protomer from the PHI1-bound mixed dimer is shown.
Figure 5—figure supplement 1
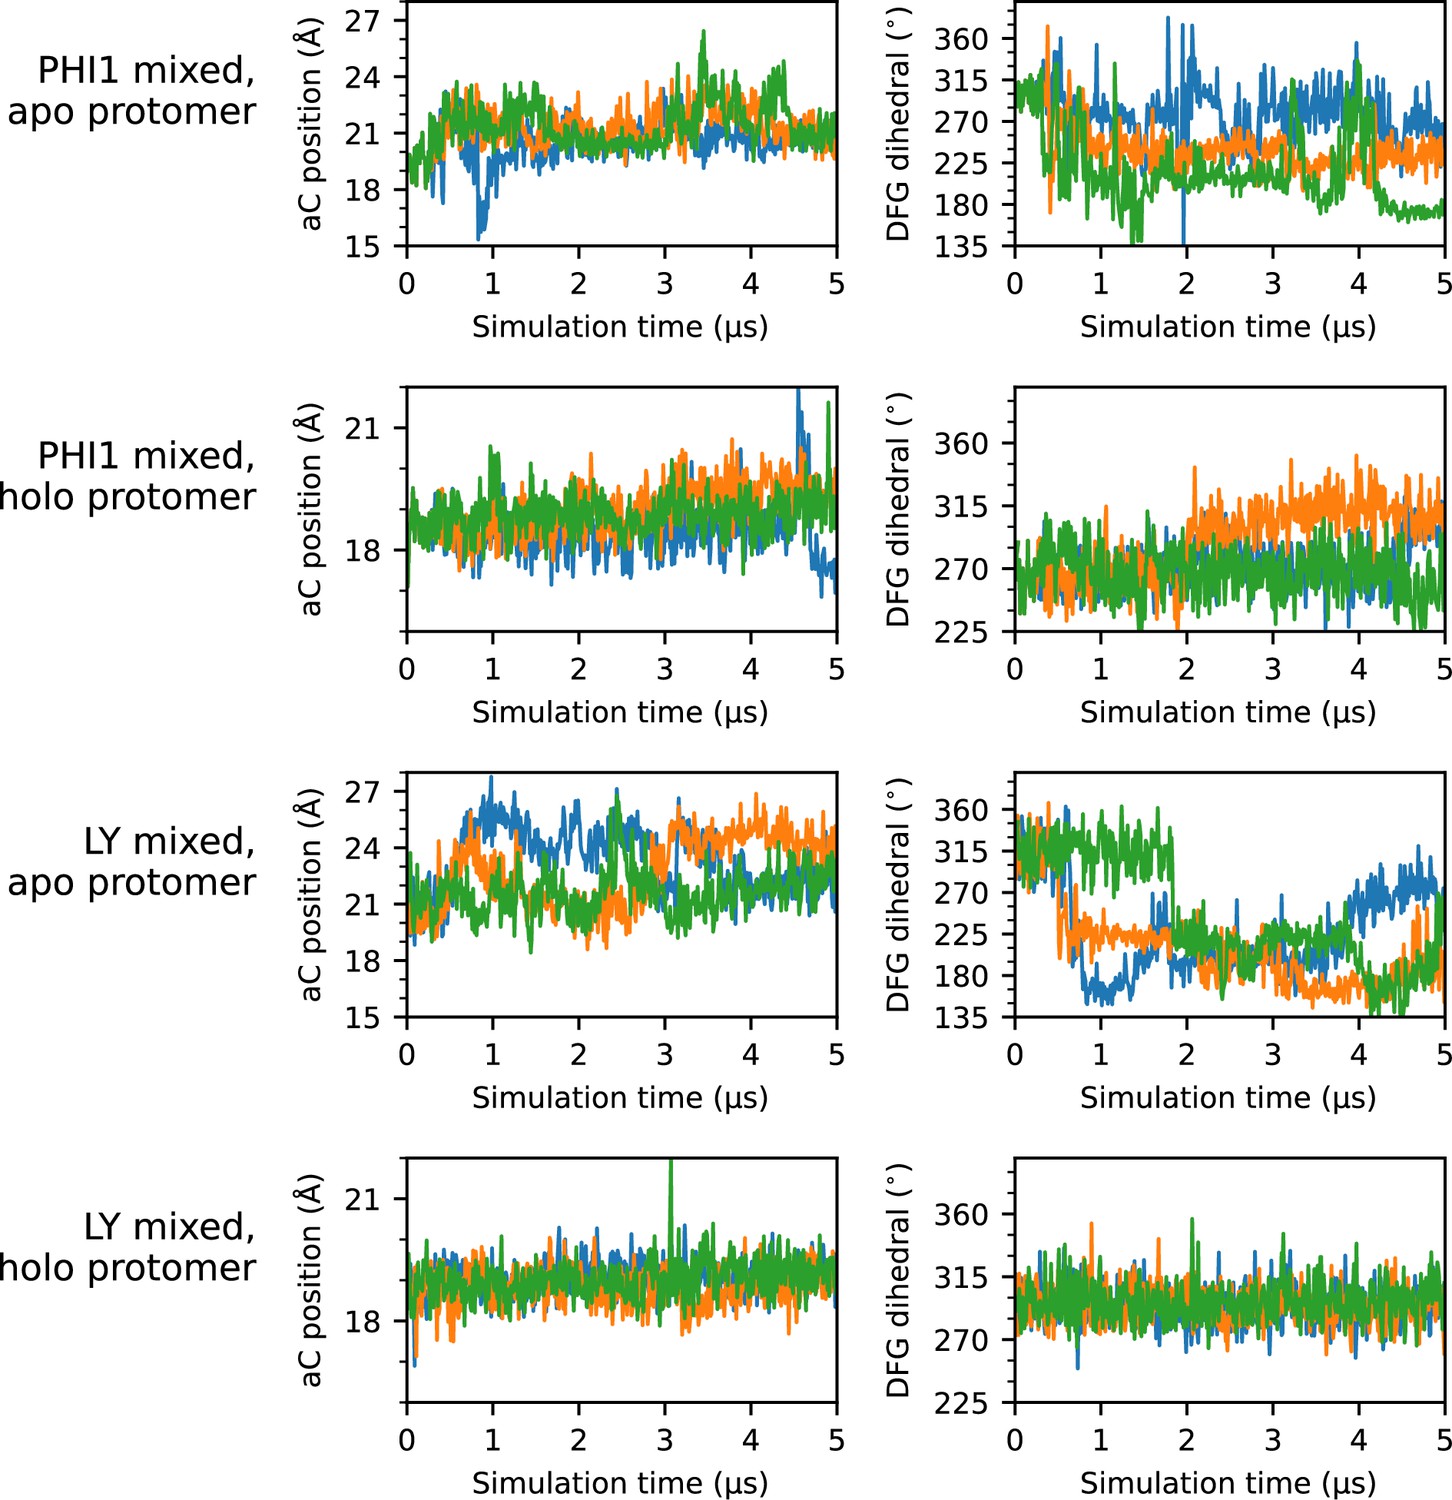
Time series of αC-helix position and DFG dihedral for all mixed simulations.
Time series plots of the αC-helix position (left column) and DFG dihedral (right column) for each protomer simulated in the mixed simulations. Each of the three replicas are represented as a separate line; for simplicity, a stride of 10 ns was used while plotting.
Figure 5—figure supplement 2
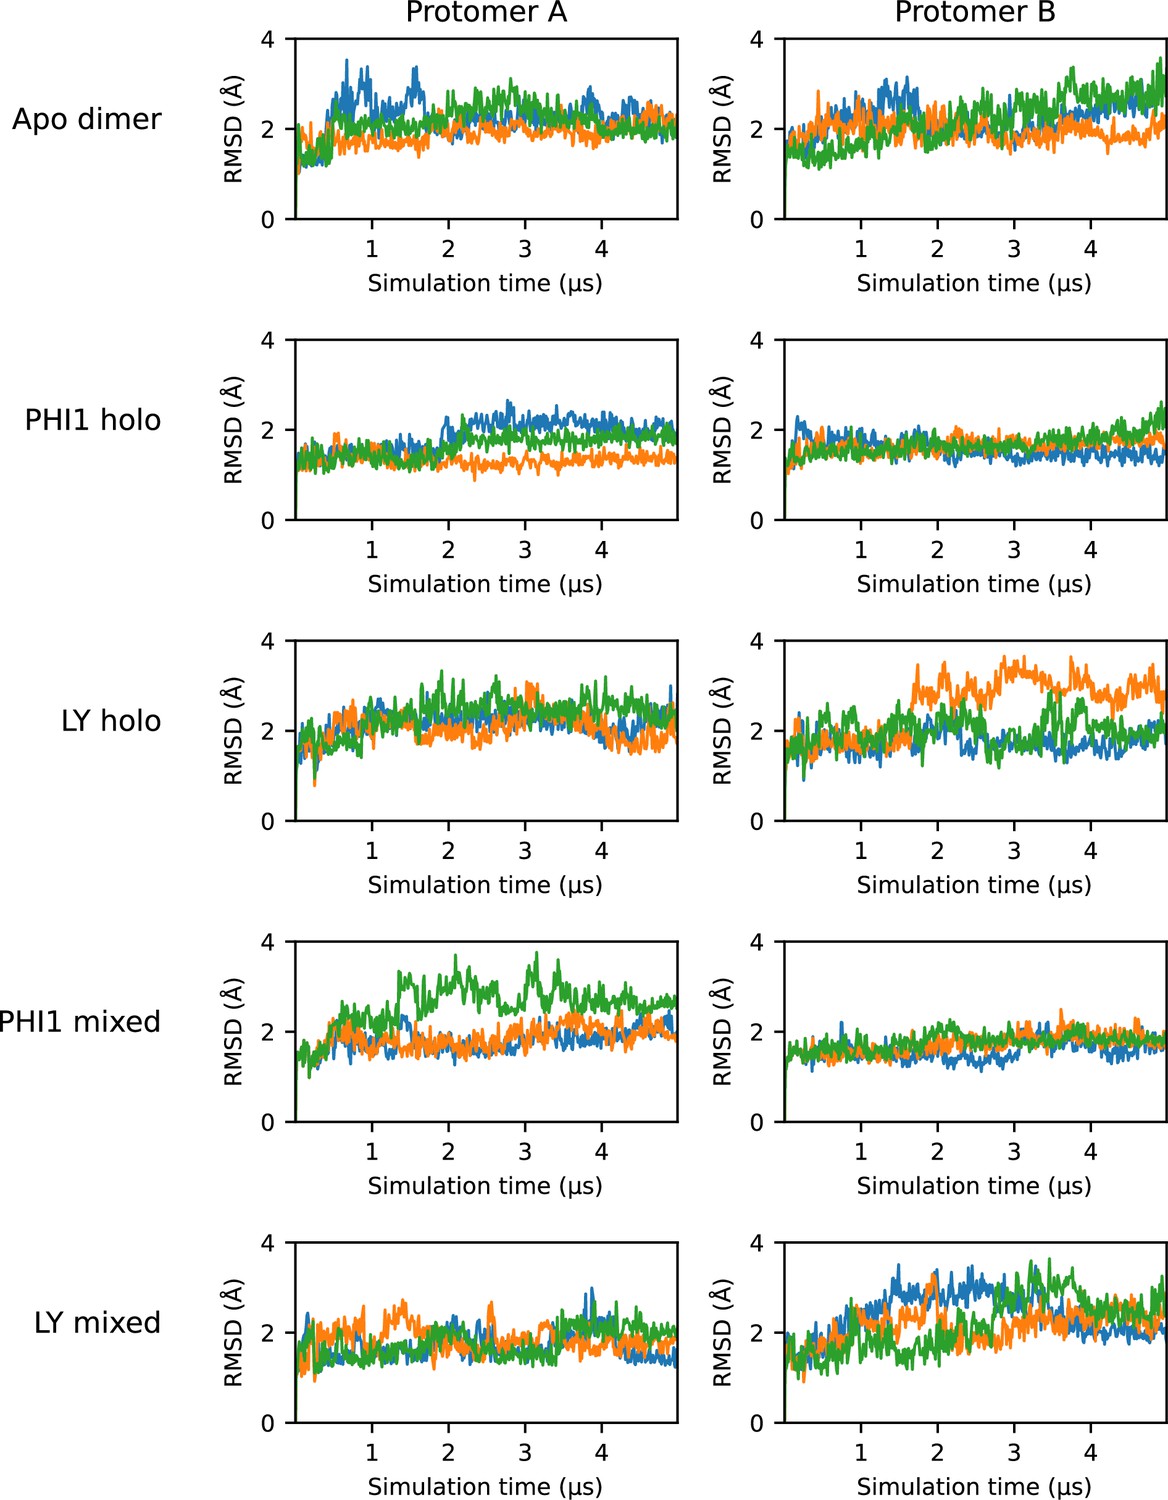
RMSD time series for the dimer simulations.
Time series plots of the RMSD of the protomer in each dimer simulation. The RMSD was calculated using heavy atoms of the protomer backbone, excluding residues on the a-loop and C-helix. Each of the three replicas are represented as a separate line; for simplicity, a stride of 10 ns was used while plotting.
Figure 6
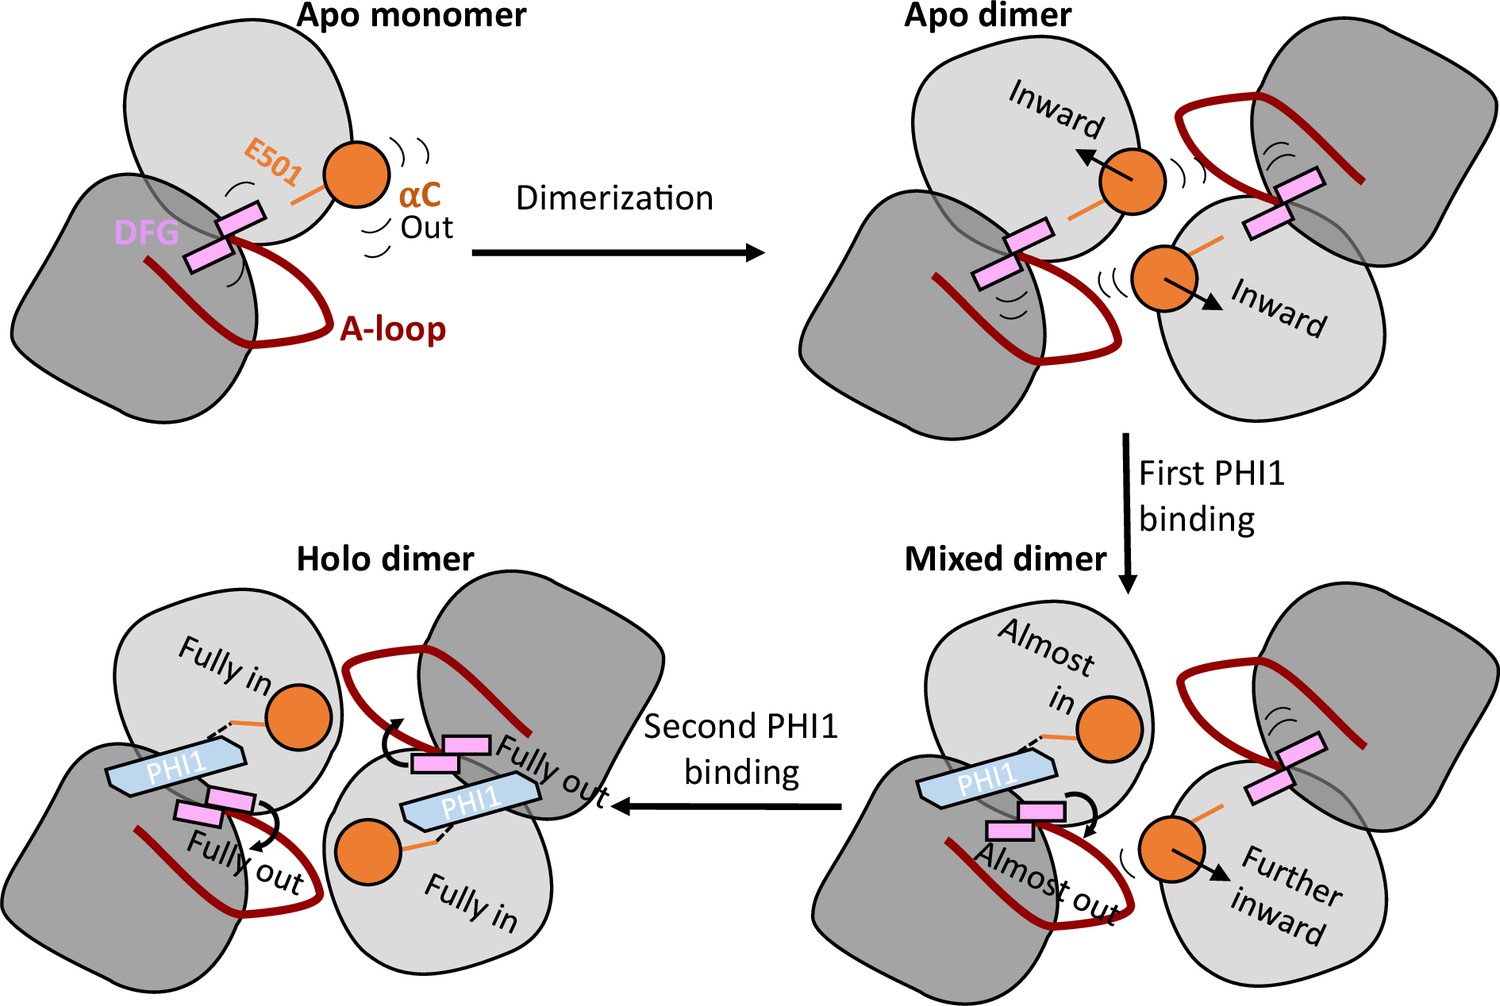
A working model that explains dimer selectivity and binding cooperativity of BRAFV600E inhibitors.
Top left. In the monomeric BRAFV600E, the αC-helix (orange) is very flexible and exclusively samples the out states. Top right. Upon dimerization, the αC-helix is restrained and shifts inward, while the DFG-motif maintains its conformation but gains significant flexibility. Bottom right. When the first PHI1 molecule binds, its amide linker donates a h-bond to the carboxylate of Glu501 (orange stick) in the first protomer, which locks the αC helix to the αC-in state; it also shifts and restricts the DFG-motif into the DFG-out state through the interaction with the DFG-Asp backbone. The αC-helix in the second unbound protomer is also affected, shifting in the direction of the inhibitor-bound state towards αC-in. Thus, the allosteric pre-organization primes the second protomer for accepting a second PHI1 molecule. Bottom left. When the second PHI1 molecule binds, the αC helix and DFG-motif in both protomers are shifted and fully locked into the αC-in and DFG-out states.
Tables
Table 1
Summary of the fixed-protonation-state MD simulations (aggregate time of 135 μs).
| No. | System | Simulation time | Starting structure |
|---|---|---|---|
| 1 | Apo monomer | 3x5μs | 6P7G(A) |
| 2 | Apo dimer | 3x5μs | 6P7G (inhibitors removed) |
| 3 | Holo monomer:PHI1 | 6x5μs | 6P7G (A:PHI1 or B:PHI1) |
| 4 | Holo monomer:LY | 3x5μs | 5C9C (A:LY) |
| 5 | Mixed dimer:PHI1 | 3x5μs | 6P7G (apo A; B:PHI1) |
| 6 | Holo dimer:2PHI1 | 3x5μs | 6P7G (A:PHI1, B:PHI1) |
| 7 | Mixed dimer:LY | 3x5μs | 5C9C (A:LY; apo B) |
| 8 | Holo dimer:2LY | 3x5μs | 5C9C (A:LY; B:LY) |
Additional files
-
MDAR checklist
- https://cdn.elifesciences.org/articles/95334/elife-95334-mdarchecklist1-v1.pdf
-
Supplementary file 1
Supplemental tables.
Table A . List of the BRAFV600E inhibitors and the structure features of the co-crystal structures in the PDB. The monomer and dimer selectivities of inhibitors in black are based on the experimental data in Adamopoulos et al., 2021 and Cotto-Rios et al., 2020 (PHI1). The monomer and dimer selectivities of inhibitors in red were predicted by us and supported by experiments in Karoulia et al., 2017 (GDC0879) and Tkacik et al., 2023 (Tovorafenib). Note, the PDB entries indicated by an astrisk are co-crystal structures in complex with the wild type BRAF (the BRAFV600E forms are unavailable). All structures contain an inhibitor in each protomer, with the exception of PLX7904; in the PDB entry 4XV1, PLX7904 is only present in protomer A. The C helix position (in Å) is defined in the main text. Two values refer to the two protomers. The back pockets (BPs) occupied was calculated by KLIFS (Kooistra et al., 2016) based on the definition of Liao, 2007. K-E refers to the distance (in Å) between the amine nitrogen of Lys483 and the nearest carboxylate oxygen of Glu501. Table B: Average value and standard deviation of reported quantities from out dimeric BRAF simulations, separated by system and protomer. Each quantity was calculated for each replica after removing the first 2 s for equilibration.
- https://cdn.elifesciences.org/articles/95334/elife-95334-supp1-v1.docx
Download links
A two-part list of links to download the article, or parts of the article, in various formats.
Downloads (link to download the article as PDF)
Open citations (links to open the citations from this article in various online reference manager services)
Cite this article (links to download the citations from this article in formats compatible with various reference manager tools)
Mechanism of dimer selectivity and binding cooperativity of BRAF inhibitors
eLife 13:RP95334.
https://doi.org/10.7554/eLife.95334.4


