Rabphilin-3A negatively regulates neuropeptide release, through its SNAP25 interaction
- Department of Functional Genomics, Faculty of Exact Science, Center for Neurogenomics and Cognitive Research, Vrije Universiteit Amsterdam and Vrije Universiteit Medical Center, Netherlands
- Department of Clinical Genetics, Center for Neurogenomics and Cognitive Research, Amsterdam Neuroscience, Vrije Universiteit Medical Center, Netherlands
Figures
Figure 1 with 1 supplement
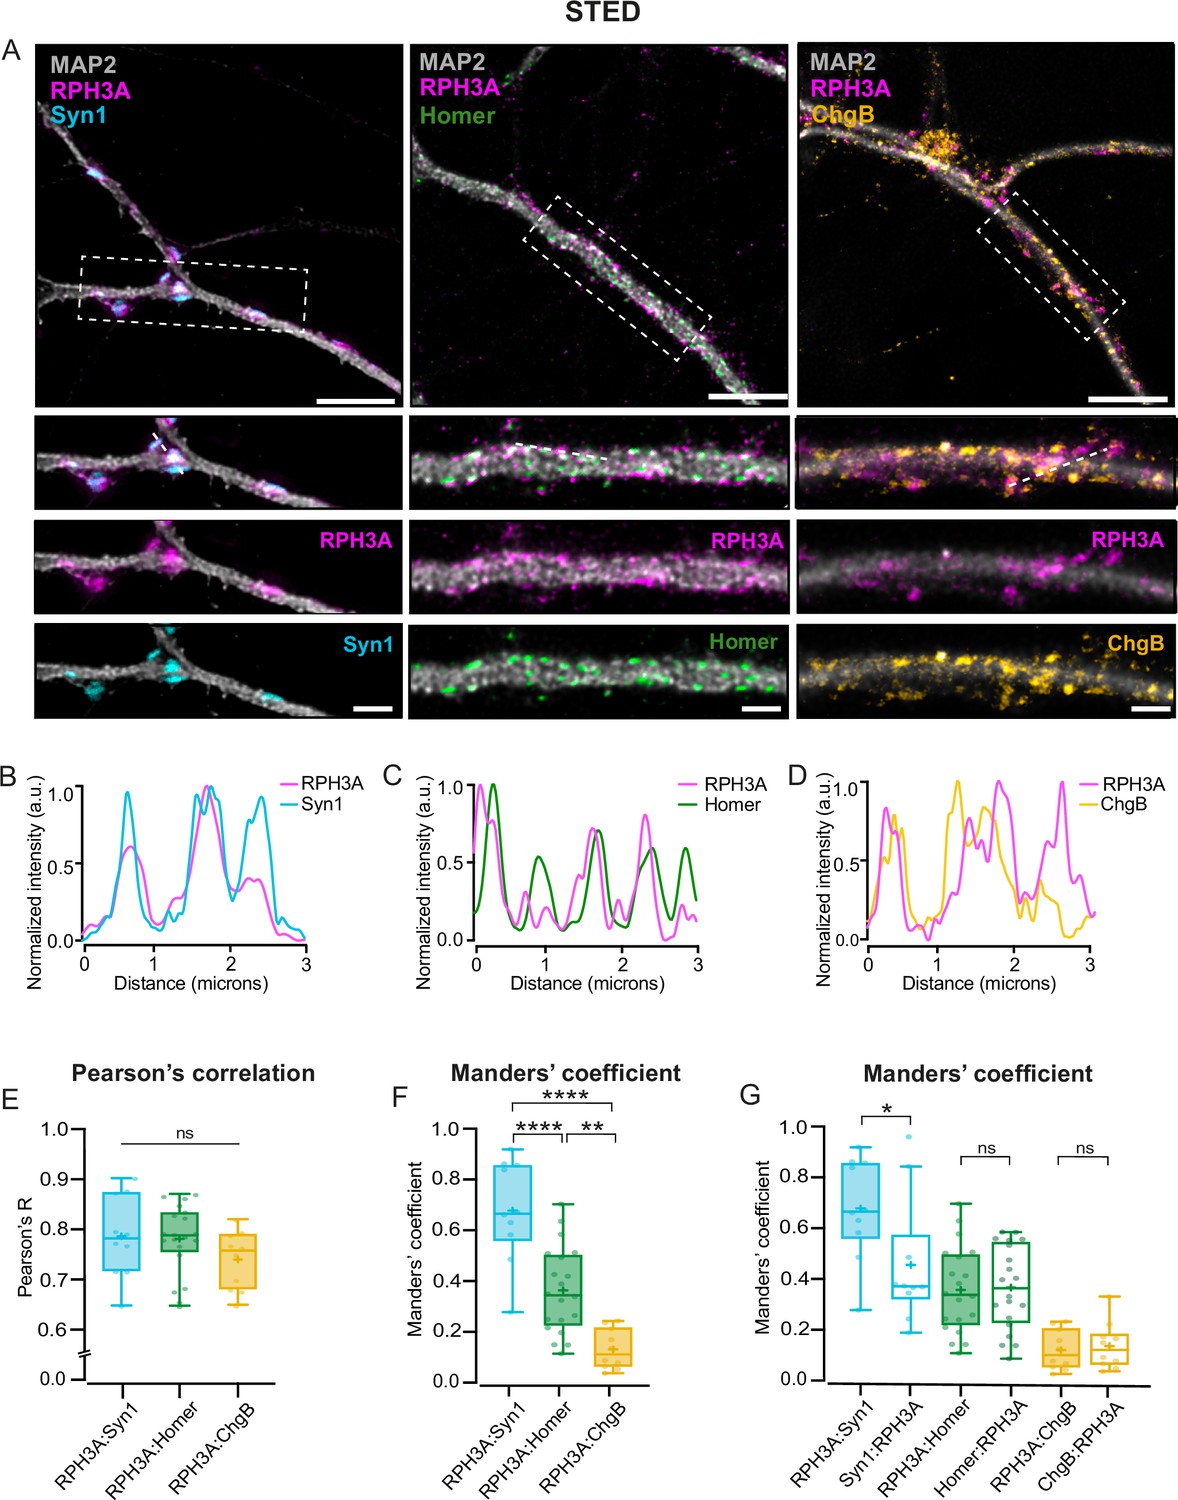
RPH3A localizes to the presynapses.
(A) Representative images of wildtype (WT) hippocampal neurons (top) with zooms (bottom) co-stained for RPH3A (magenta) and Syn1 (cyan), Homer (green), or ChgB (yellow). Scale bar, 5 µm (top) and 2 µm (bottom). (B–D) Line plots show normalized fluorescent intensity across the dotted line in example zooms. Intensities are normalized from min to max. (E) Pearson’s correlation coefficient and (F) Manders’ overlap coefficient comparing the colocalization of RPH3A with Syn1, Homer, and ChgB. Each dot represents a field of view. N numbers of individual experiments: Syn1: 2 (10); Homer: 2 (20); ChgB: 2 (10). (G) Manders’ overlap coefficient comparing the colocalization of RPH3A in either Syn1, Homer, or ChgB puncta, and vice versa. RPH3A:Syn1, RPH3A:Homer, and RPH3A:ChgB show the same dataset as in F. Boxplots represent the median (line), mean (+), and Tukey range (whiskers). Kruskal-Wallis H test with Dunn’s correction: *p<0.05, **p<0.01, ****p<0.0001. ns = non-significant, p>0.05.
Figure 1—figure supplement 1
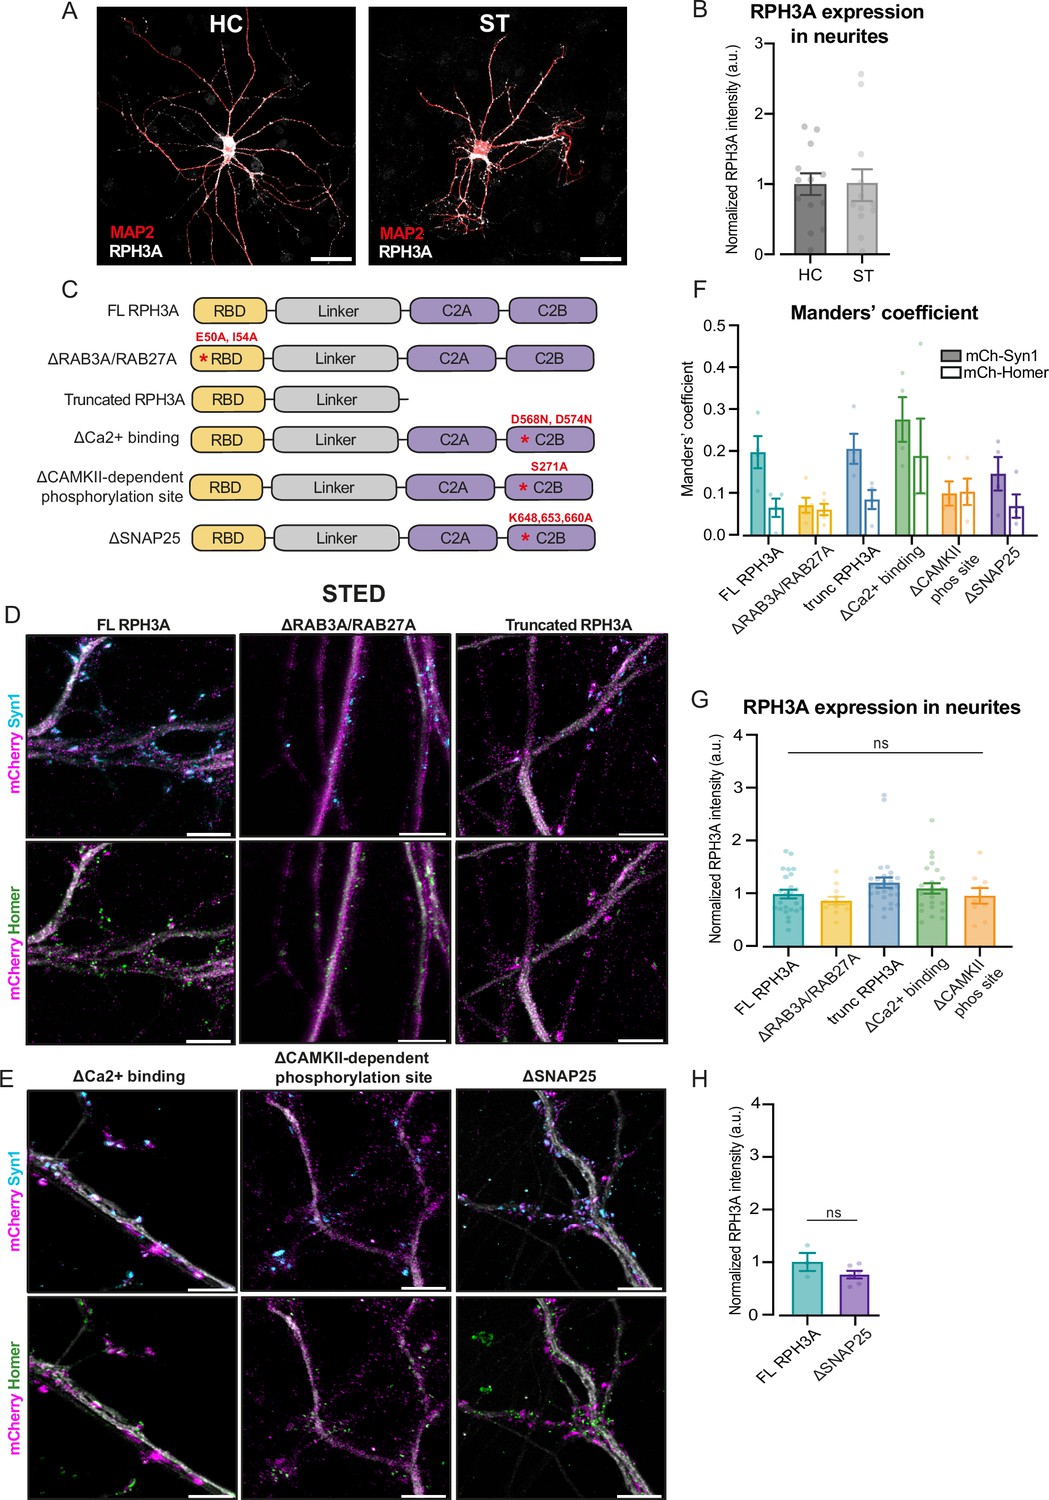
RPH3A localization depends on RAB3A/RAB27A-binding.
(A) Representative confocal images of wildtype (WT) hippocampal (HC) and striatal (ST) neurons stained for RPH3A (white), VGLUT/VGAT (not shown), and MAP2 (red). Scale bar, 50 µm. (B) RPH3A intensity in MAP2+ neurite mask in HC and ST neurons obtained with confocal imaging. Single neuron observations are normalized to the average RPH3A intensity per independent week. N numbers of individual experiments and single neuron observations in brackets: HC: 2 (13); ST: 2 (12). (C) Domain structures of full-length (FL) RPH3A and mutant RPH3A constructs lacking specific interactions: ∆RAB3A/RAB27A; truncated RPH3A; ∆Ca2+ binding; ∆CAMKII-dependent phosphorylation site; and ∆SNAP25. The corresponding mutation sites are indicated in red. (D, E) Representative stimulated emission depletion (STED) images of WT neurons expressing either FL RPH3A, ∆RAB3A/RAB27A, truncated RPH3A, ∆Ca2+-binding, ∆CAMKII-dependent phosphorylation site, or ∆SNAP25, immunostained for mCherry (pseudo-colored magenta), MAP2 (gray), Syn1 (cyan), or Homer (green). Scale bar, 5 µm. (F) Manders’ overlap coefficient analyses, derived from STED images, of mCherry with either Syn1 or Homer, in WT neurons expressing FL or mutant RPH3A constructs. Dots represent a field of view. N numbers per condition: knockout (KO)+RPH3A: 1 (4); KO+∆RAB3A/RAB27A: 1 (5); truncated RPH3A: 1 (4); KO+∆Ca2+ binding: 1 (4); KO+∆CAMKII-dependent phosphorylation: 1 (4) and KO+∆SNAP25: 1 (4). (G) RPH3A expression in KO neurons expressing FL RPH3A or mutant RPH3A constructs obtained with confocal imaging. Single neuron observations are normalized to FL RPH3A per independent experiment. N numbers per condition: KO+RPH3A: 6 (24); KO+∆RAB3A/RAB27A: 3 (12); truncated RPH3A: 6 (28); KO+∆Ca2+ binding: 5 (23); and KO+∆CAMKII-dependent phosphorylation: 2 (9). (H) RPH3A expression in KO neurons expressing FL RPH3A or mutant RPH3A unable to bind SNAP25 obtained with confocal imaging. N numbers per condition: KO+RPH3A: 1 (3); KO+∆SNAP25: 1 (6). Each dot represents a single neuron unless stated otherwise. Bar graphs represent the mean ± standard error of the mean (SEM). Kruskal-Wallis H test with Dunn’s correction or Mann-Whitney U test: ns = non-significant, p>0.05.
Figure 2
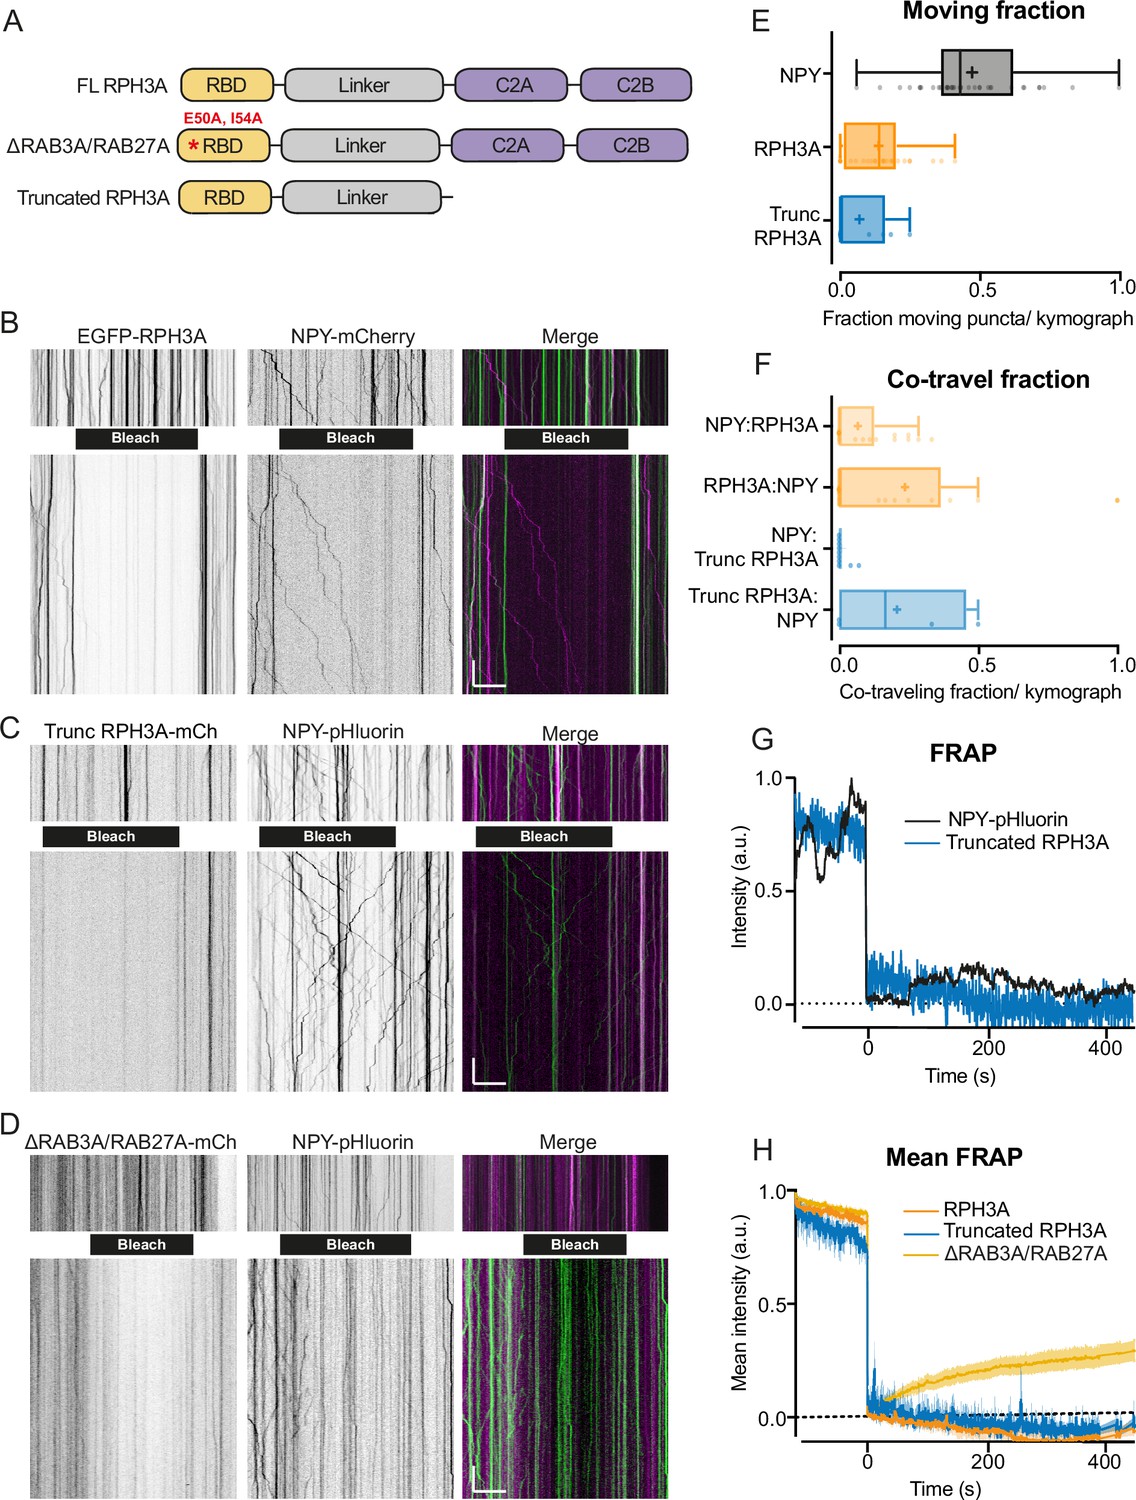
RPH3A does not travel with dense core vesicles (DCVs).
(A) Domain structures of full-length (FL) RPH3A and mutant RPH3A constructs lacking specific interactions: ∆RAB3A/RAB27A mutant RPH3A and truncated RPH3A that lacked its calcium and SNAP25-binding C2A and C2B domain. (B) Kymographs of EGFP-RPH3A and neuropeptide Y (NPY)-mCherry, (C) mCherry-trunc. RPH3A and NPY-pHluorin, and (D) mCherry-∆RAB3A/RAB27A mutant RPH3A and NPY-pHluorin before (upper) and after (lower) photobleaching (black bar). NPY-pHluorin showed more resistance to bleaching. This posed no issue as bleaching was merely applied to enhance the visualization of vesicles entering the bleached area and facilitate analysis. Merged images show mCherry (pseudo-colored magenta) and EGFP/pHluorin (green). Scale bar, 20 µm (x-axis) and 20 s (y-axis). (E) Moving fraction of NPY, FL RPH3A, and truncated RPH3A puncta per kymograph. N numbers of individual experiments: NPY: 1 (28); RPH3A: 1 (38); trunc. RPH3A: 1 (10). Dots represent a kymograph. (F) Fraction of co-travel of NPY puncta with either FL or truncated RPH3A puncta, and co-travel of FL or truncated RPH3A with NPY puncta. N numbers of individual experiments: NPY:RPH3A: 1 (28); RPH3A:NPY: 1 (21); NPY:trunc. RPH3A: 1 (10); trunc. RPH3A:NPY: 1 (4). (G) Fluorescent recovery of the traces shown in C after photobleaching truncated RPH3A or NPY-pHluorin, normalized from min to max. (H) Mean fluorescent recovery traces from multiple kymographs after photobleaching FL, truncated, or ∆RAB3A/RAB27A RPH3A. Lines±shading represents mean ± SEM. Boxplots represent median (line), mean (+), and Tukey range (whiskers).
Figure 3 with 1 supplement
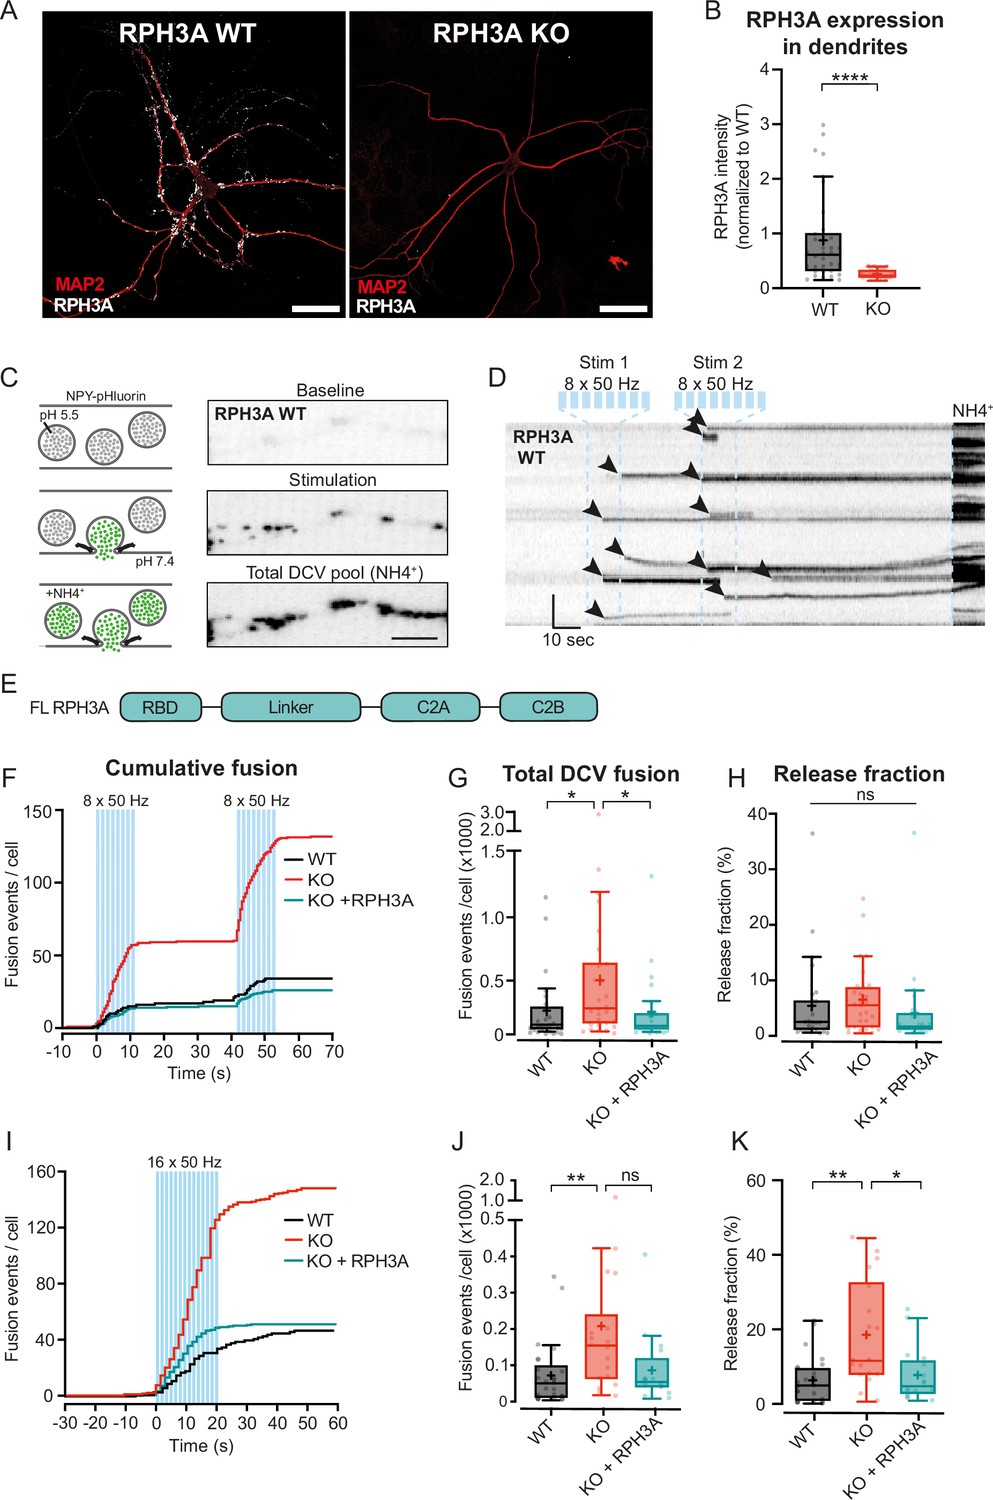
RPH3A deficiency increases dense core vesicle (DCV) exocytosis.
(A) Typical example of RPH3A wildtype (WT) and knockout (KO) neurons immunostained for MAP2 (red) and RPH3A (white). Scale bar, 50 µm. (B) RPH3A expression in dendrites of WT and KO neurons normalized to WT per independent experiment. N numbers of individual experiments and single neuron observations in brackets: WT: 4 (34); KO: 4 (33). (C) Schematic representation (left) and imaging example of a WT neurite stretch (right) infected with neuropeptide Y (NPY)-pHluorin as optical DCV fusion reporter. NPY-pHluorin is quenched in the acidic DCV lumen before fusion (baseline) but dequenches upon fusion (stimulation). NH4+ perfusion dequenches all NPY-pHluorin labeled DCVs (remaining DCV pool). Scale bar, 5 µm. (D) Kymograph of a WT neurite stretch with the stimulation paradigm used to elicit DCV fusion (two bursts of 8×50 action potential (AP) trains at 50 Hz interspaced by 0.5 s between each train and 30 s between each burst, blue bars) and NH4 perfusion (NH4+) used to dequench all NPY-pHluorin labeled vesicles. Arrowheads indicate fusion events. Scale bar, 10 s. (E) Domain structure of full-length (FL) RPH3A construct. (F) Cumulative median histogram of fusion events over time in WT (black), RPH3A KO (red), and KO neurons infected with FL RPH3A (cyan). Blue bars indicate the stimulation paradigm (two bursts of 8×50 AP bursts at 50 Hz). (G) Total number of DCV fusion events per condition (two bursts of 8×50 AP bursts at 50 Hz). (H) Released fraction defined as the number of fusion events normalized to the remaining pool of DCVs. N numbers of individual experiments and single neuron observations in brackets: WT: 5 (51); KO: 5 (43); KO+RPH3A: 5 (39). (I) Cumulative median histogram of events over time in WT (black), RPH3A KO (red), and KO neurons infected with FL RPH3A (cyan). Blue bars indicate the stimulation paradigm (16×50 AP bursts at 50 Hz). (J) Total number of DCV fusion events per condition (16×50 AP bursts at 50 Hz). (K) Release fraction per cell. N numbers of individual experiments and single neuron observations in brackets: WT: 4 (25); KO: 4 (18); KO+RPH3A: 4 (16). Boxplots represent the median (line), mean (+), and Tukey range (whiskers). Each dot represents an individual neuron. Line graphs represent the median. Mann-Whitney U test and or Kruskal-Wallis H test with Dunn’s correction: *p<0.05, **p<0.01, ****p<0.0001. ns = non-significant, p>0.05.
Figure 3—figure supplement 1
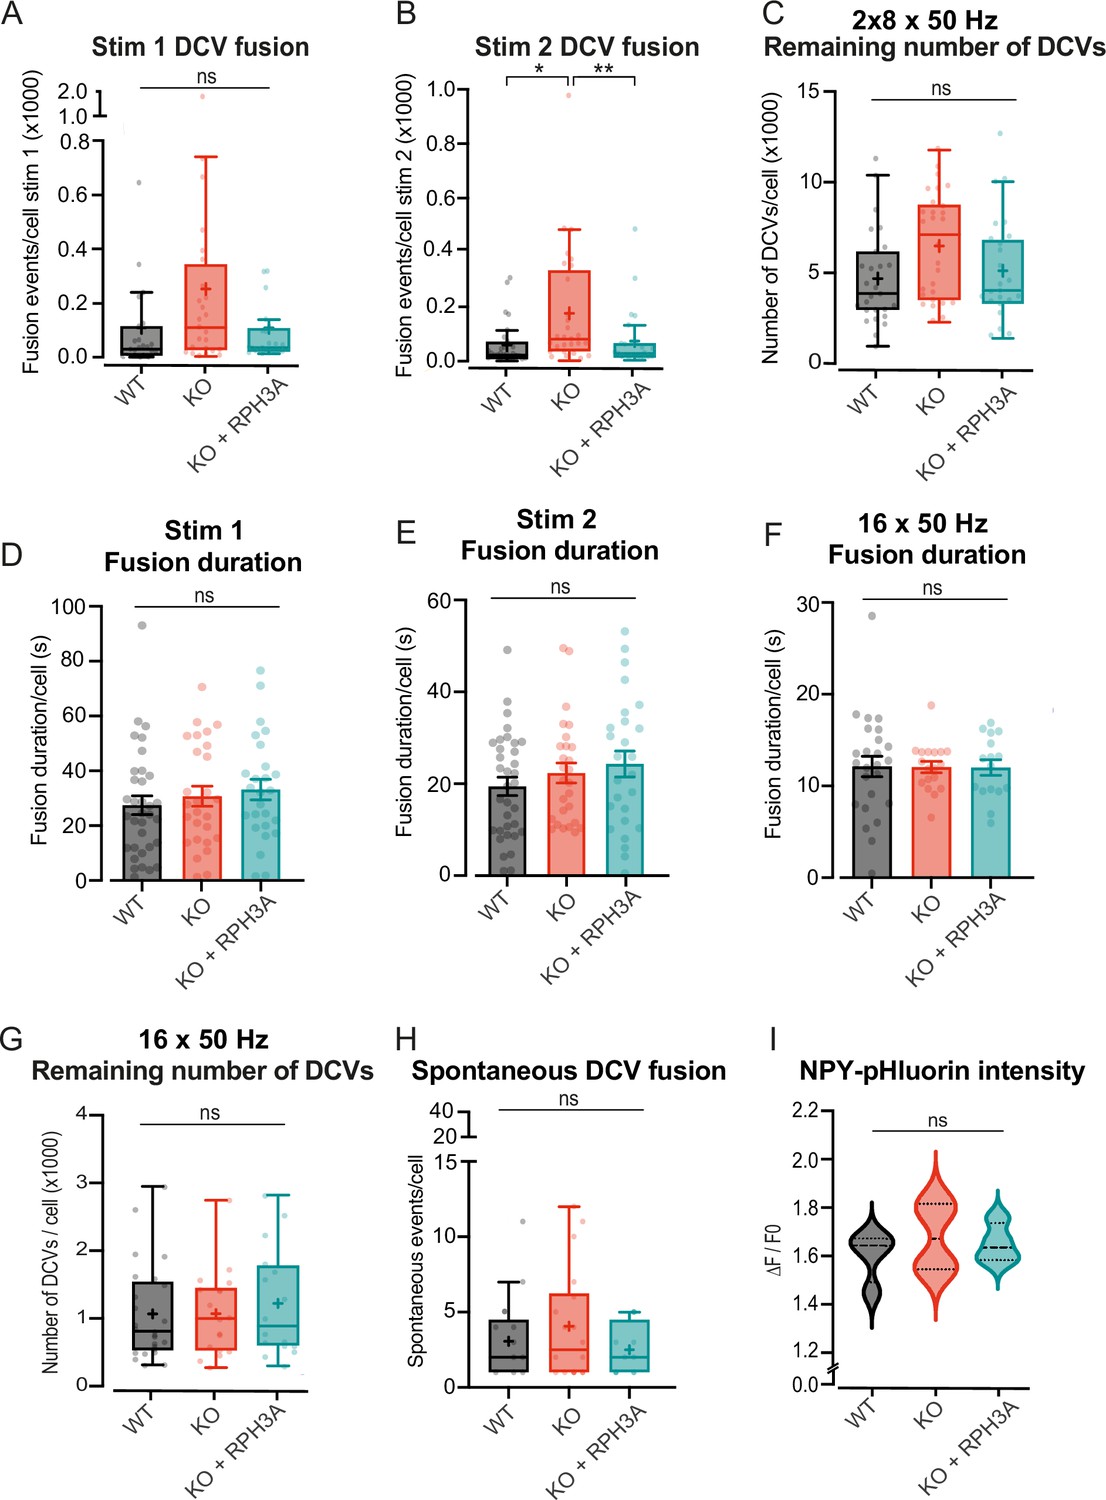
RPH3A depletion increases dense core vesicle (DCV) exocytosis, but does not affect remaining DCV pool size or content.
(A, B) DCV fusion events per condition for the first (A) and second (B) 8×50 action potentials (APs) bursts at 50 Hz. N numbers of individual experiments and single neuron observations in brackets: wildtype (WT): 4 (27); knockout (KO): 4 (28); KO+RPH3A: 4 (24). (C) Estimate of the remaining neuropeptide Y (NPY)-pHluorin labeled DCV pool during 2×8×50 APs at 50 Hz. N numbers per condition: WT: 4 (27); KO: 4 (28); KO+RPH3A: 4 (24). (D, E) Fusion duration during first and second 8×50 Hz burst stimulation protocol. N number per condition: WT: 4 (34); KO: 4 (27); KO+RPH3A: 4 (26). (F) Fusion duration during 16×50 Hz stimulation protocol. N numbers per condition: WT: 4 (25); KO: 4 (18); KO+RPH3A: 4 (16). (G) Estimate of the remaining NPY-pHluorin labeled DCV pool during 16×50 APs at 50 Hz. N numbers per condition: WT: 4 (25); KO: 4 (18); KO+RPH3A: 4 (16). (H) The number of spontaneous DCV fusion events per cell during baseline (16×50 APs at 50 Hz). N number per condition: WT: 4 (17); KO: 4 (18); KO+RPH3A: 3 (12). (I) Mean peak intensity of NPY-pHluorin during live imaging per independent experiment. The black dashed line represents the median. Number of independent experiments: WT: 4; KO: 4; KO+RPH3A: 4. Boxplots show the mean (+), median (line), and Tukey range (whiskers). Each dot represents a single neuron. Kruskal-Wallis H test with Dunn’s correction: *p<0.05, **p<0.01. ns = non-significant, p>0.05.
Figure 4
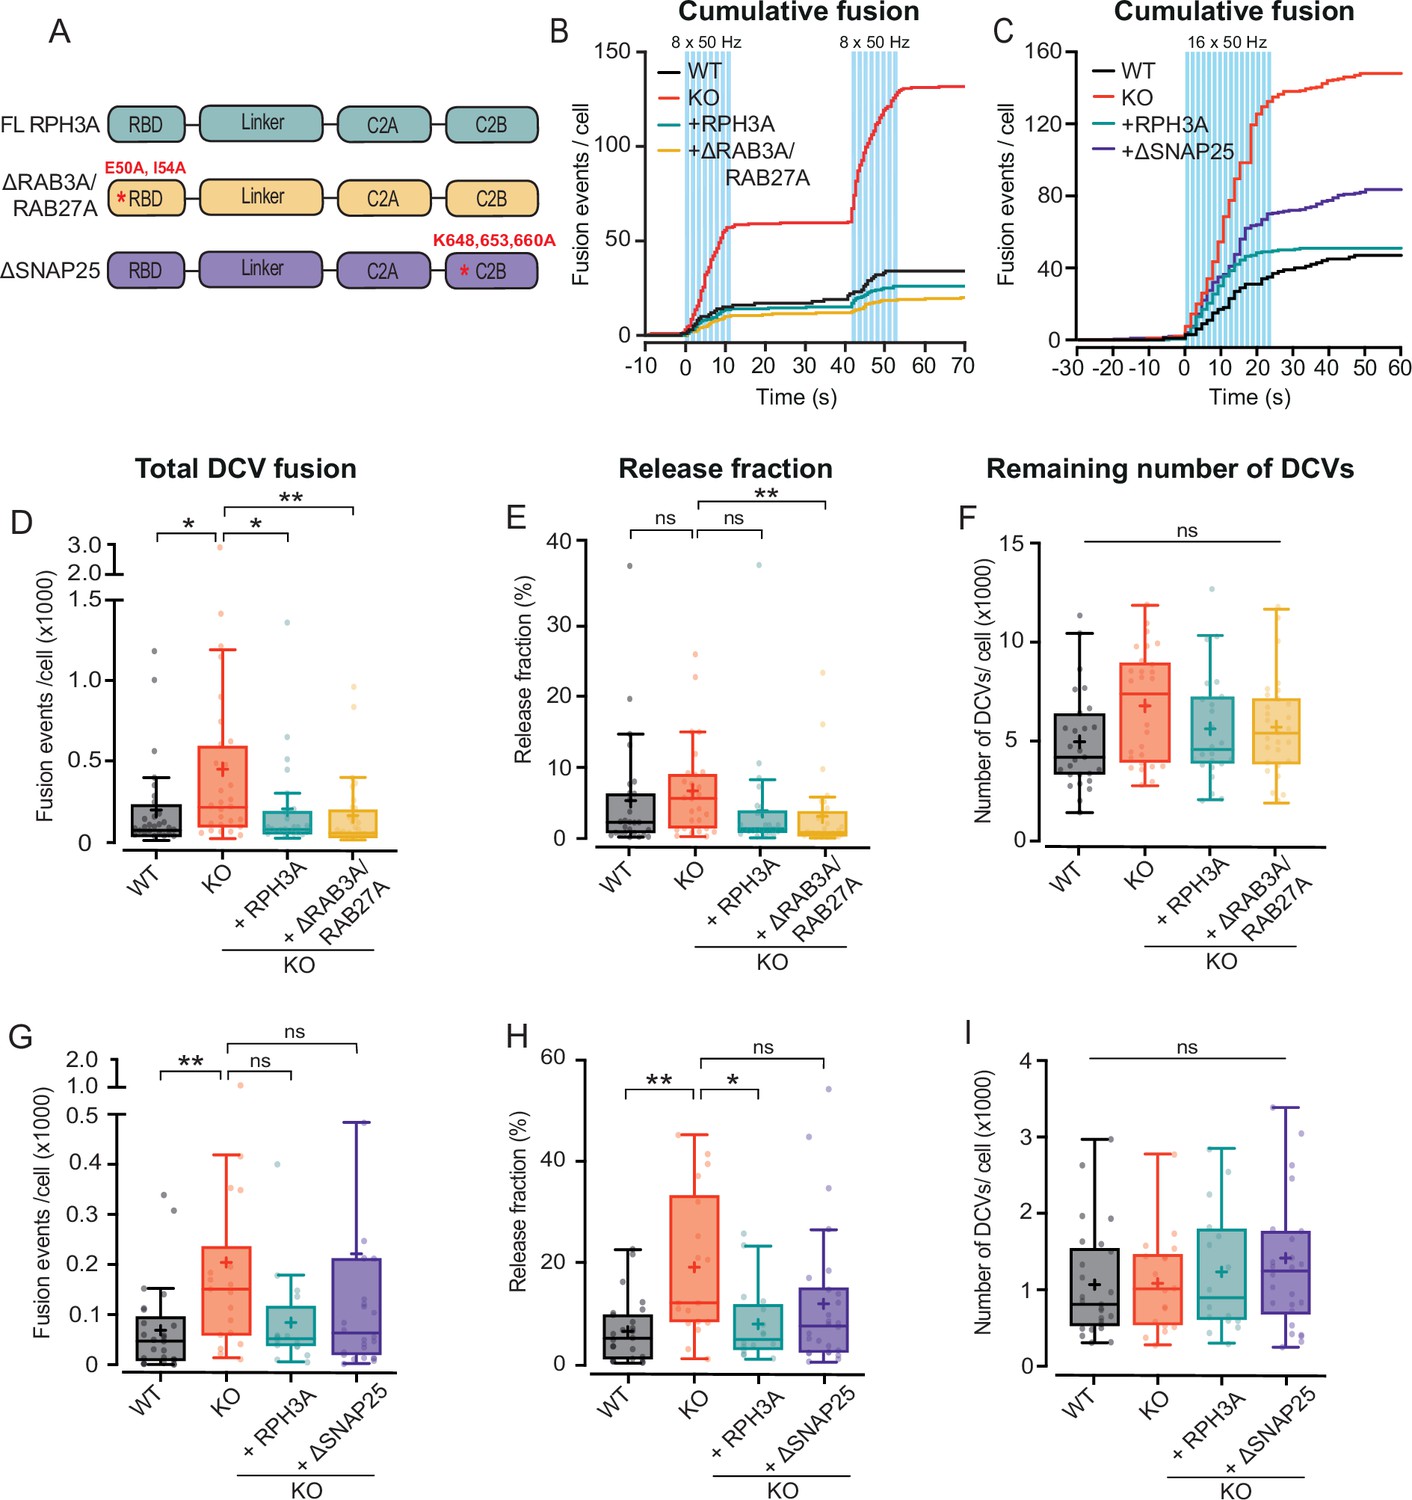
RPH3A interaction with SNAP25, but not RAB3A, partly contributes to limiting dense core vesicle (DCV) exocytosis.
This figure shows the same dataset for wildtype (WT), knockout (KO), and full-length (FL) RPH3A as in Figure 3. (A) Domain structures of FL RPH3A (cyan), ∆RAB3A/RAB27A (yellow), and ∆SNAP25 mutant RPH3A (purple) with the corresponding mutant sites in red. (B) Cumulative median histogram of events over time in WT (black), RPH3A KO (red), and KO neurons infected with FL RPH3A (cyan) or ∆RAB3A/RAB27A mutant RPH3A (yellow). Blue bars indicate the stimulation paradigm (two bursts of 8×50 action potential [AP] bursts at 50 Hz). (C) Cumulative median histogram of events over time in WT (black), KO (red), and KO neurons infected with FL RPH3A (cyan) or ∆SNAP25 mutant RPH3A (purple). Blue bars indicate the stimulation paradigm (16×50 AP bursts at 50 Hz). (D) Total DCV fusion events in WT (black), KO (red), and KO neurons expressing RPH3A (cyan) or ∆RAB3A/RAB27A (yellow). (E) Released fraction of the number of fusion events normalized to the remaining DCV pool per cell. Expression of ∆RAB3A/RAB27A in KO neurons significantly decreased the number of fusion events and released fraction to WT levels. ∆RAB3A/RAB27A did not differ from WT or FL RPH3A. (F) Remaining neuropeptide Y (NPY)-pHluorin labeled DCV pool estimates derived from NH4+ perfusion after stimulation. N numbers of individual experiments and single neuron observations in brackets: WT: 4 (27); KO: 4 (28); KO+RPH3A: 4 (24); KO+∆RAB3A/RAB27A: 4 (28). (G) Total number of DCV fusion events in WT (black), KO (red), and KO neurons expressing RPH3A (cyan) or ∆SNAP25 (purple). (H) Release fraction per cell. ∆SNAP25 expression in KO neurons was unable to fully rescue the number of fusion events and released fraction to WT levels. ∆SNAP25 did not significantly differ from WT or FL RPH3A. (I) Remaining NPY-pHluorin labeled DCV pool per cell. N numbers of individual experiments and single neuron observations in brackets: WT: 4 (25); KO: 4 (18); KO+RPH3A: 4 (16); KO+∆SNAP25: 4 (26). Line graphs represent the median. Boxplots show the mean (+), median (line), and Tukey range (whiskers). Each dot represents a single neuron. Kruskal-Wallis H test with Dunn’s correction: *p<0.05, **p<0.01. ns = non-significant, p>0.05.
Figure 5
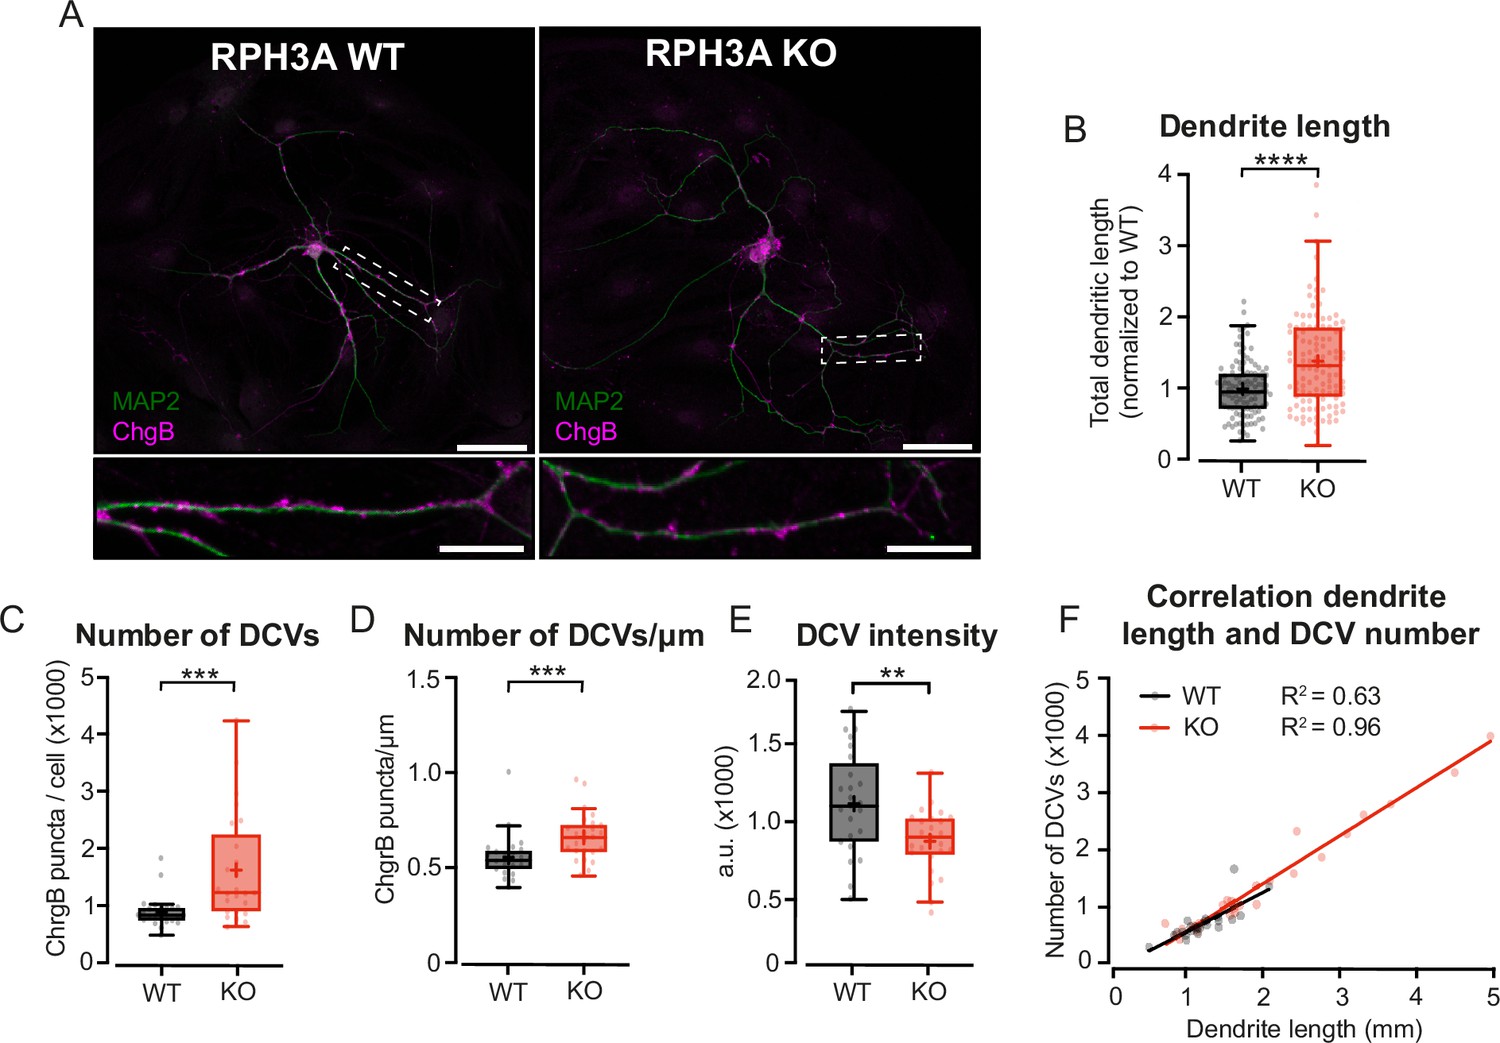
Increased neurite length and dense core vesicle (DCV) number upon RPH3A deficiency.
(A) Typical example of a single wildtype (WT) and RPH3A knockout (KO) hippocampal neuron (top) with zooms (bottom) stained for MAP2 (green) and the DCV marker ChgB (magenta). Scale bars, 50 µm (top) and 20 µm (bottom). (B) Total dendritic length of single hippocampal RPH3A WT or KO neurons normalized to WT per independent experiment. N numbers of individual experiments and single neuron observations in brackets: WT: 14 (112); KO: 14 (113). (C) Total number of ChgB labeled DCVs per neuron for each group. N numbers per condition: WT: 3 (24); KO: 3 (25). (D) Total ChgB labeled DCVs per µm for each neuron per group. (E) Mean intensity of ChgB labeled DCVs per neuron for each group. (F) Correlation between ChgB labeled DCVs and dendritic length (mm). Linear regression goodness of fit (r2) is given for each group. Boxplots represent median (line), mean (+), and Tukey range (whiskers). Each dot represents an individual neuron. Mann-Whitney U or unpaired t-test: **p<0.01, ***p<0.001, ****p<0.0001.
Figure 6 with 1 supplement
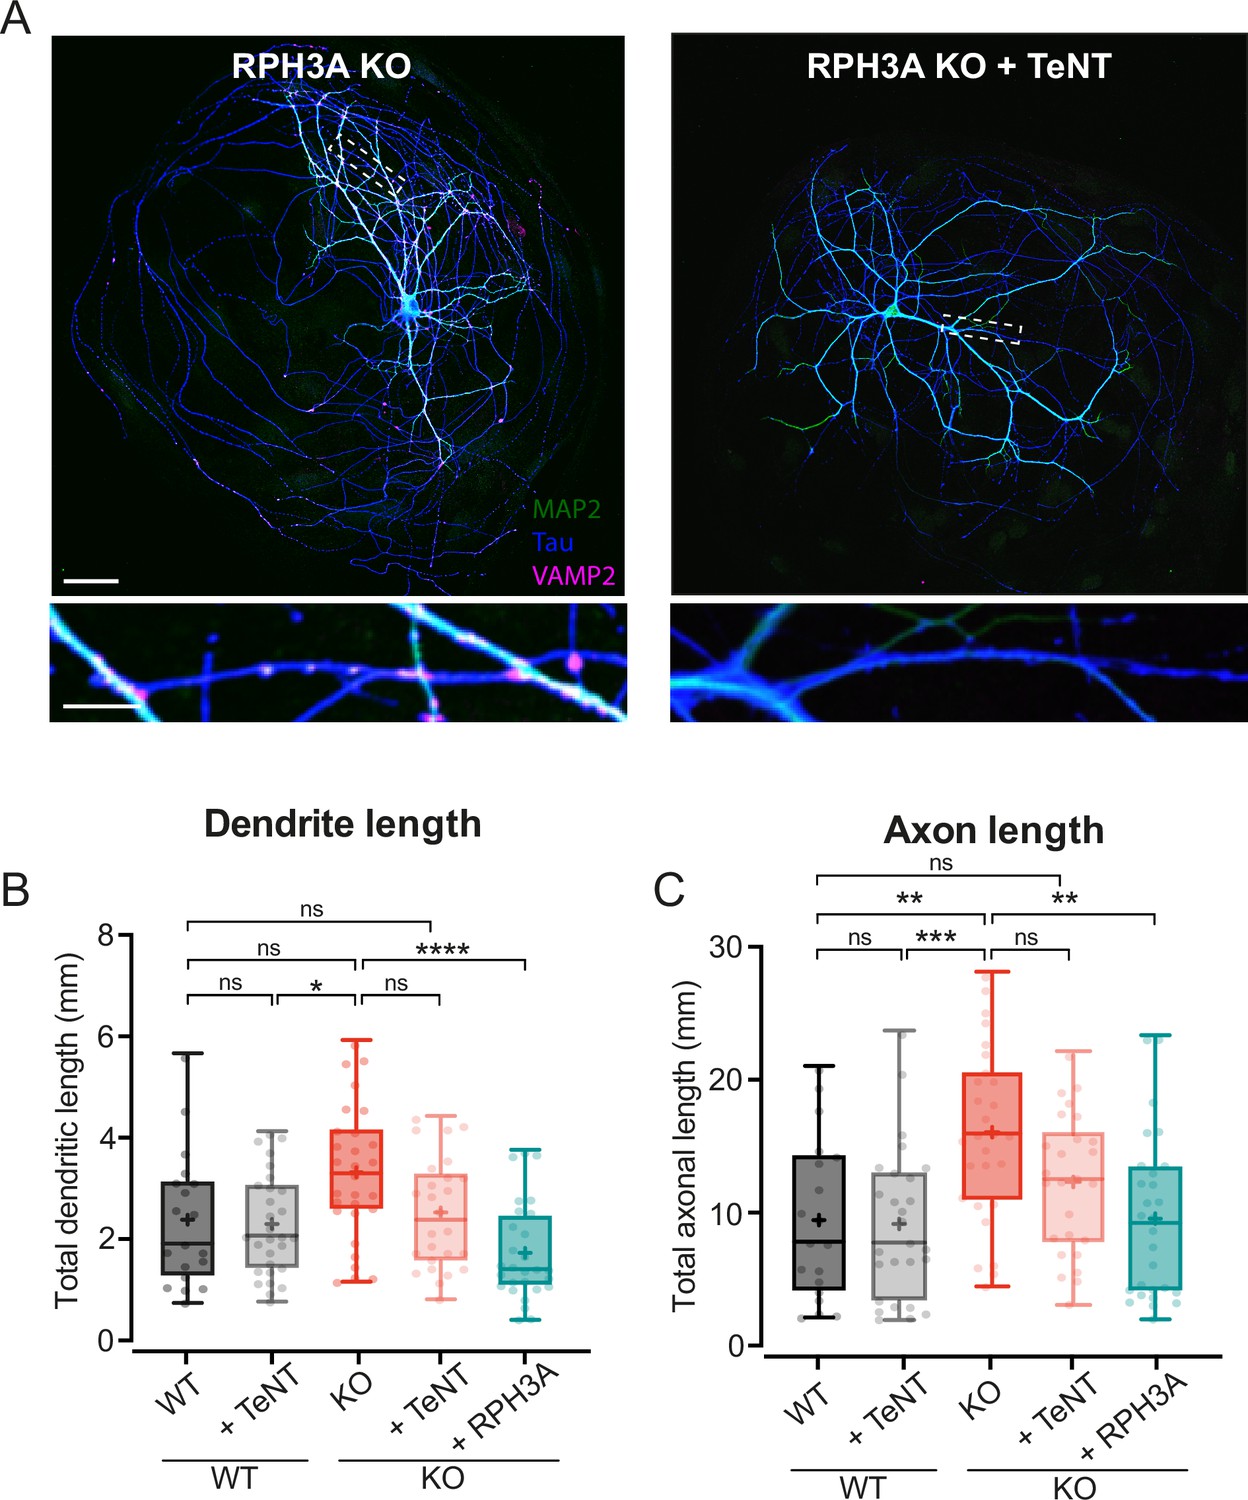
Increased neurite length upon RPH3A deficiency partly depends on regulated secretion.
(A) Typical example of a single RPH3A knockout (KO) neurons either infected with tetanus neurotoxin (TeNT) or not, showing successful VAMP2 cleavage with zooms (bottom) stained for MAP2 (green), Tau (blue), and VAMP2 (magenta). Scale bars, 50 µm (top) and 20 µm (bottom). (B) Total dendritic and (C) axonal length (mm) of wildtype (WT) and KO neurons -/+TeNT, and KO neurons expressing RPH3A. N numbers of individual experiments and single neuron observations in brackets: WT: 3 (19); WT+TeNT: 3 (27); KO: 3 (28). KO+TeNT: 3 (26), KO+RPH3A: 3 (28). Boxplots represent median (line), mean (+), and Tukey range (whiskers). Each dot represents an individual neuron. Kruskal-Wallis H test with Dunn’s correction: *p<0.05, **p<0.01, ***p<0.001, ****p<0.0001. ns = non-significant, p>0.05.
Figure 6—figure supplement 1
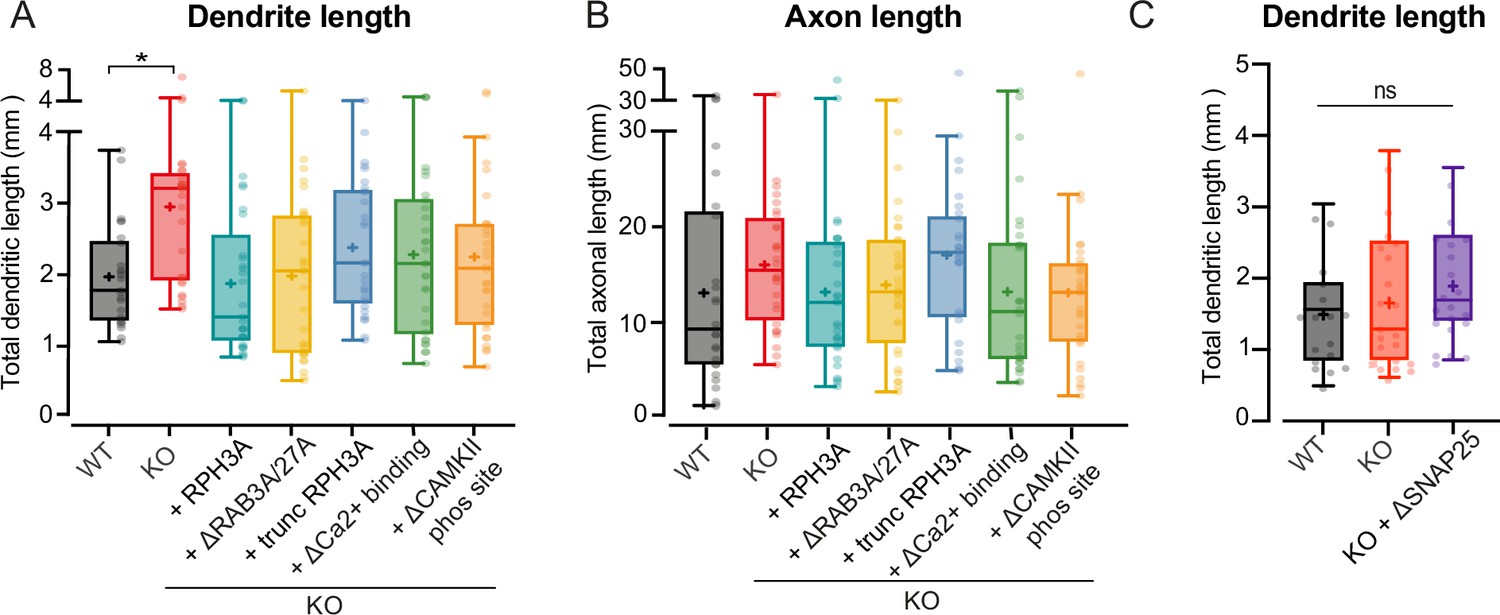
Increased neurite length upon RPH3A depletion does not depend on RAB3A/RAB27A binding, calcium binding, or phosphorylation of RPH3A.
(A) Total dendritic and (B) axonal length of wildtype (WT), knockout (KO), and KO neurons expressing full-length (FL) or mutant RPH3A (∆RAB3A/RAB27A, truncated, ∆Ca2+ binding, or ∆CAMKII-dependent phosphorylation site). N numbers per condition: WT: 3 (25); KO: 3 (28); KO+RPH3A: 3 (29); KO+∆RAB3A/RAB27A: 3 (32); truncated RPH3A: 3 (29); KO+∆Ca2+ binding: 3 (30); and KO+∆CAMKII-dependent phosphorylation: 3 (30). (C) Total dendritic length of WT, KO, and KO neurons expressing ∆SNAP25 mutant. N numbers per condition: WT: 3 (17); KO: 3 (21); KO+∆SNAP25: 3 (20). Each dot represents a single neuron observation. Kruskal-Wallis H test with Dunn’s correction: *p<0.05. ns = non-significant, p>0.05.
Figure 7
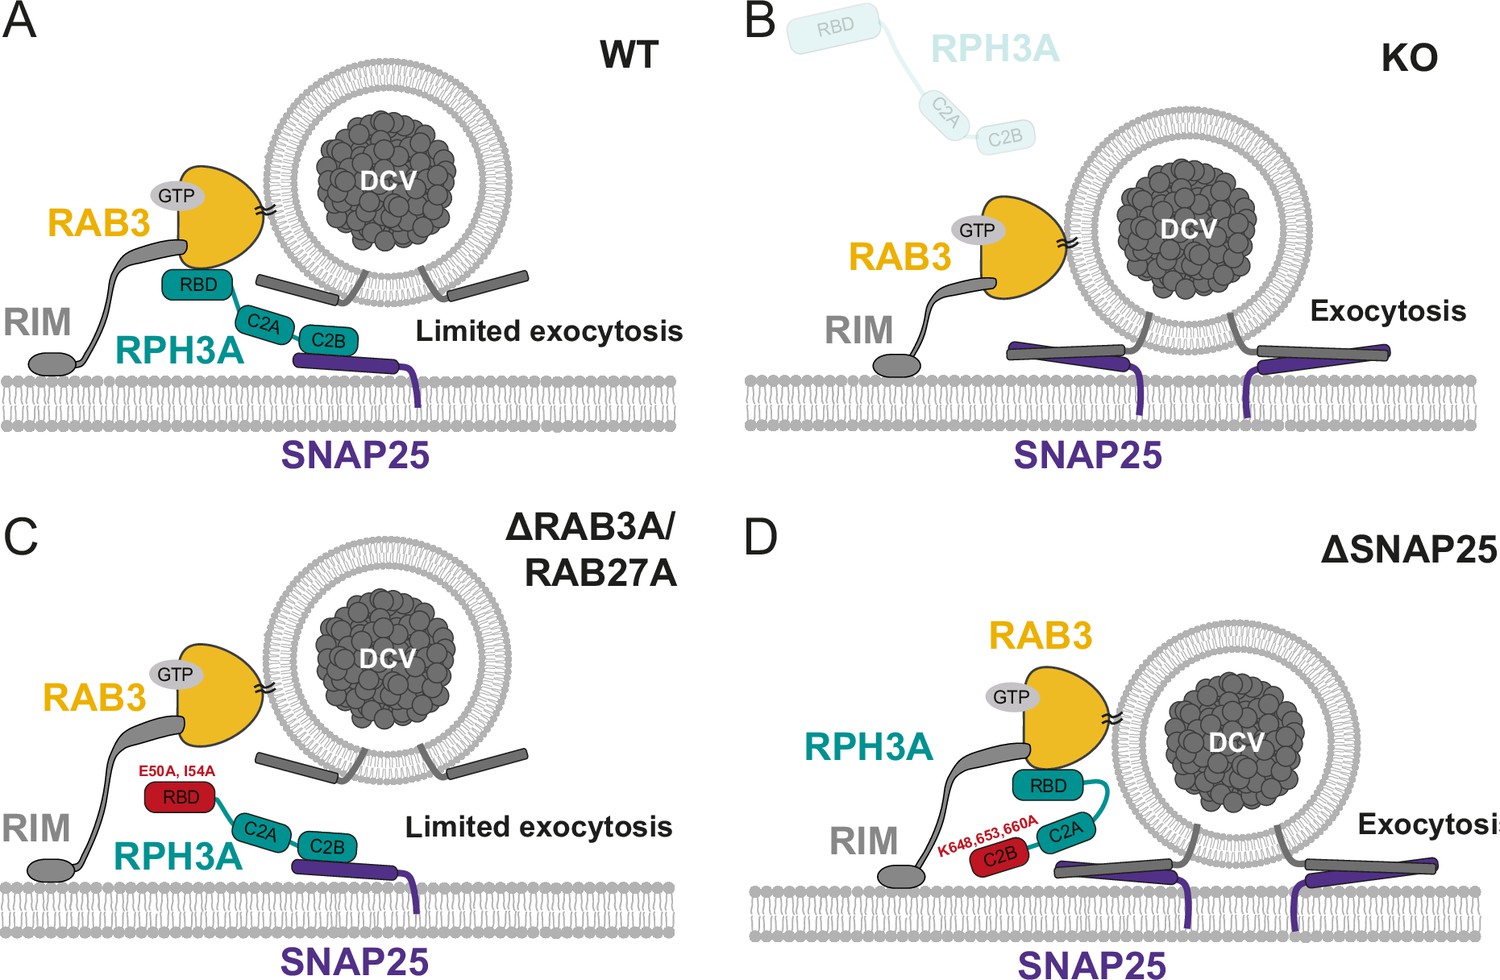
Role of RPH3A in dense core vesicle (DCV) exocytosis.
(A) RPH3A binding to RAB3 through its RAB-binding domain (RBD) ensures confined presynaptic localization of RPH3A. RPH3A binding to SNAP25 through its C2B domain inhibits DCV exocytosis, potentially by inhibiting SNAP25 binding of essential DCV proteins synaptobrevin/VAMP2 and/or synaptotagmin (not depicted). (B) In the absence of RPH3A, DCV exocytosis is not limited. (C) Upon expression of a RPH3A mutant that is unable to bind RAB3A/RAB27A, DCV exocytosis is limited. (D) When RPH3A is unable to bind SNAP25, the SNARE assembly is not restricted and therefore DCV exocytosis is not limited, while RPH3A is still recruited to synapses/release sites via RAB3.
Author response image 1
Tables
Key resources table
| Reagent type (species) or resource | Designation | Source or reference | Identifiers | Additional information |
|---|---|---|---|---|
| Genetic reagent (Mus musculus) | C57BL/6J | Charles River | Strain code 631 | |
| Genetic reagent (Mus musculus) | Rph3a-/- mice | Schlüter et al., 1999 | – | See section ‘Animals’ |
| Antibody | Anti-chromogranin B (rabbit polyclonal) | SySy | 259103 | 1:500 |
| Antibody | Anti-RPH3A (mouse monoclonal) | Transduction Laboratories | – | 1:1000 |
| Antibody | Anti-MAP2 (chicken polyclonal) | Abcam | ab5392 | 1:500 |
| Antibody | Anti-Syn1 (rabbit polyclonal) | #P610; SySy | 106 103 | 1:1000; 1:500 |
| Antibody | Anti-VGLUT (rabbit polyclonal) | SySy | 135302 | 1:500 |
| Antibody | Anti-Homer1 (guinea pig polyclonal) | SySy | 160 004 | 1:500 |
| Antibody | Anti-Tau (xx, polyclonal) | SySy | 314 004 | 1:1000 |
| Antibody | Anti-VAMP2 (mouse monoclonal) | SySy | 104 211 | 1:1000 |
| Antibody | Anti-mCherry (mouse monoclonal) | Signalway Antibody | #T515 | 1:1000 |
| Recombinant DNA reagent | pSyn(pr)Rabphilin3a(mus)-IRES2NLSCherryLL3.7 | This paper | - | Generation of this reagent is described in Materials and methods section ‘Lentiviral vectors and infections’ |
| Recombinant DNA reagent | pSyn(pr)EGFP-Glyrnlinker-Rabphilin3A-lentiFGA2.0 | This paper | - | Generation of this reagent is described in Materials and methods section ‘Lentiviral vectors and infections’ |
| Recombinant DNA reagent | pSyn(pr)mCherry-Glyrnlinker-Rabphilin3A(E50A,I54A)lenti-FGA2.0 | This paper | - | Generation of this reagent is described in Materials and methods section ‘Lentiviral vectors and infections’ |
| Recombinant DNA reagent | pSyn(pr)mScarlet-Glyrnlinker-Rabphilin3A(K648,653,660A)lentiFGA2.0 | This paper | - | Generation of this reagent is described in Materials and methods section ‘Lentiviral vectors and infections’ |
| Recombinant DNA reagent | pSyn(pr)mCherry-Glyrnlinker-Rabphilin3A(1-375)lenti-FGA2.0 | This paper | - | Generation of this reagent is described in Materials and methods section ‘Lentiviral vectors and infections’ |
| Recombinant DNA reagent | pSyn(pr)mCherry-Glyrnlinker-Rabphilin3A(D568N,D574N)lentiFGA2.0 | This paper | - | Generation of this reagent is described in Materials and methods section ‘Lentiviral vectors and infections’ |
| Recombinant DNA reagent | pSyn(pr)mCherry-Glyrnlinker-Rabphilin3A(S271A)-lentiFGA2.0 | This paper | - | Generation of this reagent is described in Materials and methods section ‘Lentiviral vectors and infections’ |
| Recombinant DNA reagent | pSyn(pr)hNPYPHluorin-N1lenti | van de Bospoort et al., 2012 | - | Generation of this reagent is described in Materials and methods section ‘Lentiviral vectors and infections’ |
| Recombinant DNA reagent | pSyn(pr)hNPYCherryLenti | de Wit et al., 2009; Farina et al., 2015 | - | Generation of this reagent is described in Materials and methods section ‘Lentiviral vectors and infections’ |
| Recombinant DNA reagent | pSyn(pr)HA-Tetx(E234Q)IRES2CherryDEST-lenti-fga2.0 | Emperador Melero et al., 2017 | - | Generation of this reagent is described in Materials and methods section ‘Lentiviral vectors and infections’ |
| Software, algorithm | MATLAB | MathWorks | - | |
| Software, algorithm | Prism | GraphPad | - | |
| Software, algorithm | ImageJ/Fiji | ImageJ | - | |
| Software, algorithm | Huygens Professional software | Scientific Volume Imaging (SVI) | - | |
| Software, algorithm | SynD | Schmitz et al., 2011 | - | |
| Software, algorithm | DCV fusion analysis | Moro et al., 2021 | - | The DCV fusion MATLAB script is available in GitHub at https://git.vu.nl/public-neurosciences-fga/matlab-apps/fusionanalysis2 (Broeke, 2022) |
Additional files
Download links
A two-part list of links to download the article, or parts of the article, in various formats.
Downloads (link to download the article as PDF)
Open citations (links to open the citations from this article in various online reference manager services)
Cite this article (links to download the citations from this article in formats compatible with various reference manager tools)
Rabphilin-3A negatively regulates neuropeptide release, through its SNAP25 interaction
eLife 13:RP95371.
https://doi.org/10.7554/eLife.95371.3


