Multimodal mismatch responses in mouse auditory cortex
- Friedrich Miescher Institute for Biomedical Research, Switzerland
- Faculty of Science, University of Basel, Switzerland
Figures
Figure 1 with 1 supplement
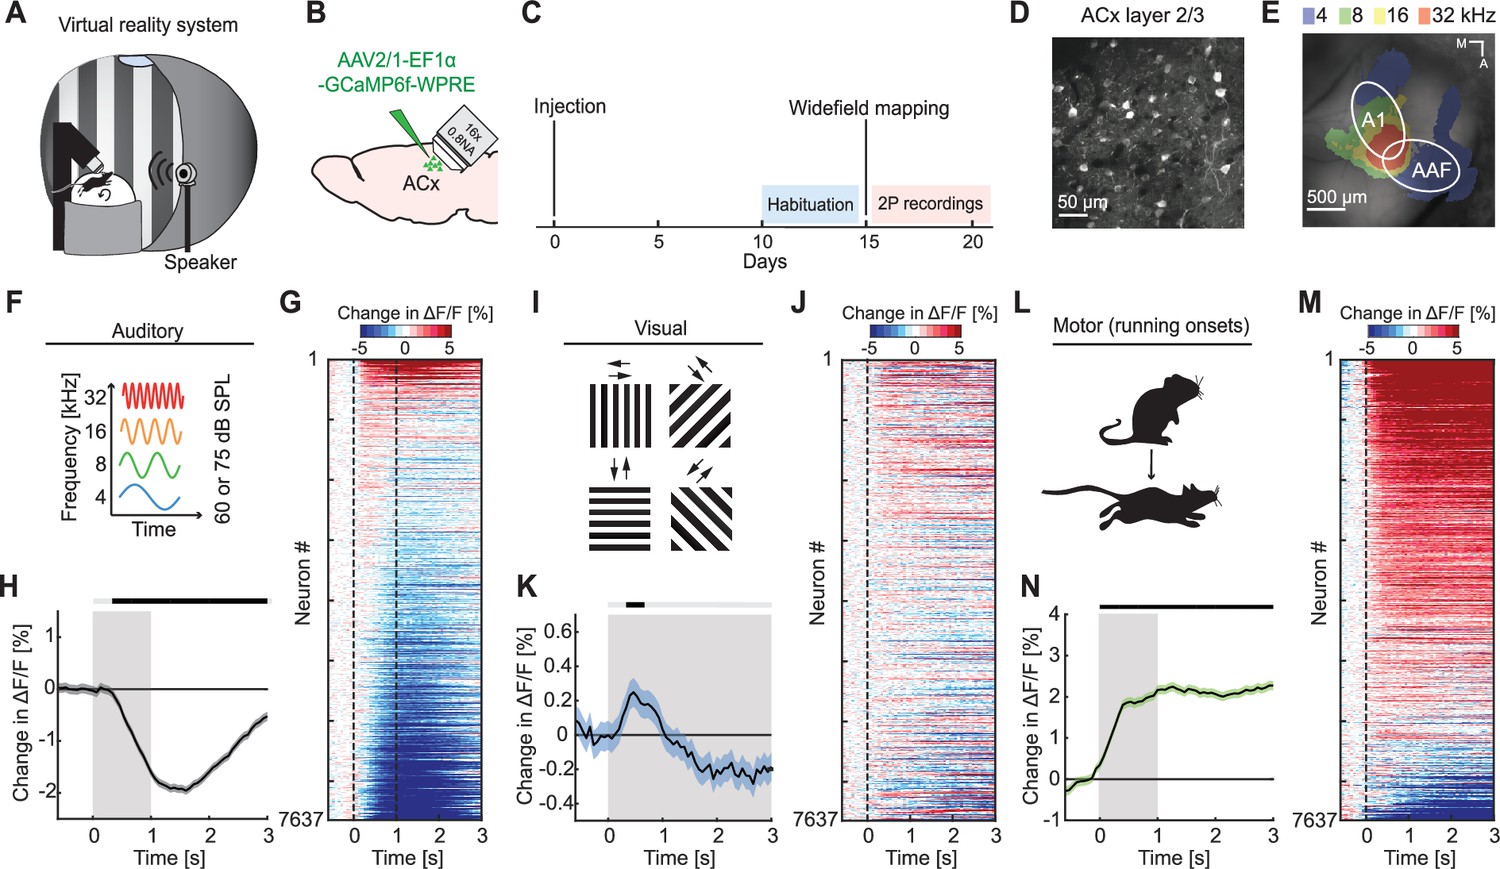
Auditory, visual, and motor-related signals were present in L2/3 of auditory cortex (ACx).
(A) Schematic of the virtual reality system. For imaging experiments, mice were head-fixed and free to run on an air-supported spherical treadmill. For all recordings, the microscope was tilted 45° to the left to image left Acx. (B) Strategy for two-photon imaging of L2/3 ACx neurons. We injected an adeno-associated viral (AAV) vector to express a genetically encoded calcium indicator in ACx. (C) Timeline of the experiment. Starting 10 days after viral injection and window implantation surgery mice were habituated to the virtual reality setup without any visual or auditory stimulation for 5 days. We mapped ACx with widefield imaging to be able to target two-photon (2P) imaging to ACx. In one to six recording sessions, 1 session per day, we recorded from 7637 neurons in 17 mice. (D) Example two-photon image in L2/3 of Acx. (E) Example widefield mapping of ACx. Response maps reflect regions with the strongest response for each tested sound frequency. (F) The sound stimuli were 1 s long pure tones of 4, 8, 16, or 32 kHz played at 60 or 75 dB SPL, presented with randomized inter-stimulus intervals. (G) The average sound-evoked response of all L2/3 ACx neurons across all tested frequencies and sound levels. Sound is presented from 0 to 1 s. Red indicates an increase in activity, while blue indicates a decrease in activity. All responses are baseline subtracted. To avoid regression to the mean artifacts in plotting, the response heatmap is generated by splitting data in two halves by trials. The responses from the first half of trials are used to sort neurons by response strength and the average responses of the second half of trials are plotted for each neuron. To prevent graphical aliasing, the heatmaps are smoothed over 10 neurons for plotting. (H) The average sound-evoked population response of all ACx L2/3 neurons across all tested frequencies and sound levels (7637 neurons). Stimulus duration was 1 s (gray shading). Here and in subsequent panels, solid black lines represent mean and shading SEM. The horizontal bar above the plot marks time bins in which the response is statistically different from 0 (gray: not significant, black: p < 0.05; see Methods). See Supplementary file 1 for all statistical information. (I) The visual stimuli we used were full-field drifting gratings of eight different directions, presented for 4–8 s with randomized inter-stimulus intervals. (J) As in (G), but for gratings onsets responses averaged across all orientations. (K) As in (H), but for the population response to grating onsets averaged across all orientations. (L) Motor-related activity was assessed based on responses upon running onsets. (M) As in (G), but for running onset responses. (N) As in (H), but for the average population response to running onsets. Only data from running onsets in which the mouse ran for at least 1 s (gray shading) were included.
Figure 1—figure supplement 1

Running exhibited differential effects on the responses to sound presentation and moving grating onsets.
(A) The average population response of auditory cortex (ACx) L2/3 neurons to sound presentation (4390 neurons) during sitting (light gray) and running (dark gray). Stimulus duration was 1 s (gray shading). The horizontal bar above the plot marks time bins in which the responses are statistically different from each other (gray: n.s., black: p < 0.05; see Methods). Solid black lines represent mean and shading SEM. See Supplementary file 1 for all statistical information. (B) As in (A), but for responses to moving gratings (3701 neurons) during sitting (light blue) and running (dark blue). Stimulus duration was 4–8 s (gray shading).
Figure 2 with 2 supplements

L2/3 neurons of auditory cortex (ACx) responded to audiomotor (AM) mismatch events.
(A) Schematic of the virtual reality (VR) system used to study responses to AM mismatches. The sound amplitude of an 8-kHz pure tone was coupled to the running speed of the mouse on a spherical treadmill. These experiments were performed with the VR switched off. (B) In closed loop sessions, the running speed of the mouse was coupled to the sound amplitude. AM mismatches were introduced by briefly setting the sound amplitude to 0 for 1 s. Below, the calcium response of an example neuron to AM mismatch events. (C) Responses of all L2/3 ACx neurons to AM mismatches. The response heatmap is generated as described in Figure 1G. (D) The average population response of all L2/3 neurons to AM mismatches and sound playback halts (4755 neurons). AM mismatch duration was 1 s (gray shading). The horizontal bar above the plot marks time bins in which the AM mismatch response is statistically different from the playback halt response (gray: not significant, black: p < 0.05; see Methods). Here and in subsequent panels, solid black lines represent mean and shading SEM. (E) The average population response of AM mismatch neurons (5% of strongest responders) to sound stimulation (black) and running onsets (green). Same data as in Figure 1H, N, but subselected for AM MM neurons. Sound stimulation was 1 s (gray shading). (F) Comparison of the response strength of AM mismatch (MM) neurons to sound stimulation (left) and running onsets (right) compared to those of the remainder of the neuron population. Error bars indicate SEM. Here and elsewhere, n.s.: not significant; **p < 0.01. See Supplementary file 1 for all statistical information. (G) Scatter plot of the correlations of calcium activity with sound amplitude (x-axis) and running speed (y-axis) in open loop sessions, for all neurons. The color-code reflects the strength of responses to AM mismatch in the closed loop session. Note, AM mismatch responsive neurons are enriched in the upper left quadrant. (H) The average population response to running onsets in closed (red) and open (black) loop sessions (only data from neurons for which we had at least two running onsets in both closed and open loop sessions are included here, see Supplementary file 1).
Figure 2—figure supplement 1
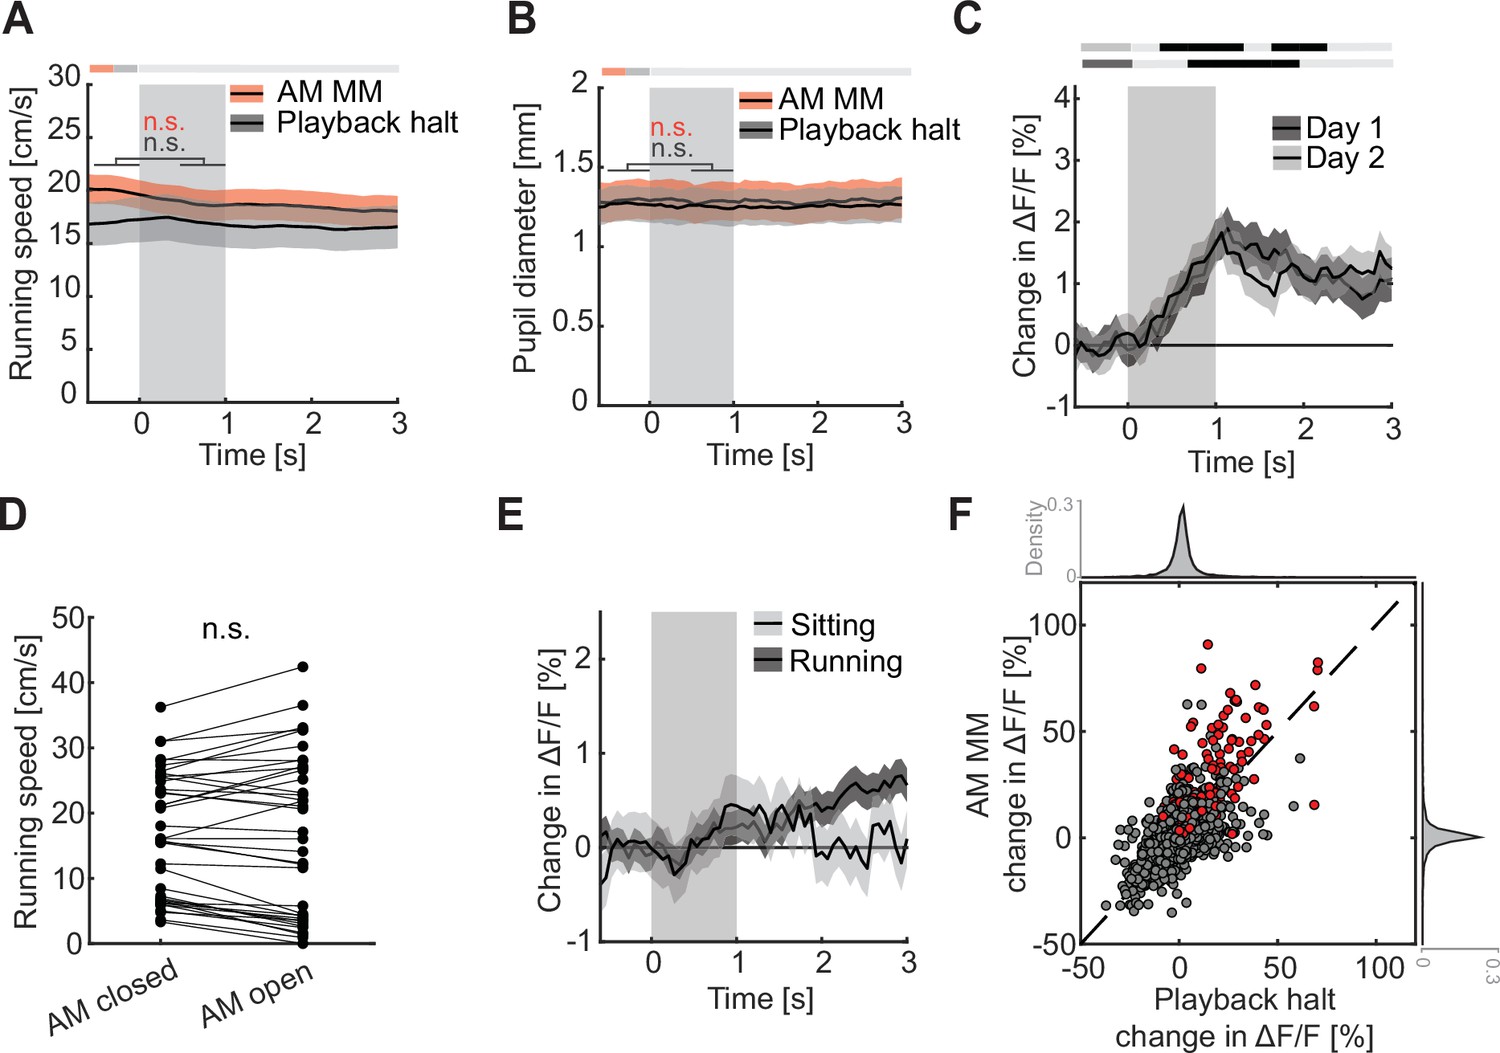
Controls for audiomotor (AM) mismatch responses.
(A) The average running speed of mice (38 sessions, 12 mice) upon AM mismatches (red) and sound playback halts (black). AM mismatch duration was 1 s (gray shading). Here and in subsequent panels, solid black lines represent mean and shading SEM. (B) Changes in pupil diameter upon the AM mismatches (red) and sound playback halts (black) (32 sessions, 11 mice). (C) The average population response of L2/3 auditory cortex (ACx) neurons to AM mismatches as a function of experience with AM coupling. AM mismatch duration was 1 s (gray shading). The data shown are from the first two AM closed loop sessions. Each closed loop session lasted 5.5 min and mice experienced one such session per day (Day 1: 1271, Day 2: 904). Note, AM mismatch responses are already present in the first closed loop session. (D) Comparison of running speeds during either closed or open loop AM sessions. Dots are different recording sessions. Here and elsewhere, n.s.: not significant. See Supplementary file 1 for all statistical information. (E) Comparison of the average population response of L2/3 neurons to sound playback halts while mice were running (dark gray, 4017 neurons) or sitting (light gray, 1878 neurons) in open loop session. AM mismatch duration was 1 s (gray shading). (F) Scatter plot of the responses to AM mismatch and sound playback halt for all neurons. Neurons that exhibited significant (p < 0.05) positive responses to AM mismatch are shown in red (13.7%). Black dashed line marks unity. Two data points exceed the y-axis limit and are not shown.
Figure 2—figure supplement 2

Opposing influence of sound and running on audiomotor (AM) mismatch neurons.
The same analysis presented as in Figure 2F but using the 10% of most AM mismatch responsive neurons (left), or the 20% of the most AM mismatch responsive neurons (right). Error bars indicate SEM. Here and elsewhere, n.s.: not significant; ***p < 0.001. See Supplementary file 1 for all statistical information.
Figure 3 with 1 supplement
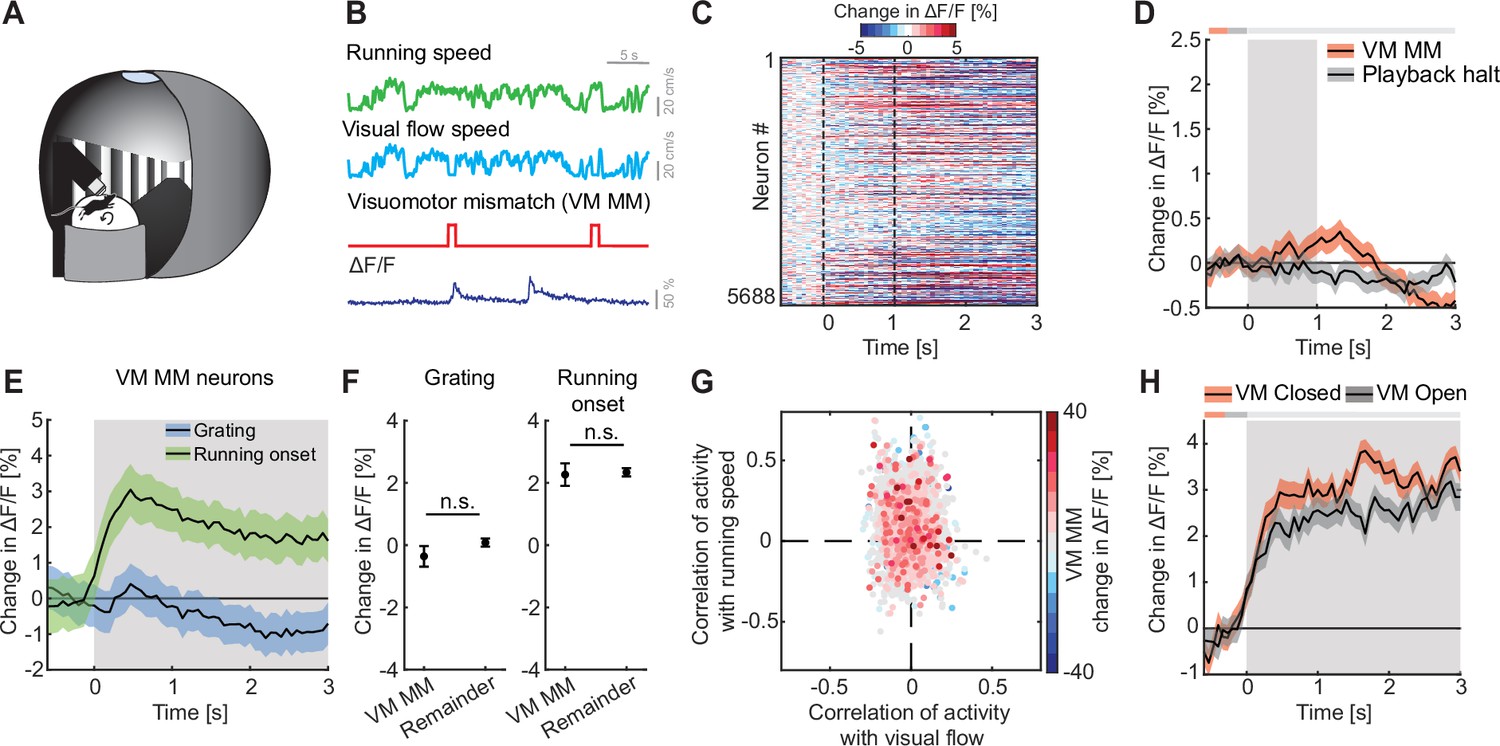
We found no evidence of visuomotor (VM) mismatch responses in auditory cortex (ACx).
(A) Schematic of the virtual reality system used to measure VM mismatch responses. The visual flow of the virtual corridor was coupled to the running speed of the mouse on a spherical treadmill. There was no sound stimulus present in these experiments. (B) In closed loop sessions, the running speed of the mouse was coupled to the movement in a virtual corridor. VM mismatches were introduced by briefly setting visual flow speed to 0 for 1 s. Below, the calcium response of an example neuron to VM mismatch events. (C) Responses of all L2/3 ACx neurons to VM mismatches. The response heatmap is generated as described in Figure 1G. (D) The average population response of all L2/3 neurons to VM mismatches and visual flow playback halts (5688 neurons). Gray shading marks the duration of both stimuli. The horizontal bar above the plot marks time bins in which the VM mismatch response is statistically different from the playback halt response (gray: n.s., black: p < 0.05; see Methods). Here and in subsequent panels, solid black lines represent mean and shading SEM. (E) The average population response of VM mismatch neurons (5% of strongest responders) to grating stimulation (blue) and running onsets (green). Same data as in Figure 1K, N, but subselected for VM MM neurons. Stimulus duration was 4–8 s (gray shading). (F) Comparison of the response strength of VM mismatch (MM) neurons to visual stimulation (left) and running onsets (right) compared to those of the remainder of the neuron population. Error bars indicate SEM. Here and elsewhere, n.s.: not significant. See Supplementary file 1 for all statistical information. (G) Scatter plot of the correlation of calcium activity with visual flow speed (x-axis) and running speed (y-axis) in open loop sessions for all neurons. The color-code reflects the strength of responses to VM mismatch in the closed loop session. Note, VM mismatch responsive neurons are scattered randomly. (H) The averaged population response to running onsets in closed (red) and open (black) loop session (only data from neurons for which we had at least two running onsets in both closed and open loop sessions are included here, see Supplementary file 1).
Figure 3—figure supplement 1
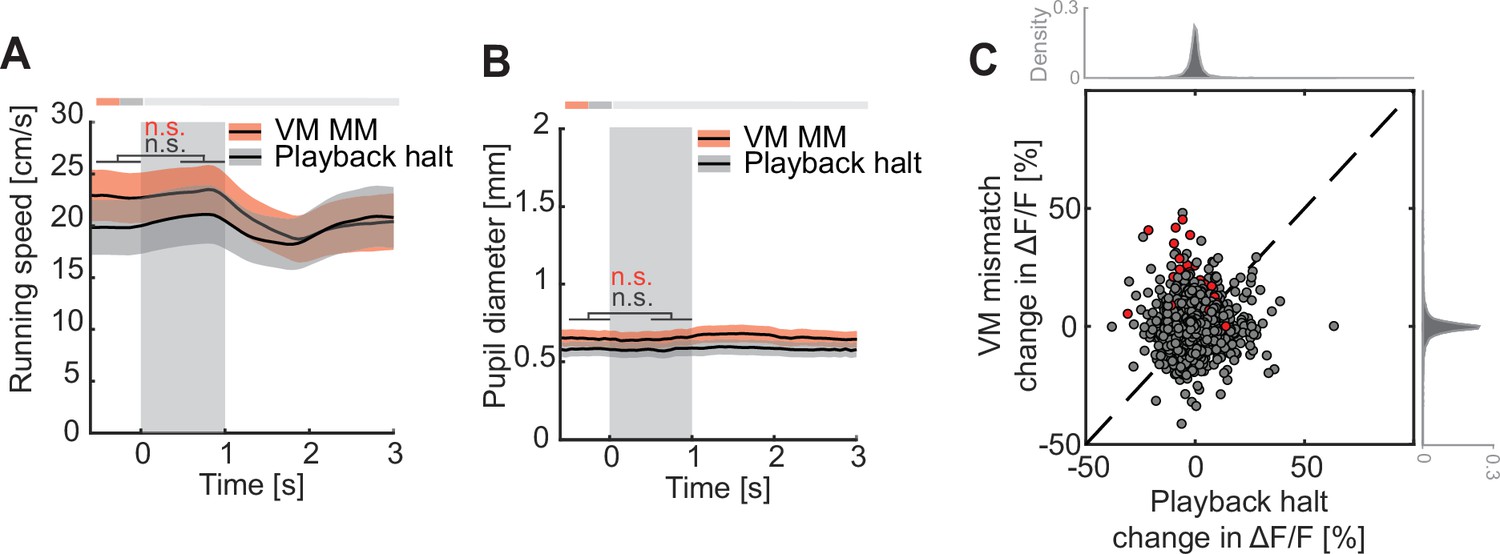
Controls for visuomotor (VM) mismatch responses.
(A) The average running speed of mice upon VM mismatches (red) and visual flow playback halts (black) (47 sessions, 15 mice). VM mismatch duration was 1 s (gray shading). Here and in subsequent panels, solid black lines represent mean and shading SEM. See Supplementary file 1 for all statistical information. (B) Changes in pupil diameter upon the VM mismatches (red) and sound playback halts (black) presentation (32 sessions, 11 animals). (C) Scatter plot of the responses to VM mismatch and visual flow playback halt for all neurons. The percentage of neurons (6.6%; in red) that exhibited significant (p < 0.05) responses to VM mismatches is only barely above chance.
Figure 4 with 1 supplement
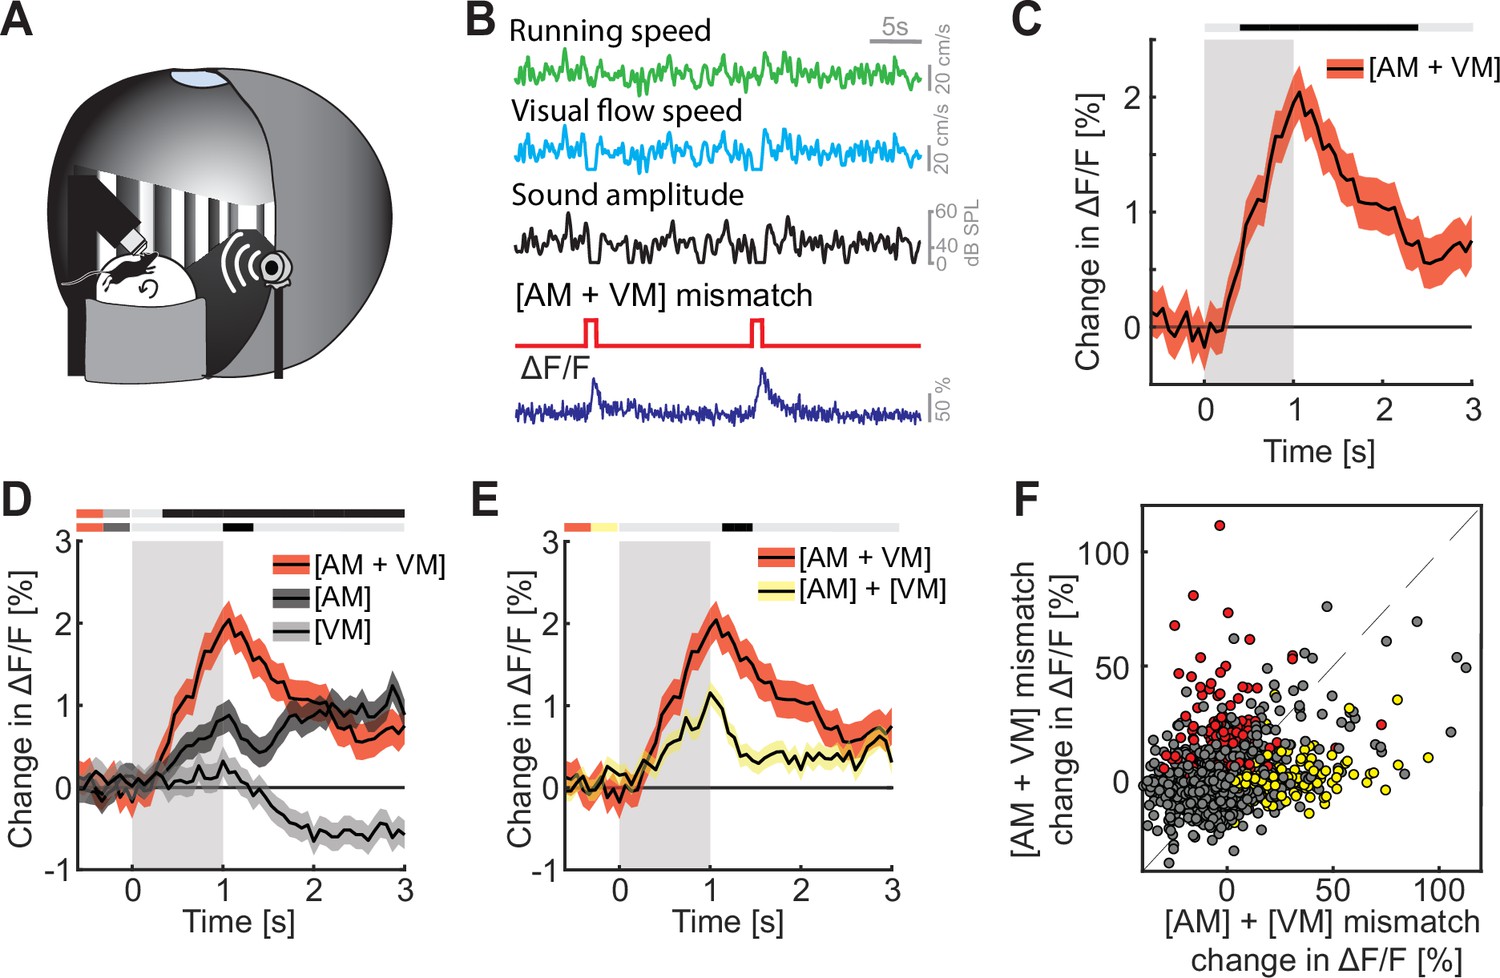
Mismatch responses were potentiated by multimodal interactions in L2/3 auditory cortex (ACx) neurons.
(A) Schematic of the virtual reality system used to measure multimodal mismatch responses. Both the sound amplitude of an 8-kHz pure tone and the movement of the virtual corridor were coupled to the running speed of the mouse on a spherical treadmill. (B) Concurrent audio- and visuomotor [AM + VM] mismatches were introduced by simultaneously setting both sound amplitude and visual flow speed to 0 for 1 s. (C) The average population response of all L2/3 ACx neurons to concurrent [AM + VM] mismatches (3289 neurons). Gray shading marks the duration of the mismatch stimulus. The horizontal bar above the plot marks time bins in which the [AM + VM] mismatch response is statistically different from 0 (gray: n.s., black: p < 0.05; see Methods). Here and in subsequent panels, solid black lines represent mean and shading SEM. (D) Average population response of all L2/3 neurons to concurrent [AM + VM] mismatch and responses evoked by [AM] and [VM] mismatches presented in isolation (same data as shown in Figures 2 and 3 but subselected to match the neurons that were recorded in both unimodal and multimodal mismatch paradigms; 3289 neurons). The horizontal bars above the plot mark time bins in which the [AM + VM] mismatch response is larger than the [AM] or the [VM] mismatch response (gray: n.s., black: p < 0.05; see Methods). The two short horizontal color bars to the left of time 0 indicate which two responses are being compared. Gray shading indicates the duration of the stimulus. See Supplementary file 1 for all statistical information. (E) Average population response of all L2/3 neurons to a concurrent [AM + VM] mismatches compared to the linear sum of the responses evoked by [AM] and [VM] mismatches presented in isolation. Gray shading indicates the duration of the stimuli. (F) Scatter plot of the responses of all neurons to the concurrent [AM + VM] mismatches against the linear sum of the responses evoked by [AM] and [VM] mismatches presented in isolation. In red, the subset of neurons (13.7%) that exhibited selective responses to the concurrent [AM + VM] mismatch, and in yellow, the subset of neurons (11.2%) in which the linear sum of the responses to [AM] + [VM] mismatches presented in isolation was significant, while response to their concurrent presentation was not. Neurons without a significant response, or that are responsive to both, are shown in gray.
Figure 4—figure supplement 1
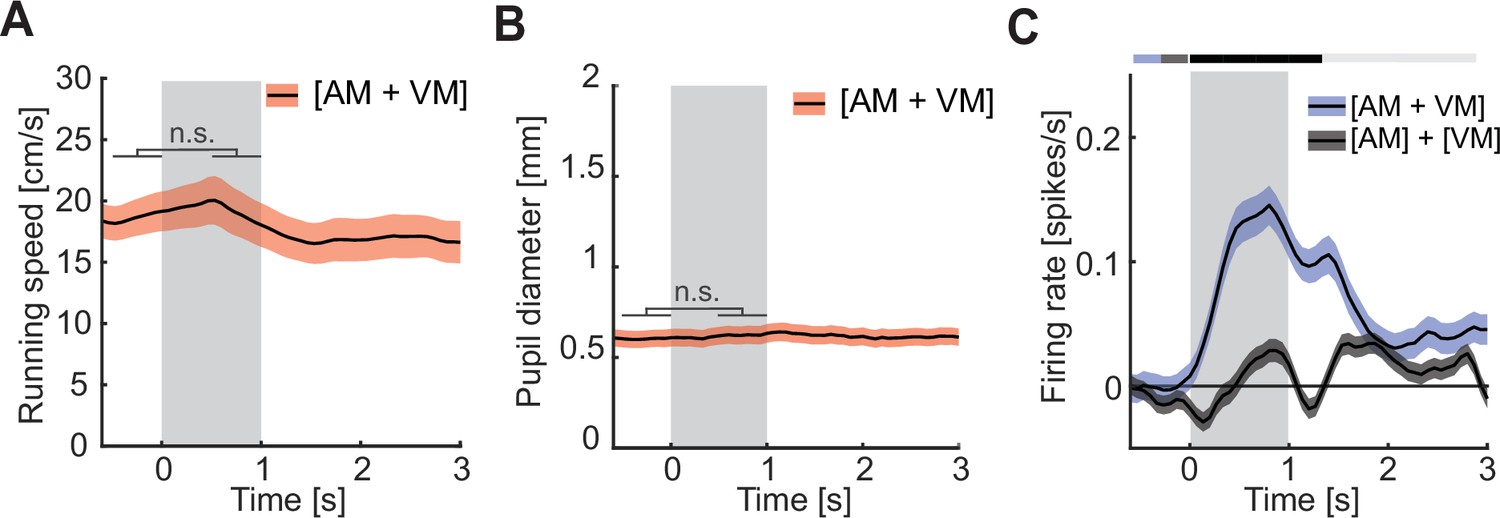
Controls for multimodal mismatch responses.
(A) The average running speed of mice upon concurrent audiomotor and visuomotor [AM + VM] mismatches (26 sessions, 10 mice). Gray shading marks the duration of the mismatch stimulus. Here and in subsequent panels, solid black lines represent mean and shading SEM. See Supplementary file 1 for all statistical information. (B) Changes in pupil diameter upon the concurrent [AM + VM] mismatch (26 sessions, 10 mice). (C) Non-linear combination of mismatch responses with spike estimation. As in Figure 4E, but using an estimate of firing rate calculated using CASCADE (Rupprecht et al., 2021). Gray shading marks the duration of the mismatch stimulus.
Author response image 1

The average response of strongest AM MM responders to AM mismatches as a function of running speed (data are from 51 cells, 11 fields of view, 6 mice).
Tables
Key resources table
| Reagent type (species) or resource | Designation | Source or reference | Identifiers | Additional information |
|---|---|---|---|---|
| Strain, strain background (adeno-associated virus) | AAV2/1-EF1α-GCaMP6f-WPRE (1014 GC/ml) | FMI vector core | vector.fmi.ch | |
| Chemical compound, drug | Fentanyl citrate | Actavis | CAS 990-73-8 | Anesthetic compound |
| Chemical compound, drug | Midazolam (Dormicum) | Roche | CAS 59467-96-8 | Anesthetic compound |
| Chemical compound, drug | Medetomidine (Domitor) | Orion Pharma | CAS 86347-14-0 | Anesthetic compound |
| Chemical compound, drug | Ropivacaine | Presenius Kabi | CAS 132112-35-7 | Analgesic compound |
| Chemical compound, drug | Lidocaine | Bichsel | CAS 137-58-6 | Analgesic compound |
| Chemical compound, drug | Buprenorphine | Reckitt Benckiser Healthcare | CAS 52485-79-7 | Analgesic compound |
| Chemical compound, drug | Ophthalmic gel (Humigel) | Virbac | N/A | Ophthalmic gel |
| Chemical compound, drug | Flumazenil (Anexate) | Roche | CAS 78755-81-4 | Anesthetic antagonist |
| Chemical compound, drug | Atipamezole (Antisedan) | Orion Pharma | CAS 104054-27-5 | Anesthetic antagonist |
| Chemical compound, drug | N-Butyl-2-cyanoacrylate | Braun | CAS 6606-65-1 | Histoacryl |
| Chemical compound, drug | Dental cement (Paladur) | Heraeus Kulzer | CAS 9066-86-8 | |
| Chemical compound, drug | Meloxicam (Metacam) | Boehringer Ingelheim | CAS 71125-39-8 | Analgesic compound |
| Strain, strain background (Mus musculus) | C57BL/6 | Charles River | RRID:IMSR_JAX:000664 | |
| Software, algorithm | MATLAB (2021b) | The MathWorks | RRID:SCR_001622 | Data analysis |
| Software, algorithm | LabVIEW | National Instruments | RRID:SCR_014325 | Hardware control |
| Software, algorithm | Python | https://www.python.org/ | RRID:SCR_008394 | Virtual reality |
| Software, algorithm | Panda3D | http://panda3d.org/ | N/A | Virtual reality |
Additional files
-
MDAR checklist
- https://cdn.elifesciences.org/articles/95398/elife-95398-mdarchecklist1-v1.docx
-
Supplementary file 1
All information on statistical tests used in this manuscript.
We used hierarchical bootstrap (Saravanan et al., 2020) or a correlation coefficient for all comparisons.
- https://cdn.elifesciences.org/articles/95398/elife-95398-supp1-v1.docx
Download links
A two-part list of links to download the article, or parts of the article, in various formats.
Downloads (link to download the article as PDF)
Open citations (links to open the citations from this article in various online reference manager services)
Cite this article (links to download the citations from this article in formats compatible with various reference manager tools)
Multimodal mismatch responses in mouse auditory cortex
eLife 13:RP95398.
https://doi.org/10.7554/eLife.95398.4


