Distinct effects of phyllosphere and rhizosphere microbes on invader Ageratina adenophora during its early life stages
- State Key Laboratory for Conservation and Utilization of Bio-Resources in Yunnan, Yunnan University, China
- School of Ecology and Environmental Science, Yunnan University, China
Figures
Figure 1 with 1 supplement
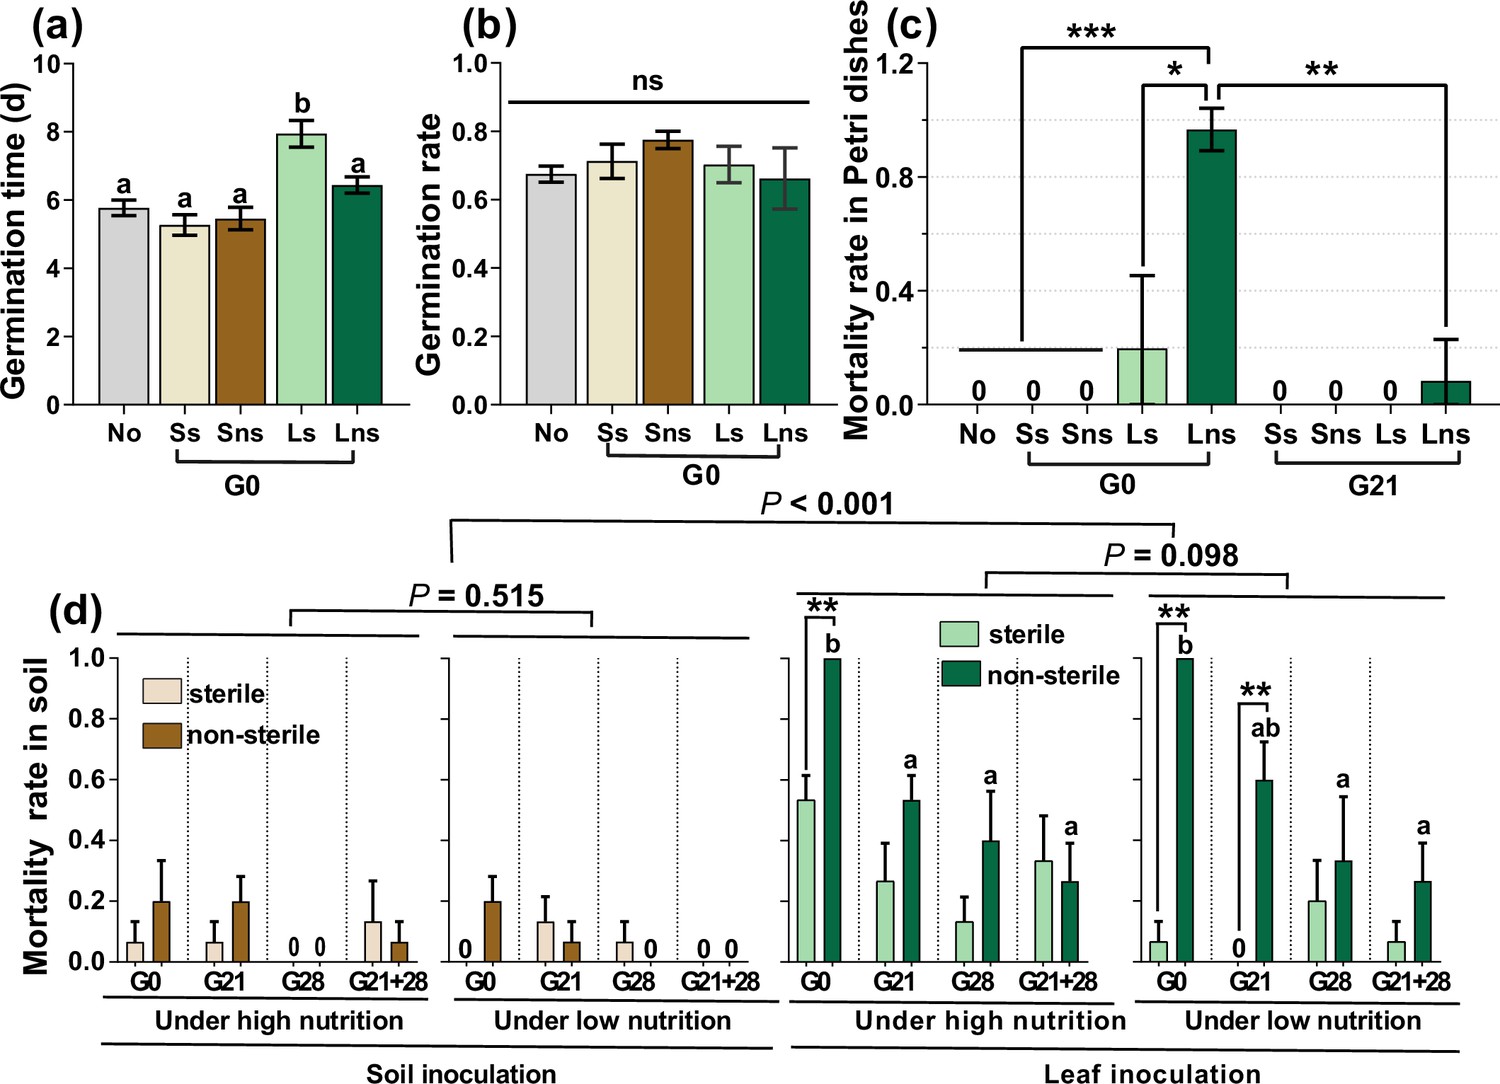
A. adenophora seed germination and seedling mortality.
Seed germination time and rate after soil, leaf or nothing inoculation at the G0 (a–b) and seedling mortality rate after soil, leaf or nothing inoculation at the G0 or G21 and subsequent growth in Petri dishes (c). Seedling mortality rate after 2 weeks when seedlings were transplanted into soil (d). No: nothing inoculated, Ss: sterile soil; Sns: non-sterile soil; Ls: sterile leaf; Lns: non-sterile leaf; G0, inoculated on the day of germination; G21, inoculated on the 21st day after germination; G28, inoculated on the 28th day after germination; G21+28, inoculated on both the 21st and 28th days after germination. *p<0.05, ***p<0.001. Error bars depict the standard error. Different lowercase letters represent significant differences among the different inoculation time treatments (p<0.05). No lowercase letters indicate no differences among the four inoculation time treatments under the same nutrient level (p>0.05).
Figure 1—figure supplement 1
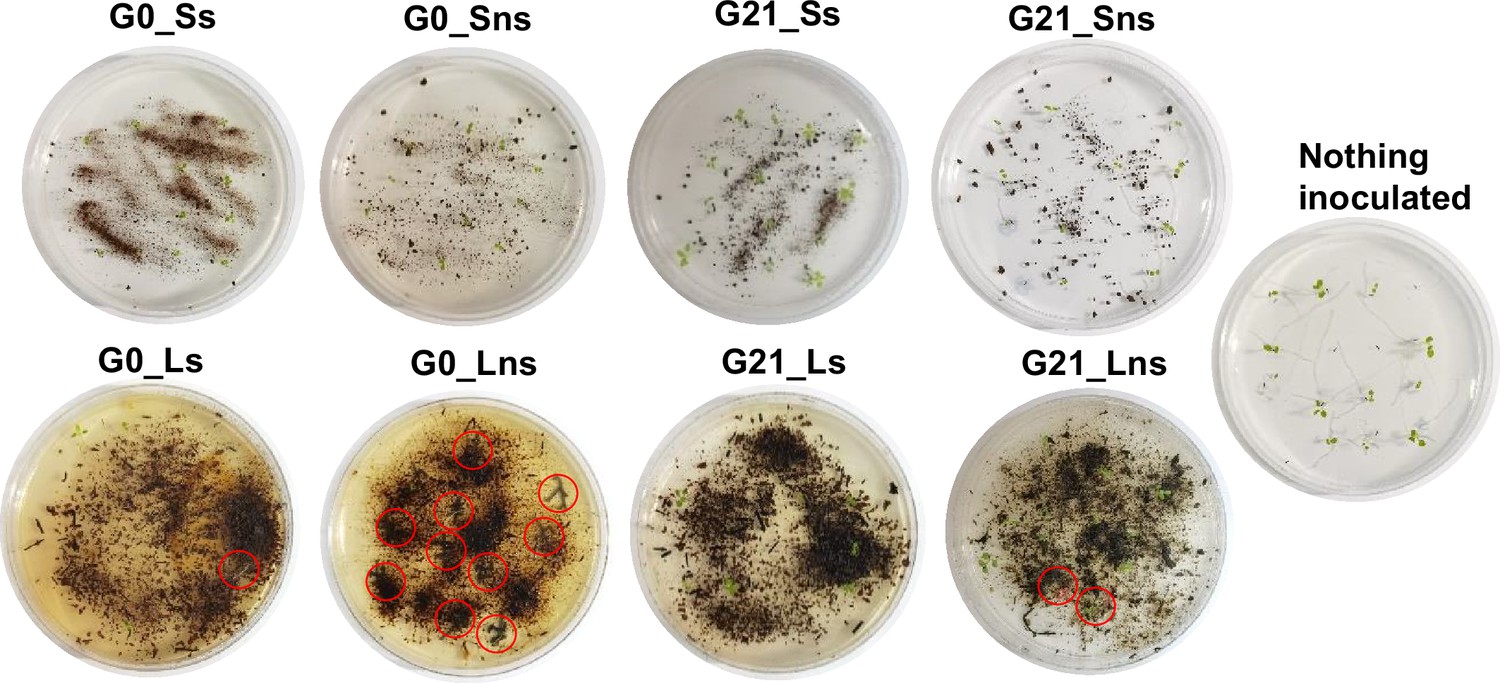
Germination and dead seedlings of A. adenophora inoculated soil (upper) or litter (bottom) in Petri dishes.
Dead seedlings are circled in red. Ss: sterile soil; Sns: non-sterile soil; Ls: sterile leaf; Lns: non-sterile leaf; G0: inoculated on the day of germination; G21: inoculated on the 21st day after germination. The diameter of the Petri dish is 90 mm.
Figure 2
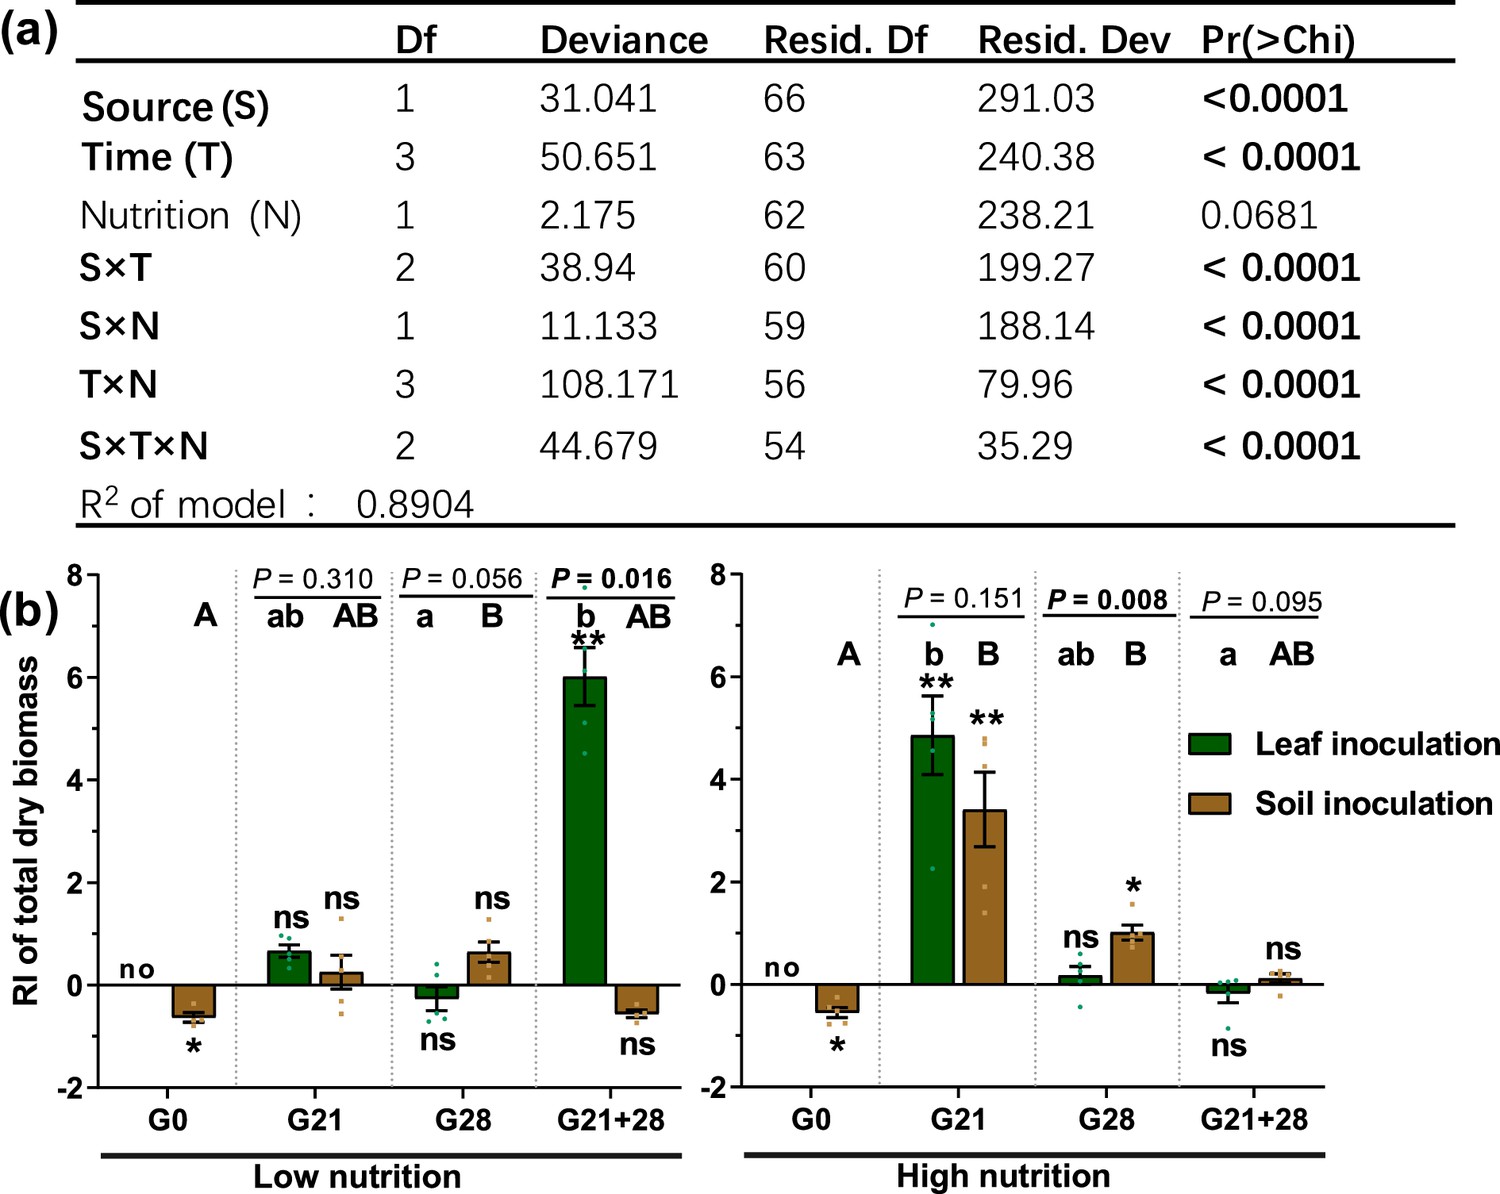
The effects of different treatments and their interactions on seedling growth of A. adenophora.
Generalized linear model (GLM) analysis (a) and comparison (b) of the role of microbes in seedling growth based on total dry biomass (response index [RI]) between leaf and soil inoculated at low and high nutrient levels across four inoculation timepoints. Source refers to the leaf or soil inoculation source, time refers to the four inoculation time treatments, and nutrition refers to the nutrient level of the soil. For G0, G21, G28, and G21+28, see Figure 1. Error bars depict the standard error. The difference in the RI among the different inoculation time treatments is indicated by different capital and lowercase letters for the soil and leaf inoculation treatments, respectively. The asterisks indicate that the RIs are significantly different from zero. ‘No’ indicates no surviving seedlings at harvest. p<0.05 is shown in bold.
Figure 3 with 1 supplement
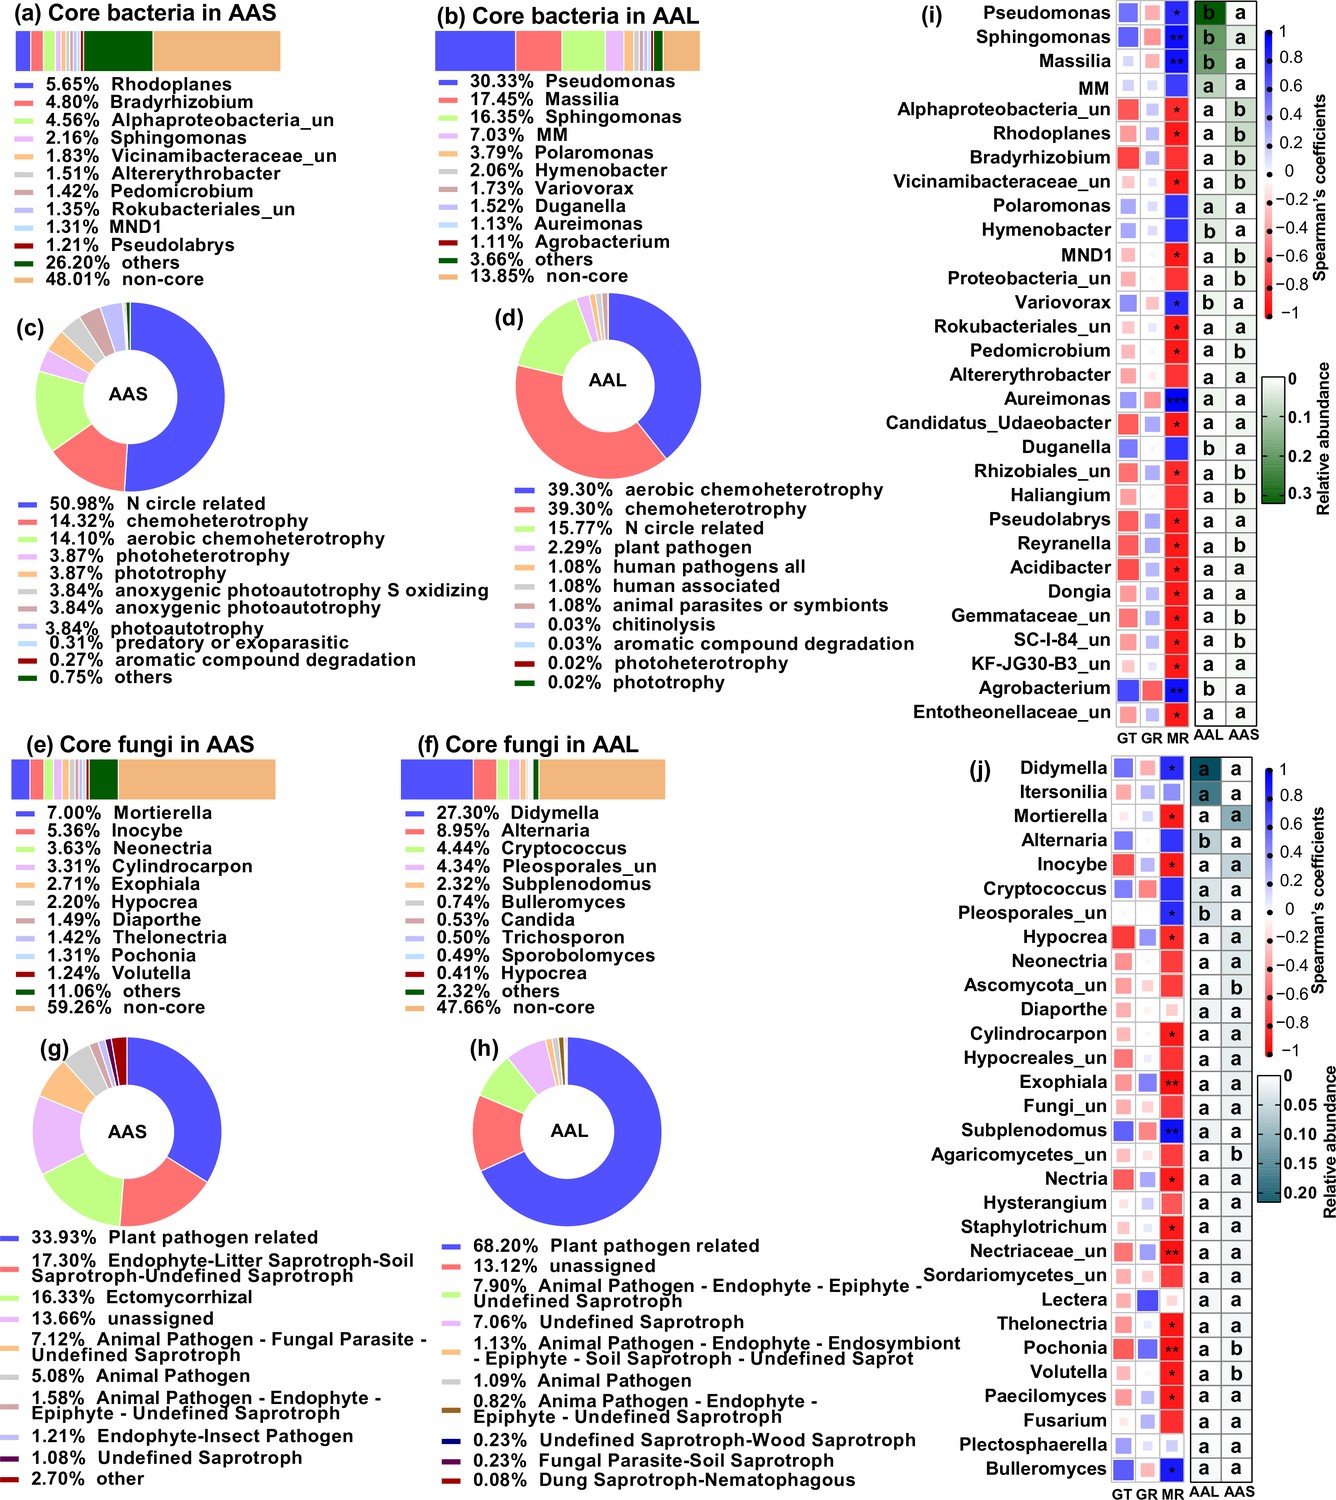
Microbial communities and functions in inoculation sources and their relationship with seed germingation and seedling survival of A. adenophora.
Microbial community composition and potential functional differences between leaf litter (AAL) and rhizosphere soil (AAS) inocula (a–h), as well as correlations of microbial genera with seed germination and seedling mortality (i–j). Core bacteria (a–b) and fungi (e–f) in the AAS and AAL groups. The potential functions of the core bacteria (c–d) and fungi (g–h) in the AAS and AAL. Correlations of the relative abundance of the top 30 bacterial (i) and fungal (j) genera in the AAS and AAL with germination time (GT), germination rate (GR), and mortality rate (MR). Only the top 10 core taxa and potential functional groups are shown in the figures. The ‘un’ in the figures is the abbreviation for ‘unclassified’, and the MM is Methylobacterium-Methylorubrum. Several bacterial functions classified as N circles-related in the AAL and AAS are shown in Figure 3—source data 1 and 2. Several fungal guilds classified as plant pathogen-related guilds in the AAL and AAS are shown in Figure 3—source data 3 and 4. Red and blue represent negative and positive Spearman’s coefficients, respectively. *p<0.05, **p<0.01, ***p<0.001. Different lowercase letters in the heatmap represent significant differences in the relative abundance of the same genus between AAS and AAL (p<0.05).
-
Figure 3—source data 1
Potential functions of the core bacteria in A. adenophora rhizosphere soils.
- https://cdn.elifesciences.org/articles/95502/elife-95502-fig3-data1-v1.xlsx
-
Figure 3—source data 2
Potential functions of the core bacteria in A. adenophora leaf litter.
- https://cdn.elifesciences.org/articles/95502/elife-95502-fig3-data2-v1.xlsx
-
Figure 3—source data 3
Potential functional guilds of core fungi in A. adenophora rhizosphere soils.
- https://cdn.elifesciences.org/articles/95502/elife-95502-fig3-data3-v1.xlsx
-
Figure 3—source data 4
Potential functional guilds of the core fungi in A. adenophora leaf litter.
- https://cdn.elifesciences.org/articles/95502/elife-95502-fig3-data4-v1.xlsx
Figure 3—figure supplement 1
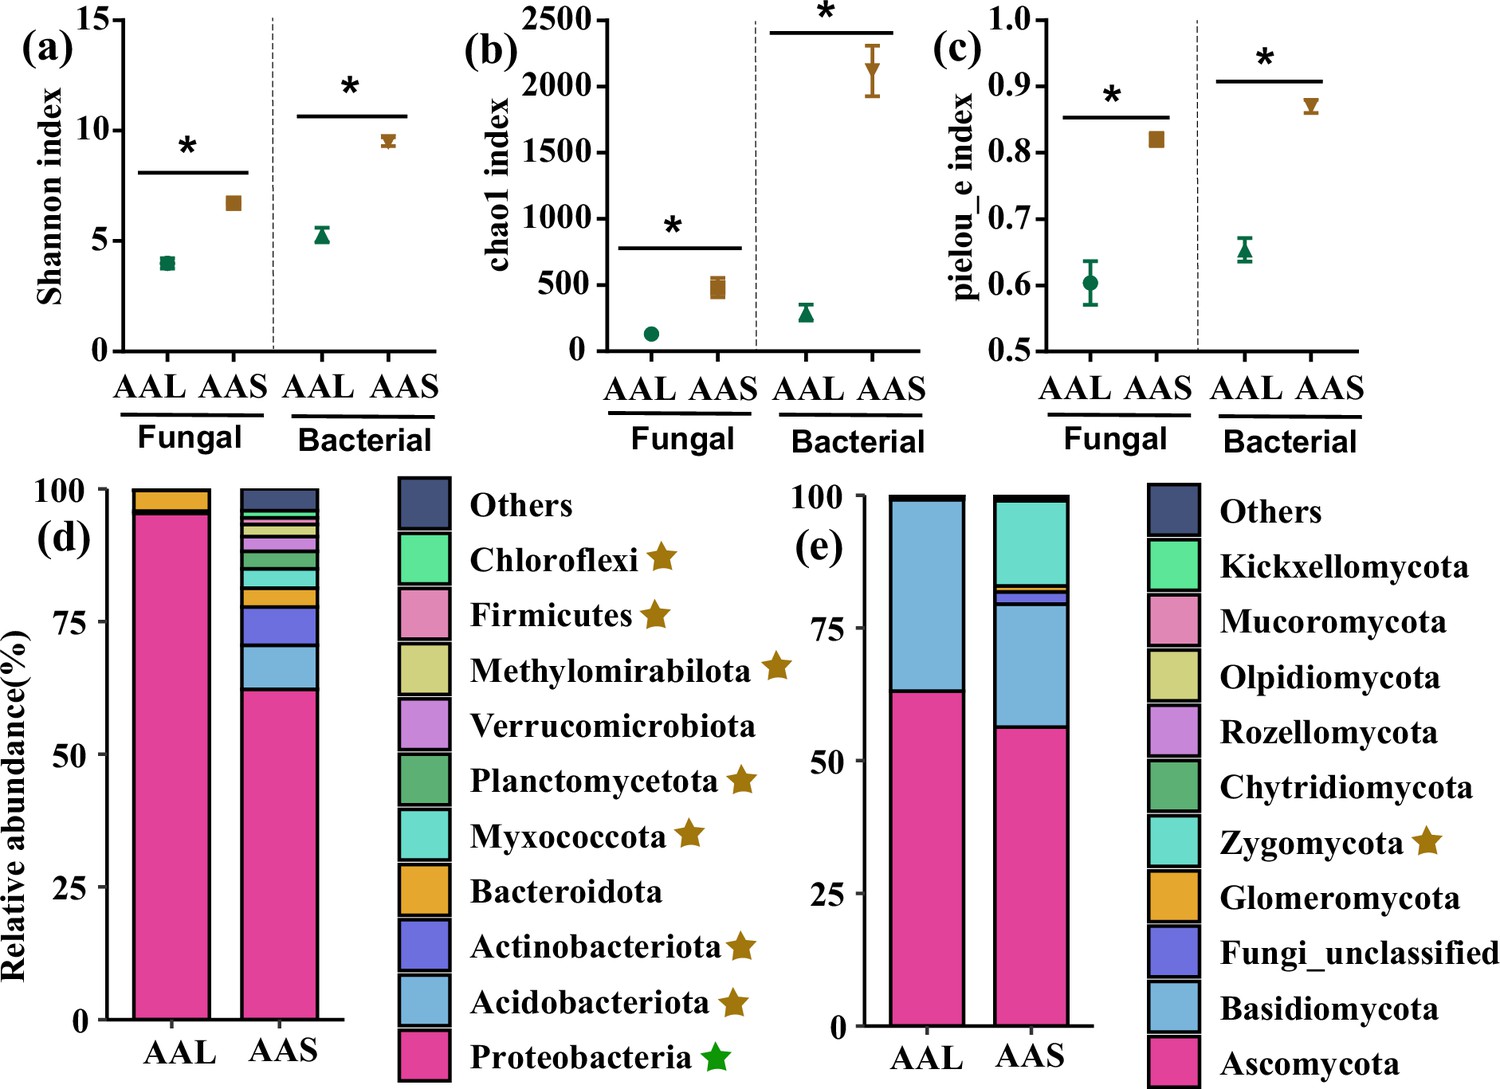
Microbial diversity and community composition at the phylum level in the inoculum AAS and AAL groups.
Fungal and bacterial Shannon, Chao 1 and Pielou_e indices of AAS and AAL (a–c). Relative abundances of bacterial (d) and fungal phyla (e) in the AAS and AAL. AAS: A. adenophora rhizosphere soil inoculum, AAL: A. adenophora litter inoculum. Brown stars represent significantly greater relative abundances in the AAS than in the AAL, green stars represent significantly greater relative abundances in the AAL than in the AAS, p<0.05 at least.
Figure 4 with 1 supplement
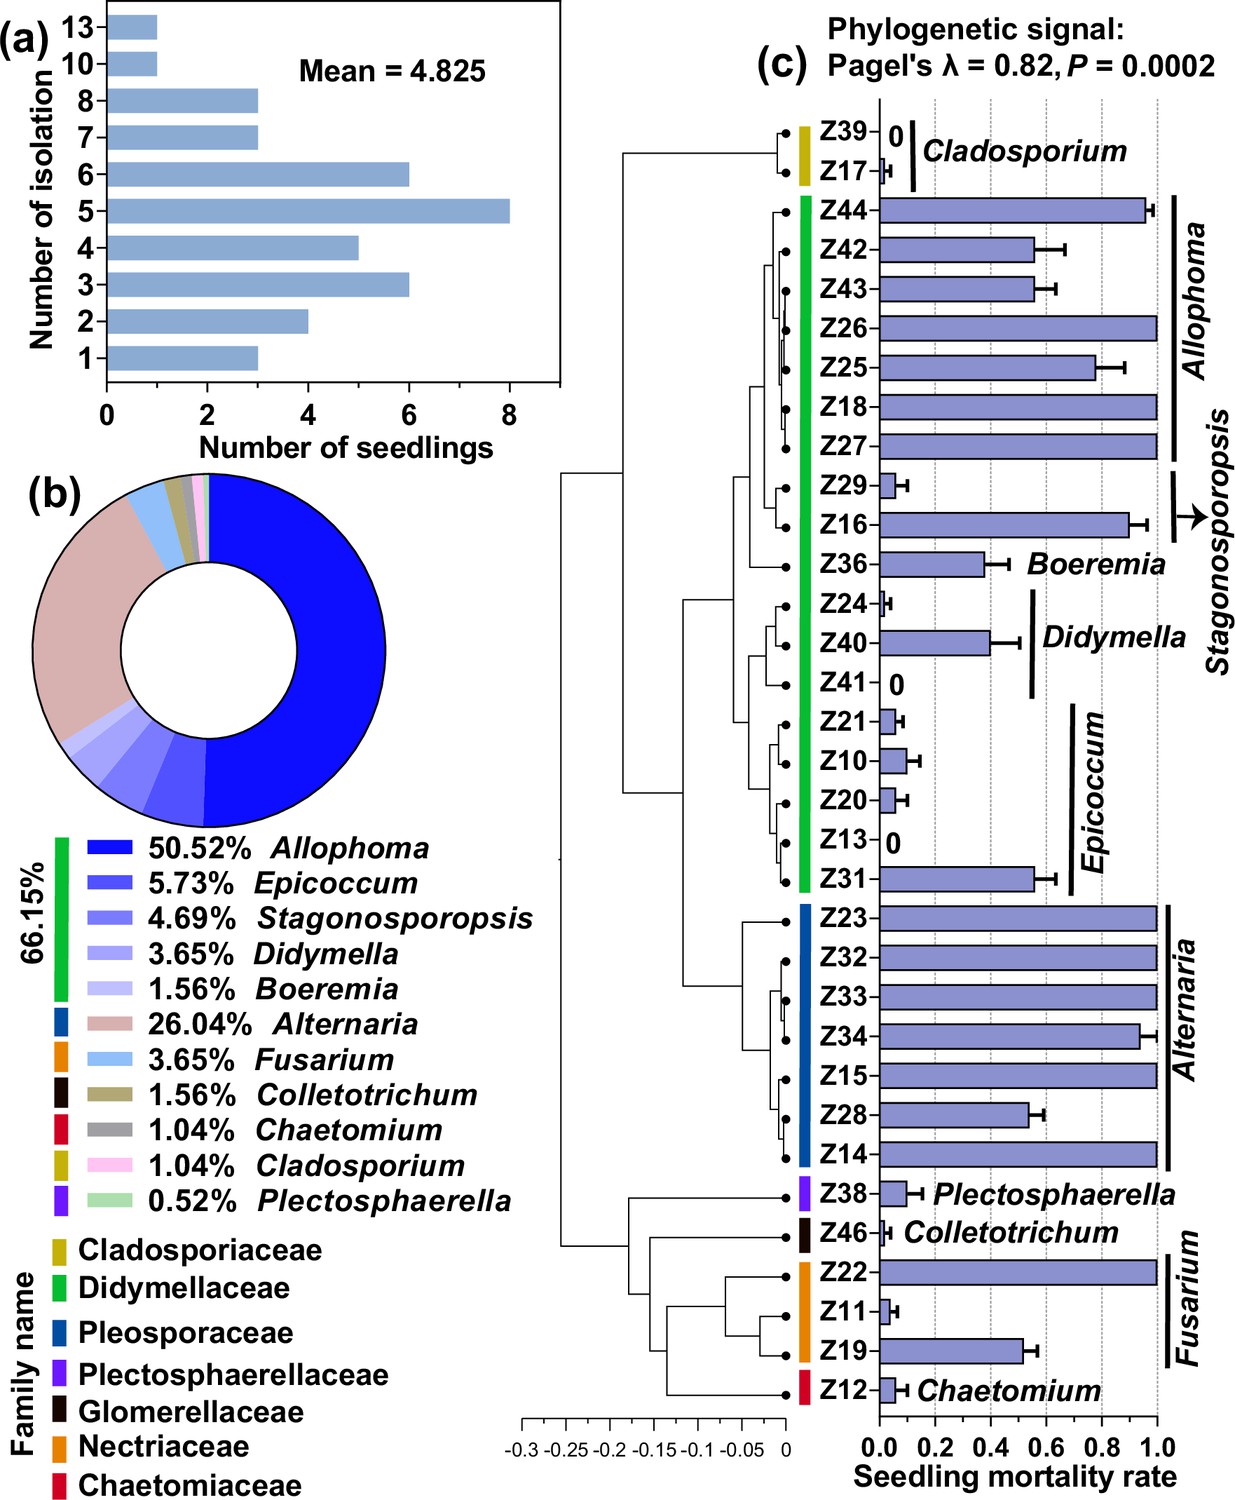
Cultivable fungi associated with dead A. adenophora seedlings and their seedling-killing effects on A. adenophora.
Isolation frequency from one dead seedling (a) and cultivable fungal community composition at the genus level (b). The seedling-killing effects of 33 fungal strains on A. adenophora and their phylogenetic signals (c).
-
Figure 4—source data 1
Taxonomy information of 33 representative strains isolated from 40 dead seedlings.
- https://cdn.elifesciences.org/articles/95502/elife-95502-fig4-data1-v1.xlsx
Figure 4—figure supplement 1
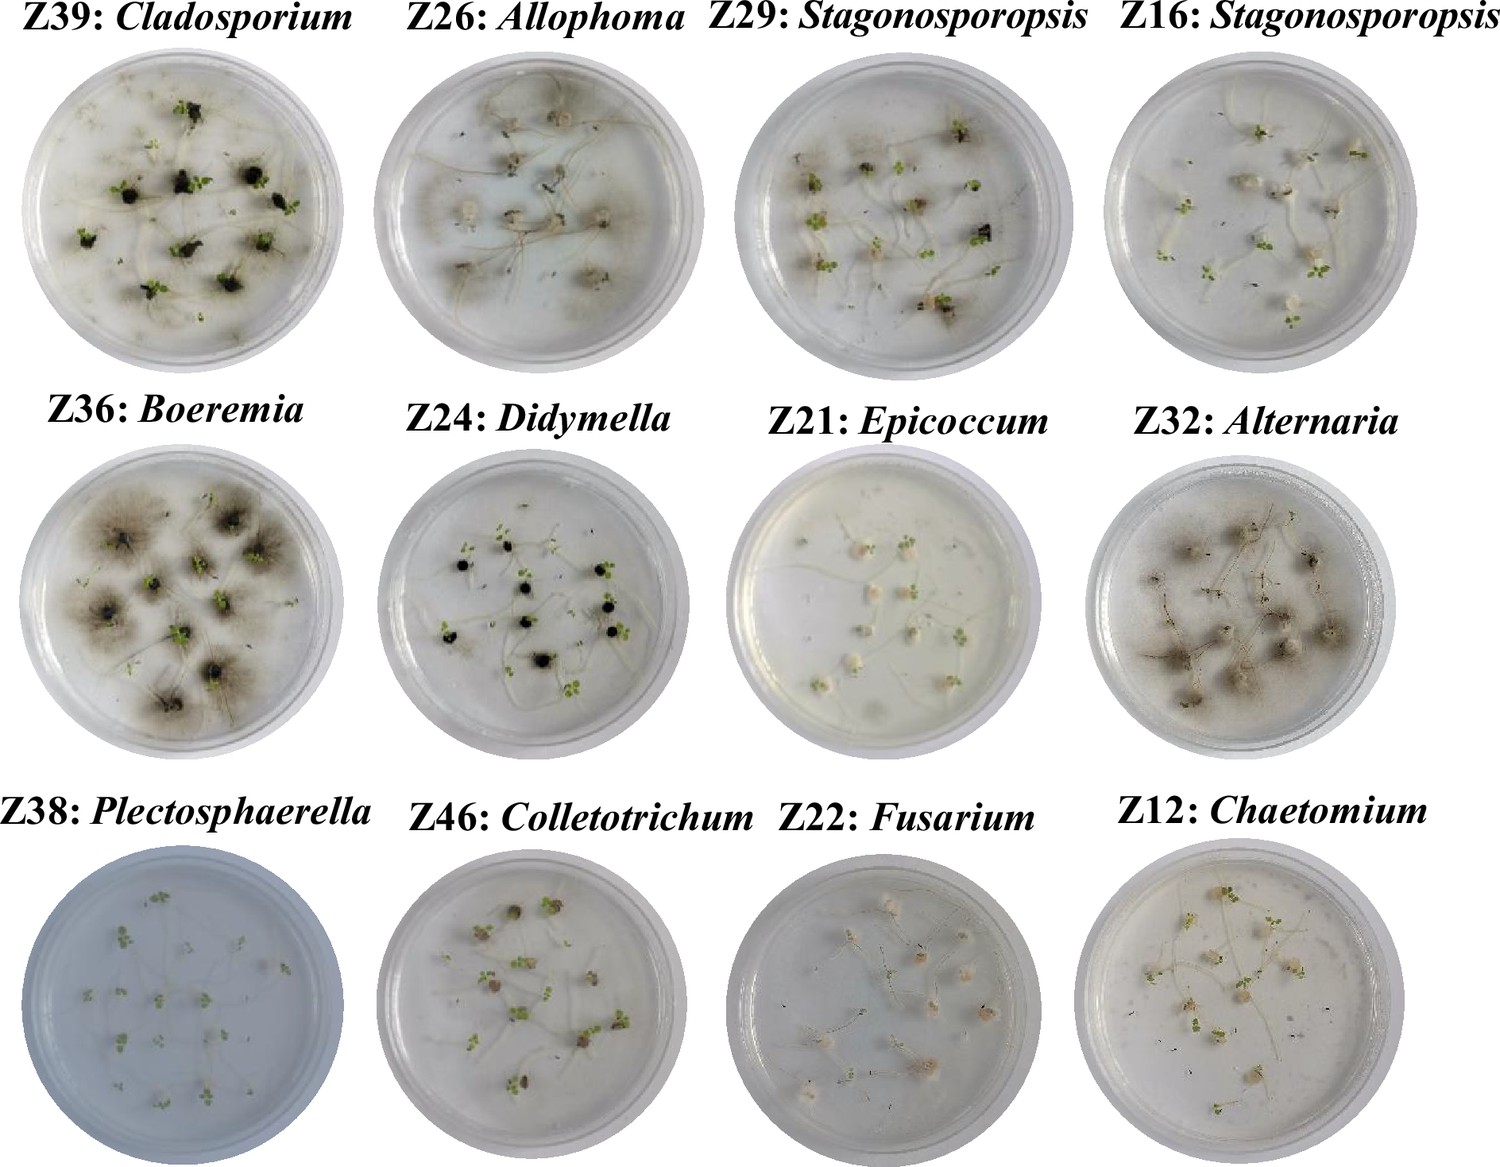
Seedling-killing effects of several representative strains on A. adenophora.
The diameter of the Petri dish is 9 mm.
Figure 5 with 1 supplement
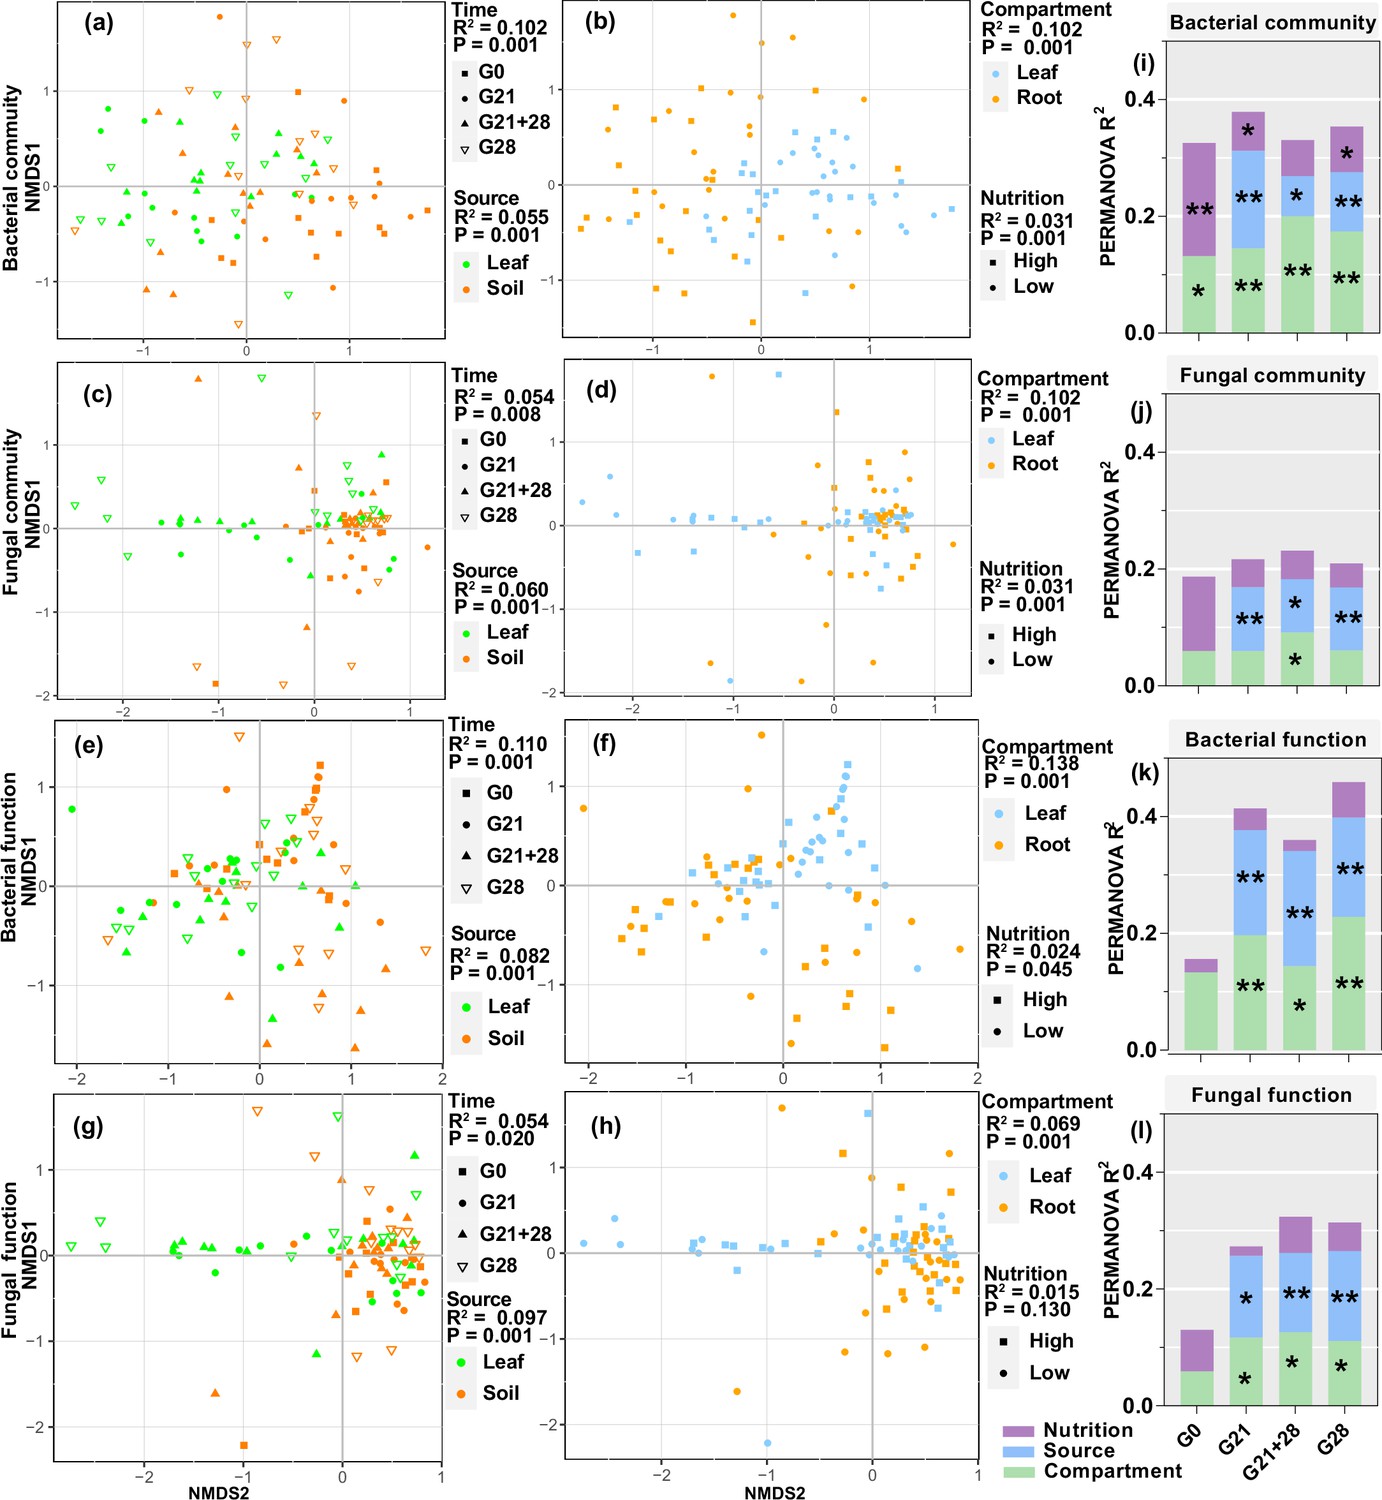
Enrichment of bacterial and fungal communities and functions by A. adenophora seedlings under different treatments.
Nonmetric multidimensional scaling (NMDS) ordinations of Bray-Curtis dissimilarity matrices with permutational analysis of variance (PERMANOVA) of bacterial and fungal communities and function (a–h). Contribution of plant compartment, inoculation source, and nutrient level to the variation in bacterial and fungal communities and function at each inoculation time based on PERMANOVA (i–l). *p<0.05, **p<0.01, ***p<0.001.
-
Figure 5—source data 1
PERMANOVA of bacterial communities and function at each inoculation time treatments.
- https://cdn.elifesciences.org/articles/95502/elife-95502-fig5-data1-v1.xlsx
-
Figure 5—source data 2
PERMANOVA of fungal communities and function at each inoculation time treatments.
- https://cdn.elifesciences.org/articles/95502/elife-95502-fig5-data2-v1.xlsx
Figure 5—figure supplement 1
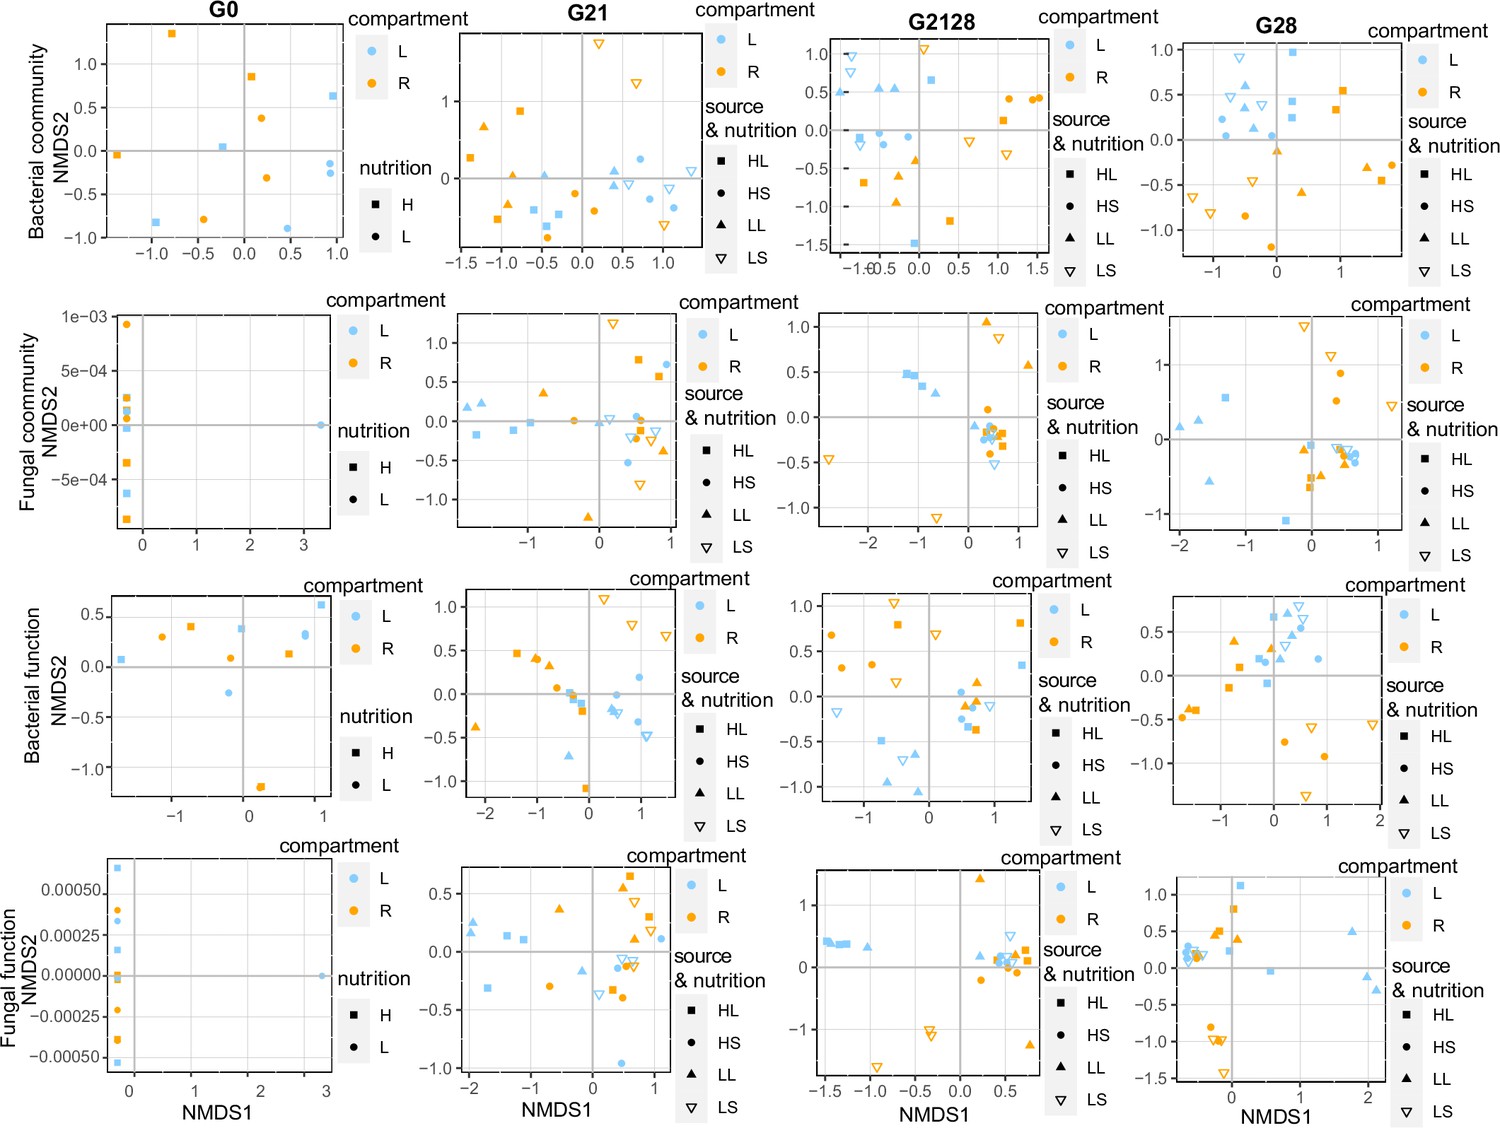
Nonmetric multidimensional scaling (NMDS) results for the bacterial and fungal communities and function in each inoculation time treatment.
The different colors represent the different compartments (light blue represents leaves, and orange represents roots). L: leaf; R: root; H: high nutrition level; L: low nutrition level; HL: seedling after leaf inoculation growing under high nutrition level; HS: seedling after soil inoculation growing under high nutrition level; LL: seedling after leaf inoculation growing under low nutrition level; LS: seedling after soil inoculation growing under low nutrition level.
Figure 6 with 1 supplement
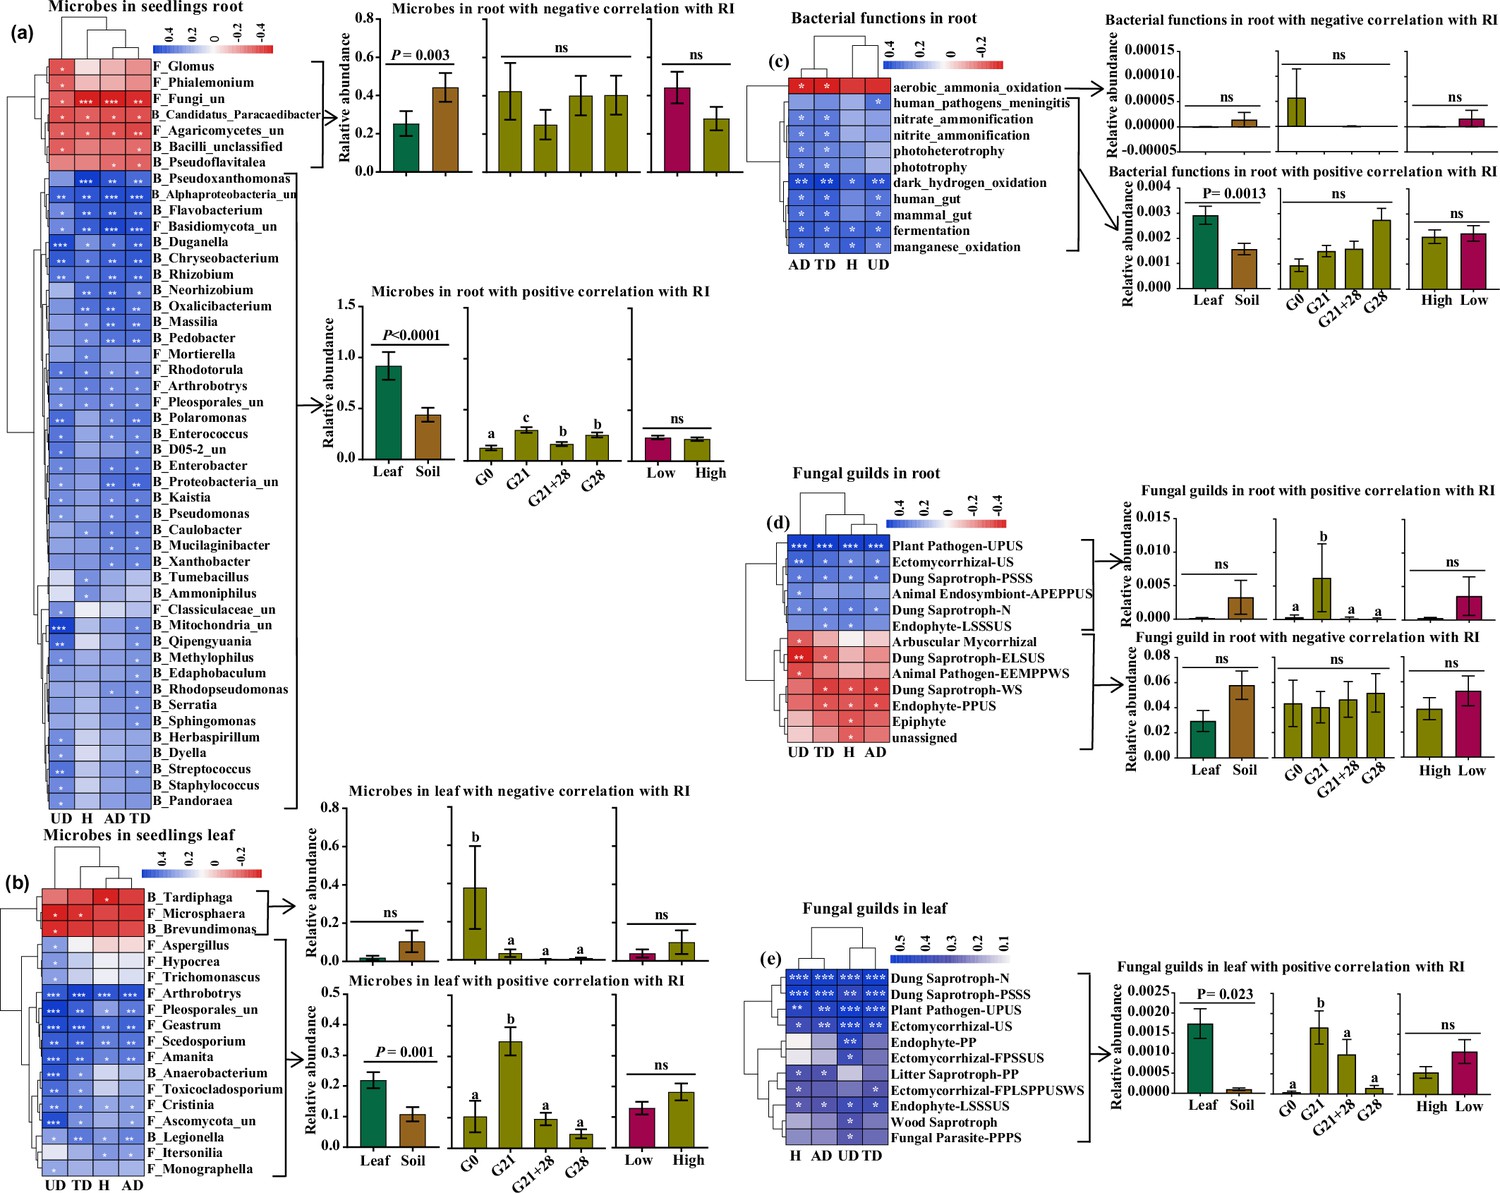
Correlations of the enriched microbial community and function with A. adenophora seedling growth.
These genera accounted for more than 1% of the total relative abundance in seedling roots or leaves. (a) Correlations between 47 out of 214 genera enriched in roots with response index (RI) (left) and the relative abundances of genera under different treatments, i.e., different inoculation sources and time and nutrient levels (right). (b) Correlations between 18 out of 184 genera enriched in leaves with RI (left) and the relative abundances of genera under different treatments (right). (c) Correlations between putative bacterial functions enriched in roots with RIs (left) and the relative abundances of functions with negative and positive correlations under different treatments (right). (d) Correlations between fungal guilds enriched in roots with RIs (left) and the relative abundances of guilds with negative and positive correlations under different treatments. (e) Correlations between fungal guilds in leaves with RIs (left) and the relative abundances of guilds with positive correlations under different treatments (right). No bacterial functions in the leaves showed a significant correlation with seedling growth. ‘F_’ represents fungal genera, ‘B_’ represents bacterial genera, ‘un’ represents unclassified; H: RI of seedling height; AD: RI of aboveground dry biomass; UD: RI of underground dry biomass; TD: RI of total dry biomass. Red and blue represent negative and positive Spearman’s coefficients, respectively. *p<0.05, **p<0.01, ***p<0.001. For abbreviations of fungal function guilds, please see Figure 6—source data 1.
-
Figure 6—source data 1
Information about the abbreviations for the fungal functional guilds shown in Figure 6D-E.
- https://cdn.elifesciences.org/articles/95502/elife-95502-fig6-data1-v1.xlsx
Figure 6—figure supplement 1
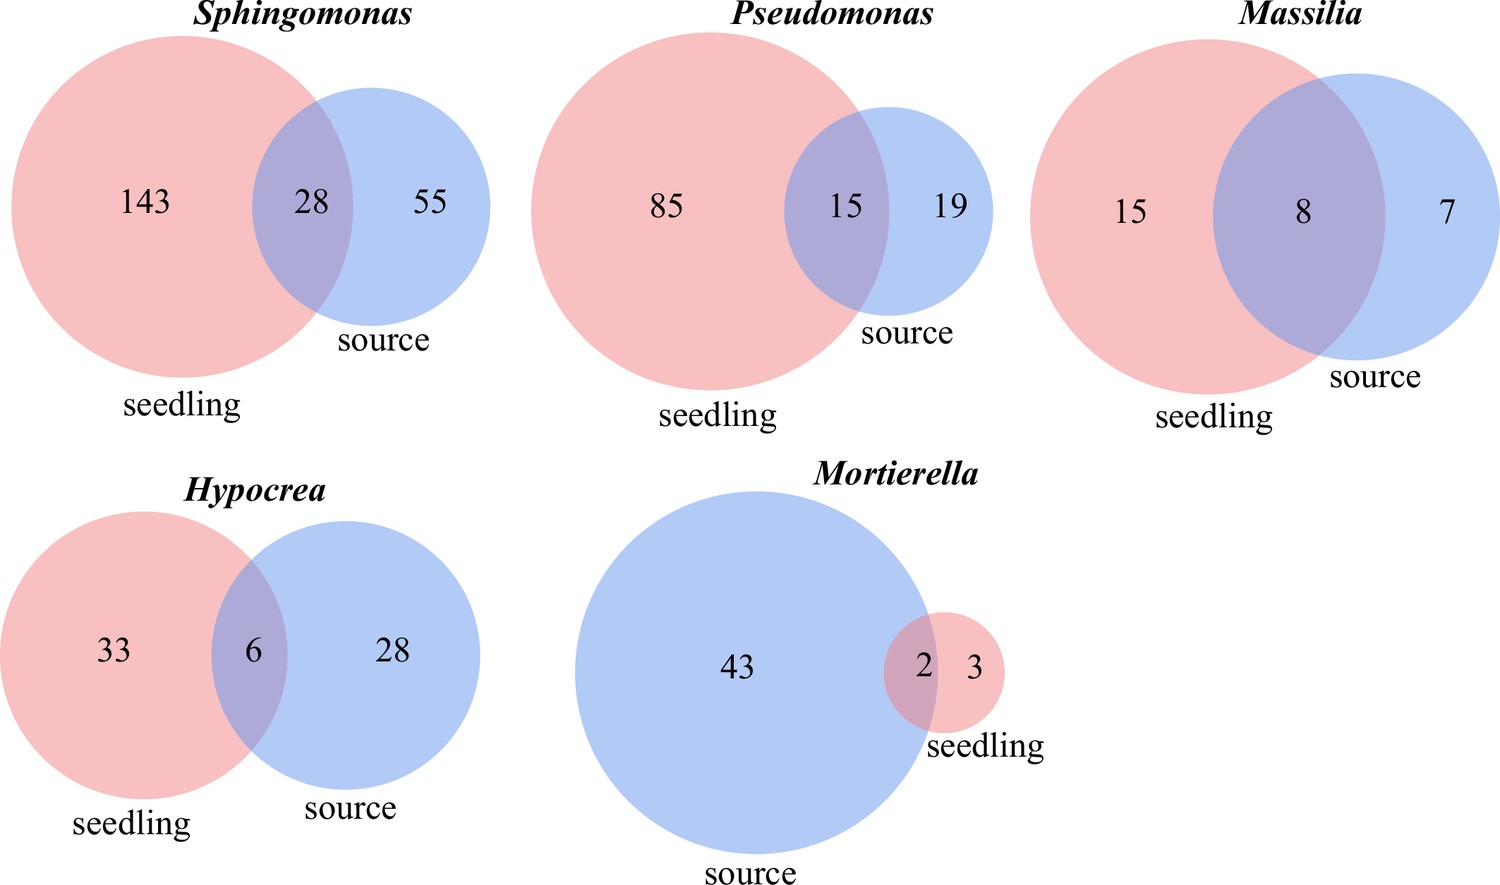
Number of shared amplicon sequence variants (ASVs) between seedlings and inoculum source (soil and litter) of several genera with significant correlation with seedling mortality and growth.
Three bacterial genera (upper) and two fungal genera (bottom).
Figure 7 with 3 supplements
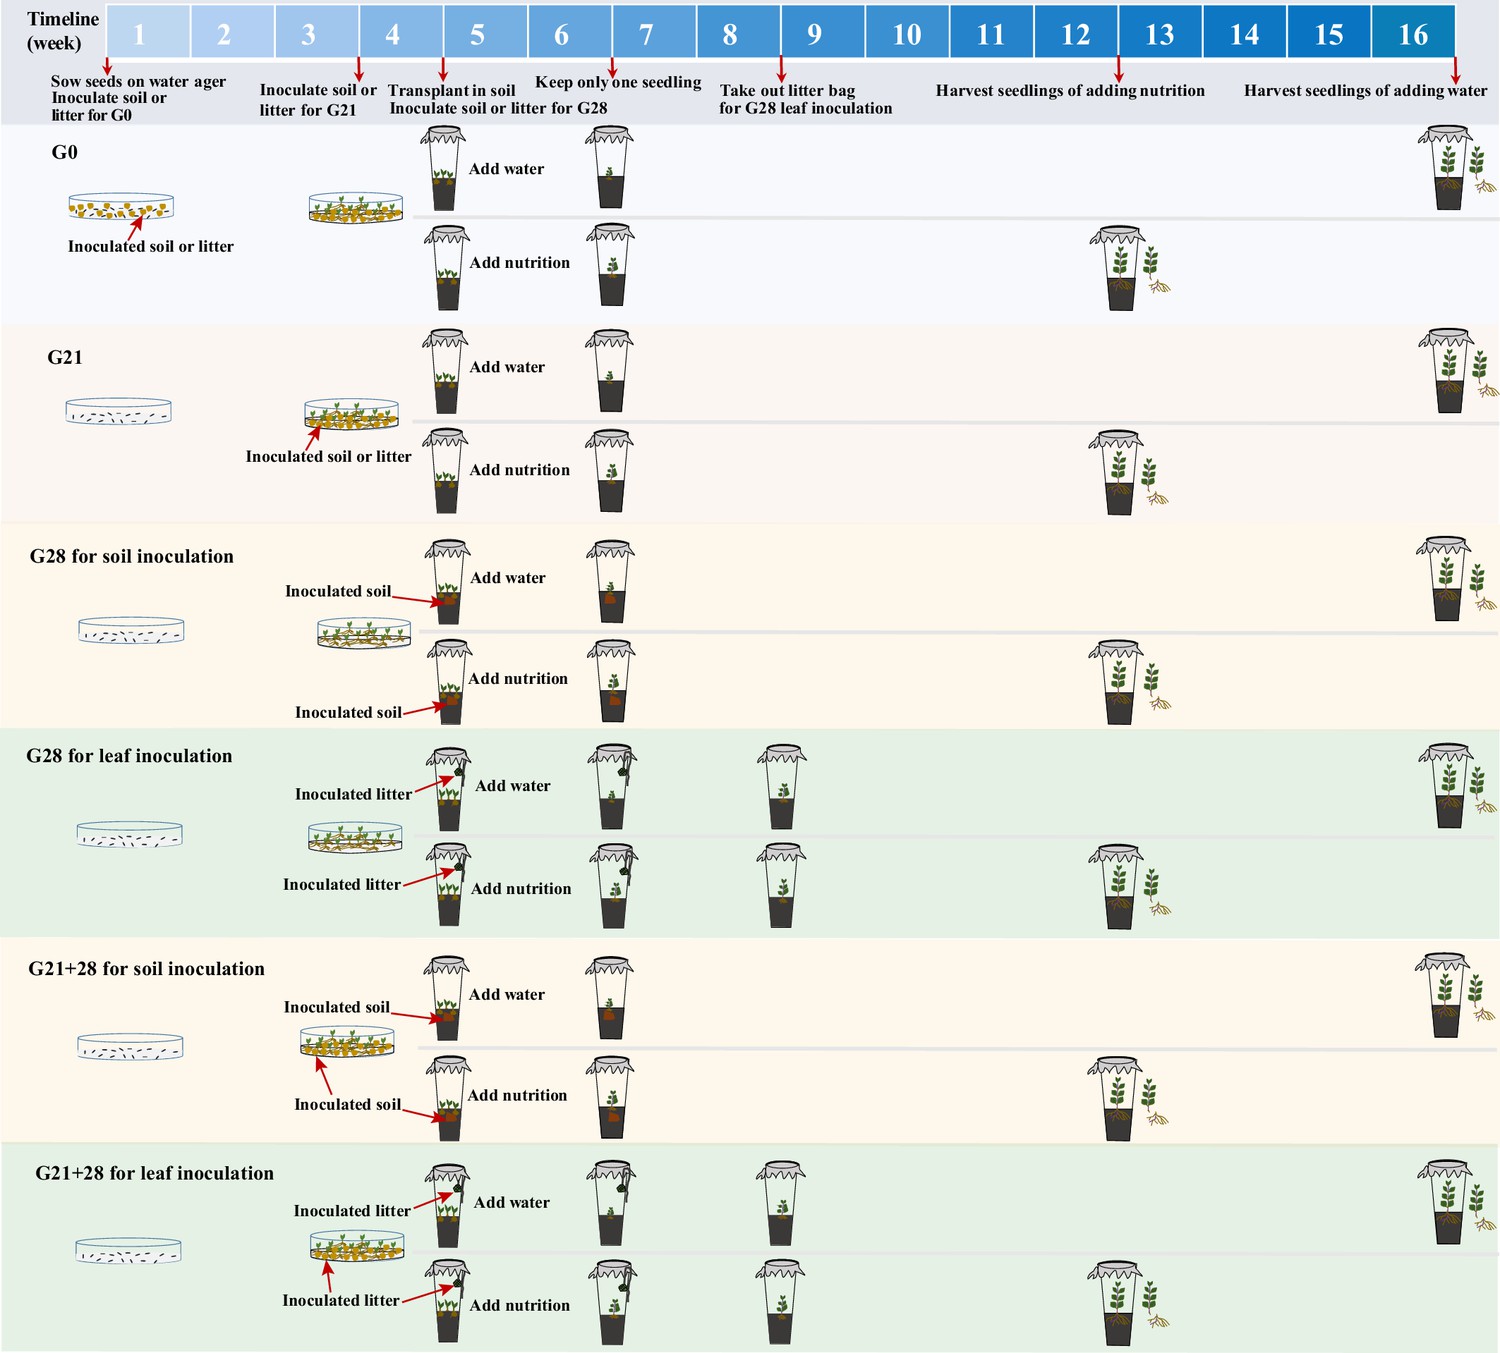
Schematic diagram of soil or litter inoculation at different growth stages.
The abbreviations G0, G21, G28, and G21+28 are shown in Figure 1.
Figure 7—figure supplement 1
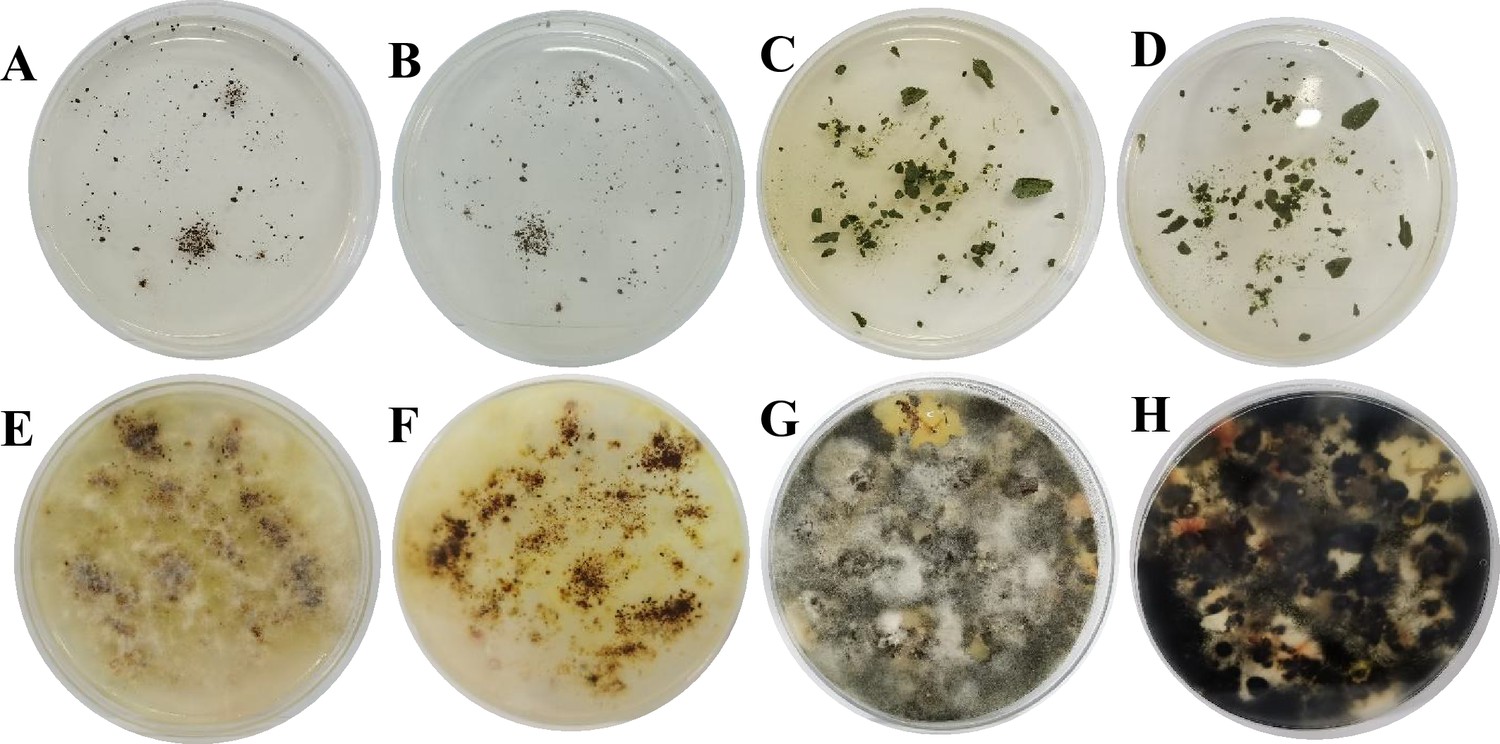
Gamma irradiation was effective at killing all the microorganisms.
(A–D) Front and reverse views of gamma-irradiated soil or leaves inoculated on PDA media on the 7th day. (E–H) Front and reverse views of living soil and leaves inoculated on PDA media on the 7th day. The diameter of the Petri dish is 9 mm.
Figure 7—figure supplement 2
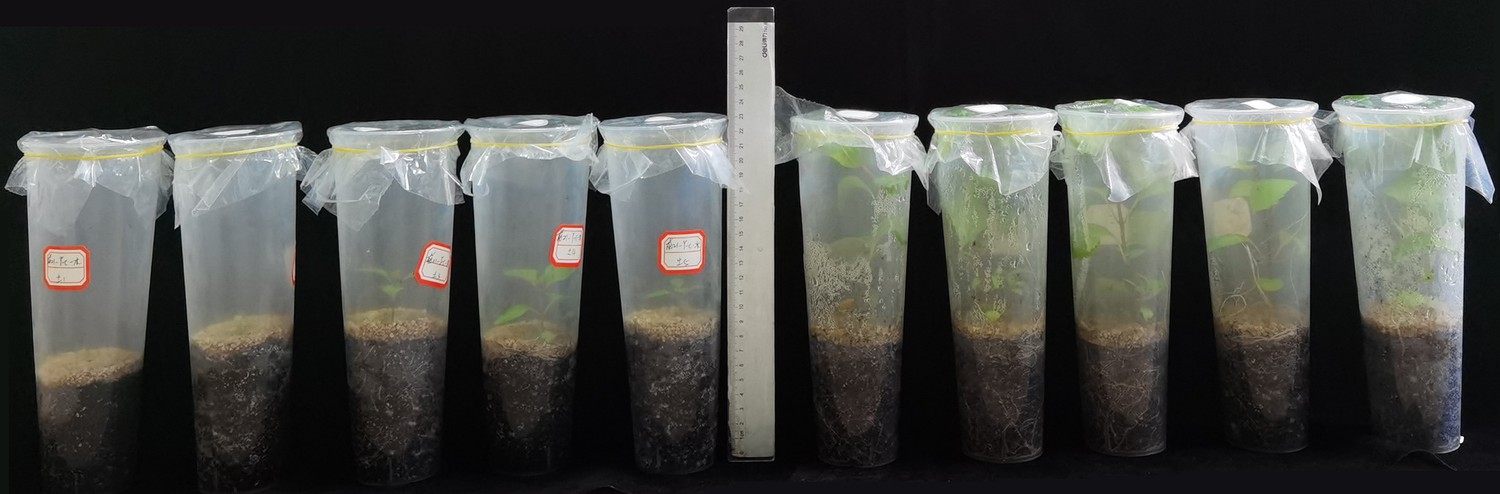
Seedlings were grown for 8 weeks under low (adding water, left) or high (adding Hoagland nutrient solution, right) nutrient levels.
Figure 7—figure supplement 3
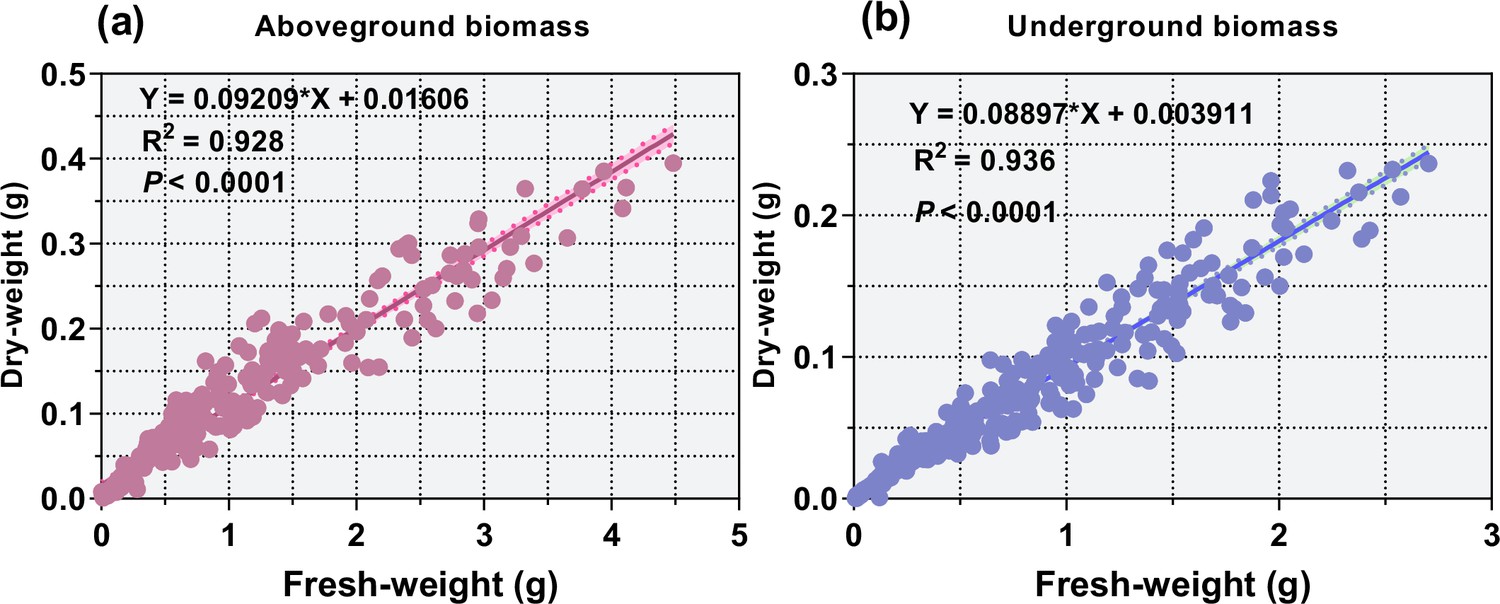
Linear regression between the fresh and dry weights of aboveground biomass (a) and underground biomass (b).
Additional files
-
Supplementary file 1
Fertilizer content in the Pindstrup substrate.
- https://cdn.elifesciences.org/articles/95502/elife-95502-supp1-v1.xlsx
-
MDAR checklist
- https://cdn.elifesciences.org/articles/95502/elife-95502-mdarchecklist1-v1.docx
Download links
A two-part list of links to download the article, or parts of the article, in various formats.
Downloads (link to download the article as PDF)
Open citations (links to open the citations from this article in various online reference manager services)
Cite this article (links to download the citations from this article in formats compatible with various reference manager tools)
Distinct effects of phyllosphere and rhizosphere microbes on invader Ageratina adenophora during its early life stages
eLife 13:RP95502.
https://doi.org/10.7554/eLife.95502.3


