Discarded sequencing reads uncover natural variation in pest resistance in Thlaspi arvense
- Plant Evolutionary Ecology, Institute of Evolution and Ecology, University of Tübingen, Germany
- Royal Botanic Gardens, Kew, United Kingdom
- Chemical Ecology, Bielefeld University, Germany
Figures
Figure 1 with 1 supplement
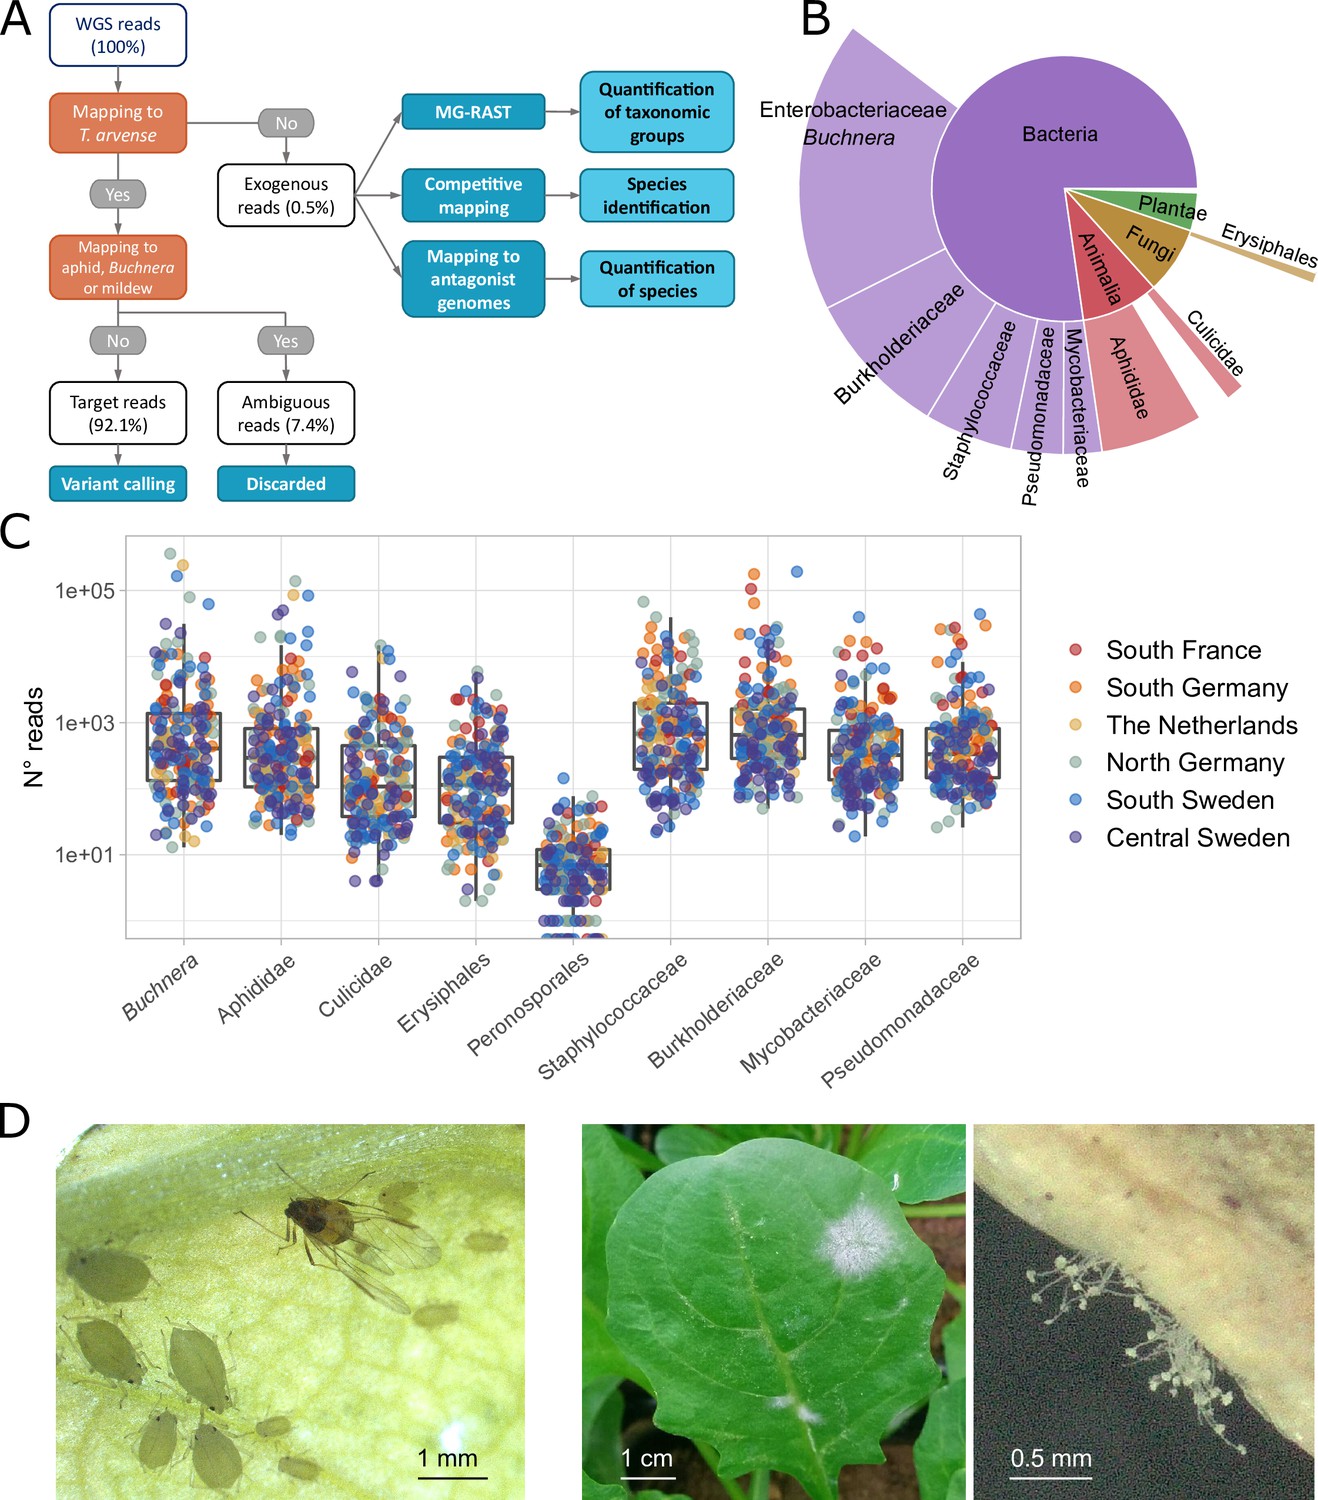
Classification of sequencing reads in T. arvense whole-genome sequencing (WGS) data.
(A) Workflow of the analyses, including reads classification (orange nodes) into target, ambiguous, and exogenous reads, and downstream analysis (dark blue nodes) (see Materials and methods). (B) Fractions of exogenous reads assigned to different taxonomic groups by MG-RAST (Meyer et al., 2008; Keegan et al., 2016). (C) Read counts assigned to nine selected groups in our 207 T. arvense samples from different European regions. (D) Aphids and mildew occurring on T. arvense leaves during our experiment.
Figure 1—figure supplement 1
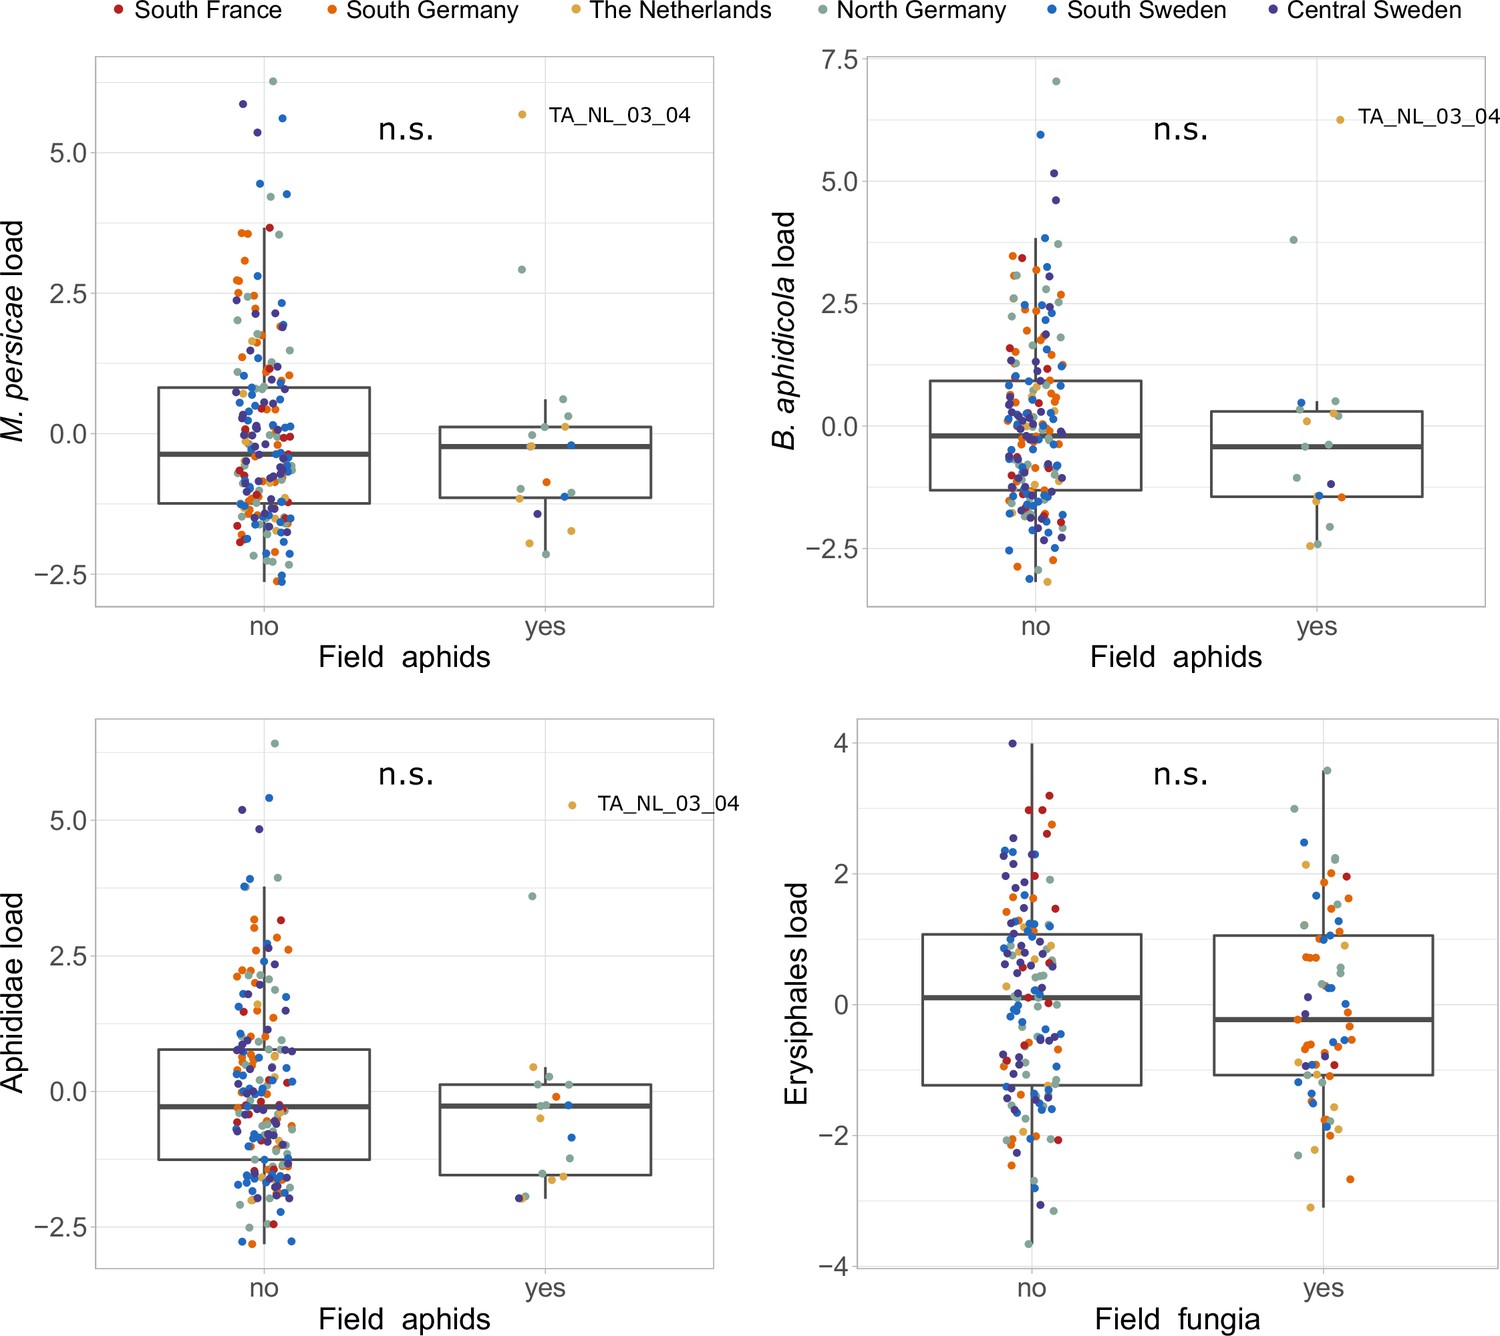
Pest loads in samples with or without pests in the field.
Offspring from plants with or without pathogens in the field did not differ (n.s.) in pathogen loads in the glasshouse, suggesting the pathogens were not carried with the seeds. A single outlier (TA_NL_03_04) with aphids in the field also showed high levels of aphid load in the glasshouse and was excluded from the analysis.
Figure 2
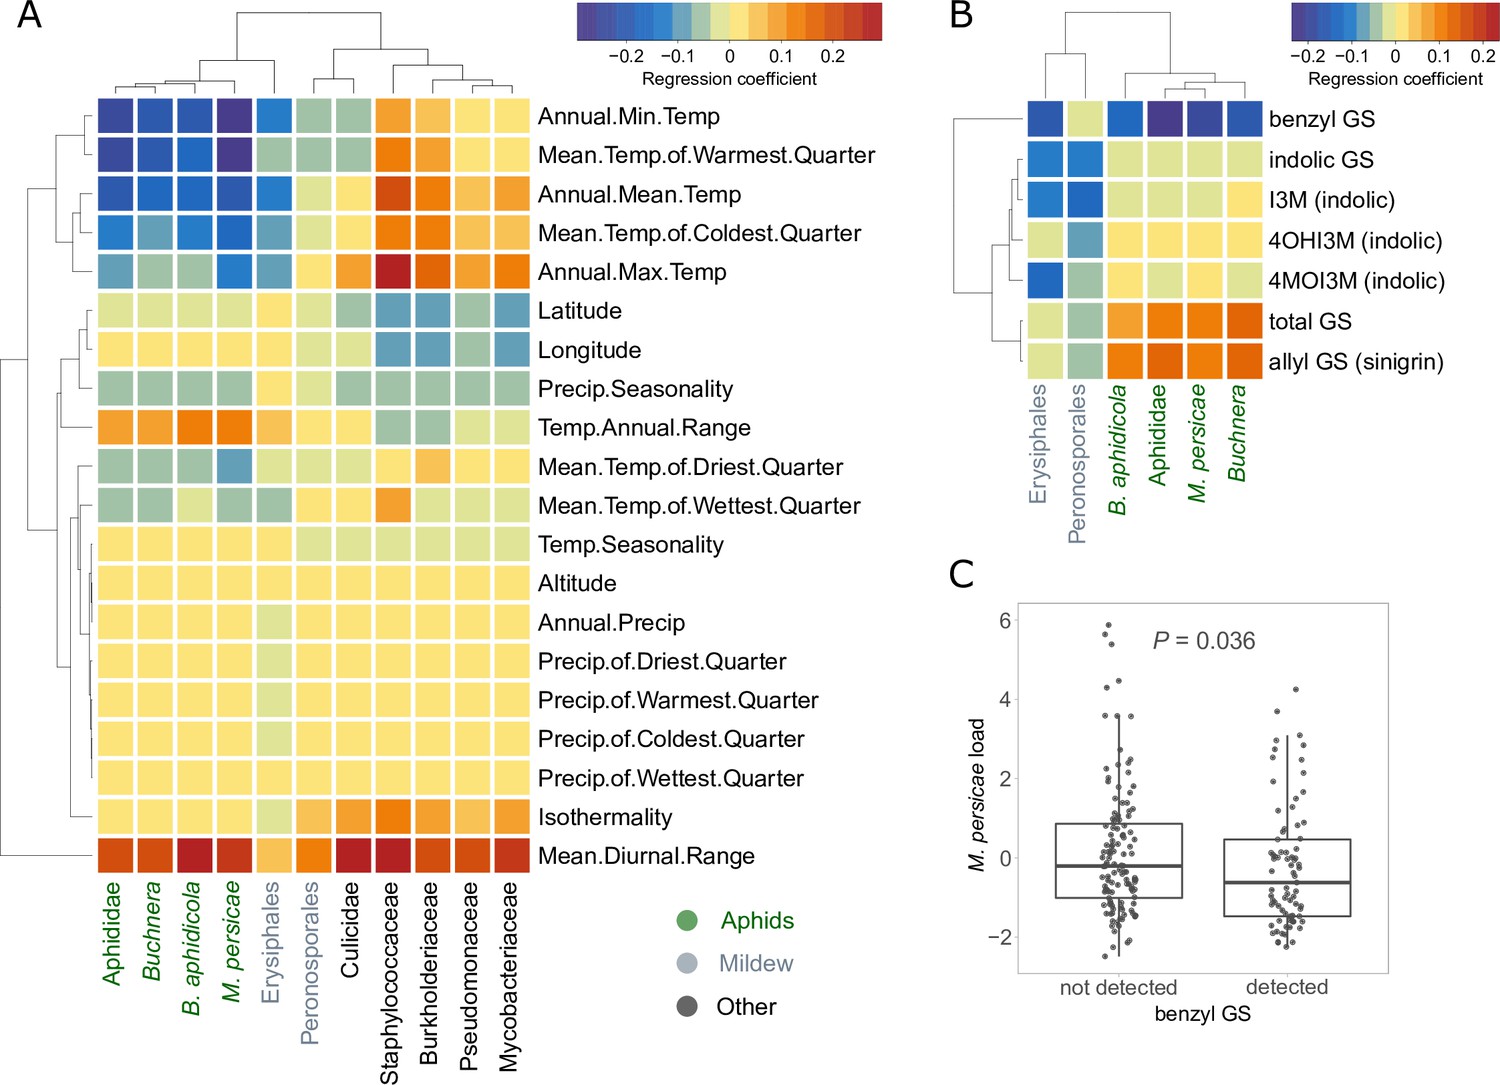
Relationships between climates of origin or glucosinolate levels of plants and the exogenous reads loads.
(A) Correlations with bioclimatic variables. (B) Correlations with baseline glucosinolate (GS) levels measured in the same pennycress lines in another experiment. All correlations in (A) and (B) were done after correction for population structure. Aphid-related read counts are in green, mildew-related in gray, others in black. (C) Boxplot of the aphid reads residuals in samples where benzyl GS was detected vs. not. The p-value is based on the Welch’s t-test for unequal variances. I3M: indol-3-yl methylGS; 4MOI3M: 4-methoxyindol-3-yl methylGS; 4OHI3M: 1-methoxyindol-3-yl methylGS.
Figure 3 with 3 supplements
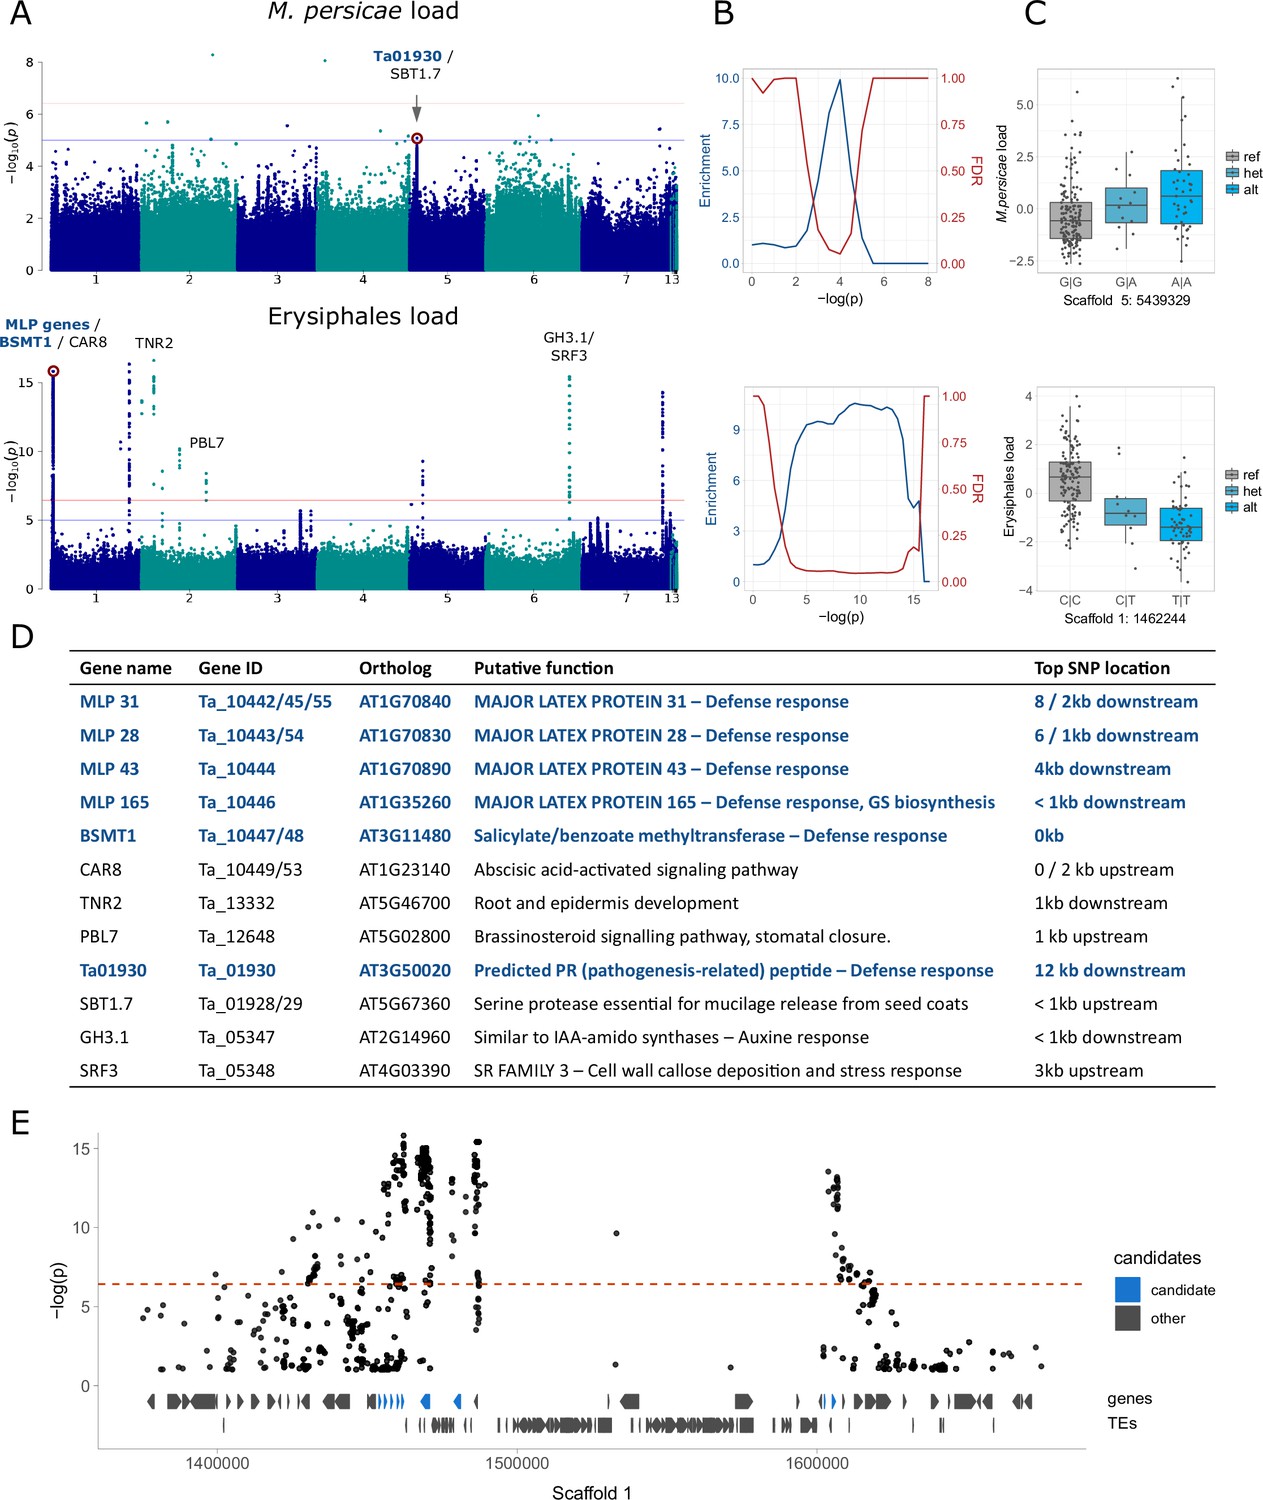
Genome-wide association analyses for aphid and mildew loads.
We show only the results for M. persicae and MG-RAST Erysiphales read counts; for full results see Figure 3—figure supplements 2 and 3. (A) Manhattan plots, annotated with genes potentially affecting aphid/mildew colonization. The genome-wide significance (horizontal red line) was calculated based on unlinked variants (Sobota et al., 2015), the blue line corresponds to -log(p)=5. (B) Corresponding to the Manhattan plots on the left, enrichment of a priori candidates and expected false discovery rates (as in Atwell et al., 2010) for increasing significance thresholds. (C) Allelic effects of the red-marked variants in the corresponding Manhattan plots, with genotypes on the x-axes and the read count residuals on the y-axes. (D) The candidate genes marked in panel A, their putative functions and distances to the top variant of the neighboring peak. Candidates in dark blue are the a priori candidates included in the enrichment analyses and involved in defense response (GO:0006952). GS: glucosinolates. (E) Zoom-in for the Manhattan plot of Erysiphales load, around the first peak in Scaffold 1, with gene and transposable element (TE) models below, and a priori candidates in blue.
Figure 3—figure supplement 1
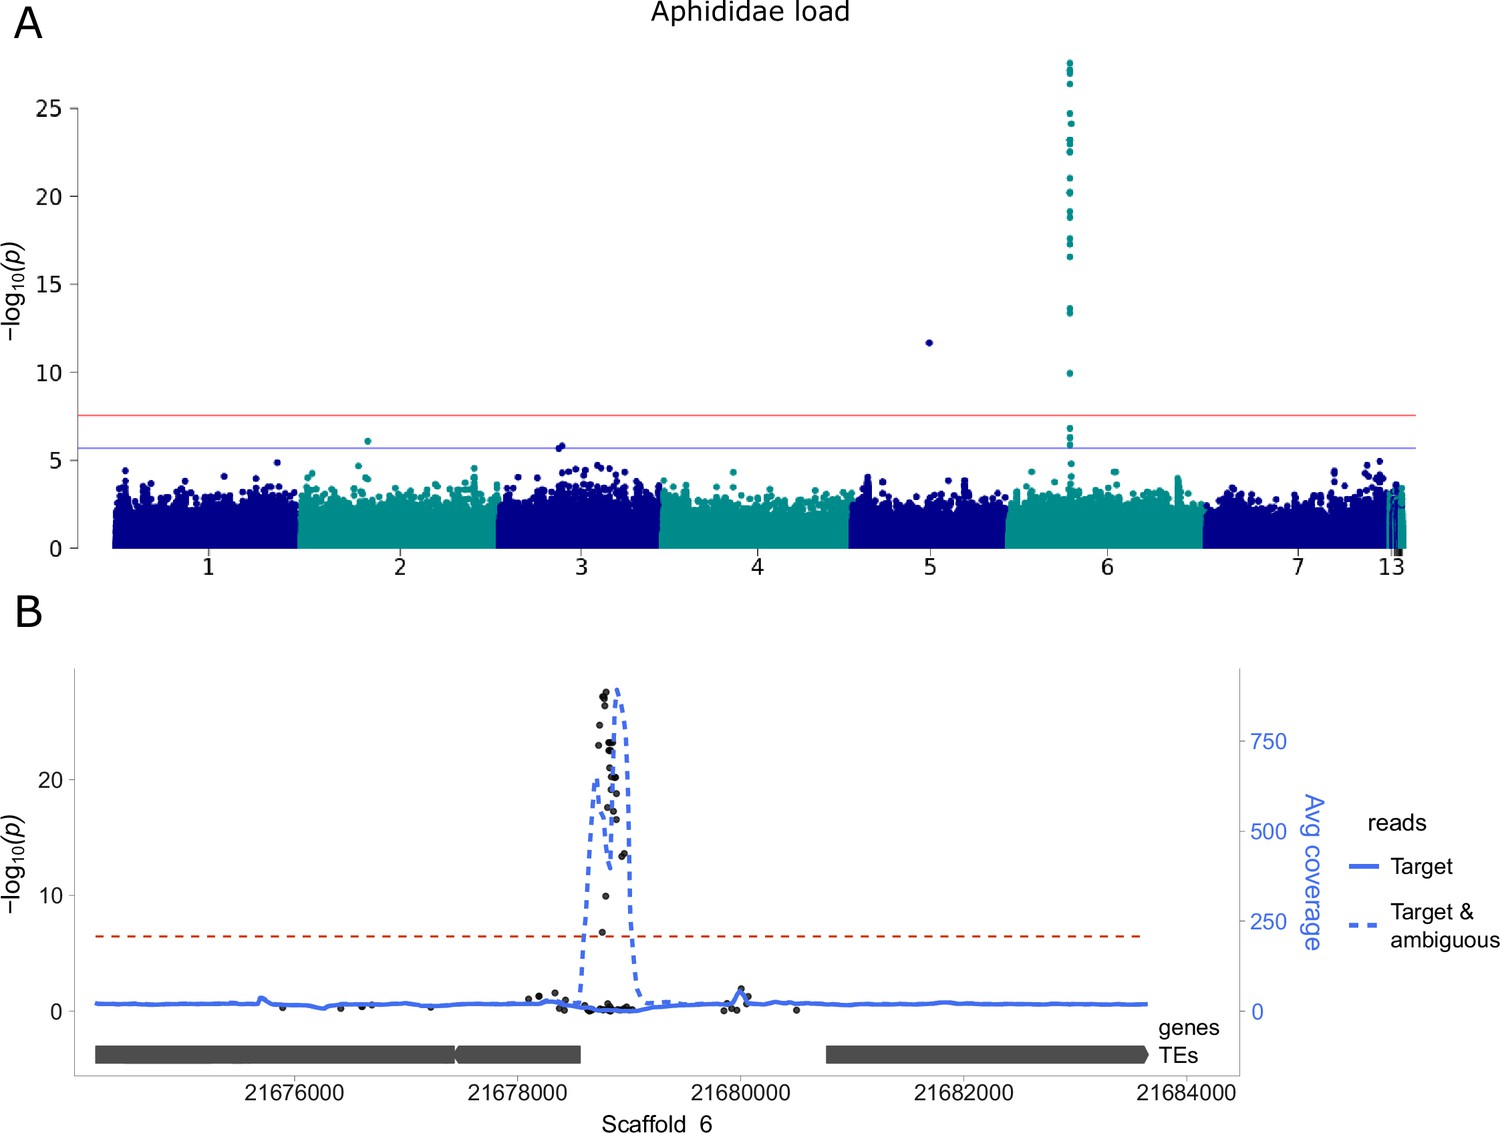
Example of a genome-wide association (GWA) peak caused by ambiguous reads.
(A) Manhattan plot of GWA with aphid load, without removing ambiguous reads prior to variant calling. The genome-wide significance (horizontal red line) was calculated based on unlinked variants (Sobota et al., 2015), the suggestive line (blue) corresponds to -log(p)=5. (B) Zoomed-in peak on Scaffold 6 with coverage before and after removal of ambiguous reads.
Figure 3—figure supplement 2
Genome-wide association (GWA) results for all exogenous reads.
Manhattan plots, enrichment of a priori candidate variants, and QQplots for all exogenous reads. The genome-wide significance (horizontal red lines) was calculated based on unlinked variants (Sobota et al., 2015), the blue line corresponds to -log(p)=5. The top variants are labeled with the neighboring genes potentially affecting exogenous reads load.
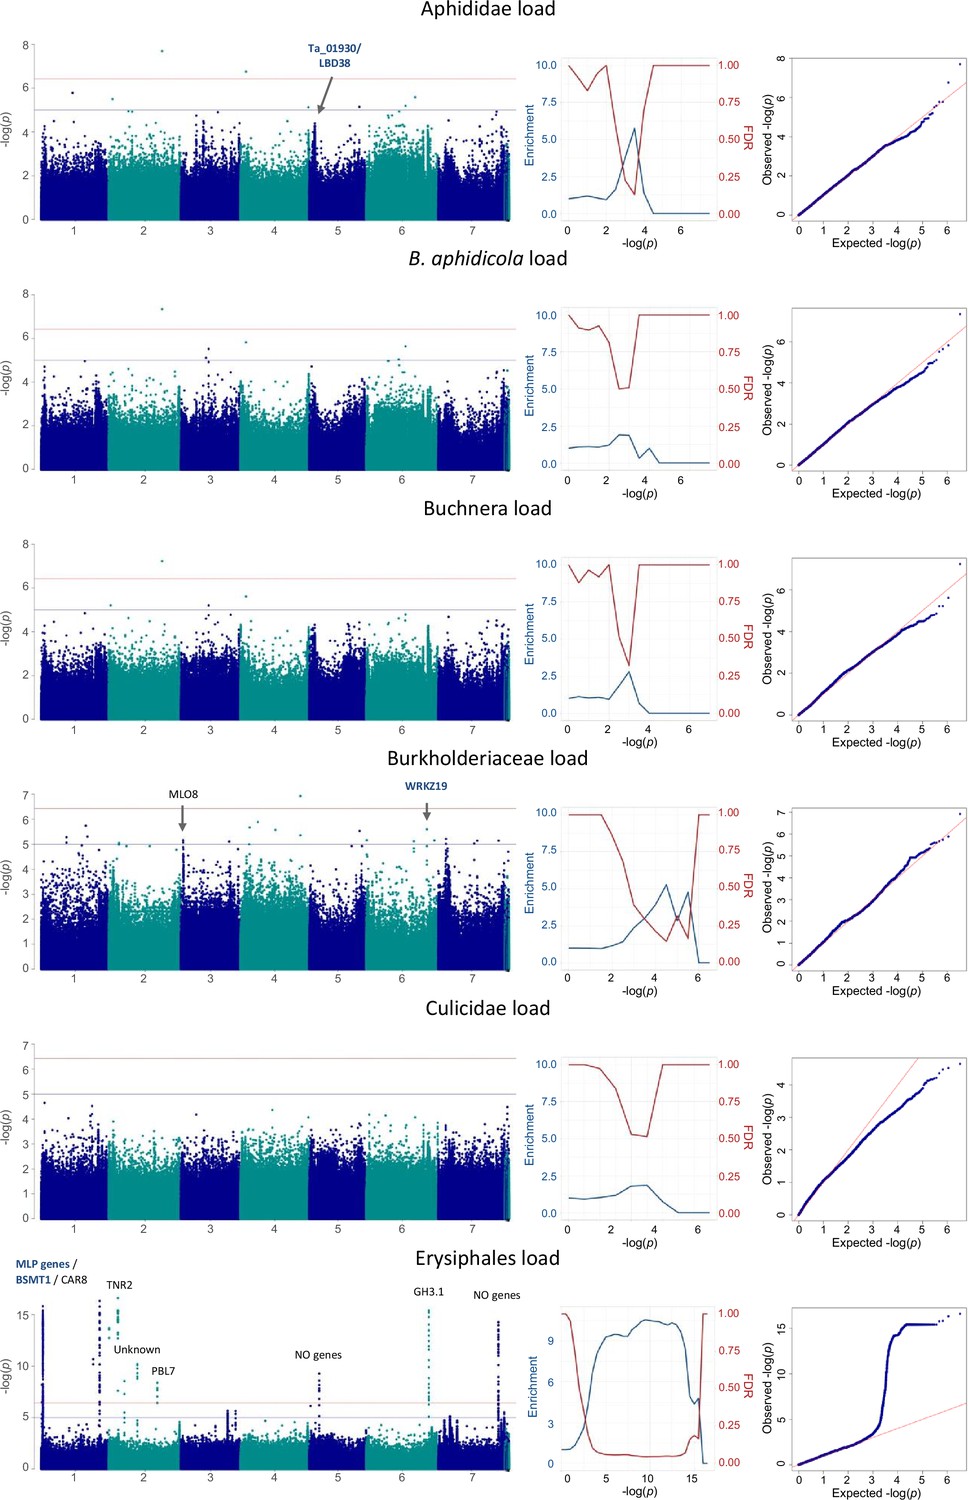
Figure 3—figure supplement 3
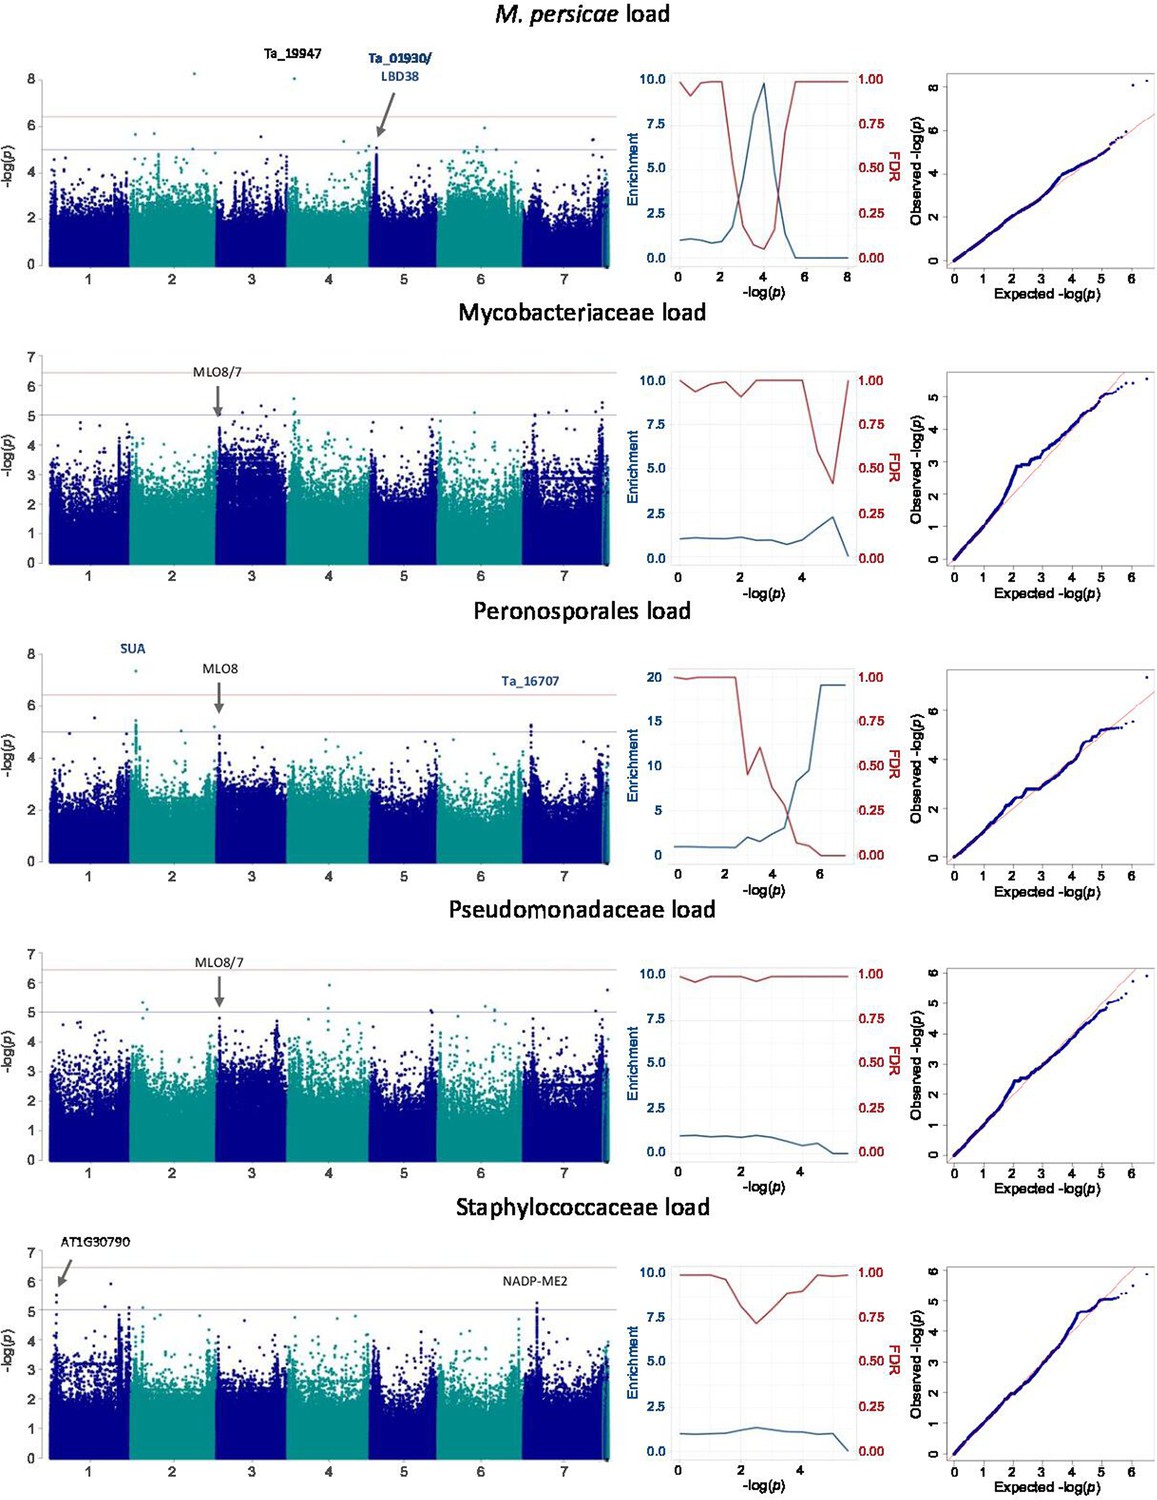
Genome-wide association (GWA) results for all exogenous reads.
Manhattan plots, enrichment of a priori candidate variants, and QQplots for all exogenous reads. The genome-wide significance (horizontal red lines) was calculated based on unlinked variants (Sobota et al., 2015), the blue line corresponds to -log(p)=5. The top variants are labeled with the neighboring genes potentially affecting exogenous reads load.
Figure 4 with 2 supplements
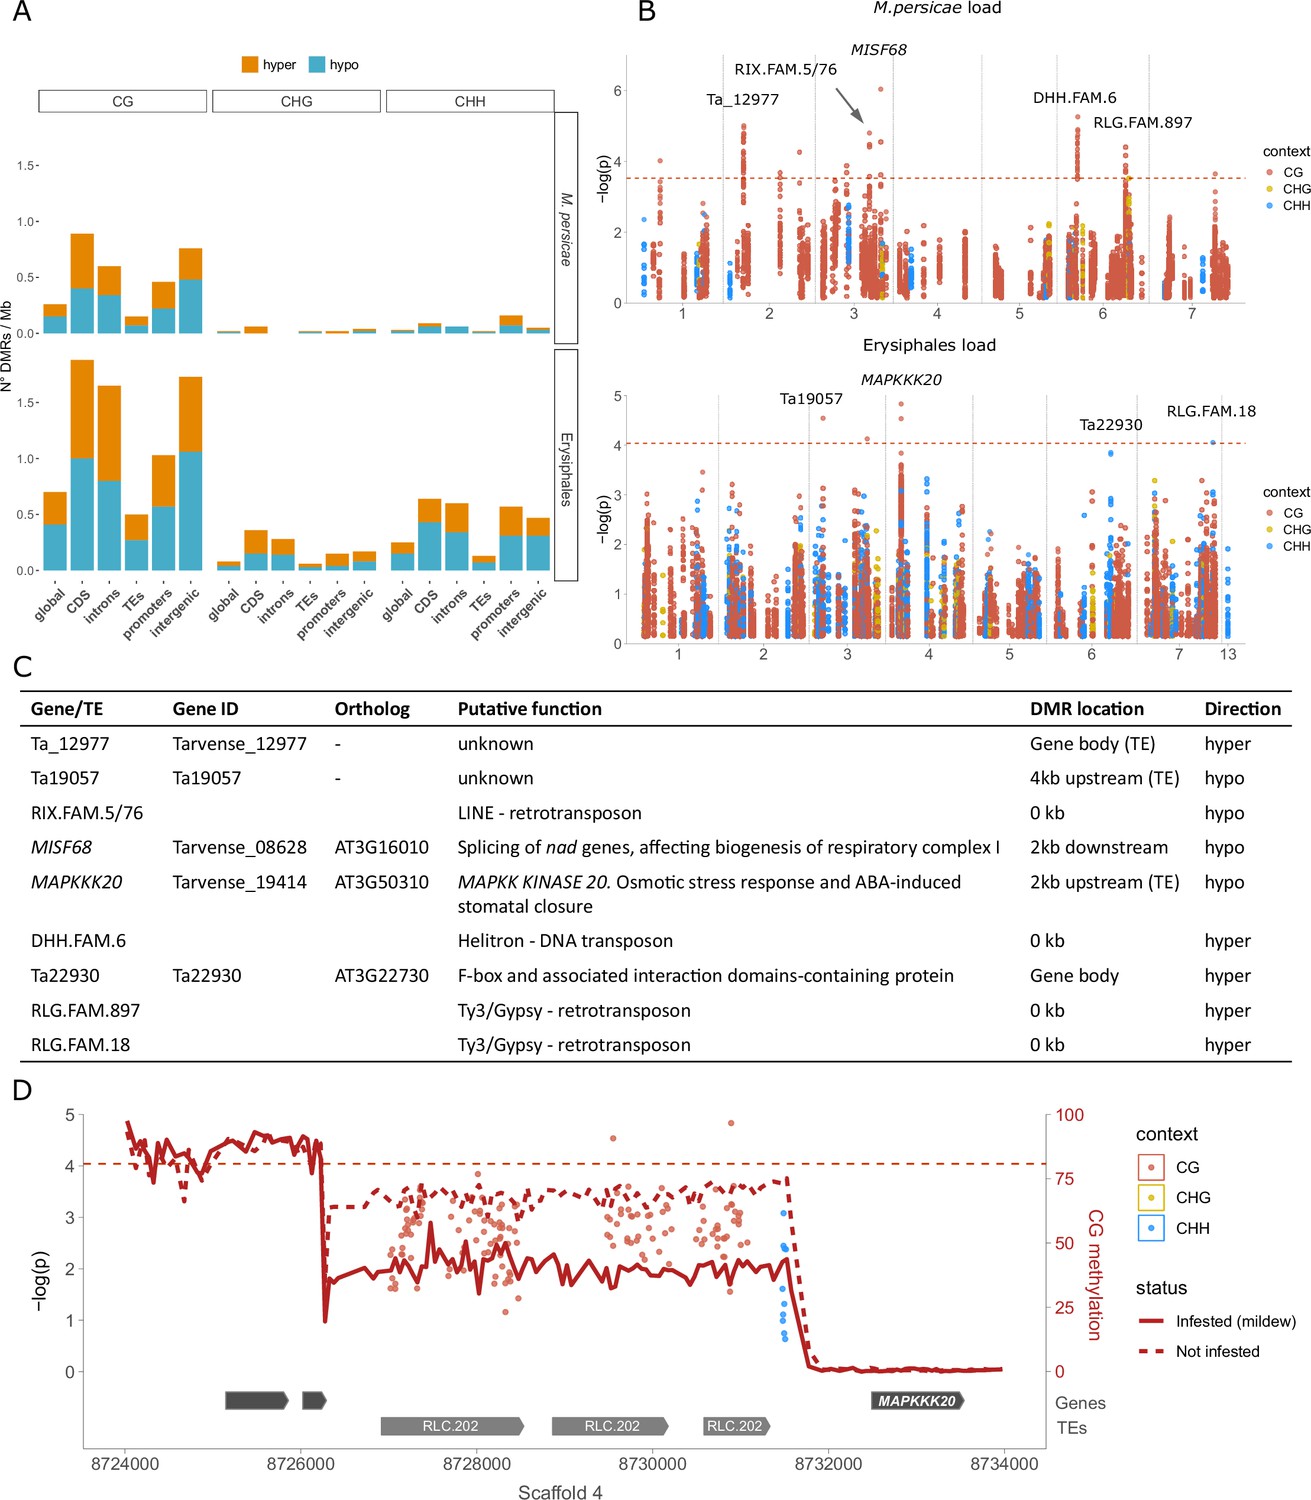
Differential methylation associated with aphid and mildew loads.
(A) Differentially methylated region (DMR) densities in different genomic features when comparing the 20 samples with the most vs. the least M. persicae (top) or Erysiphales (bottom) load. CDS: coding sequences. (B) Manhattan plots from epigenome-wide association (EWA) analyses based on individual cytosines within DMRs, with sequence contexts in different colors and annotation of genes close to low p-value cytosines. The genome-wide Bonferroni significance thresholds (dashed red lines) were calculated based on the number of DMRs. (C) Candidate genes and transposable elements (TEs) marked in panel B, their putative functions, genomic locations of associated DMRs, and whether infested samples were hyper- or hypomethylated. (D) Zoomed-in Manhattan plot for Erysiphales load around the peak in Scaffold 4, with gene and TE models given below. The CG methylation in the 20 most and least infested samples was calculated over 50 bp bins (see Figure 4—figure supplement 2 for methylation in other contexts).
Figure 4—figure supplement 1
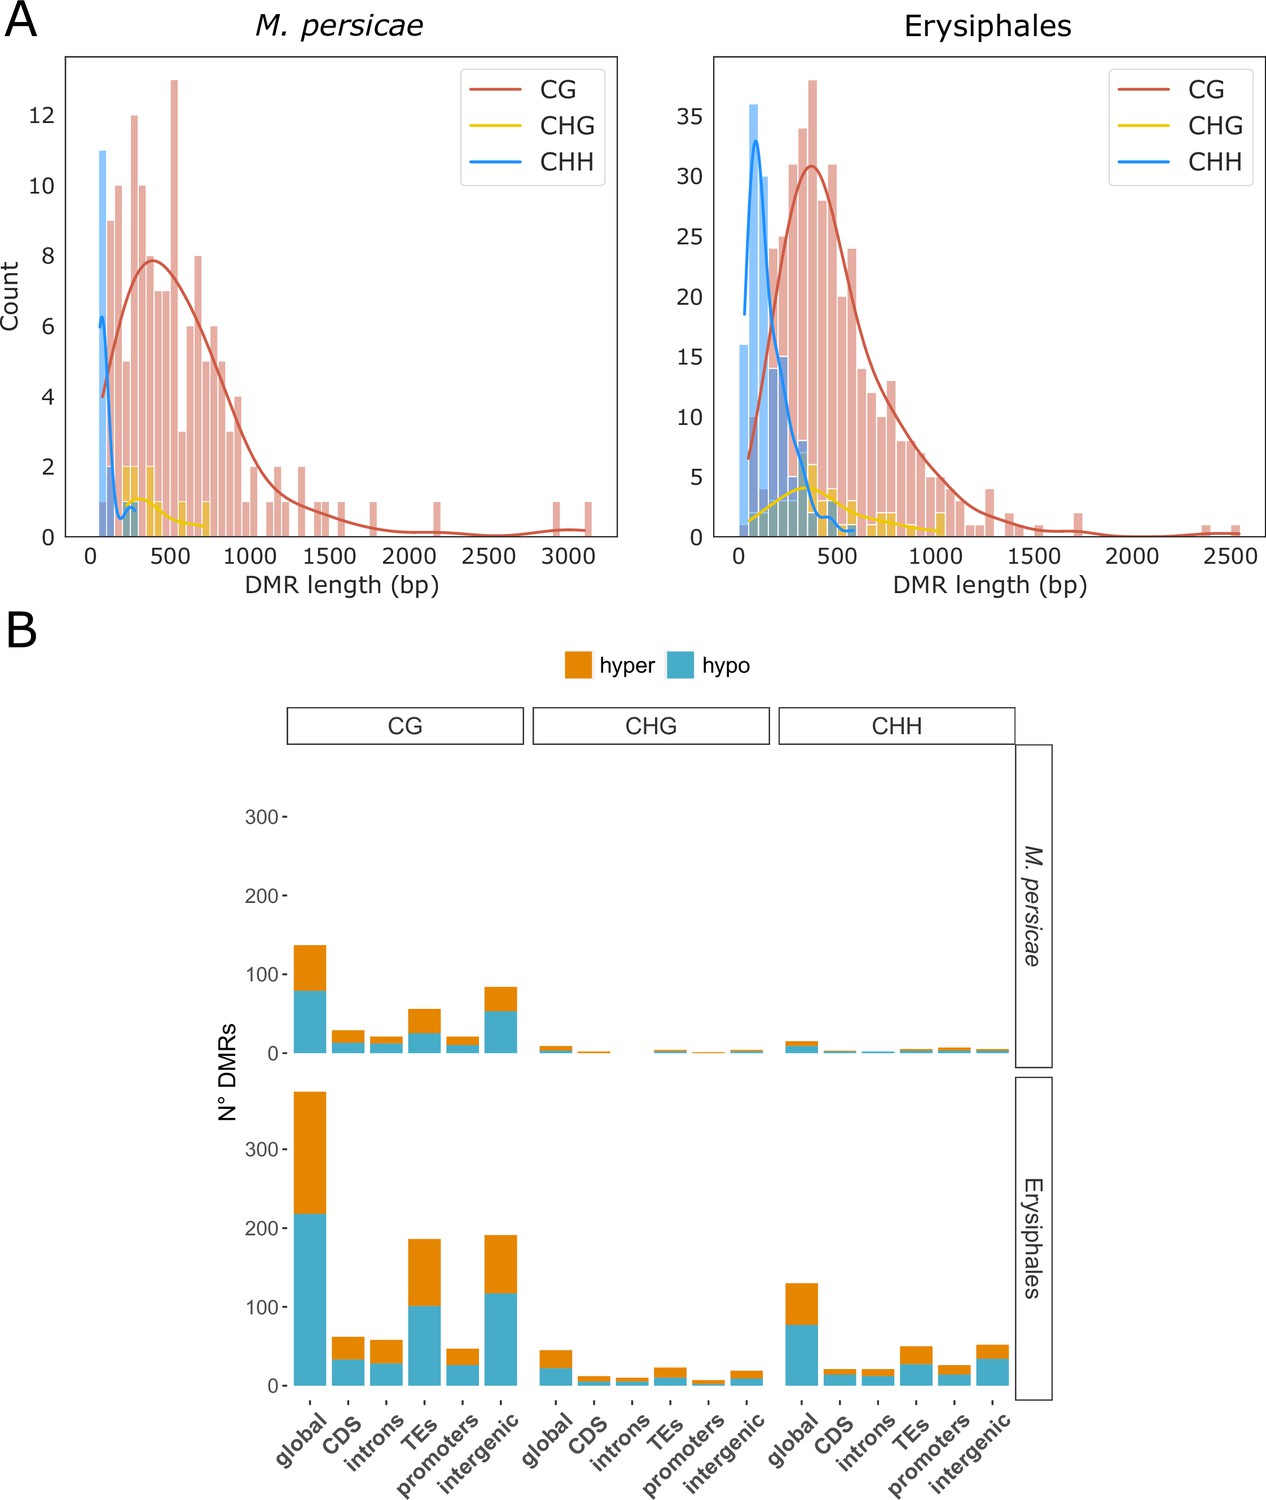
Lengths and genomic locations of differentially methylated regions (DMRs).
(A) DMRs length distributions in different sequence contexts. (B) Numbers of hypermethylated and hypomethylated DMRs in each genomic feature.
Figure 4—figure supplement 2
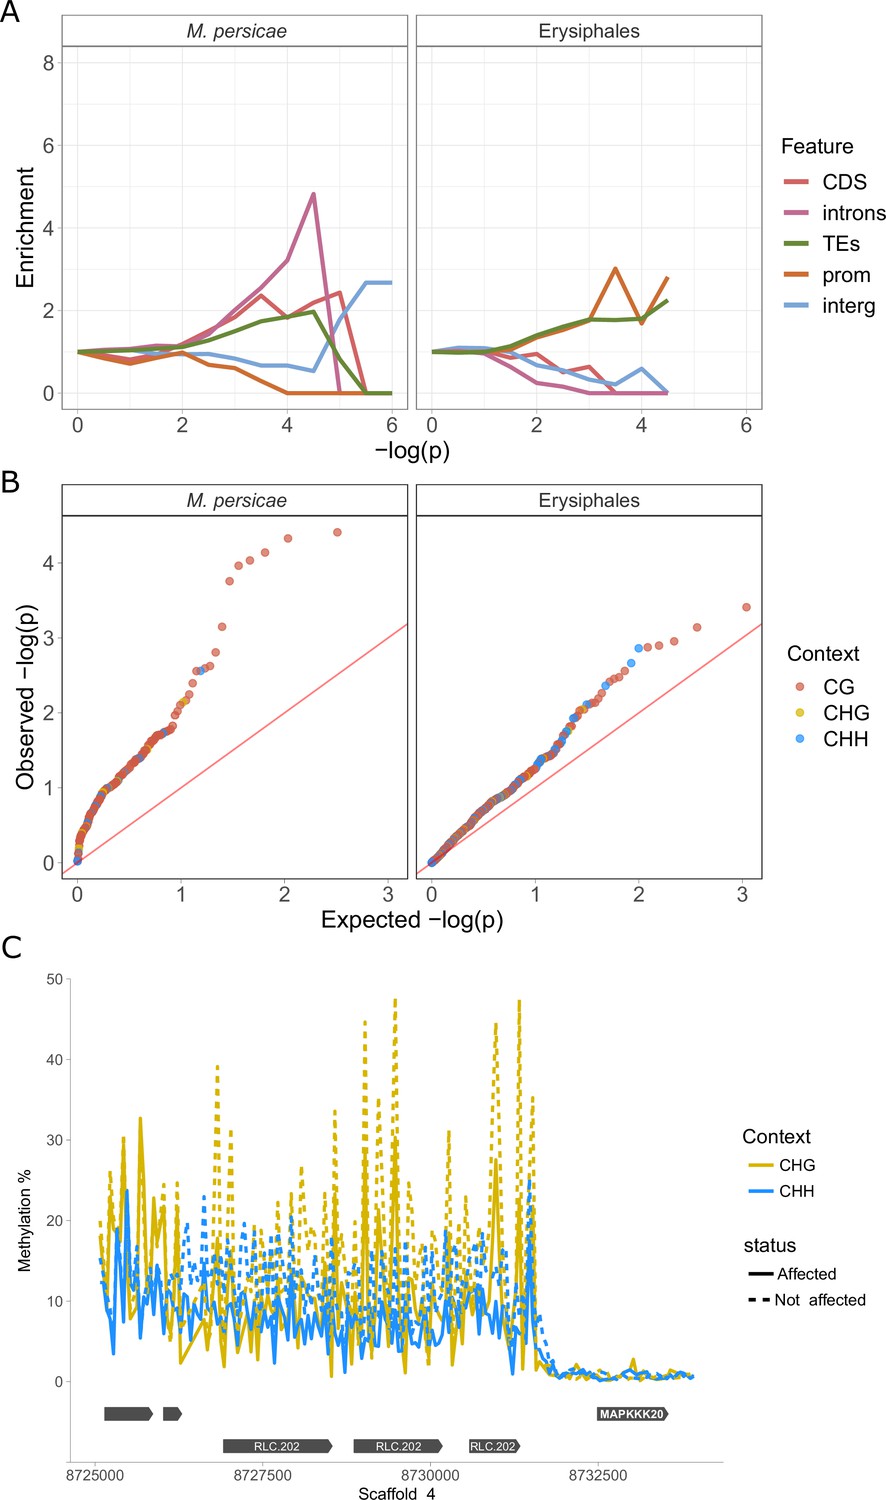
Epigenome-wide association (EWA) enrichment in different genomic features and p-value distributions.
(A) Enrichment of associations in different genomic features for increasing -log(p) thresholds, compared to expectations from all cytosines. (B) p-Value distributions of EWA. (C) Complement to Figure 4D showing CHG and CHH methylation upstream and above the gene MPKKK20.
Author response image 1

Linear correlations between the number of MG-RAST reads post-QC and either total (left) or deduplicated (right) reads from fastq files of four full samples (not only unmapped reads).
Author response image 2

Tables
Table 1
Population differences and SNP-based heritability for different types of exogenous read counts.
Population differences were tested with a linear model, SNP-based heritabilities (and their confidence intervals) estimated with the R package heritability (Kruijer and White, 2019).
| Taxonomic group | Data type | Population differences (R2 and p-value) | SNP-based heritability |
|---|---|---|---|
| Myzus persicae | Mapping to reference genome | 0.245 (p=0.029) | 0.190 (0.055–0.488) |
| Buchnera aphidicola | Mapping to reference genome | 0.256 (p=0.016) | 0.169 (0.042–0.490) |
| Buchnera | MG-RAST - genus | 0.223 (p=0.090) | 0.115 (0.016–0.505) |
| Aphididae | MG-RAST - family | 0.226 (p=0.082) | 0.189 (0.052–0.496) |
| Culicidae | MG-RAST - family | 0.166 (p=0.519) | 0.183 (0.055–0.465) |
| Erysiphales | MG-RAST - order | 0.326 (p<0.001) | 0.468 (0.238–0.712) |
| Peronosporales | MG-RAST - family | 0.253 (p=0.020) | 0.266 (0.096–0.553) |
| Staphylococcaceae | MG-RAST - family | 0.390 (p<0.001) | 0.301 (0.124–0.567) |
| Burkholderiaceae | MG-RAST - family | 0.275 (p=0.005) | 0.256 (0.092–0.538) |
| Mycobacteriaceae | MG-RAST - family | 0.362 (p<0.001) | 0.294 (0.120–0.560) |
| Pseudomonadaceae | MG-RAST - family | 0.273 (p=0.006) | 0.192 (0.052–0.505) |
Additional files
-
Supplementary file 1
Classification of reads.
Total reads, duplication rates, deduplicated raw reads, target, ambiguous, and exogenous reads and MG-RAST reads passing QC.
- https://cdn.elifesciences.org/articles/95510/elife-95510-supp1-v1.xlsx
-
Supplementary file 2
MG-RAST classification of exogenous reads.
Results of MG-RAST classification of exogenous reads at the family level, using RefSeq as query database.
- https://cdn.elifesciences.org/articles/95510/elife-95510-supp2-v1.csv
-
Supplementary file 3
Competitive mapping pseudo-reference for aphid identification.
Fasta file combining mitochondrial sequences of B. Brassicaceae, A. pisum, and M. persicae, with structural variants removed.
- https://cdn.elifesciences.org/articles/95510/elife-95510-supp3-v1.zip
-
Supplementary file 4
Competitive mapping pseudo-reference for mildew identification.
Fasta file combining internal transcribed spacer (ITS) sequences of B. graminis and E. cruciferarum, with structural variants removed.
- https://cdn.elifesciences.org/articles/95510/elife-95510-supp4-v1.zip
-
Supplementary file 5
Results of competitive mapping for pest identification.
Number of reads mapping uniquely to the pseudo-reference genomes of different aphid (mitochondrial DNA for either B. Brassicaceae, A. pisum, or M. persicae) or mildew species (internal transcribed spacer [ITS] sequence for either B. graminis or E. cruciferarum).
- https://cdn.elifesciences.org/articles/95510/elife-95510-supp5-v1.xlsx
-
Supplementary file 6
Exogenous reads used for downstream analyses.
Classes of exogenous reads used in the analyses, including the nine groups from MG-RAST and two from mapping to the M. persicae and B. aphidicola reference genomes.
- https://cdn.elifesciences.org/articles/95510/elife-95510-supp6-v1.csv
-
Supplementary file 7
Quantification of glucosinolates.
Glucosinolate concentrations in leaves of T. arvense, obtained from offspring of the sequenced plants, not infested by any herbivores nor pathogens.
- https://cdn.elifesciences.org/articles/95510/elife-95510-supp7-v1.csv
-
Supplementary file 8
A priori ‘defense response’ candidate genes used for the genome-wide association (GWA) enrichment analysis.
List of T. arvense candidate genes used for the GWA enrichment analysis: orthologs of A. thaliana genes annotated with the GO term ‘defense response’.
- https://cdn.elifesciences.org/articles/95510/elife-95510-supp8-v1.zip
-
Supplementary file 9
Differentially methylated regions (DMRs) based on M. persicae load.
List of DMRs called between the 20 samples with the highest and the lowest M. persicae load.
- https://cdn.elifesciences.org/articles/95510/elife-95510-supp9-v1.zip
-
Supplementary file 10
Differentially methylated regions (DMRs) based on Erysiphales load.
List of DMRs called between the 20 samples with the highest and the lowest Erysiphales load.
- https://cdn.elifesciences.org/articles/95510/elife-95510-supp10-v1.zip
-
MDAR checklist
- https://cdn.elifesciences.org/articles/95510/elife-95510-mdarchecklist1-v1.docx
Download links
A two-part list of links to download the article, or parts of the article, in various formats.
Downloads (link to download the article as PDF)
Open citations (links to open the citations from this article in various online reference manager services)
Cite this article (links to download the citations from this article in formats compatible with various reference manager tools)
Discarded sequencing reads uncover natural variation in pest resistance in Thlaspi arvense
eLife 13:RP95510.
https://doi.org/10.7554/eLife.95510.3


