Discovery of the 1-naphthylamine biodegradation pathway reveals a broad-substrate-spectrum enzyme catalyzing 1-naphthylamine glutamylation
- State Key Laboratory of Microbial Metabolism, Joint International Research Laboratory of Metabolic and Developmental Sciences, and School of Life Sciences and Biotechnology, Shanghai Jiao Tong University, China
- Center for Environmental Diagnostics and Bioremediation, University of West Florida, United States
- State Key Laboratory of Microbial Resources, Institute of Microbiology, Chinese Academy of Sciences, China
Figures
Figure 1 with 4 supplements
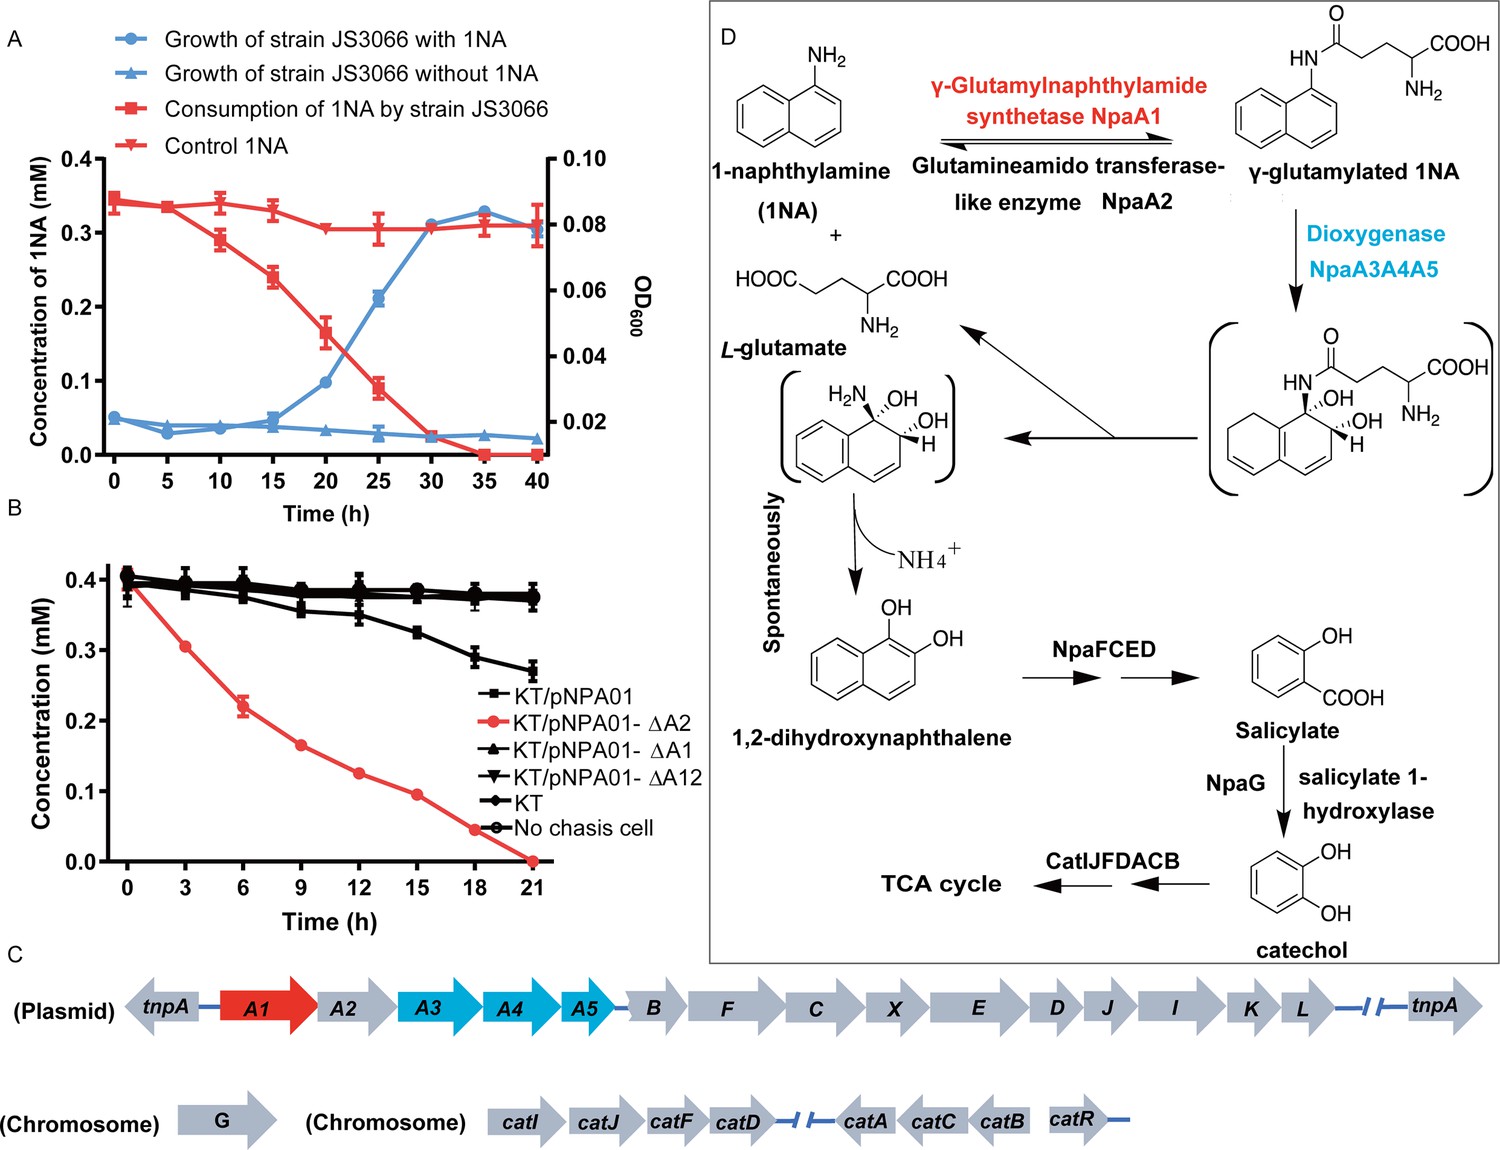
Degradation of 1-Naphthylamine (1NA) by Pseudomonas sp. strain JS3066.
(A) Growth with 1NA as the sole carbon and nitrogen source. (B) 1NA conversion by cell suspensions of P. putida KT2440-ΔcatAΔggt harboring pNPA01 (npaA1 to npaA5), pNPA01-ΔA1 (npaA2 to npaA5), pNPA01-ΔA2 (npaA1 and npaA3 to npaA5), and pNPA01-ΔA12 (npaA3 to npaA5). The ability of P. putida KT2440-ΔcatAΔggt to convert 1NA together with the spontaneous decomposition of 1NA were also determined as control. The error bars represent the standard deviation while the points represent the mean of two independent measurements. (C) Organization of the genes involved in 1NA degradation by strain JS3066. Gene tnpA encodes a transposase. Proposed functions of the rest of genes are presented in Supplementary file 1. (D) Proposed pathway of 1NA catabolism in Pseudomonas sp. strain JS3066. TCA, tricarboxylic acid. Unstable compounds are enclosed in brackets.
-
Figure 1—source data 1
- https://cdn.elifesciences.org/articles/95555/elife-95555-fig1-data1-v1.zip
Figure 1—figure supplement 1
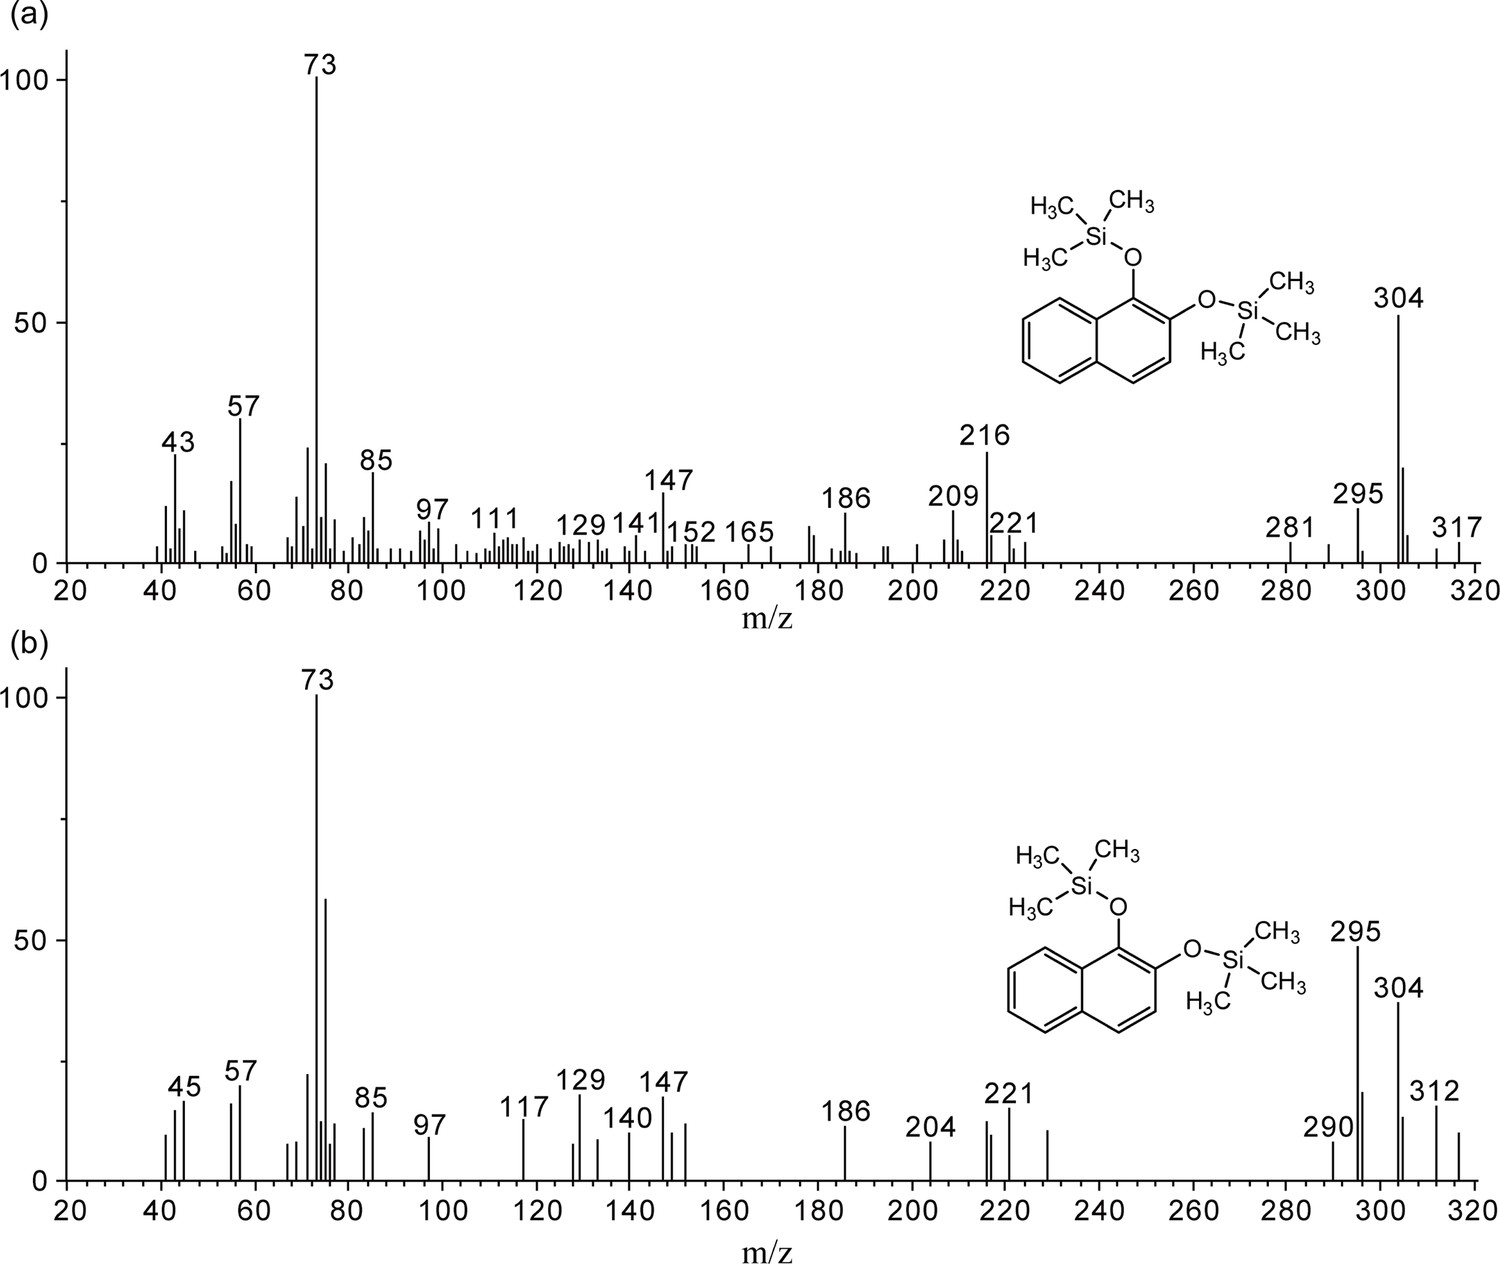
Gas chromatography-mass spectrometry (GC-MS) analysis of the intermediate accumulated during 1-Naphthylamine (1NA) transformation by the cell suspension of P. putida KT2440-ΔcatAΔggt harboring pNPA01.
The mass spectra of theoretical trimethylsilylated 1,2-dihydroxynaphthalene (a) and authentic trimethylsilylated 1,2-dihydroxynaphthalene (b) are shown.
Figure 1—figure supplement 2
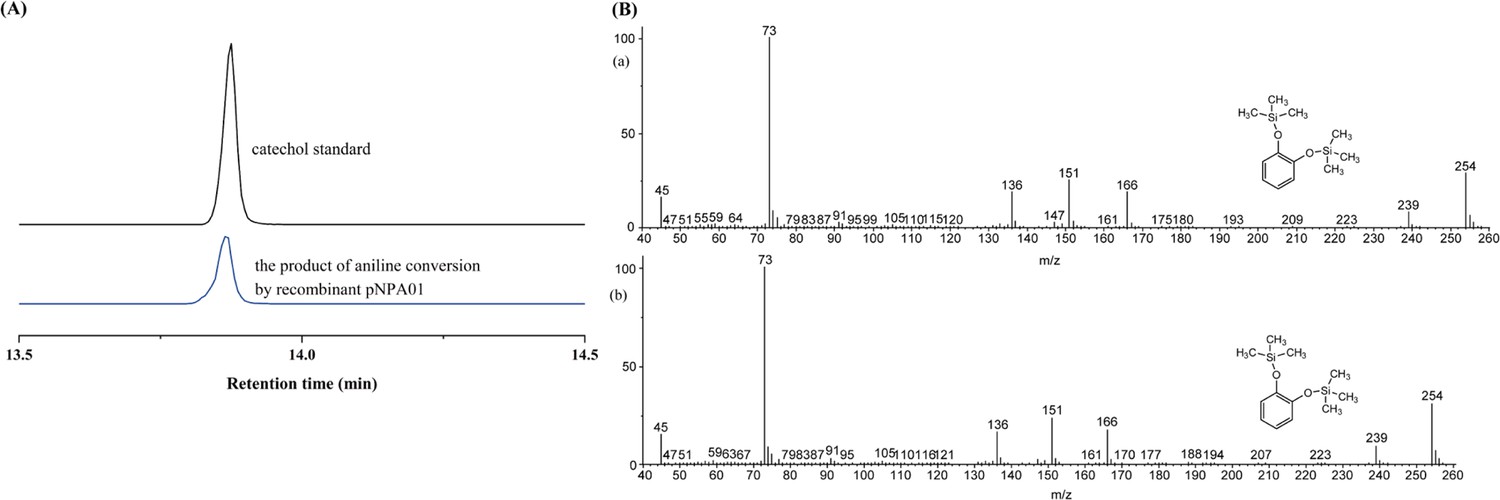
Conversion of aniline by strain P. putida KT2440-ΔcatAΔggt harboring plasmid pNPA01 (recombinant KT/pNPA01).
(A) The ion current chromatograms at m/z 254.00±0.70 extracted from the total ion current chromatograms of standard catechol and the product of aniline conversion by recombinant KT/pNPA01. (B) Gas chromatography-mass spectrometry (GC-MS) analysis of the intermediate captured during aniline degradation by the cell suspension of KT/pNPA01. The mass spectra of proposed trimethylsilylated catechol (A) and authentic trimethylsilylated catechol (B) are shown.
Figure 1—figure supplement 3
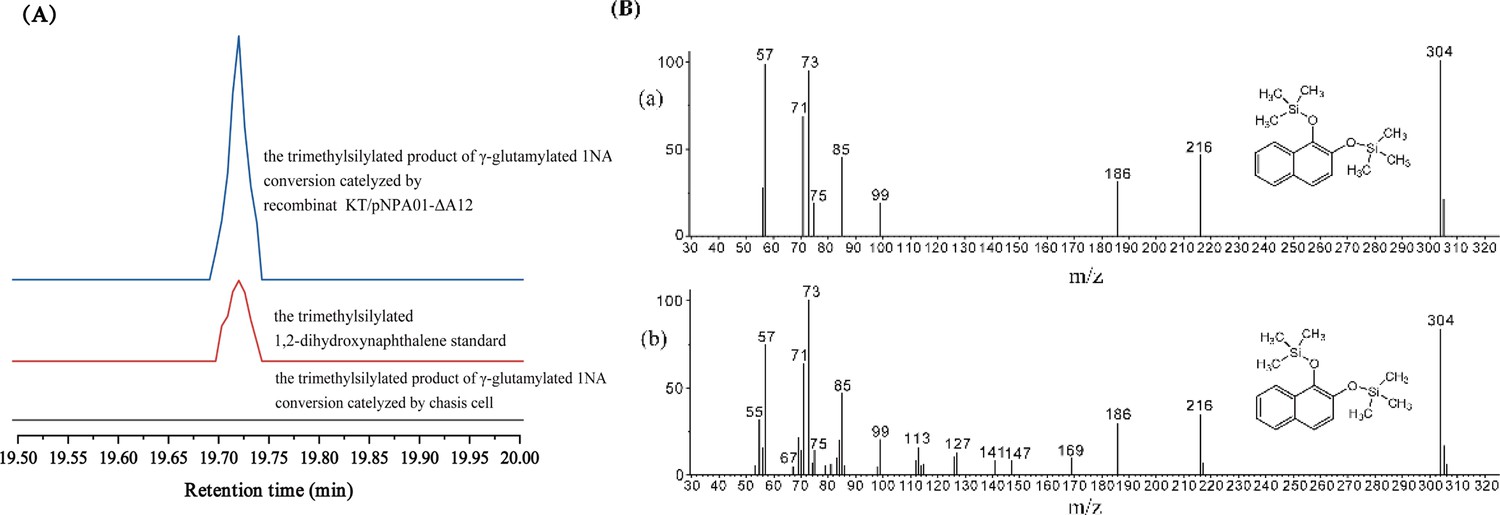
Conversion of γ-glutamylated 1-naphthylamine by recombinant strain KT/pNPA01-ΔA12.
(A) The ion current chromatograms at m/z 304.00±0.70 extracted from the total ion current chromatograms of standard 1,2-dihydroxynaphthalene and the product of γ-glutamylated 1NA conversion by recombinant KT/pNPA01-ΔA12 are presented. (B) Gas chromatography-mass spectrometry (GC-MS) analysis of the intermediate captured during γ-glutamylated 1NA transformation by the cell suspension of KT/pNPA01-ΔA12. The mass spectra of theoretical 1,2-dihydroxynaphthalene (a) and authentic 1,2-dihydroxynaphthalene (b) are shown.
Figure 1—figure supplement 4
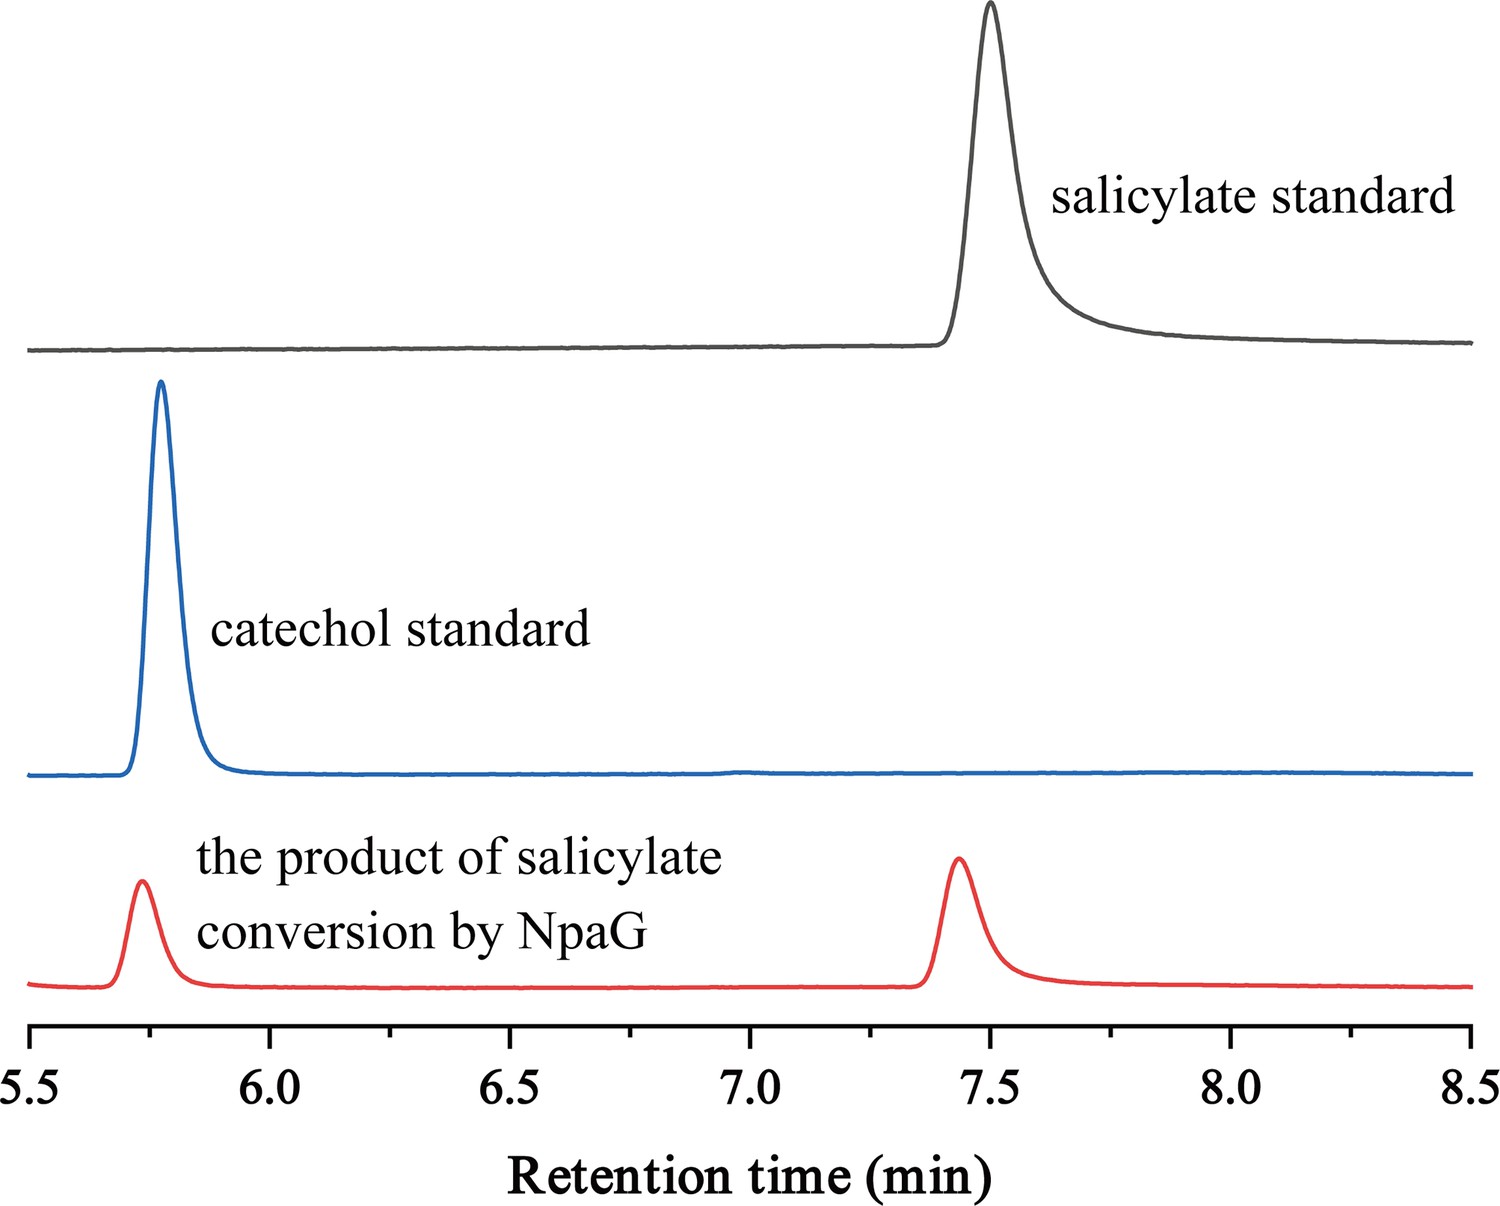
High-performance liquid chromatography (HPLC) chromatographs of salicylate standard, catechol standard, and the reaction product of salicylate conversion catalyzed by the recombinant protein NpaG.
Figure 2 with 1 supplement
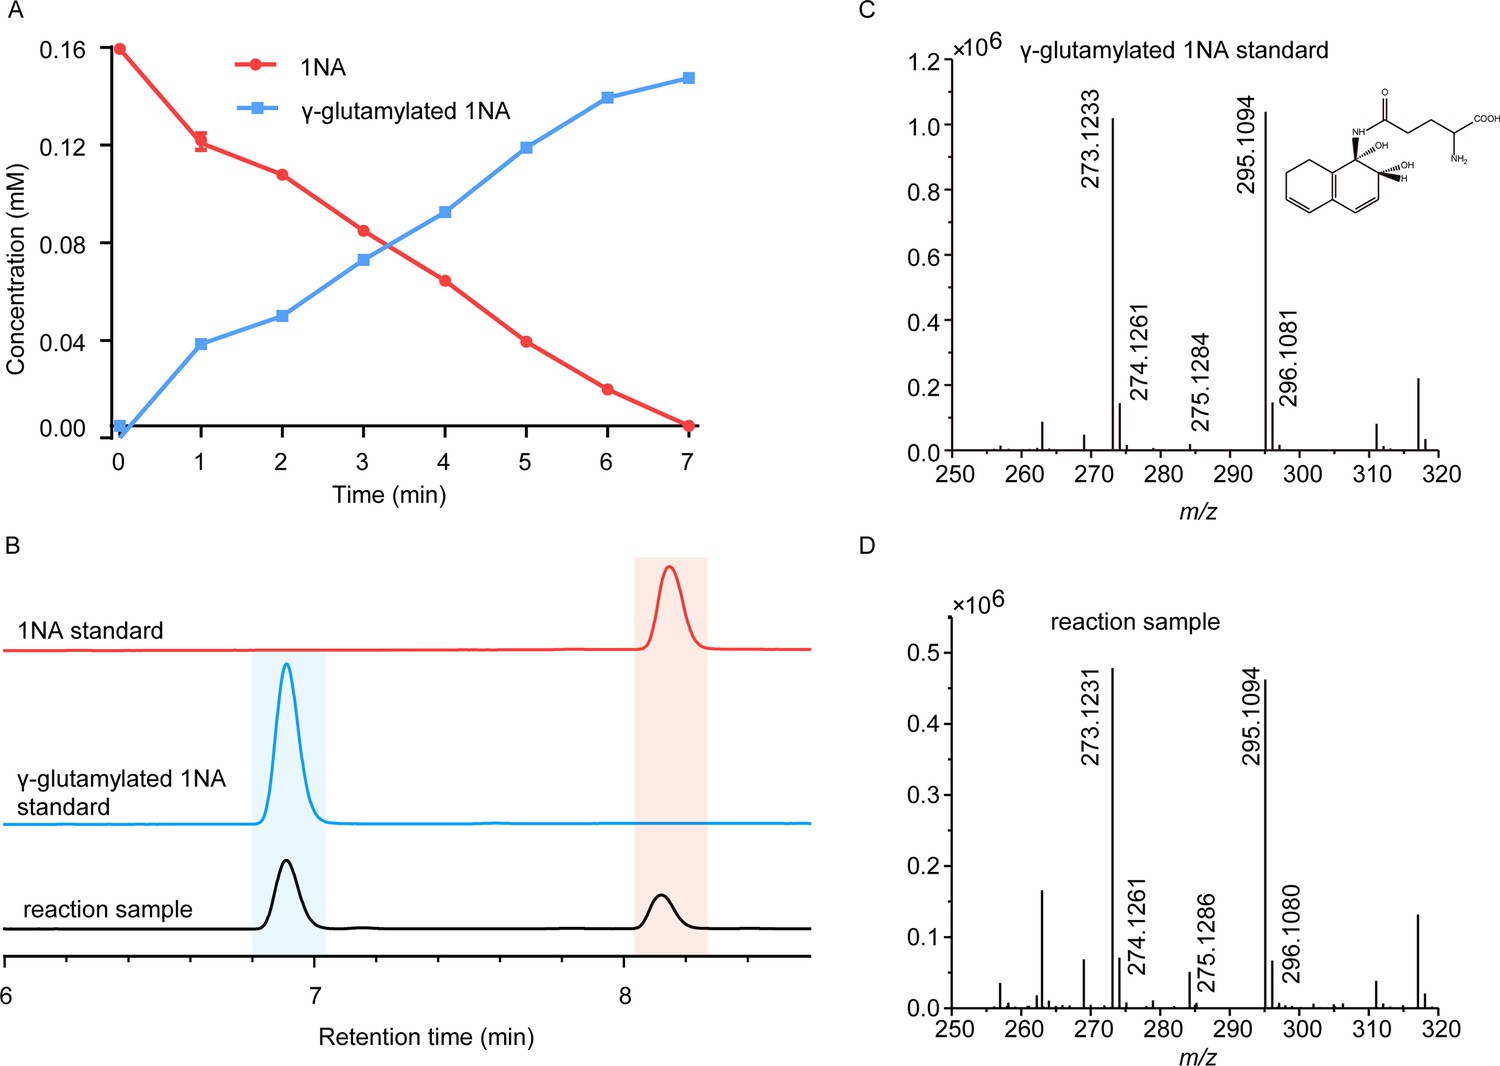
Conversion of 1-Naphthylamine (1NA) by recombinant protein NpaA1.
(A) The time course of 1NA degradation and γ-glutamylated 1NA accumulation. The error bars represent the standard deviation while the points represent the mean of two independent measurements. (B) High-performance liquid chromatography (HPLC) profiles of 1NA standard, γ-glutamylated 1NA standard, and the reaction products of 1NA conversion catalyzed by NpaA1. The detection wavelength was 280 nm. (C–D) UPLC/QTOF-MS analysis of the intermediate captured during 1NA transformation by NpaA1. The mass spectra of authentic γ-glutamylated 1NA (C) and reaction product γ-glutamylated 1NA (D).
-
Figure 2—source data 1
Raw data of Figure 2A, C and D.
- https://cdn.elifesciences.org/articles/95555/elife-95555-fig2-data1-v1.zip
Figure 2—figure supplement 1
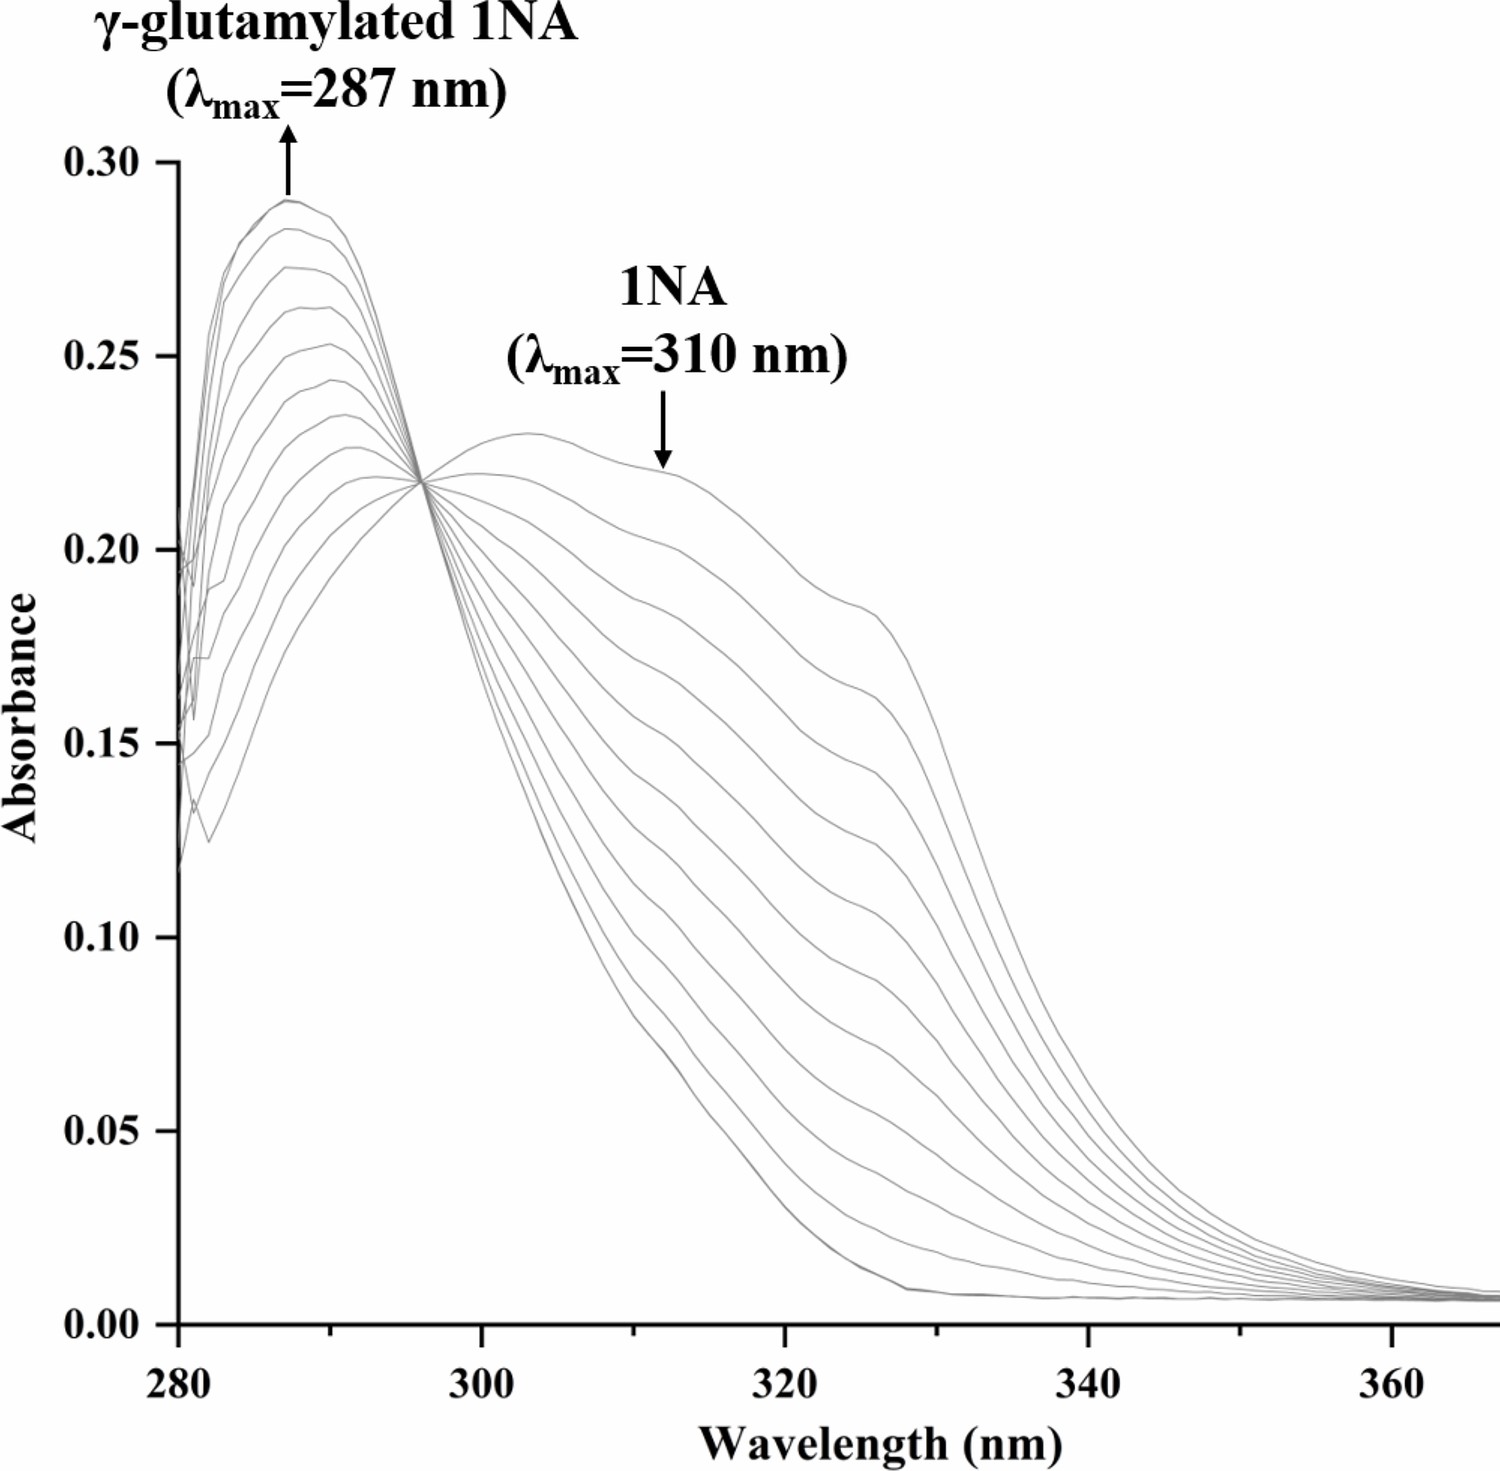
Spectral changes during the transformation of 1-Naphthylamine (1NA) by purified N-terminal Strep II-tagged NpaA1.
The maximum characteristic absorption peaks of 1NA and γ-glutamylated 1NA are 310 nm and 287 nm. The arrows indicate the directions of spectral changes.
-
Figure 2—figure supplement 1—source data 1
Raw data for the spectral changes shown in Figure 2—figure supplement 1.
- https://cdn.elifesciences.org/articles/95555/elife-95555-fig2-figsupp1-data1-v1.zip
Figure 3 with 2 supplements
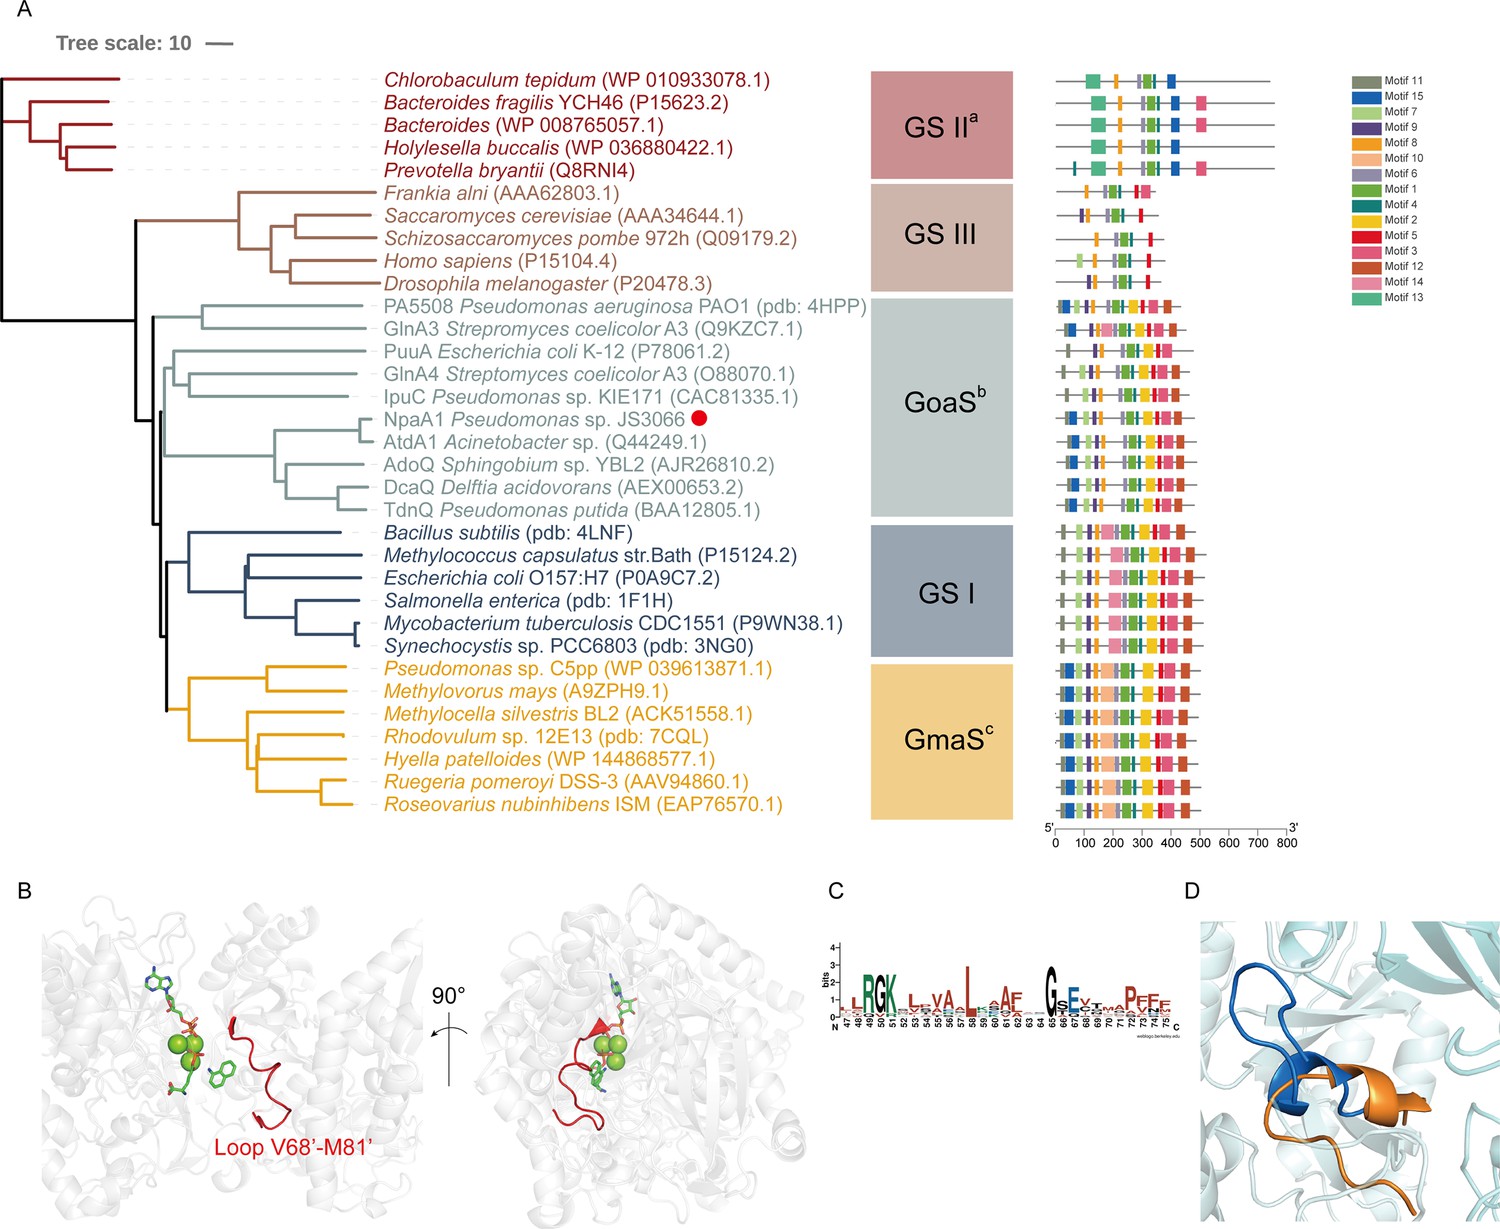
Phylogenetic analysis and motif analysis of GS-like enzymes.
(A) Phylogenetic tree illustrating the evolutionary relationship between amino acid sequences of NpaA1 from Pseudomonas sp. strain JS3066 labeled with a red dot and other related sequences. (B) The loop V68’-M81’ (represented as a red cartoon) in NpaA1─ADP─MetSox-P docking with 1NA complex. Ligands of this complex are colored in green. (C) Sequence logo of the 15th motif. (D) The overlapping structure of loop V68’-M81’ of NpaA1 (in blue) and the corresponding region in StGS (in orange). GS: glutamine synthetase; GoaS: organic amine glutamine synthetases. GmaS: γ-Glutamylmethylamide synthetase.
Figure 3—figure supplement 1
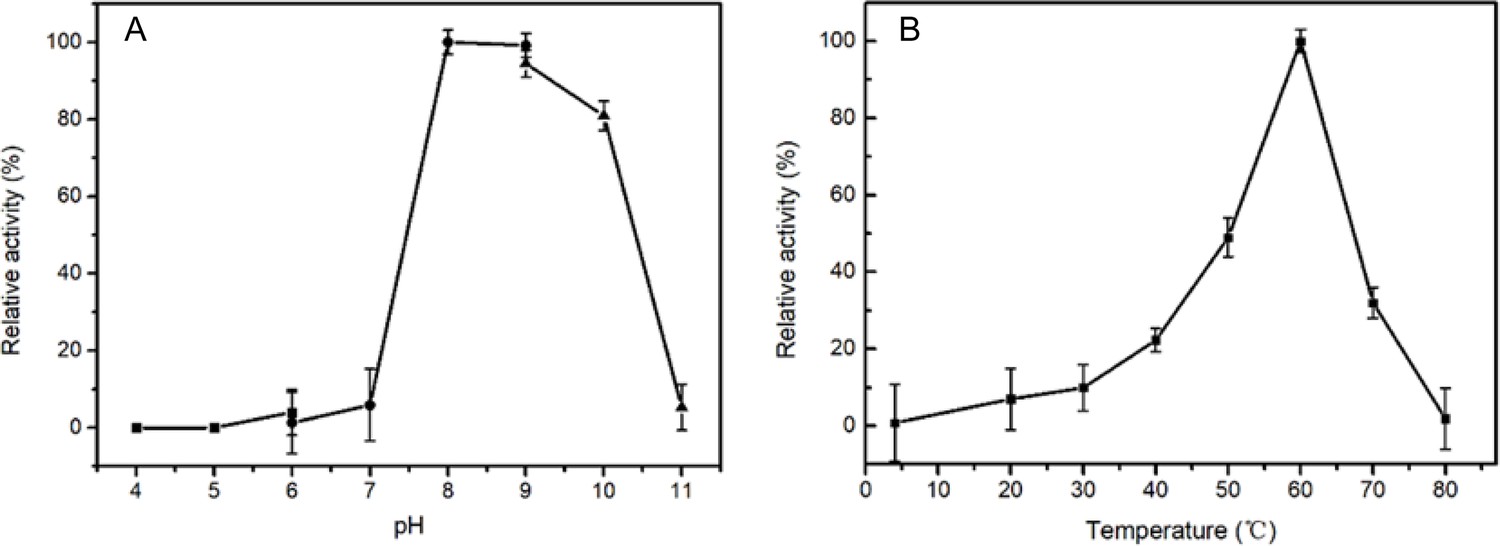
The optimal pH (A) and temperature (B) of wild-type NpaA1 activity.
The optimal pH was determined at 25 °C using Bis -Tris buffer for pH 4–6, Tris buffer for pH 6–9, and glycine-NaOH buffer for 9–11. The activity of NpaA1 was measured in a range from 5–80°C at pH 8.0 (50 mM Tris-HCl buffer). Error bars represent the standard deviation of three biological replicates.
-
Figure 3—figure supplement 1—source data 1
Raw data for the NpaA1 activity shown in Figure 3—figure supplement 1.
- https://cdn.elifesciences.org/articles/95555/elife-95555-fig3-figsupp1-data1-v1.zip
Figure 3—figure supplement 2
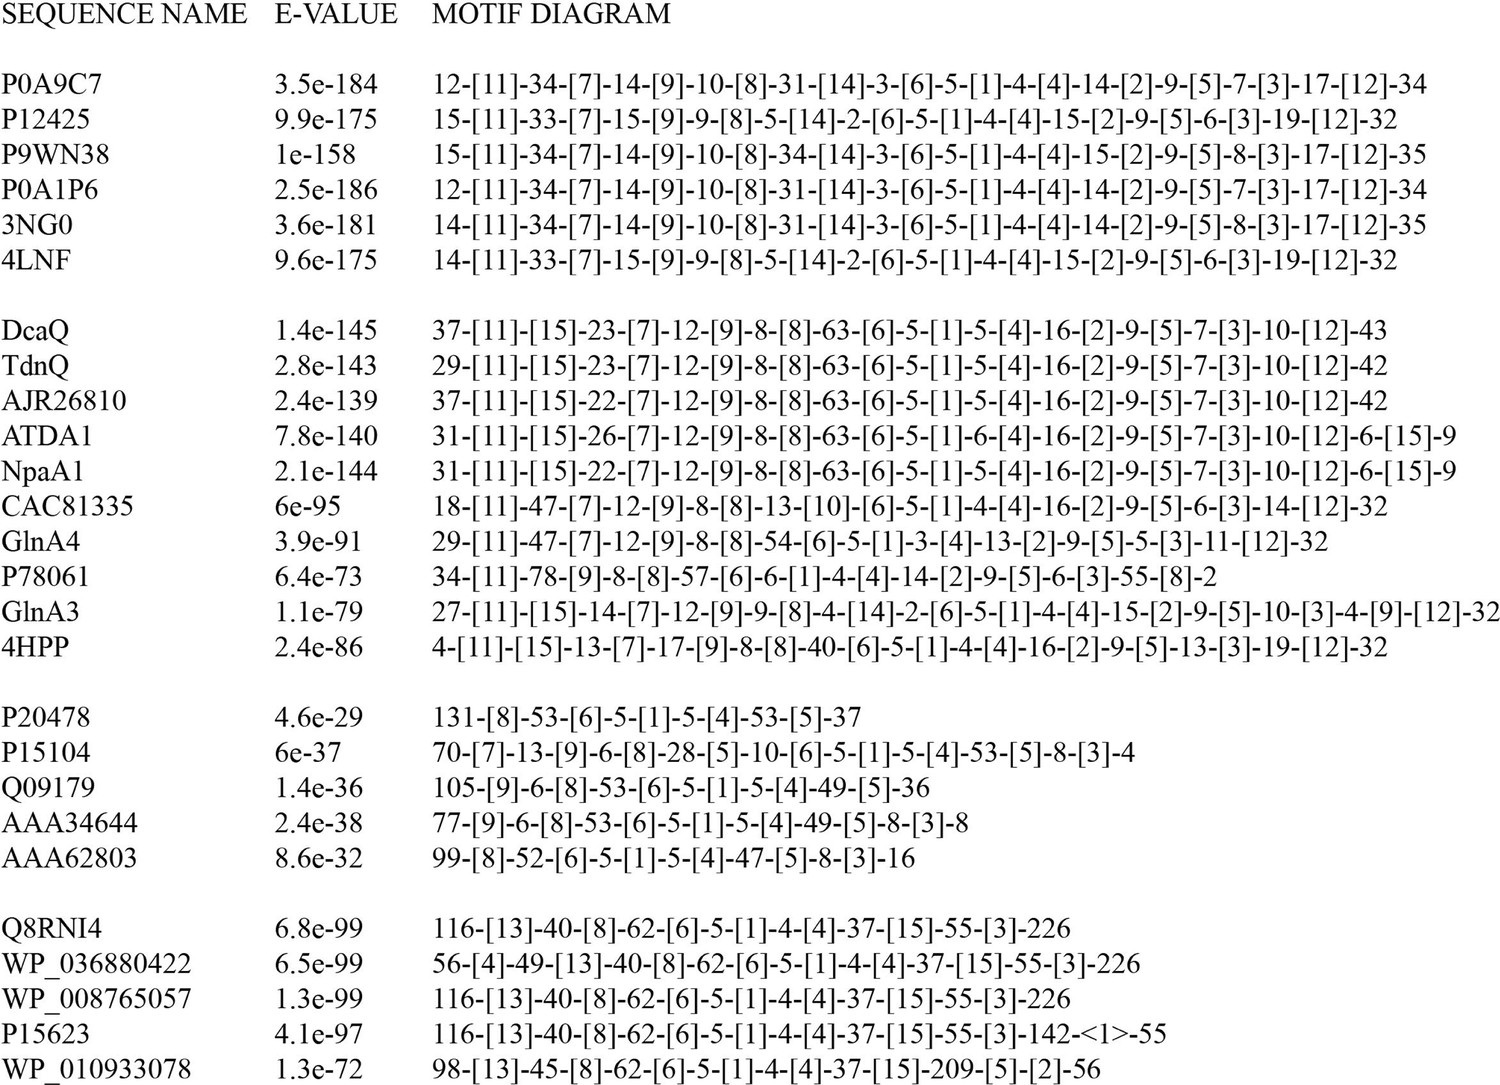
Motif order and spacing for glutamine synthetase (GS)-like proteins.
Figure 4 with 2 supplements
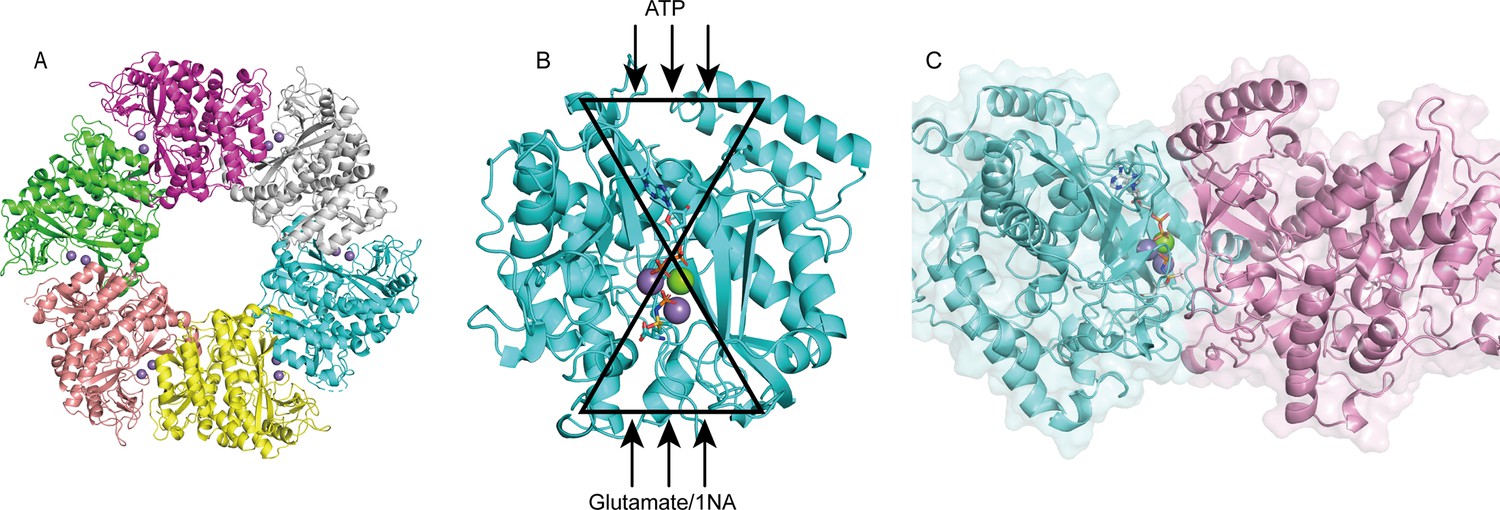
Structure analysis of NpaA1.
(A) The overall structure of NpaA1. There are six monomers arranged as a hexamer in an asymmetric unit. The six monomers are in different colors. (B) The glutamine synthetase (GS) active site is illustrated as a bifunnel with the ATP, glutamate, and amine entry and binding sites at opposite ends. (C) Active site of NpaA1 located at the interface of adjacent subunits. The purple spheres represent the Mn2+ ions, and the green spheres represent the Mg2+ ions. Ligands are indicated by green sticks.
Figure 4—figure supplement 1
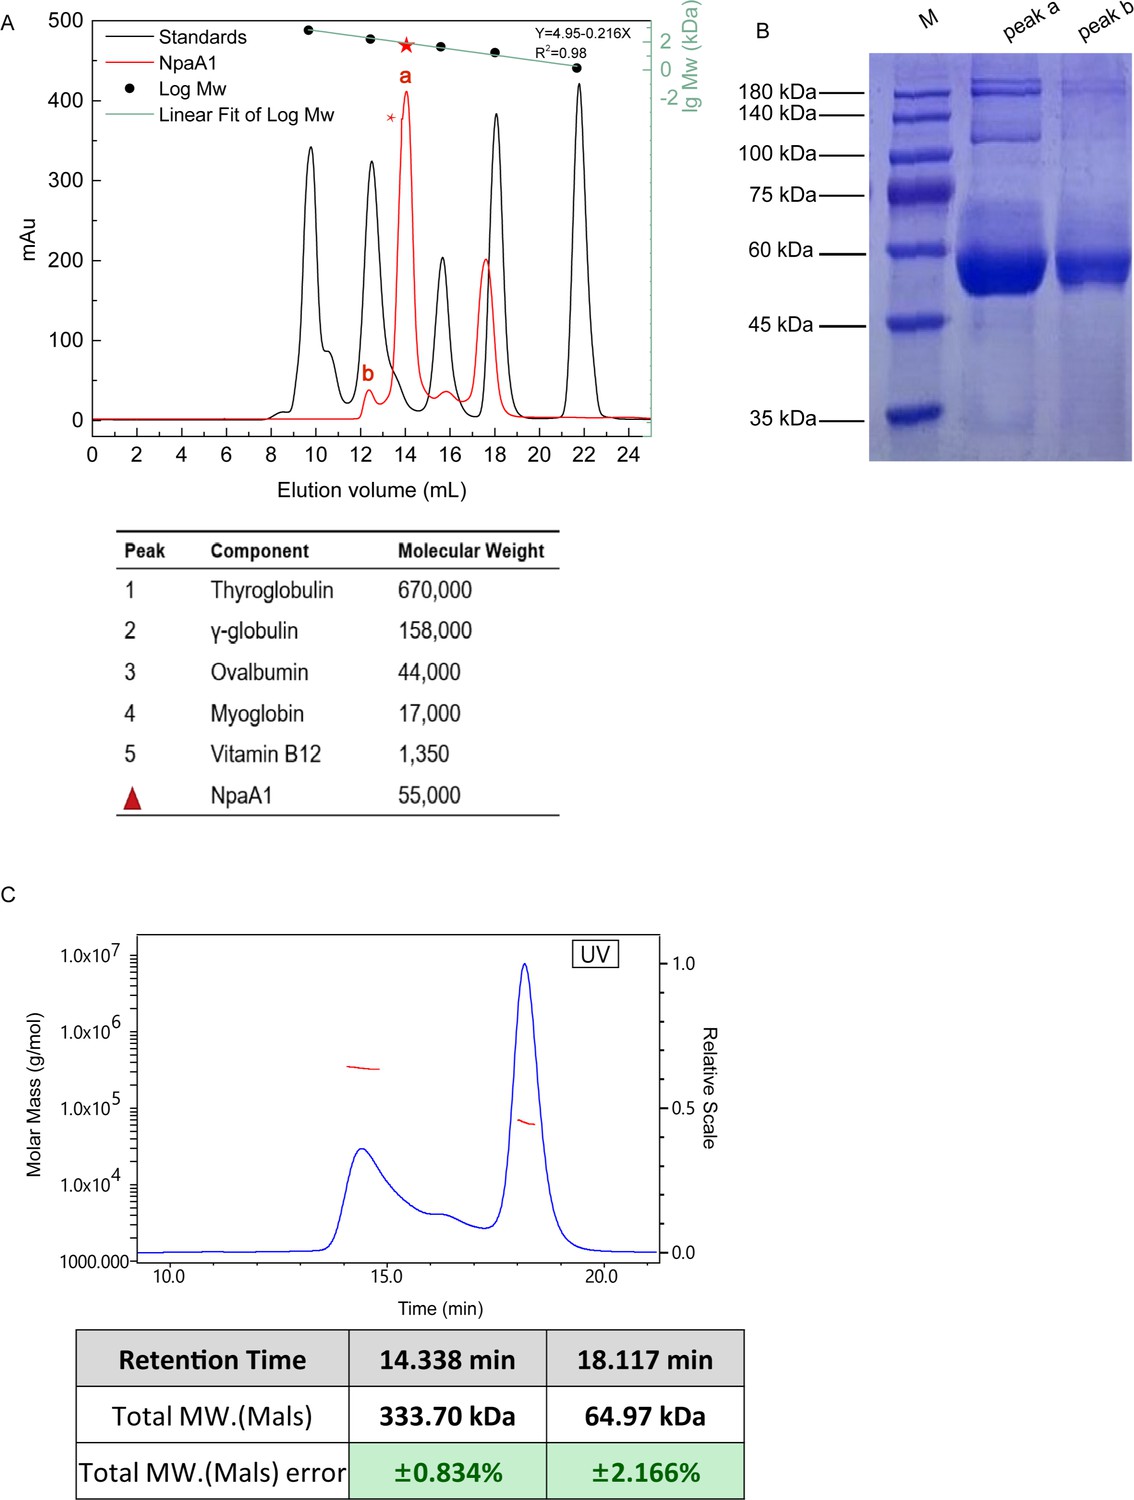
Aggregate state analysis of NpaA1.
(A) Gel filtration of NpaA1. (B) SDS-PAGE showed that peak a and peak b were both NpaA1. (C) Multi-angle light scattering (MALS) analysis of NpaA1. The molecular weight and error of each peak are counted in the table.
-
Figure 4—figure supplement 1—source data 1
Raw data for Gle filtration shown in Figure 4—figure supplement 1.
- https://cdn.elifesciences.org/articles/95555/elife-95555-fig4-figsupp1-data1-v1.zip
-
Figure 4—figure supplement 1—source data 2
Raw data for enzyme activities shown in Figure 4—figure supplement 2.
- https://cdn.elifesciences.org/articles/95555/elife-95555-fig4-figsupp1-data2-v1.zip
-
Figure 4—figure supplement 1—source data 3
Raw data for the gel shown in Figure 4—figure supplement 1.
- https://cdn.elifesciences.org/articles/95555/elife-95555-fig4-figsupp1-data3-v1.zip
Figure 4—figure supplement 2
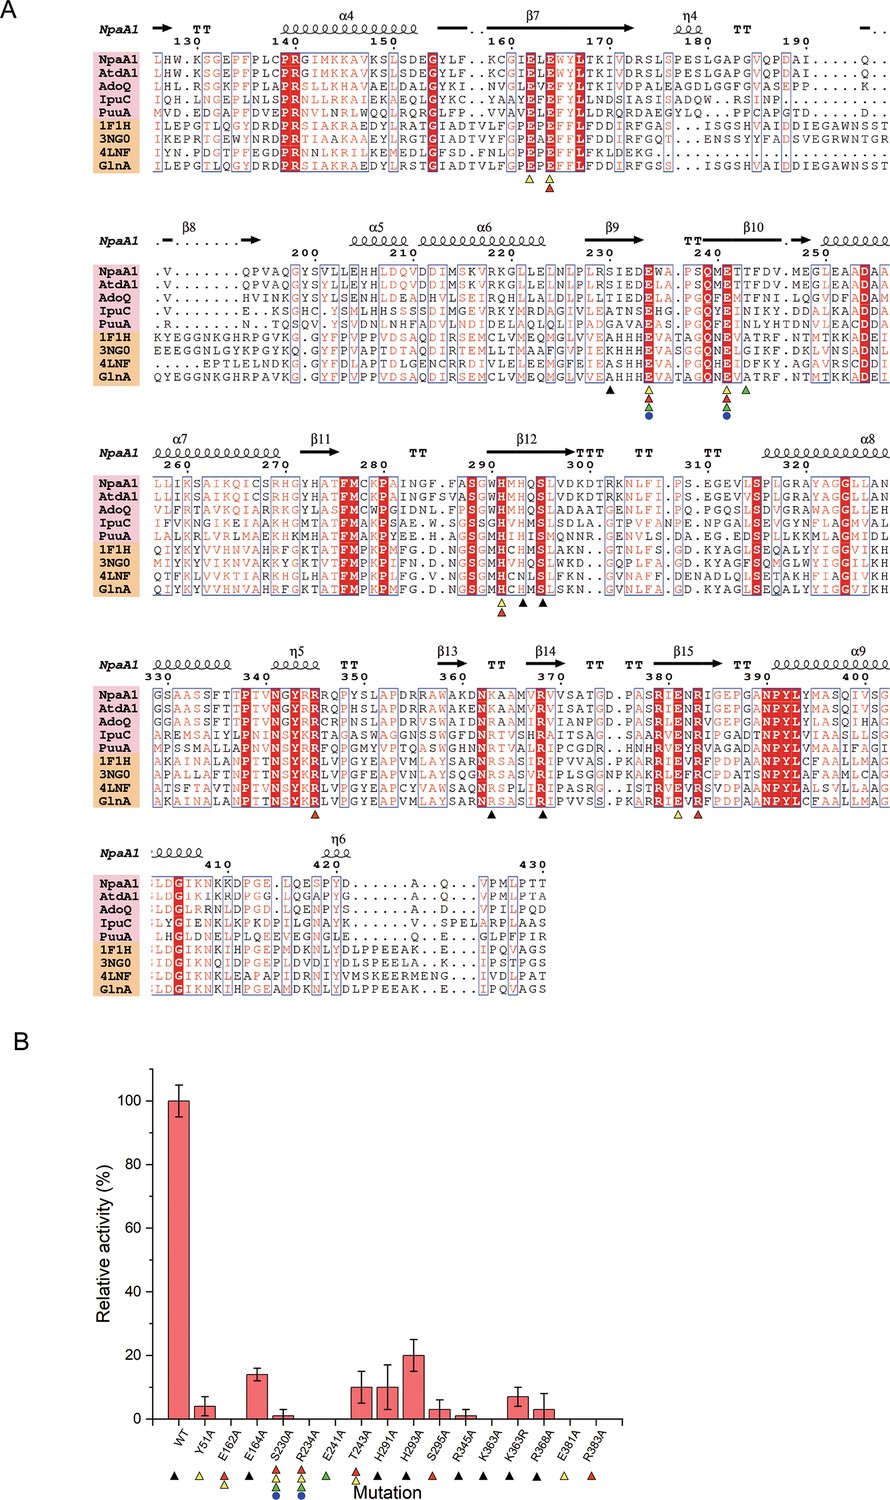
Conserved residues and mutant analysis of ligand binding sites.
(A) Sequence alignment of glutamine synthetase (GS)-like proteins (pink background) with GS proteins (yellow background). Residues involved in binding ATP, glutamate, Mg2+, and ammonium are marked with black triangles, red triangles, yellow triangles, and green triangles, respectively. (B) Mutational analysis of important residues participating in binding substrate and catalysis. Error bars represent the standard deviation of three biological replicates.
-
Figure 4—figure supplement 2—source data 1
Raw data for enzyme assay of mutants shown in Figure 4—figure supplement 2.
- https://cdn.elifesciences.org/articles/95555/elife-95555-fig4-figsupp2-data1-v1.zip
Figure 5
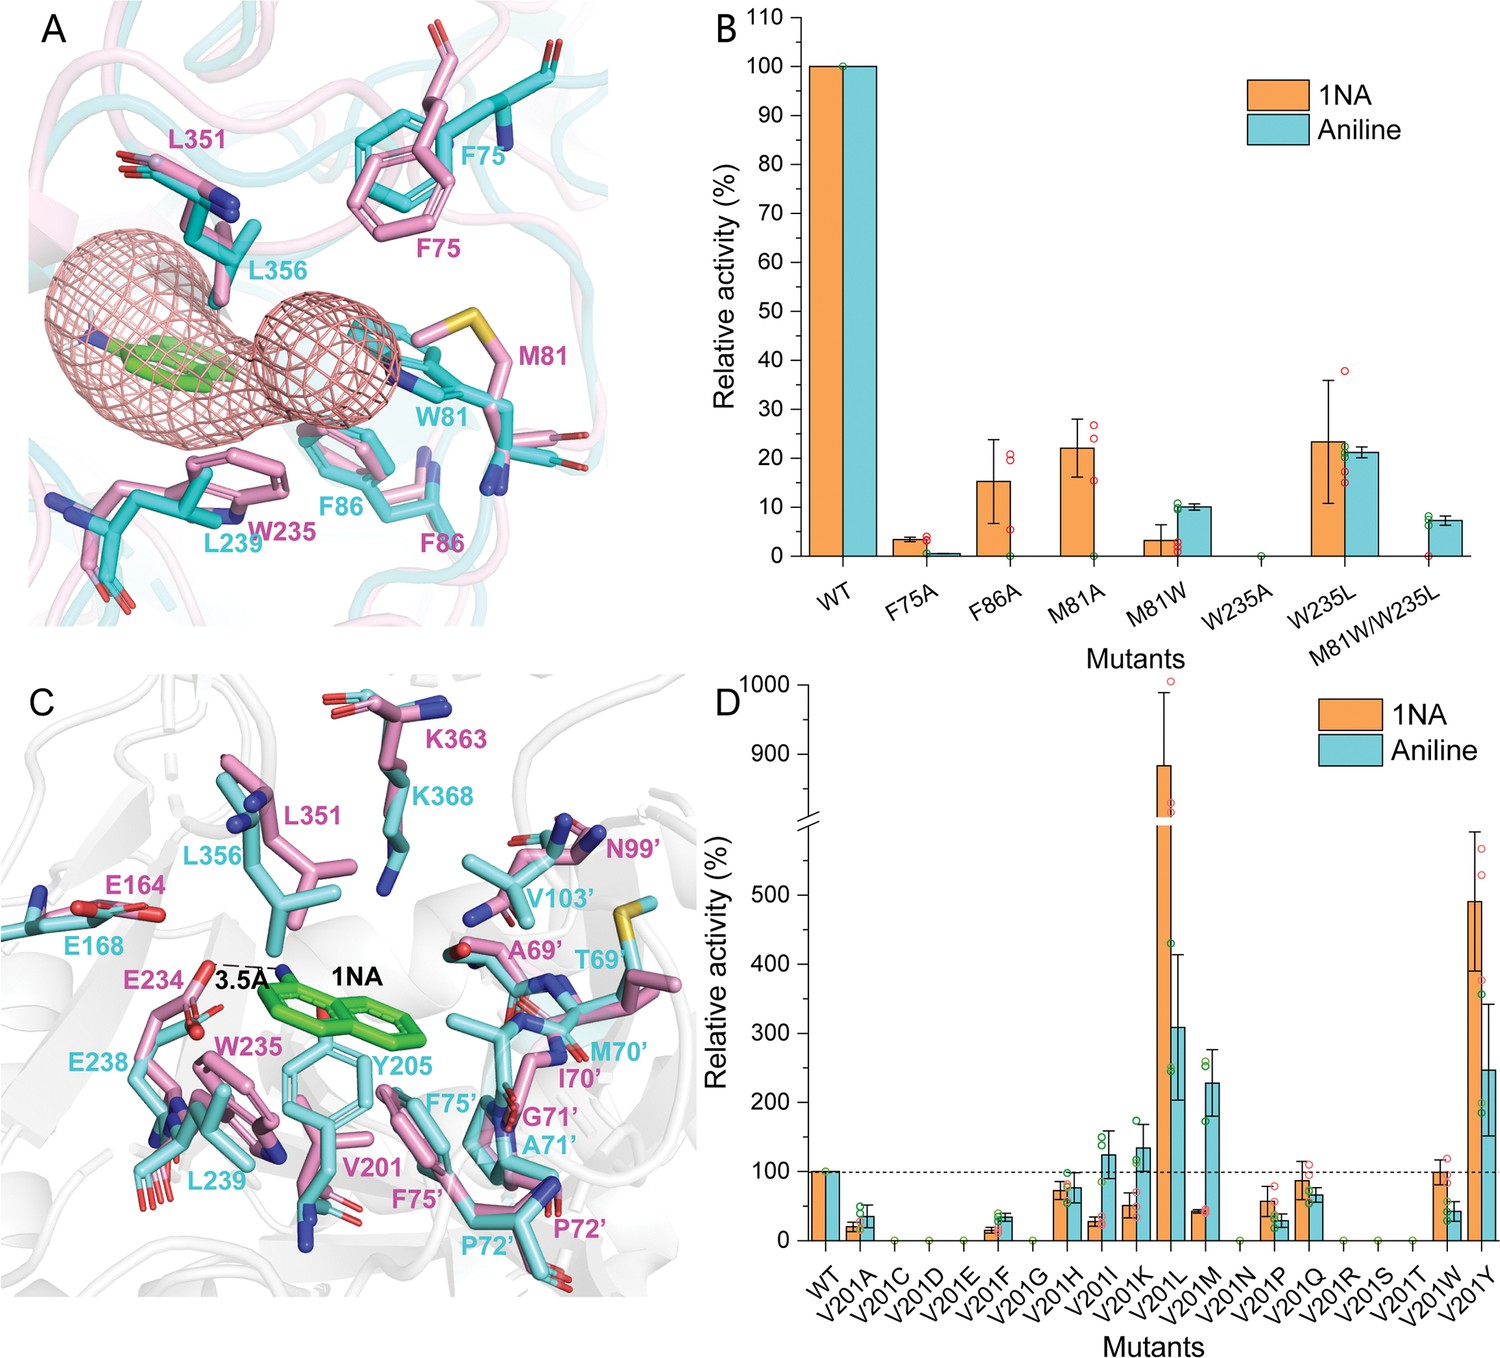
Residues involved in 1-Naphthylamine (1NA) binding.
(A) The 1NA entry tunnel was predicted by Caver 3.0 (in red). The structures of NpaA1 (in pink) and AtdA1 (in cyan) overlap, with the amino acids contributing to the formation of tunnel bottlenecks highlighted as sticks. (B) Relative activity of mutants for 1NA entry tunnel. The activity of wild-type NpaA1 for 1NA is set to 100% (21.6±1.2 U/g), and wild-type NpaA1 showed equivalent activity to 1NA and aniline. Error bars represent the standard deviation of three biological replicates. (C) The aromatic amine binding pocket of NpaA1 is superimposed on AtdA1. 1NA is green, residues for NpaA1 are pink, and residues for AtdA1 are cyan. The black dashed line represents the hydrogen bond. (D) Relative activity of saturation mutants for V201. The activity of wild-type NpaA1 for 1NA is set to 100% (20.8±0.5 U/g), and wild-type NpaA1 showed equivalent activity to 1NA and aniline. Dots represent the relative activity of the respective biological replicates (n = 3) and error bars represent the standard deviation.
-
Figure 5—source data 1
Raw data for the relative activity of mutants is shown in Figure 5.
- https://cdn.elifesciences.org/articles/95555/elife-95555-fig5-data1-v1.zip
Figure 6
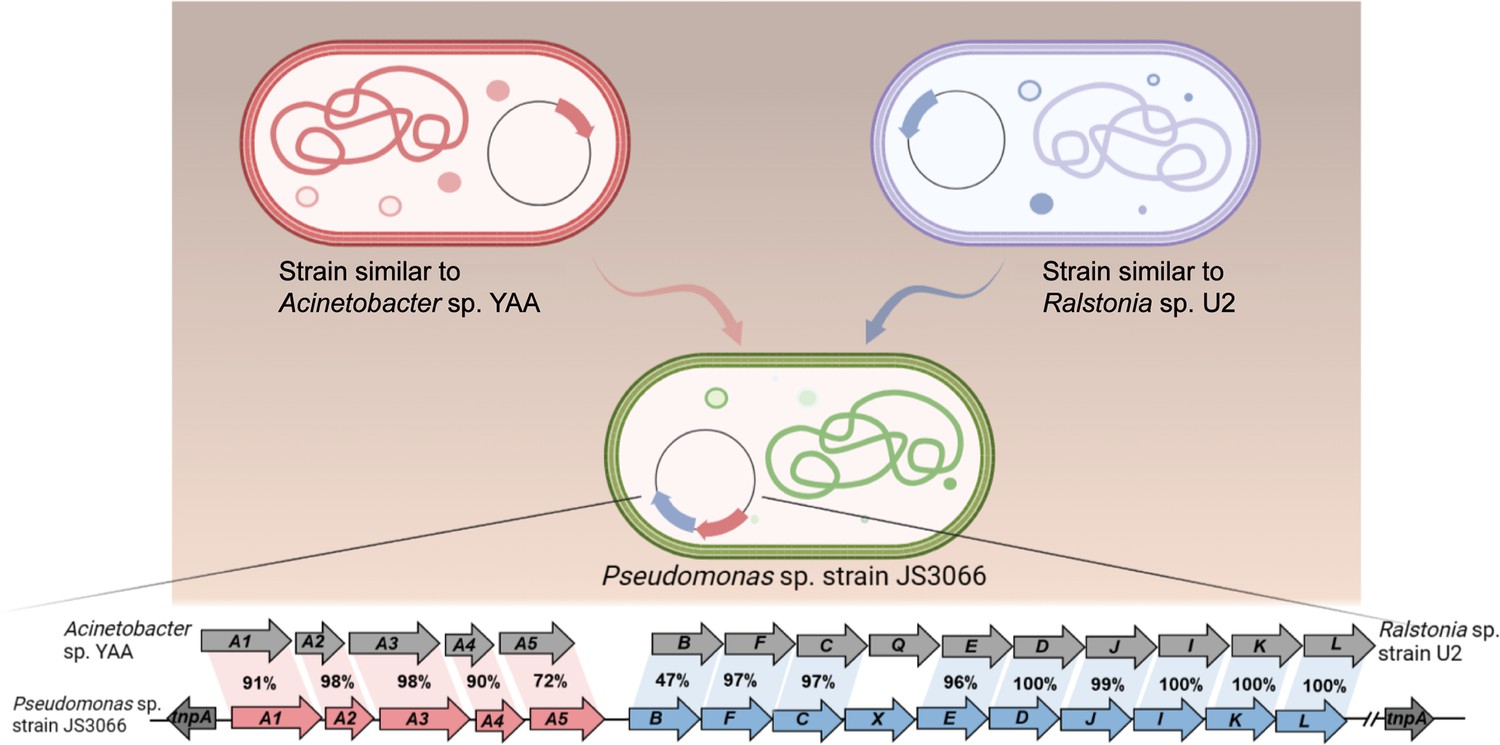
Likely sequence of horizontal gene transfer (HGT) for recruitment of genes involved in 1-Naphthylamine (1NA) degradation pathway in strain JS3066.
Tables
Table 1
Specific activities of NpaA1 and AtdA1 against different substrates.
| Substrate | NpaA1Relative activity | AtdA1Relative activity |
|---|---|---|
 | 100% | 100% |
 | 100% | 0 |
 | 76.5% | 29.4% |
 | 31.4% | 0 |
 | 23.5% | 0 |
 | 5.9% | 0 |
 | 0 | 0 |
 | 7.8% | 0 |
 | 0 | 0 |
-
The specific activities of NpaA1 (25.5±0.7 U g–1) and AtdA1 (8.5±2.1 U g–1) against aniline were defined as 100%. The results are shown as averages ± standard deviations from two or more independent measurements.
-
Table 1—source data 1
Raw data for the specific activity of NpaA1 is shown in Table 1.
- https://cdn.elifesciences.org/articles/95555/elife-95555-table1-data1-v1.zip
Additional files
-
Supplementary file 1
Identities of ORFs from gene clusters responsible for 1-Naphthylamine (1NA) degradation.
- https://cdn.elifesciences.org/articles/95555/elife-95555-supp1-v1.docx
-
Supplementary file 2
Crystallographic data collection and refinement of NpaA1 and its complex.
- https://cdn.elifesciences.org/articles/95555/elife-95555-supp2-v1.docx
-
Supplementary file 3
Strains and plasmids used in this study.
- https://cdn.elifesciences.org/articles/95555/elife-95555-supp3-v1.docx
-
Supplementary file 4
Primers used in this study.
- https://cdn.elifesciences.org/articles/95555/elife-95555-supp4-v1.docx
-
Supplementary file 5
Primers used for constructing mutant vectors.
- https://cdn.elifesciences.org/articles/95555/elife-95555-supp5-v1.docx
-
MDAR checklist
- https://cdn.elifesciences.org/articles/95555/elife-95555-mdarchecklist1-v1.pdf
Download links
A two-part list of links to download the article, or parts of the article, in various formats.
Downloads (link to download the article as PDF)
Open citations (links to open the citations from this article in various online reference manager services)
Cite this article (links to download the citations from this article in formats compatible with various reference manager tools)
Discovery of the 1-naphthylamine biodegradation pathway reveals a broad-substrate-spectrum enzyme catalyzing 1-naphthylamine glutamylation
eLife 13:e95555.
https://doi.org/10.7554/eLife.95555


